Article

Expression of G-Protein-Coupled Estrogen Receptor (GPER) in Whole Testicular Tissue and Laser-Capture Microdissected Testicular Compartments of Men with Normal and Aberrant Spermatogenesis

by
Renata Walczak-Jędrzejowska
1,*,†,
Ewa Forma
2,†,
Elżbieta Oszukowska
3,
Magdalena Bryś
2,
Katarzyna Marchlewska
1,
Krzysztof Kula
1 and
Jolanta Słowikowska-Hilczer
1
1
Department of Andrology and Reproductive Endocrinology, Medical University of Lodz, Pomorska Str. 251, 92-213 Lodz, Poland
2
Department of Cytobiochemistry, Faculty of Biology and Environmental Protection, University of Lodz, Pomorska Str. 141/143, 90-236 Lodz, Poland
3
II Clinic of Urology, Medical University of Lodz, Pabianicka Str. 62, 93-513 Lodz, Poland
*
Author to whom correspondence should be addressed.
Co-first author—these authors contributed equally to this work.
Biology 2022, 11(3), 373; https://doi.org/10.3390/biology11030373
Submission received: 9 February 2022 / Revised: 21 February 2022 / Accepted: 24 February 2022 / Published: 26 February 2022

Abstract

:

Simple Summary

Nowadays, there is no doubt that estrogens play an important role in male reproduction, affecting testicular cell differentiation, proliferation, apoptosis and metabolism. It is also widely believed that intratesticular balance of androgens and estrogens is crucial for the testicular development and function and that the increased testicular estrogen production may be associated with spermatogenic failure. There is also growing epidemiological evidence that the exposure of men to endocrine disruptors demonstrating estrogenic activity (xenoestrogens) may lead to impairment of male fertility via interference with estrogen signaling pathways. Besides the two classical nuclear estrogen receptors, the membrane-bound G protein-coupled estrogen receptor (GPER) was described in human testicular tissue. However, there are little data on its expression in testes with disturbed spermatogenesis. In this study, we investigated the GPER expression pattern in biopsies of azoospermic men with complete and aberrant spermatogenesis. Our results showed an increased expression of the GPER in testes with impaired spermatogenesis. Moreover, they indicate a possible involvement of estrogen signaling through GPER in disturbed function of Sertoli cells—the cells that support spermatogenic process.

Abstract

In this study, we retrospectively investigated GPER expression in biopsies of azoospermic men with complete (obstructive azoospermia—OA) and aberrant spermatogenesis (nonobstructive azoospermia—NOA). Each biopsy was histologically evaluated with morphometry. The testicular GPER expression was analyzed by the immunohistochemistry and RT-PCR technique in the whole testicular tissue and in seminiferous tubules and Leydig cells after laser-capture microdissection. In laser-microdissected compartments, we also analyzed transcriptional expression of selected Leydig (CYP17A1, HSD17B3, StAR) and Sertoli cell (AMH, SCF, BMP4) function markers. Immunohistochemical staining revealed expression of GPER in the cytoplasm of Leydig and Sertoli cells. Its stronger intensity was observed in Sertoli cells of NOA biopsies. The RT-PCR analysis of the GPER mRNA level unequivocally showed its increased expression in seminiferous tubules (i.e., Sertoli cells), not Leydig cells in NOA biopsies. This increased expression correlated positively with the transcriptional level of AMH—a marker of Sertoli cell immaturity, as well as FSH serum level in NOA but not in the OA group. Our results clearly demonstrate altered GPER expression in testes with primary spermatogenic impairment that might be related to Sertoli cell maturity/function.

1. Introduction

Normal male reproductive function is controlled by a complex endocrine regulation governed by the hypothalamus–pituitary–testes axis. Gonadotropins secreted by the pituitary control testicular function. Follicle stimulating hormone (FSH) controls the process of spermatogenesis, while luteinizing hormone (LH) controls the production of testosterone (T) by Leydig cells. Apart from FSH, T also, directly or by transformation to estradiol (E), supports spermatogenesis. The conversion of T to E is catalyzed by the enzyme aromatase. Classically, the localization and activity of aromatase in adult human testicular tissue had been reported in the cytoplasm of Leydig cells [1,2]. However, later studies also confirmed its expression in Sertoli, as well as germ cells [3,4].
Recent interest in the E function in testes is dictated by early observations that estradiol stimulates the number of spermatogonia [5], enhances the stimulatory effect of FSH on testicular maturation and contributes to precocious initiation of spermatogenesis [6]. These findings were further supported by other studies in which experimentally induced complete spermatogenesis was achieved by treating hypogonadal animals with E, thus extending the concept that E may have a direct or indirect stimulatory role in male gametogenesis [7,8]. In turn, E has been shown to stimulate germ cell survival in vitro in men [9]. Nowadays, there is no doubt that estrogens play an important role in male reproduction, affecting testicular cell differentiation, proliferation, apoptosis and metabolism [10]. It is also widely believed that intratesticular balance of androgens and estrogens is crucial for the testicular development and function in animals and humans and that the increased testicular E production may be associated with spermatogenic failure [10,11,12,13,14]. In agreement with the hypothesis of testicular dysgenetic syndrome (TDS), there is also growing epidemiological evidence that exposure of men to endocrine disruptors with estrogenic activity (xenoestrogens) during fetal, neonatal or adult life may impair male fertility via interference with the E signaling pathway [15,16,17].
Infertility is a problem that affects approximately 15% of couples, and the male factor is believed to contribute alone or in combination with female factor to about 50% of the cases [18]. Male infertility may result from anatomical or genetic abnormalities, endocrine disorders or systemic diseases, infections, trauma, iatrogenic injury or gonadotoxins [19,20], but the precise etiology of some of the cases remains unclear. One of the most severe conditions is the primary testicular failure, which results in non-obstructive azoospermia. In such cases, structural features, such as decreased seminiferous tubule diameters and both increased tubular membrane thickness and the number of Leydig cell in clusters forming micronodules, are frequently observed [21,22,23]. It is also well documented that apart from structural features, the deregulation of Sertoli and Leydig cell function, as evidenced by changes in hormones, proteins, enzymes, cell factors or receptors expression, was also reported in gonads of men with disturbed spermatogenesis [24,25,26,27,28,29].
There is also a large subset of studies revealing that men with primary spermatogenic impairment, besides compensatory increase in FSH secretion, may present decreased serum T levels, or normal T with slightly elevated LH, indicating a dysfunction of Leydig cells and normal-high level of E or elevated E/T ratio [22,30]. It was shown that the increased expression and/or activity of testicular aromatase may be responsible for increased intratesticular concentration of E accompanied by an augmented ratio of E/T in testes and serum of infertile men [4,24,30,31].
Estrogens exert their autocrine/paracrine action through two nuclear estrogen receptors (ERs): estrogen receptor 1 (ESR1) and estrogen receptor 2 (ESR2), which activate genomic signaling. It is now evident that the small pool of those receptors (approximately 5–10%) is also localized in the cell membrane and thus also mediates non-genomic signaling [10,32,33]. The ERs are widely distributed among different cells in both testicular compartments (seminiferous tubules and intertubular spaces) in different species, including human. Much data, often contradictory, have demonstrated their presence in somatic testicular cells (Leydig and/or Sertoli), as well as in germ cells [10,34,35,36,37,38]. In order to obtain conclusive results, the authors of one recently published study on cellular localization of ERs in human testes, used a combination of Western blotting, laser-capture-assisted cell picking, quantitative and qualitative RT-PCR and in situ hybridization, in addition to immunostaining. They concluded that ESR1 is present in germ cells and faintly in single Leydig cells, while ESR2 is found in germ cells and Sertoli cells [39]. In addition to ERs, a non-classical membrane-associated G-protein-coupled estrogen receptor (GPER), which mediates predominantly rapid non-genomic signaling of estrogens (mainly E), was discovered in several tissues, including testis [40]. Experimental studies on mice and rats have clearly confirmed that GPER signaling is involved in the regulation of germ and Sertoli cell proliferation and apoptosis [41,42,43], as well as Sertoli and Leydig cell function [44,45]. Additionally, GPER expression was also observed in a different region of rat’s epididymis, and its role in sperm maturation and storage was suggested [46]. In humans, there is a large subset of studies revealing a role of this receptor in pathogenesis and transformation of testicular tumors [47]. For example, it was shown that GPER is overexpressed in seminomas and may contribute to estrogen-dependent cancer cell proliferation [48]. However, there are little data on its role in the pathogenesis of male infertility.
Until today, the analysis of GPER expression in men was limited mainly to testes with normal spermatogenesis [39,49,50]. In normal adult human testes, GPER was reported in the cytoplasm of somatic Sertoli and Leydig cells [39,49,50]. Some studies also reported its expression in spermatogenic cells (i.e., spermatogonia and spermatocytes) [49,50]. There are single data regarding GPER expression in human testicular tissues with impaired spermatogenesis. Bernardino et al. [51] reported that GPER mRNA abundance was higher in adult men with Klinefelter syndrome compared to control men, while the expression of ESR1 was unchanged and ESR2 was decreased. The authors suggested that GPER may play a role in the etiology of testicular abnormalities in this syndrome.
In this study, we address the question of whether the GPER expression pattern differs in biopsies with complete and aberrant spermatogenesis and how it is related to selected histological parameters and hormonal status of azoospermic men. To answer this question, an analysis of GPER mRNA expression was performed on the whole testicular tissue sample and the laser-microdissected testicular compartments, i.e., seminiferous tubule and Leydig cell clusters. As the primary testicular failure results in Sertoli and Leydig cells deregulation, we additionally analyzed gene transcripts of function markers of these cells in laser-microdissected compartments in relation to GPER mRNA expression. We selected the markers that might be potentially regulated by estrogen signaling.

2. Materials and Methods

The study protocol was approved by the Bioethics Committee of the Medical University of Lodz (No. RNN/14/15/KE of 15 January, 2015). Due to its retrospective design and no anticipated effect on the prognosis or therapeutic management of the subjects whose tissue samples were included, informed consent was not obtained, and such a requirement was waived under the study protocol.

2.1. Characteristic of the Study Group

Testicular tissues embedded in paraffin blocks collected in the Department of Andrology and Reproductive Endocrinology of the Medical University of Lodz were used in this retrospective study. Testicular open biopsies were taken from 72 infertile men diagnosed with azoospermia during the period 2010–2014 as part of their medical diagnostic workup.
Data from medical histories concerning information on diseases that might influence fertility, testicular volume of the biopsied testis measured by ultrasound and serum hormone concentrations prior to testicular biopsy, were available. Hormonal measurements had been performed in one laboratory setting. Serum concentrations of FSH, LH, total testosterone (T) and total estradiol (E) were determined using enhanced chemiluminescence method for VITROS Immunodiagnostic System utilizing commercially available VITROS Reagent Packs for hormones, according to the manufacturer’s instruction (Ortho-Clinical Diagnostics Johnson and Johnson, New Brunswick, NJ, USA). Intra- and inter-assay coefficients of variations (CV) for measurements of FSH were <2.8% and <10.6%; for LH, they were <8.8% and <12.8%; for T, <3.8% and <7.4%; and for E, <6.6% and <8.8%, respectively. Additionally, T/LH and E/T ratios were calculated.
The subjects were aged 23 to 41 years. They were not diagnosed with hypogonadotropic hypogonadism, chronic diseases, Klinefelter syndrome, microdeletions of AZF regions of Y chromosome or hormonally treated.

2.2. Histological Analysis

All testicular biopsies were handled at the histological laboratory of the Department of Andrology and Reproductive Endocrinology, Medical University of Lodz. Testicular tissue samples were fixed in GR fixative (200 mL 37% formaldehyde, 40 mL acetic acid added to 1 L of 0.05 M, phosphate buffer, pH 7.4) [52], embedded in paraffin, and 5 μm thick serial sections were stained with hematoxylin and eosin.
A histological analysis included a qualitative evaluation of seminiferous epithelium in 25 tubules of each testis with its subsequent quantitative analysis, according to the modified Johnsen score (JS) [53,54]. Next, the biopsies were classified into two groups: (1) obstructive azoospermia (OA)—biopsies with complete spermatogenesis (CS), which served as a control group (JS ≥ 8 points), and (2) non-obstructive azoospermia (NOA)—biopsies with a different pattern of spermatogenic failure, i.e., maturation arrest (ARR) and a mixed pattern (MIX) of disturbed spermatogenesis (JS < 8 points), as well as Sertoli cell-only syndrome (SCOS)—(JS ≤ 2 points) (Table 1). Additionally, biopsies included in the OA group were obtained from subjects with normal hormonal status (FSH 1–7 IU/mL, LH 1–8 mIU/mL, T 7–28 nmol/L, E up to 220 pmol/L).
A histological evaluation of biopsies, i.e., morphometric measurements of the tubule and semi-quantitative assessment of Leydig cells number, was performed with a light microscope (Eclipse E600; Nikon, Yokohama, Kawagawa, Japan) equipped with the image analysis system (NIS-Elements AR Ver. 3.2 Nikon, Japan). The slides were viewed and documented at 100×, 200× or 400× magnification (objective lens 10×) depending on the performed evaluation.
The measurements of seminiferous tubules diameter (STD) and the thickness of tubular membrane (TM) were performed in at least 25 circular-shaped tubules. The following values were considered abnormal: <150 µm for STD and >10 µm for TM, based on data from previous studies [55,56].
A semi-quantitative assessment of the Leydig cells number was performed by a scoring system created by Guminska et al. [21,57] according to the number of Leydig cells observed in a particular intertubular space (IS):
  • 0 Leydig cells—0 points
  • 1–5 Leydig cells—1 point
  • 6–10 Leydig cells—2 points
  • 11–30 Leydig cells—3 points
  • >30 Leydig cells (nodules of Leydig cells)—4 points
Leydig cells were recognized by their morphological features and location in the interstitial tissue. The morphological features include: (1) the eccentric, regular round or oval nucleus, usually with one or two prominent nucleoli; (2) the nucleus surrounded by abundant eosinophilic cytoplasm. The cells are usually located adjacent to the seminiferous tubules or near blood vessels (Supplementary Materials, Figure S1). In each biopsy specimen, all available triangular IS (no less than 50) were evaluated, and the mean number of points was calculated. A Leydig cells score (LC-score) > 2 points was considered abnormal.

2.3. Procedure of Tissue Sections Preparation for RNA Extraction

Extraction of mRNA was performed on whole testicular tissue sections from 72 biopsies. Additionally, we also performed mRNA extraction from the specific testicular compartments, i.e., seminiferous tubules and Leydig cell clusters. To achieve this, we used laser-capture microdissection (LCM) method with utilization of MMI CellCut/SmartCut system (Olympus/Molecular Machines & Industries, Eching, Germany).
All procedures of tissue preparation were performed under RNase-free conditions by using RNaseZap (Thermo Fisher Scientific, Waltham, MA, USA) for equipment cleaning, and backed glassware and sterilized water treated with diethyl pyrocarbonate (DEPC) (Sigma Chemical Co., St. Louis, MO, USA) for specimen handling. Testicular tissues from paraffin blocks were cut into 10 µm thick sections adjacent to the sections used for histology and immunohistochemistry using a rotary microtome (Leica RM2155, Leica Microsystems, Deerfield, IL, USA) with a fresh disposable blade for each specimen.
For RNA extraction from the whole testicular tissue, after cutting, at least 4 sections were immediately carefully transferred into sterile RNase-free tubes (Thermo Fisher Scientific, Waltham, MA, USA) for further analysis (the day after). For RNA extraction from the laser-microdissected seminiferous tubules or Leydig cell clusters, the serial sections (at least 3–4) were carefully floated out on a warm DEPC-treated water bath (46 °C) and then mounted on RNase-free membrane slides (Molecular Machines &Industries, Glatsbrugg, Switzerland). To collect a similar tissue area of seminiferous tubules, as well as Leydig cell cluster (i.e., ~1 mm2), 4 to 8 membrane slides were prepared for each biopsy depending on the size of testicular section. Directly before the application of the LCM method, the membrane slides were incubated at 56 °C for 1 h, then deparaffinized and stained with hematoxylin and eosin using MMI SafeStain ampoules (H&E Staining Kit—PN 70302; Molecular Machines & Industries, Glatsbrugg, Switzerland) according to the manufacturer’s instructions. To add stabilization and secure the sections from contamination, a regular RNase-free microscopic slide was placed under the membrane slide. The seminiferous tubules or Leydig cell clusters from one membrane slide were cut within no longer than 1 h at room temperature under a 100× or 200× or 400× magnification (depending on the size of cut material) and collected to separate laser-microdissection tubes (500 µL) with adhesive lid (Molecular Machines & Industries Glatbrugg, Switzerland). Each LCM was preceded by optimization of laser power and spot distance to provide an effective dissection of marked areas. Usually, the laser setup was as follows: cut velocity or speed, between 10–15 µm/s; laser focus, 67–72; laser power, 72–90. The gaps in the tissue visually confirmed the success of the selected area capture after lid removal (Supplementary Materials, Figure S2). After microdissection, the collected seminiferous tubules or Leydig cell clusters were immediately dissolved in 150 μL buffer PKD from the RNeasy FFPE Kit (QIAGEN, Hilden, Germany) and stored at −80 °C until RNA extraction procedure.

2.4. RNA Extraction and RT-PCR

RNA extraction from the whole testicular tissue sections was performed using a RNeasy FFPE Kit (QIAGEN, Hilden, Germany) according to the manufacturer’s instructions. Before RNA isolation, the whole paraffin-embedded testicular sections were deparaffinized with xylene and then washed in ethanol to remove residual xylene from the sample. Deparaffinized blocks were immediately resuspended in 240 µL buffer PKD from the RNeasy FFPE Kit (QIAGEN, Hilden, Germany). To continue RNA extraction from LCM testicular compartments, tissue lysates from 4–5 caps of a single biopsy were pooled together. RNA concentration and purity were measured by absorbance through a BioPhotometer Plus UV/Vis Reader (Eppendorf, Hamburg, Germany). First-strand cDNAs were obtained by reverse transcription of 1 μg of total RNA, using a Maxima First Strand cDNA Synthesis Kit for RT-qPCR (ThermoFisher Scientific, Waltham, MA, USA) following the manufacturer’s protocol.
Analysis of gene expression at the mRNA level was performed using TaqMan® Gene Expression Assays (ThermoFisher Scientific, Waltham, MA, USA) according to the manufacturer’s instructions. The RPS29 (ribosomal protein S29) gene was used as an internal control [58]. TaqMan® Gene Expression Assays used in the study are presented in Table 2.
PCR reactions were performed in a 10 µL volume that included 5 µL of 2× TaqMan Universal PCR MasterMix (ThermoFisher Scientific, Waltham, MA, USA), 3.5 µL nuclease-free water (Sigma Aldrich, Munich, Germany), 1 µL cDNA template (50 ng) and 0.5 µL of the TaqMan® Gene Expression Assay (ThermoFisher Scientific, Waltham, MA, USA). The RT-qPCR reaction was carried out using the Mastercycler ep realplex (Eppendorf, Hamburg, Germany). Relative RNA quantification was performed using the ΔCt method. ΔCt (Ct targeted gene—RPS29) values were recalculated into relative copy number values (number of target gene mRNA copies per 1000 copies of RPS29 mRNA).
Possible cross-contamination of laser-microdissected Leydig cell cluster and somniferous tubules with adjacent cell types was also investigated. The transcriptional expressions of (1) FSH receptor (FSHR), which is exclusively expressed in Sertoli cells (assay code: Hs00174865_m1), (2) chymase (CMA1), specific to mast cells (assay code: Hs00156558_m1), (3) EGF-like module receptor 1 (EMR1), specific to macrophages (assay code: Hs00892591_m1) were quantified in laser-microdissected Leydig cell clusters [24]. The presence of 17α-hydroxylase/17,20-lyase (CYP17A1), specific to Leydig cells, was investigated in laser-microdissected seminiferous tubules [24]. In both compartments, the mRNA of α smooth muscle actin (ACTA2, assay code: Hs00426835_g1) was evaluated to analyze its cross-contamination with peritubular cells of the seminiferous tubular wall.

2.5. Immunohistochemical Expression of GPER

Immunohistochemical staining was performed on 5 µm thick sections. Prior to incubation with the primary antibody, testicular sections were deparaffinized and rehydrated using routine procedures, as described in our previous reports [55,57]. Antigen retrieval was accomplished by microwaving the sections in 10 nM citrate buffer (pH 6.0) at 750 W for 20 min. After cooling, to avoid non-specific staining, the sections were incubated with 3% hydrogen peroxidase for 10 min with successive incubation with blocking solution for 20 min (ImmPRESS peroxidase polymer detection kit, Vector Laboratories, Burlingame, CA, USA). Then, the slides were incubated overnight at 4 °C with primary antibodies against GPER (rabbit polyclonal, cat. no: orb85722, Biorbyt Ltd., Cambridge, UK; dilution: 1:100). The antibody was diluted with TBS. After incubation with the primary antibody, the reaction was further developed using commercially available visualization systems (ImmPRESS peroxidase polymer detection kit). Immunoreactivity was visualized by using diaminobenzidine chromogen (DAB) (Vector Laboratories, USA). Washing in TBS was performed between each step, except blocking solution and primary antibody. Finally, testis sections were counterstained with hematoxylin. In negative control sections, the primary antibody was omitted.
To quantify the intensity of immunohistochemical reaction in Leydig cells and in the tubules, we utilized the semi-quantitative method that was widely used in different types of tissues, including testes [59,60,61]. At least 10–15 Leydig cell clusters and 10–15 images of seminiferous tubules, in one representative biopsy slide [4], were captured under 40× objective lens, using a digital microscope camera (DS-Fi1C, Nikon), mounted on an optical microscope (Eclipse 600, Nikon, Japan) under the same light parameters and exposure time. Image processing and analyses were performed using the public domain ImageJ software (National Institute of Health, Bethesda, MD, USA, https://imagej.nih.gov/ij/download.html (accessed on 25 May 2021)). The intensity of GPER staining was expressed as a relative optical density (ROD) and was calculated using the formula described by Smolen [62]: ROD = ODspecimen/ODbackground = log (GLblank/GLspecimen)/log (log GLblank/GLbackground), where GL is the gray level for the stained area (specimen) and the unstained area (background), and blank is the gray level measured after removing the slide from the light path.

2.6. Statistical Analysis

The Statistica 13.1 software (StatSoft), licensed by the Medical University of Lodz, Poland, was used for statistical analysis. The Shapiro–Wilk test was applied to test the normality of obtained data. Due to a non-normal distribution of the majority of variables, non-parametric statistics were used. Medians and interquartile ranges (25th–75th percentiles) were used for descriptive data. The non-parametric Mann–Whitney U-test was used to evaluate the differences between groups. Spearman’s’s rank correlation coefficient (r) was used to evaluate correlations among continuous variables. A p value below 0.05 was considered statistically significant.

3. Results

3.1. Subjects and Histological Evaluation

Among 72 testicular biopsies, 19 presented complete spermatogenesis (CS), 25 presented an ARR/MIX pattern (n = 8 ARR and n = 17 MIX), and the remaining 28 presented tubules with SCOS. All the biopsies with disturbed spermatogenesis were included in one NOA group (n = 53). There were six ARR types at the spermatocyte and two at the round spermatid stage. Representative photomicrographs from biopsies with different histological patterns are presented in Figure 1.
Among subjects with disturbed spermatogenesis, a history of cryptorchidism that was operated on during childhood was common (25%; 13/53), but in the remaining 40 cases, no serious andrological disturbances were noted.
Data concerning clinical parameters and histological evaluation are presented in Table 3. There was no difference in age between subjects from the studied groups. In the group with impaired spermatogenesis (NOA), the testicular volume, as well as seminiferous tubule diameter (STD), were significantly lower than those in the OA group, while the thickness of tubular membrane (TM) was significantly higher. Abnormal STD (<150 µm) was present in 38% (20/53) of biopsies of NOA (56% of SCOS and 16% in ARR/MIX), while abnormal TM (>10 µm) was present in 28% (14/53) (40% of SCOS and 12% in ARR/MIX). With regard to the OA group, STD and TM values appeared to be normal in all biopsies.
The LC-score was significantly higher in NOA when compared to that of OA. The LC-score value above 2, which is considered abnormal, was observed in 23/53 (43%) in NOA biopsies (46% of SCOS and 44% of ARR/MIX). An abnormal LC-score was not observed in the OA group.

3.2. Hormonal Profile

The serum hormonal profile of the subjects from the studied groups is shown in Table 4. Compared with OA, the majority of subjects with impaired spermatogenesis demonstrated significantly elevated FSH and LH levels. Although serum T concentrations were within the normal ranges in the NOA group and did not differ significantly from OA, the T/LH ratio was significantly decreased. The serum E level, as well as the E/T ratio, did not differ between the groups. To better characterize our subjects, we also investigated the relationship between the markers of spermatogenic damage (FSH and testicular volume) and Leydig cell function (T/LH ratio, LC-score). Considering all subjects, the T/LH ratio correlated negatively with the LC-score (r = −0.499, p < 0.001) and FSH level (r = −0.528, p < 0.001), and positively with the testicular volume (r = 0.323, p = 0.006). In addition, the LC-score correlated positively with FSH levels (r = 0.4293, p < 0.001) and negatively with the testicular volume (r = −0.487, p < 0.001).

3.3. Expression of GPER

3.3.1. Expression of GPER mRNA in the Whole Testicular Tissue

The mRNA expression of GPER in the whole testicular tissue was detectable in all studied samples and significantly increased by 1.2-fold in the NOA group (median, range: 564.3; 203.1–953.9 in OA vs. 697.4; 372.2–1594.7 in NOA, p = 0.0353) (Figure 2).
When we analyzed a total group of subjects with impaired spermatogenesis (NOA), we observed a significant positive correlation between the GPER transcriptional expression and LC-score (rs = 0.291 p = 0.0346), and FSH levels (rs = 0.289 p = 0.0484). However, these correlations were not found in the control group. We also did not observe any significant correlation between the GPER transcriptional expression and the other hormone concentrations and histological parameters in both groups (Table 5).

3.3.2. Expression of GPER mRNA in Laser-Microdissected Testicular Compartments

A seminiferous tubule laser microdissection (ST-LCM) was performed in 43 out of 72 biopsies: 27 from NOA (16-SCOS and 11-MIX/ARR) and 15 from OA (NOA-ST and OA-ST subgroups, respectively). A laser microdissection of Leydig cell clusters (LC-LCM) was performed in 27 out of 72 biopsies: 14 from NOA (7-SCOS and 7-MIX/ARR) and 13 from OA (NOA-LC and OA-LC subgroups, respectively). Data concerning clinical parameters, histological evaluation and serum hormonal levels of ST-LCM and LC-LCM subgroups are presented in Supplementary Materials (Tables S1–S4). We also performed a quantitative analysis of Sertoli cells number in biopsies subjected to seminiferous tubule laser microdissection. We did not observe differences between the number of Sertoli cells in OA-ST and NOA-ST (Supplementary Materials, Figure S3).
mRNA expression of GPER in seminiferous tubule compartment and Leydig cell clusters was detectable in all studied samples from OA and NOA biopsies. We observed a significant, 3-fold increase in the studied transcript in seminiferous tubule compartment of the NOA-ST group in comparison with OA-ST (median, range: 7.5, 1.26–28.0 in OA-ST vs. 22.9, 4.6–58.4 in NOA-ST, p = 0.0000). There was no difference in GPER gene transcript expression between studied groups in the Leydig cells compartment (median, range: 15.8, 7.3–23.5 in OA-LC vs. 15.8, 8.3–39.6 in NOA-LC, p = 0.4582) (Figure 3).
Similarly to results obtained from the whole testicular tissue, GPER mRNA expression in laser-microdissected seminiferous tubules in NOA-ST correlated positively with FSH (rs = 0.627, p = 0.0008), but additionally also with LH (rs = 0.534, p = 0.0059) and negatively with the T/LH ratio (rs = −0.435, p = 0.0296). We did not find significant correlations in OA-ST for the analyzed parameters (Table 6). Additionally, the GPER mRNA expression from laser-microdissected Leydig cell cluster did not correlate with clinical parameters, parameters of histological evaluation or hormone levels in the studied subgroups (Table 7).
An analysis of contamination with other cell types of our laser-microdissected compartments (i.e., seminiferous tubules and Leydig cell clusters) revealed marginal expression of mRNA corresponding to genes strongly and specifically expressed in cell types of seminiferous tubules and interstitium. The mean transcriptional expression of the Sertoli cell marker (FSHR) was very low in laser-microdissected Leydig cell clusters compared with the expression observed in laser-microdissected seminiferous tubules with complete spermatogenesis (Supplementary Materials, Figure S4a). The latter were barely contaminated with CYP17A1 expression in comparison with its expression in laser-microdissected Leydig cell clusters (Supplementary Materials, Figure S5a). Additionally, laser-microdissected Leydig cell clusters demonstrated weak or no transcriptional expression of EMR1 (macrophage marker), CMA1 (mast cell marker) and ACTA2 (peritubular cell marker); their mean expression was comparable to that of FSHR (Supplementary Materials, Figure S4b). Similarly, the level of ACTA2 in laser-microdissected seminiferous tubules was marginal and comparable to the one observed for CYP17A1 (Supplementary Materials, Figure S5b).

3.3.3. Immunohistochemical Expression and Cellular Localization of GPER

The staining GPER pattern was cytoplasmic and typical of seven-transmembrane receptors [63]. The color reaction was predominantly observed in the cytoplasm of Leydig and Sertoli cells (Figure 4). The used antibody against synthetic peptide derived between 261–365 amino acids of human GPER rendered the same staining pattern as another antibody, which recognizes epitope mapped against the third extracellular domain of the protein [49].
A semi-quantification of immunostaining intensity in Leydig cells and seminiferous tubules (i.e., Sertoli cells) was performed in a comparable number of clusters and tubules in each biopsy. The mean relative optical density of color reaction in Leydig cells did not differ between the groups and was increased in Sertoli cells in the NOA group (Table 8).
The mean ROD of color reaction in Leydig and Sertoli cells in LCM subgroups are presented in Table 9. Similarly to results obtained for the OA and NOA groups, we did not observe differences in intensity of immunostaining in Leydig cells between OA-LC and NOA-LC subgroups, while there was an increase in the ROD value in Sertoli cells from NOA-ST in comparison with OA-ST.
We observed a significant positive correlation between the results of GPER expression at transcriptional and protein levels in both laser-microdissected testicular compartments. GPER mRNA expression in laser-microdissected seminiferous tubules correlated positively with ROD of Sertoli cells in both subgroups (rs = 0.583, p = 0.0347 in OA-ST; rs = 0.502, p = 0.0146 in NOA-ST). Similarly, GPER mRNA expression in laser-microdissected Leydig cell clusters correlated positively with ROD of Leydig cells in both subgroups (rs = 0.577, p = 0.0494 in OA-LC; rs = 0.614, p = 0.0254 in NOA-LC).

3.4. Quantification of Sertoli and Leydig Cell Function Markers mRNA Transcripts in Laser-Microdissected Testicular Compartments

3.4.1. AMH, BMP4, SCF mRNA Transcripts in Laser-Microdissected Seminiferous Tubules

mRNA expressions of Sertoli cell function markers in seminiferous tubule compartment were detectable in all studied samples from OA-ST and NOA-ST biopsies. The mRNA expression of AMH in laser-microdissected seminiferous tubules was significantly increased (mean ± SEM: 7.6 ± 2.0 in OA vs. 17.7 ± 2.1 in NOA, p = 0.0073), while BMP4 was significantly decreased (mean ± SEM: 4.4 ± 0.7 in OA-ST vs. 2.5 ± 0.5 in NOA-ST, p = 0.0273) in the NOA-ST subgroup when compared with the OA-ST subgroup. We did not observe differences in SCF mRNA expression between the analyzed subgroups (mean ± SEM: 7.7 ± 1.4 in OA-ST vs. 6.0 ± 1.1 in NOA-ST, p = 0.3136) (Figure 5).
An analysis of correlations revealed a significant positive correlation between the GPER and AMH transcriptional expression in laser-microdissected seminiferous tubules in NOA-ST, but not in the OA-ST subgroup. No other correlations were observed between transcriptional expression of Sertoli cell markers and GPER in both groups (Table 10).
Similarly to GPER transcriptional expression, the AMH mRNA expression correlated positively with the FSH level in NOA-ST, but not in the OA-ST subgroup (rs = 0.562, p = 0.0052 in NOA-ST; rs = 0.166, p = 0.5872 in OA-ST). No significant correlation was observed between AMH transcripts and other hormone levels (data not shown).

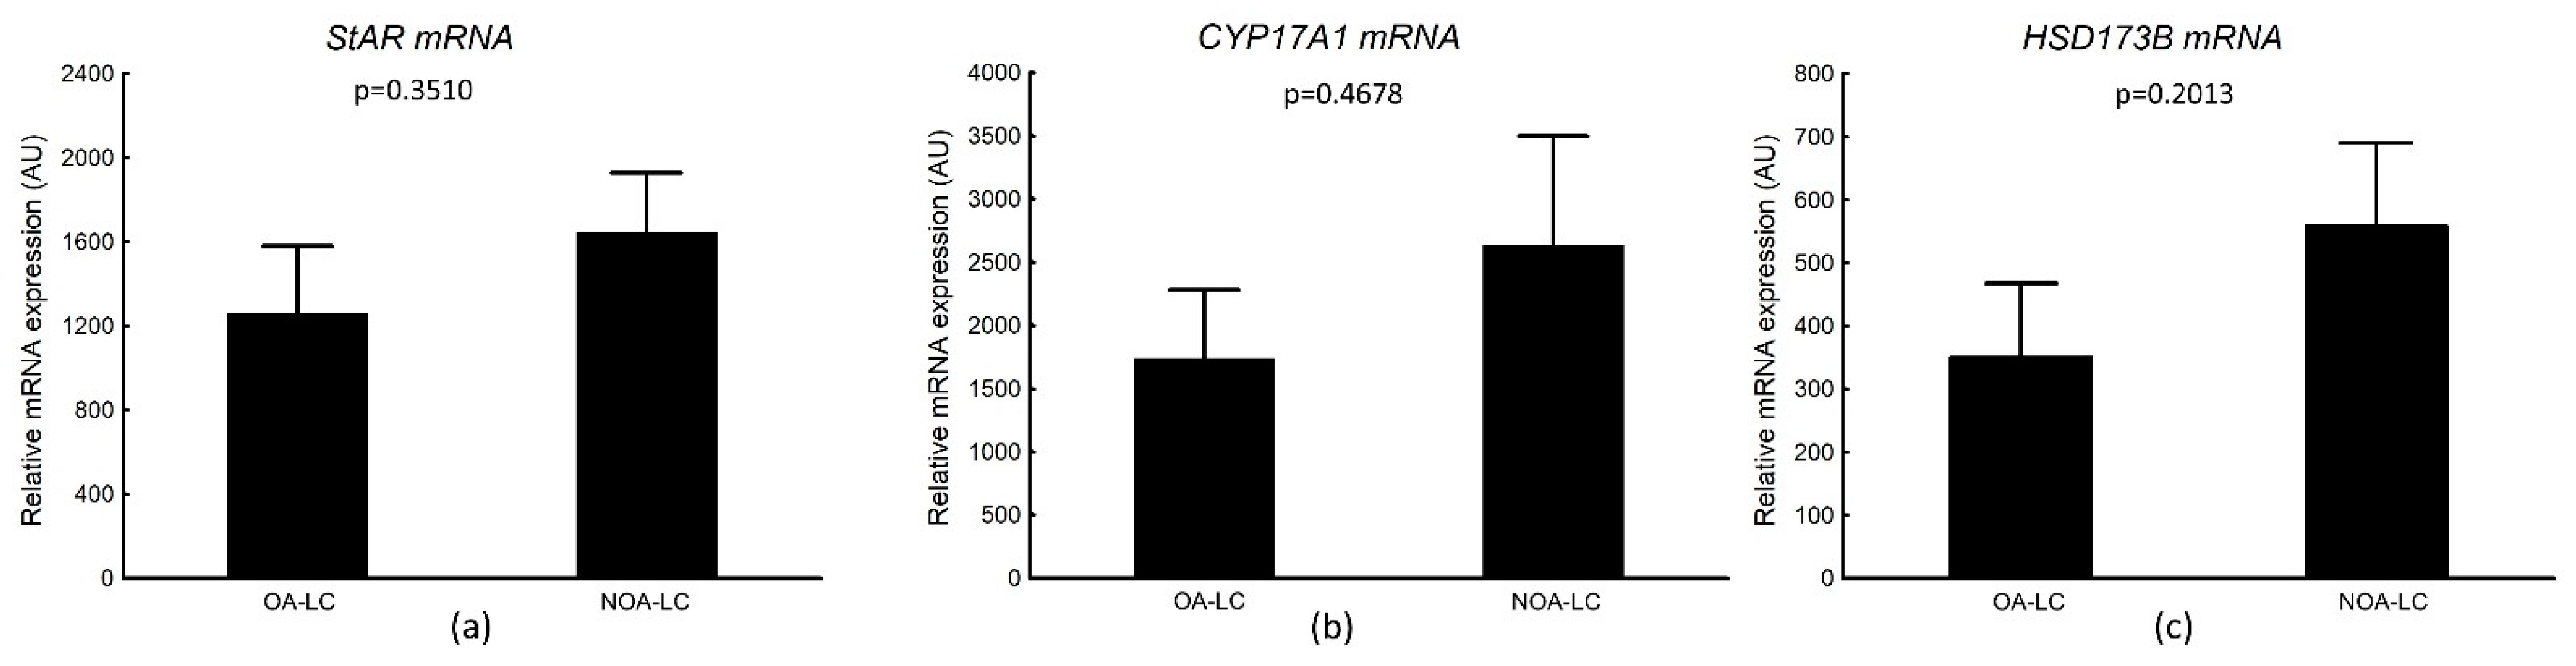
3.4.2. StAR, CYP17A1, HSD173B mRNA Transcripts in Laser-Microdissected Leydig Cells

The mRNA expressions of StAR, CYP17A1, HSD173B in Leydig cell clusters were detectable in all studied samples from OA and NOA biopsies. The mRNA expression of Leydig cell markers was not different in the analyzed subgroups (mean ± SEM: 1261.2 ± 319.3 in OA vs. 1645.0 ± 282.5 in NOA for StAR, p = 0.3510; 1862.6 ± 582.6 in OA vs. 2635.6 ± 864.6 in NOA for CYP17A1, p = 0.4678; 352.2 ± 115.6 in OA vs. 513.6 ± 132.9 in NOA for HSD173B, p = 0.2013) (Figure 6). We also did not observe any correlations between transcriptional expression of Leydig cell markers and GPER in both subgroups (Table 11). However, a correlation between CYP17A1 and GPER mRNA was close to reaching statistical significance (p = 0.0529).

4. Discussion

To the best of our knowledge, this is the first study, which analyzed the GPER expression in a relatively large number of testicular biopsies of infertile men with primary spermatogenic failure. The strength of our study is the fact that the analysis of GPER mRNA expression was performed not only in the whole testicular tissue sample but also in laser-capture microdissected testicular compartments, i.e., separately in seminiferous tubules and Leydig cell clusters. It enabled us to reveal more accurately the alterations in GPER transcriptional expression in both studied compartments.
Available clinical data on the subjects from whom archival testicular biopsies were used for our study reveal that the majority of those with NOA clearly demonstrated testicular impairment, manifested by elevated FSH and LH concentrations [64,65]. A poor function of Leydig cells is accompanied by a decreased T/LH ratio, which in turn results from compensated elevation of LH [21,30,65]. No differences were observed in T and E levels. Although some earlier studies reported an elevation of E in the blood serum of infertile men [30,66], other studies did not confirm this observation [4,21,65]. This may be due to an extensive overlap in hormone levels between fertile and infertile men [30]. Additionally, the selection criteria (seminological vs. histological), as well as the type of control group (seminal normozoospermia vs. obstructive azoospermia with complete spermatogenesis), may also contribute to these differences [30,65,66]. Moreover, it was shown that men with primary spermatogenic impairment demonstrated an increased intratesticular E level, although no differences in its serum concentration could be detected [4].
Our results on GPER immunolocalization in somatic cells of testes with complete spermatogenesis (i.e., Sertoli and Leydig cells) correspond to those of a study by Rago et al. [49] and Fietz et al. [39]. However, some other studies also reported its presence in all germ cells [67] or diploid germ cells [50] or exclusively in peritubular cells [68]. The observed discrepancies may partly result from using different antibodies but may also be due to tissue fixation, an antigen retrieval method, as well as a detection method that may impact the accessibility of the antibody to the cell compartments, and subsequent visualization of the antigen as GPER was shown to reside in membranes of intracellular organelles, nucleus or plasma membranes [69,70].
Elevated mean GPER mRNA expression in the biopsies with disturbed spermatogenesis, obtained from men with NOA, is the main finding of this study. The application of the laser-capture microdissection technique and the analysis of the GPER transcriptional level in separate testicular compartments allowed us to unequivocally demonstrate altered overexpression of GPER mRNA in Sertoli, not in Leydig cells. Results obtained at the transcriptional level were also further confirmed at the protein level with utilization of immunohistochemical method. The semi-quantification of immunostaining intensity showed that the mean relative optical density of GPER protein was increased in Sertoli, not in Leydig cells, in NOA biopsies in comparison with the control group. Thus, we may assume that the elevation of the mean GPER mRNA expression in the whole testicular tissue sample from NOA biopsies results from both: (1) its increased expression in Sertoli cells, and (2) an increased size of Leydig cell clusters. This was further confirmed by an analysis of correlation between GPER expression and both hormone levels and features of histological evaluation. We observed positive correlations between GPER mRNA expression and LC-score in the whole testicular tissue sample, as well as FSH levels in the whole testicular tissue sample, as well as in laser-microdissected seminiferous tubule compartment. An increased size of Leydig cell clusters is a histological feature, commonly found in biopsies with impaired spermatogenesis in which a dysfunction of Leydig cells often occurs [23,65]. On the other hand, an elevated serum FSH level is a hormonal marker indicative of spermatogenic impairment and disturbed Sertoli cells function [71]. We cannot exclude GPER expression in other testicular cells using immunohistochemistry due to application of different primary antibodies and fixation methods. However, the close correlation between the intensity of immunohistochemical staining and GPER mRNA expression in testicular compartments suggests that the majority of GPER was localized in Sertoli, as well as in Leydig cells, without any post-transcriptional modification. To the best of our knowledge, only one study, apart from ours, analyzed GPER expression in testes with primary testicular failure. In accordance with our results obtained for the whole testicular sample, Brenardino et al. [51] have shown that GPER mRNA expression in testes of patients with Klinefelter syndrome was 12-fold higher in comparison with control men, which was confirmed at the protein level by a Western blot analysis. Unfortunately, the authors did not visualize the receptor in testicular tissue sections. However, a typical testicular histological picture of the majority of men with this genetic syndrome is well known to present tubules with Sertoli cells alone and extensive Leydig cell hyperplasia [72]. In our study, increased GPER mRNA expression was less pronounced than in patients with Klinefelter syndrome. However, this difference may be partly explained by the fact that endocrinological and histological abnormalities in our NOA patients might be milder compared to those observed in patients with Klinefelter syndrome [73,74]. What is interesting is the fact that overexpression of GPER receptors was also frequently reported in testicular tumors, and in seminomas, it was correlated with ERS2 downregulation. This inverse receptor expression pattern could reflect a switch in estrogen responsiveness [67,75].
A physiological role of GPER in the Sertoli cell function is well established in immature animals. It was suggested that GPER activation in these cells modulates the mechanism involved in the maintenance of their number [44,76]. However, we have no or little knowledge of its role in human Sertoli cells. In our study, we further investigated a relation between transcriptional expression of GPER and selected Sertoli cell markers in laser-microdissected seminiferous tubules. We analyzed the expression of AMH—one of the markers of Sertoli cell immaturity [28,77]—as well as BMP4 and SCF, them being factors involved in germ cell differentiation, proliferation and survival [78]. SCF is a cytokine essential for spermatogenesis, and in testes, it is exclusively produced by Sertoli cells [79]. Animal studies showed that SCF is involved in gametogenesis by promoting mouse spermatogonia to differentiate into meiotic spermatocytes and round spermatids [80,81]. Moreover, its expression was increased under estrogen stimulation in rat seminiferous tubule cultured ex vivo [82]. BMP4 is a growth factor that stimulates mouse stem cells to form progenitor spermatogonia and progenitors to express Kit—the receptor for SCF. SCF drives the final steps in differentiation of spermatogonia into type B spermatogonia [83,84]. In our study, we observed decreased expression of BMP4 and no change in SCF mRNA level in seminiferous tubules with impaired spermatogenesis in comparison with those characterized with complete spermatogenesis, which corresponds to previous studies [85,86]. However, we did not find any correlation between transcriptional expression of GPER and SCF or BMP4.
The opposite results were observed for AMH, whose transcriptional level was increased in seminiferous tubule of NOA subgroup and correlated positively with GPER mRNA expression, as well as FSH serum levels. AMH is a hormone produced exclusively by Sertoli cells, and its main, well-recognized physiological role is the regression of Müllerian ducts in early fetal stages of males. Its production at high levels is sustained until puberty and then, along with Sertoli cell maturation, it declines during transition into adulthood. The low serum levels of AMH are characteristic for adult men. During the prepubertal period, AMH production is stimulated by FSH through the cAMP signaling pathway and the recruitment of transcriptional factors to AMH gene promoter [87]. In contrast, the physiological downregulation of AMH production results from androgen receptor activation and increased level of intratesticular androgen production in mature Sertoli cells [88,89]. Recently, a direct negative effect of androgens on the transcriptional activity of the AMH promoter has been shown in mice [90,91]. It is well documented that in a subset of testes with primary testicular failure with various histological patterns and etiology (including Klinefelter syndrome), an increased expression of AMH at testicular level is observed [28,77,92,93]. This altered expression of AMH in the adult seminiferous epithelium is regarded as a sign of either maintaining or regaining undifferentiated immature features of Sertoli cells [28,77]. Additionally, a few studies indicate that NOA men with impaired spermatogenesis demonstrate altered, diminished expression of androgen receptors in testes [25,29], Due to the retrospective design of our study, we could not obtain results of serum AMH concentration, which are not routinely conducted in diagnostic workup of men with infertility. However, one of the latest studies revealed that elevated serum AMH levels, in some men with NOA, are indicative of more severe primary testicular failure. Together with the AMH/T ratio, the AMH level served as an independent predictor of sperm retrieval from the testis [94]. Moreover, the very recent study has demonstrated that E upregulates AMH expression by increasing the activity of the hAMH promoter in the prepubertal Sertoli cell line SMAT1 (devoid of androgen receptor) and that this estrogen signaling might be mediated by ESR1, as well as GPER [95]. Expression of ESR1 in Sertoli cells of adult men with preserved and impaired spermatogenesis is controversial in comparison to GPER and ESR2 expression [39]. Thus, GPER together with ESR2 seem to be the main estrogen receptors in this cell type. It should be determined whether the observed changes in GPER expression in the present study, similarly to AMH expression, are a marker of the Sertoli cells maturational state or whether they are involved in the pathogenesis of observed disturbances. In this context, a possible mutual dependence between a disturbed function of Sertoli cells caused by their immaturity (increased AMH expression), hormonal imbalance (high FSH levels) and abnormal GPER expression in testes with spermatogenic impairment requires investigations in future research.
There is a number of studies reporting that GPER signaling might be involved in steroidogenesis regulation by E in animal and human Leydig cells [45,96]. It was shown that the activation of GPER lowers T levels in isolated Leydig cells of adult rat and human testicular tissue, with a statistically and clinically significant decrease in T production [45]. Another study also reported that aromatase overexpression in Leydig cells of some patients with primary gonadal failure, which elevates intratesticular E levels, may result in disturbed androgen biosynthesis, thereby accounting for Leydig cell dysfunction [24]. Another animal and in vitro study has demonstrated that GPER influences Leydig cell morphology and function in C57BL/6 mice and in MA-10 Leydig tumor cell line [96], while treatment of mice with GPER antagonist deregulated molecules controlling steroidogenesis (StAR, TSPO, PLIN) [97]. Recently, a link between adipokines and aromatase levels and/or signaling interactions has been observed in human Leydig cell tumors, which may suggest that increased aromatase expression may be a cause and consequence of Leydig cell tumor progression and/or initiation [98]. Thus, estrogen signaling through GPER might be considered a mechanism regulating E-dependent steroidogenesis in humans and animals. However, in the present study, we did not observe any differences in GPER mRNA transcripts expression in laser-microdissected Leydig cell clusters between the studied subgroups. The same observation was noted for mRNA expression of the analyzed Leydig cell markers, namely, StAR protein involved in cholesterol transport into inner mitochondrial membrane, and two steroidogenic enzymes: CYP17A1 and HSD17B3. The enzymes are considered crucial for progression of the steroidogenic pathway. CYP17A catalyzes the conversion of pregnenolone to 17-OH pregnenolone and then to dehydroepiandrosterone (Δ5 pathway) or the conversion of progesterone to 17-OH progesterone and next to androstenedione (Δ4 pathway), while HSD17B3 catalyzes the conversion of androstenedione to testosterone [99]. Additionally, we did not observe any correlations between mRNA of GPER and Leydig cell function markers, although a correlation between GPER and CYP17A1 transcripts expression was close to reaching statistical significance. Contrary to our results, Lardone et al. [27] showed that, in Leydig cell clusters obtained by laser-capture microdissection from men with SCOS and signs of Leydig cell dysfunction (i.e., T/LH ratio below 2.0), mRNA expression of CYP17A1 was significantly increased in comparison to men with SCOS and without signs of Leydig cell dysfunction (i.e., T/LH above 2.0). Moreover, a positive correlation was observed between CYP17A1 mRNA expression and intratesticular estrogen levels. Similarly, overexpression of HSD17B1 and StAR protein was observed in testes of men with Klinefelter syndrome, suggesting overactivation of the hormones’ biosynthetic pathway in Leydig cells [100]. The fact that our group of men was more heterogenous than the group selected in a study by Lardone et al. [27] and the group of men with Klinefelter syndrome might be a reason for discrepancies between those studies and our results [100].

5. Conclusions

This study is the first one to report increased expression of GPER in testicular tissue of men with primary testicular failure. An application of the laser-capture microdissection technique and the analysis of GPER transcriptional level in separate testicular compartments allowed us to unequivocally demonstrate altered overexpression of GPER mRNA in Sertoli, but not in Leydig cells, which was confirmed at the protein level. Furthermore, we also showed that this increased GPER expression in Sertoli cells was related to elevated FSH levels, as well as increased expression of AMH transcripts. Whether the observed change in GPER expression in the present study is a marker of Sertoli cells maturational state, or whether it is involved in the pathogenesis of observed disturbances, needs to be further elucidated.

Supplementary Materials

The following supporting information can be downloaded at: https://www.mdpi.com/article/10.3390/biology11030373/s1, Figure S1: (a) Representative microphotograph of hematoxylin-eosin-stained histological sections of testicular biopsy from men with complete spermatogenesis from OA group; notice single Leydig cell (sL) near blood vessel (BV) and Leydig cell cluster (L-c, arrowheads) adjacent to seminiferous tubule (T); magnification 200×, scale bar = 50 µm (b) higher magnification of the testicular area surrounded by the dash lines in (a); Leydig cell cluster (L-c, arrowheads) adjacent to seminiferous tubule; notice the morphological features of Leydig cell: the eccentric, regular round or oval nucleus, usually with one or two prominent nucleoli and abundant eosinophilic cytoplasm (c); in the cytoplasm, the Reinke’s crystals are present (asterisk); (b)—magnification 400×, scale bar = 25 µm. Figure S2: Microphotographs of testicular tissue before and after laser-capture microdissection (LCM). (a) Seminiferous tubule (arrow) before and (b) after LCM; (c) Leydig cell clusters (arrowheads) before and (d) after LCM. Magnification (a,b)—200×; (c,d)—400×. Figure S3: (a) Number of Sertoli cells per seminiferous tubules in OA-ST and NOA-ST; data presented as mean± SEM; (b) microphotograph of testicular tissue with complete spermatogenesis; notice Sertoli cell nuclei (red asterisk) with extensive cytoplasm; magnification 600×, scale bar = 20 µm. Figure S4: Analysis of contamination with other cellular types in laser-microdissected Leydig cell clusters. (a) Transcriptional levels of follicle stimulating hormone receptor (FSHR) in microdissected seminiferous tubules with complete spermatogenesis (FSHR-ST) and Leydig cell clusters (FSHR-LC); (b) transcriptional levels of EGF-like module receptor 1 (EMR1), chymase (CMA1) and α smooth muscle actin (ACTA2) in laser-microdissected Leydig cell clusters (LC). AU—arbitrary units (relative quantification normalized to the reference gene RPS29 using the ΔCt method). Data are presented as mean± SEM. Figure S5: Analysis of contamination with other cellular types in laser-microdissected seminiferous tubules. (a) Transcriptional levels of 17α-hydroxylase/17,20-lyase (CYP17A1) in laser-capture microdissected Leydig cell clusters (CYP17A1-LC) and seminiferous tubules with complete spermatogenesis (CYP17A1-ST); (b) transcriptional levels of α smooth muscle actin (ACTA2) in laser-microdissected seminiferous tubules (ST). AU—arbitrary units (relative quantification normalized to the reference gene RPS29 using the ΔCt method). Data are presented as mean± SEM. Table S1: Clinical parameters and results of histological evaluation in the subgroups of men whose biopsies were subjected to seminiferous tubule (ST) laser microdissection. Table S2: Clinical parameters and results of histological evaluation in the subgroups of men whose biopsies were subjected to Leydig cell clusters (LC) laser microdissection. Table S3: Serum hormonal profile in the subgroups of men whose biopsies were subjected to seminiferous tubule (ST) laser microdissection technique. Table S4: Serum hormonal profile in the subgroups of men whose biopsies were subjected to Leydig cell cluster (LC) laser microdissection technique.

Author Contributions

Conceptualization, K.K., J.S.-H., M.B. and R.W.-J.; formal analysis, R.W.-J. and E.F.; investigation, R.W.-J., E.O. and E.F.; resources, K.K., J.S.-H. and E.O.; data curation, R.W.-J.; writing—original draft preparation, R.W.-J. and E.F.; writing—review and editing, J.S.-H., M.B., K.K. and K.M.; supervision, J.S.-H. and K.K.; project administration, K.K.; funding acquisition, K.K. All authors have read and agreed to the published version of the manuscript.

Funding

This research was funded by the National Science Centre, Poland (Grant No. 2014/13/B/NZ4/01198) and by the Medical University of Lodz (Statute No. 503/1-089/503-11-001-19-00).

Institutional Review Board Statement

The study protocol was approved by the Bioethics Committee of the Medical University of Lodz (No. RNN/14/15/KE of 15 January 2015).

Informed Consent Statement

Patient consent was waived due to the retrospective design of the study, and no effect on the prognosis or therapeutic management of the subjects whose tissue samples were included was anticipated.

Data Availability Statement

The data presented in this study are available upon request from the corresponding author.

Acknowledgments

We thank Daria Adamczewska and Bogusława Cyniak for their valuable help in performing immunohistochemical staining of the tissue sections. The laser-capture microdissection of testicular tissue was performed using MMI CellCut/MMI SmartCut system (Olympus Molecular Machines & Industries) in Department of Growth and Reproduction, Rigshospitalet (Copenhagen, Denmark) by R.W.-J. and E.O. We are grateful to Anne Jørgensen and Ewa Rajpert-De Meyts for their valuable advice during this part of the study, and Anders Juul, Head of the Department, for giving us the opportunity to use the equipment. The authors would also like thank Dorota Wawrzyniak from the Foreign Language Center of the Medical University of Lodz, for proofreading this article.

Conflicts of Interest

The authors declare no conflict of interest.

References

  1. Payne, A.H.; Perkins, L.M.; Georgiou, M.; Quinn, P.G. Intratesticular site of aromatase activity and possible function of testicular estradiol. Steroids 1987, 50, 435–448. [Google Scholar] [CrossRef] [Green Version]
  2. Brodie, A.; Inkster, S.; Yue, W. Aromatase expression in the human male. Mol. Cell. Endocrinol. 2001, 178, 23–28. [Google Scholar] [CrossRef]
  3. Lambard, S.; Galeraud-Denis, I.; Saunders, P.T.; Carreau, S. Human immature germ cells and ejaculated spermatozoa contain aromatase and oestrogen receptors. J. Mol. Endocrinol. 2004, 32, 279–289. [Google Scholar] [CrossRef] [PubMed] [Green Version]
  4. Lardone, M.C.; Castillo, P.; Valdevenito, R.; Ebensperger, M.; Ronco, A.M.; Pommer, R.; Piottante, A.; Castro, A. P450-aromatase activity and expression in human testicular tissues with severe spermatogenic failure. Int. J. Androl. 2010, 33, 650–660. [Google Scholar] [CrossRef] [PubMed]
  5. Kula, K. Induction of precocious maturation of spermatogenesis in infant rats by human menopausal gonadotropin and inhibition by simultaneous administration of gonadotropins and testosterone. Endocrinology 1988, 122, 34–39. [Google Scholar] [CrossRef] [PubMed]
  6. Kula, K.; Walczak-Jedrzejowska, R.; Slowikowska-Hilczer, J.; Oszukowska, E. Estradiol enhances the stimulatory effect of fsh on testicular maturation and contributes to precocious initiation of spermatogenesis. Mol. Cell. Endocrinol. 2001, 178, 89–97. [Google Scholar] [CrossRef]
  7. Ebling, F.J.; Brooks, A.N.; Cronin, A.S.; Ford, H.; Kerr, J.B. Estrogenic induction of spermatogenesis in the hypogonadal mouse. Endocrinology 2000, 141, 2861–2869. [Google Scholar] [CrossRef] [PubMed]
  8. Baines, H.; Nwagwu, M.O.; Hastie, G.R.; Wiles, R.A.; Mayhew, T.M.; Ebling, F.J. Effects of estradiol and fsh on maturation of the testis in the hypogonadal (hpg) mouse. Reprod. Biol. Endocrinol. 2008, 6, 4. [Google Scholar] [CrossRef] [Green Version]
  9. Pentikainen, V.; Erkkila, K.; Suomalainen, L.; Parvinen, M.; Dunkel, L. Estradiol acts as a germ cell survival factor in the human testis in vitro. J. Clin. Endocrinol. Metab. 2000, 85, 2057–2067. [Google Scholar] [CrossRef] [PubMed]
  10. Dostalova, P.; Zatecka, E.; Dvorakova-Hortova, K. Of oestrogens and sperm: A review of the roles of oestrogens and oestrogen receptors in male reproduction. Int. J. Mol. Sci. 2017, 18, 904. [Google Scholar] [CrossRef] [Green Version]
  11. Haverfield, J.T.; Ham, S.; Brown, K.A.; Simpson, E.R.; Meachem, S.J. Teasing out the role of aromatase in the healthy and diseased testis. Spermatogenesis 2011, 1, 240–249. [Google Scholar] [CrossRef] [Green Version]
  12. Cooke, P.S.; Nanjappa, M.K.; Ko, C.; Prins, G.S.; Hess, R.A. Estrogens in male physiology. Physiol. Rev. 2017, 97, 995–1043. [Google Scholar] [CrossRef]
  13. Walczak-Jedrzejowska, R.; Marchlewska, K.; Oszukowska, E.; Filipiak, E.; Slowikowska-Hilczer, J.; Kula, K. Estradiol and testosterone inhibit rat seminiferous tubule development in a hormone-specific way. Reprod. Biol. 2013, 13, 243–250. [Google Scholar] [CrossRef] [PubMed]
  14. Misiakiewicz-Has, K.; Pilutin, A.; Wiszniewska, B. Influence of hormonal imbalance on the integrity of seminiferous epithelium in the testes of adult rats chronically exposed to letrozole and rats exposed to soya isoflavones during the prenatal period, lactation, and up to sexual maturity. Reprod. Biol. 2021, 21, 100562. [Google Scholar] [CrossRef]
  15. Juul, A.; Almstrup, K.; Andersson, A.M.; Jensen, T.K.; Jorgensen, N.; Main, K.M.; Rajpert-De Meyts, E.; Toppari, J.; Skakkebaek, N.E. Possible fetal determinants of male infertility. Nat. Rev. Endocrinol. 2014, 10, 553–562. [Google Scholar] [CrossRef] [PubMed]
  16. Sharpe, R.M.; Skakkebaek, N.E. Testicular dysgenesis syndrome: Mechanistic insights and potential new downstream effects. Fertil. Steril. 2008, 89, e33–e38. [Google Scholar] [CrossRef] [PubMed]
  17. Amir, S.; Shah, S.T.A.; Mamoulakis, C.; Docea, A.O.; Kalantzi, O.I.; Zachariou, A.; Calina, D.; Carvalho, F.; Sofikitis, N.; Makrigiannakis, A.; et al. Endocrine disruptors acting on estrogen and androgen pathways cause reproductive disorders through multiple mechanisms: A review. Int. J. Environ. Res. Public Health 2021, 18, 1464. [Google Scholar] [CrossRef] [PubMed]
  18. Jungwirth, A.; Giwercman, A.; Tournaye, H.; Diemer, T.; Kopa, Z.; Dohle, G.; Krausz, C.; EAU Working Group on Male Infertility. European association of urology guidelines on male infertility: The 2012 update. Eur. Urol. 2012, 62, 324–332. [Google Scholar] [CrossRef] [PubMed]
  19. Krausz, C. Male infertility: Pathogenesis and clinical diagnosis. Best Pract. Res. Clin. Endocrinol. Metab. 2011, 25, 271–285. [Google Scholar] [CrossRef] [PubMed]
  20. Cioppi, F.; Rosta, V.; Krausz, C. Genetics of azoospermia. Int. J. Mol. Sci. 2021, 22, 3264. [Google Scholar] [CrossRef] [PubMed]
  21. Adamczewska, D.; Slowikowska-Hilczer, J.; Marchlewska, K.; Walczak-Jedrzejowska, R. Features of gonadal dysgenesis and leydig cell impairment in testes with sertoli cell-only syndrome. Folia Histochem. Cytobiol. 2020, 58, 73–82. [Google Scholar] [CrossRef]
  22. Holm, M.; Rajpert-De Meyts, E.; Andersson, A.M.; Skakkebaek, N.E. Leydig cell micronodules are a common finding in testicular biopsies from men with impaired spermatogenesis and are associated with decreased testosterone/lh ratio. J. Pathol. 2003, 199, 378–386. [Google Scholar] [CrossRef] [PubMed]
  23. Hauptman, D.; Peric, M.H.; Maric, T.; Bojanac, A.K.; Sincic, N.; Zimak, Z.; Kastelan, Z.; Jezek, D. Leydig cells in patients with non-obstructive azoospermia: Do they really proliferate? Life 2021, 11, 1266. [Google Scholar] [CrossRef] [PubMed]
  24. Lardone, M.C.; Argandona, F.; Florez, M.; Parada-Bustamante, A.; Ebensperger, M.; Palma, C.; Piottante, A.; Castro, A. Overexpression of cyp19a1 aromatase in leydig cells is associated with steroidogenic dysfunction in subjects with sertoli cell-only syndrome. Andrology 2017, 5, 41–48. [Google Scholar] [CrossRef] [PubMed]
  25. Lan, K.C.; Chen, Y.T.; Chang, C.; Chang, Y.C.; Lin, H.J.; Huang, K.E.; Kang, H.Y. Up-regulation of sox9 in sertoli cells from testiculopathic patients accounts for increasing anti-mullerian hormone expression via impaired androgen receptor signaling. PLoS ONE 2013, 8, e76303. [Google Scholar] [CrossRef] [PubMed] [Green Version]
  26. Ma, M.; Yang, S.; Zhang, Z.; Li, P.; Gong, Y.; Liu, L.; Zhu, Y.; Tian, R.; Liu, Y.; Wang, X.; et al. Sertoli cells from non-obstructive azoospermia and obstructive azoospermia patients show distinct morphology, raman spectrum and biochemical phenotype. Hum. Reprod. 2013, 28, 1863–1873. [Google Scholar] [CrossRef] [PubMed] [Green Version]
  27. Lardone, M.C.; Argandona, F.; Lorca, M.; Piottante, A.; Florez, M.; Palma, C.; Ebensperger, M.; Castro, A. Leydig cell dysfunction is associated with post-transcriptional deregulation of cyp17a1 in men with sertoli cell-only syndrome. Mol. Hum. Reprod. 2018, 24, 203–210. [Google Scholar] [CrossRef]
  28. Steger, K.; Rey, R.; Louis, F.; Kliesch, S.; Behre, H.M.; Nieschlag, E.; Hoepffner, W.; Bailey, D.; Marks, A.; Bergmann, M. Reversion of the differentiated phenotype and maturation block in sertoli cells in pathological human testis. Hum. Reprod. 1999, 14, 136–143. [Google Scholar] [CrossRef] [PubMed] [Green Version]
  29. Kuyucu, Y.; Coskun, G.; Saker, D.; Karaoglan, O.; Urunsak, I.F.; Izol, V.; Aridogan, I.A.; Erdogan, S.; Ozgur, H.; Polat, S. Immunohistochemical examination of androgen receptor and estrogen receptor alpha expressions in obstructive and non-obstructive azoospermia. Syst. Biol. Reprod. Med. 2021, 67, 463–470. [Google Scholar] [CrossRef]
  30. Andersson, A.M.; Jorgensen, N.; Frydelund-Larsen, L.; Rajpert-De Meyts, E.; Skakkebaek, N.E. Impaired leydig cell function in infertile men: A study of 357 idiopathic infertile men and 318 proven fertile controls. J. Clin. Endocrinol. Metab. 2004, 89, 3161–3167. [Google Scholar] [CrossRef] [PubMed] [Green Version]
  31. Levalle, O.A.; Zylbersztein, C.; Aszpis, S.; Mariani, V.; Ponzio, R.; Aranda, C.; Guitelman, A.; Scaglia, H.E. Serum luteinizing hormone pulsatility and intratesticular testosterone and oestradiol concentrations in idiopathic infertile men with high and normal follicle stimulating hormone serum concentrations. Hum. Reprod. 1994, 9, 781–787. [Google Scholar] [CrossRef] [PubMed]
  32. Yasar, P.; Ayaz, G.; User, S.D.; Gupur, G.; Muyan, M. Molecular mechanism of estrogen-estrogen receptor signaling. Reprod. Med. Biol. 2017, 16, 4–20. [Google Scholar] [CrossRef] [PubMed]
  33. Levin, E.R.; Hammes, S.R. Nuclear receptors outside the nucleus: Extranuclear signalling by steroid receptors. Nat. Rev. Mol. Cell Biol. 2016, 17, 783–797. [Google Scholar] [CrossRef] [PubMed] [Green Version]
  34. Han, Y.; Feng, H.L.; Sandlow, J.I.; Haines, C.J. Comparing expression of progesterone and estrogen receptors in testicular tissue from men with obstructive and nonobstructive azoospermia. J. Androl. 2009, 30, 127–133. [Google Scholar] [CrossRef] [PubMed]
  35. Araujo, F.C.; Oliveira, C.A.; Reis, A.B.; Del Puerto, H.L.; Martins, A.S.; Reis, F.M. Expression of the proto-oncogene c-fos and the immunolocalization of c-fos, phosphorylated c-fos and estrogen receptor beta in the human testis. Histol. Histopathol. 2009, 24, 1515–1522. [Google Scholar]
  36. Cavaco, J.E.; Laurentino, S.S.; Barros, A.; Sousa, M.; Socorro, S. Estrogen receptors alpha and beta in human testis: Both isoforms are expressed. Syst. Biol. Reprod. Med. 2009, 55, 137–144. [Google Scholar] [CrossRef]
  37. Filipiak, E.; Suliborska, D.; Laszczynska, M.; Walczak-Jedrzejowska, R.; Oszukowska, E.; Marchlewska, K.; Kula, K.; Slowikowska-Hilczer, J. Estrogen receptor alpha localization in the testes of men with normal spermatogenesis. Folia Histochem. Cytobiol. 2013, 50, 340–345. [Google Scholar] [CrossRef]
  38. Pelletier, G.; El-Alfy, M. Immunocytochemical localization of estrogen receptors alpha and beta in the human reproductive organs. J. Clin. Endocrinol. Metab. 2000, 85, 4835–4840. [Google Scholar]
  39. Fietz, D.; Ratzenbock, C.; Hartmann, K.; Raabe, O.; Kliesch, S.; Weidner, W.; Klug, J.; Bergmann, M. Expression pattern of estrogen receptors alpha and beta and g-protein-coupled estrogen receptor 1 in the human testis. Histochem. Cell Biol. 2014, 142, 421–432. [Google Scholar] [CrossRef]
  40. Zimmerman, M.A.; Budish, R.A.; Kashyap, S.; Lindsey, S.H. GPER-novel membrane oestrogen receptor. Clin. Sci. 2016, 130, 1005–1016. [Google Scholar] [CrossRef] [Green Version]
  41. Sirianni, R.; Chimento, A.; Ruggiero, C.; De Luca, A.; Lappano, R.; Ando, S.; Maggiolini, M.; Pezzi, V. The novel estrogen receptor, g protein-coupled receptor 30, mediates the proliferative effects induced by 17beta-estradiol on mouse spermatogonial gc-1 cell line. Endocrinology 2008, 149, 5043–5051. [Google Scholar] [CrossRef] [PubMed] [Green Version]
  42. Chimento, A.; Sirianni, R.; Delalande, C.; Silandre, D.; Bois, C.; Ando, S.; Maggiolini, M.; Carreau, S.; Pezzi, V. 17 beta-estradiol activates rapid signaling pathways involved in rat pachytene spermatocytes apoptosis through gpr30 and er alpha. Mol. Cell Endocrinol. 2010, 320, 136–144. [Google Scholar] [CrossRef] [PubMed]
  43. Chimento, A.; Sirianni, R.; Casaburi, I.; Ruggiero, C.; Maggiolini, M.; Ando, S.; Pezzi, V. 17beta-estradiol activates gper- and esr1-dependent pathways inducing apoptosis in gc-2 cells, a mouse spermatocyte-derived cell line. Mol. Cell Endocrinol. 2012, 355, 49–59. [Google Scholar] [CrossRef] [PubMed]
  44. Lucas, T.F.; Royer, C.; Siu, E.R.; Lazari, M.F.; Porto, C.S. Expression and signaling of g protein-coupled estrogen receptor 1 (gper) in rat sertoli cells. Biol. Reprod. 2010, 83, 307–317. [Google Scholar] [CrossRef] [PubMed] [Green Version]
  45. Vaucher, L.; Funaro, M.G.; Mehta, A.; Mielnik, A.; Bolyakov, A.; Prossnitz, E.R.; Schlegel, P.N.; Paduch, D.A. Activation of gper-1 estradiol receptor downregulates production of testosterone in isolated rat leydig cells and adult human testis. PLoS ONE 2014, 9, e92425. [Google Scholar] [CrossRef] [PubMed]
  46. Martinez-Traverso, G.B.; Pearl, C.A. Immunolocalization of g protein-coupled estrogen receptor in the rat epididymis. Reprod. Biol. Endocrinol. 2015, 13, 48. [Google Scholar] [CrossRef] [Green Version]
  47. Chimento, A.; De Luca, A.; Nocito, M.C.; Avena, P.; La Padula, D.; Zavaglia, L.; Pezzi, V. Role of gper-mediated signaling in testicular functions and tumorigenesis. Cells 2020, 9, 2115. [Google Scholar] [CrossRef] [PubMed]
  48. Bouskine, A.; Nebout, M.; Mograbi, B.; Brucker-Davis, F.; Roger, C.; Fenichel, P. Estrogens promote human testicular germ cell cancer through a membrane-mediated activation of extracellular regulated kinase and protein kinase A. Endocrinology 2008, 149, 565–573. [Google Scholar] [CrossRef] [PubMed]
  49. Rago, V.; Romeo, F.; Giordano, F.; Maggiolini, M.; Carpino, A. Identification of the estrogen receptor gper in neoplastic and non-neoplastic human testes. Reprod. Biol. Endocrinol. 2011, 9, 135. [Google Scholar] [CrossRef] [Green Version]
  50. Oliveira, P.F.; Alves, M.G.; Martins, A.D.; Correia, S.; Bernardino, R.L.; Silva, J.; Barros, A.; Sousa, M.; Cavaco, J.E.; Socorro, S. Expression pattern of g protein-coupled receptor 30 in human seminiferous tubular cells. Gen. Comp. Endocrinol. 2014, 201, 16–20. [Google Scholar] [CrossRef] [PubMed]
  51. Bernardino, R.L.; Alves, M.G.; Silva, J.; Barros, A.; Ferraz, L.; Sousa, M.; Sa, R.; Oliveira, P.F. Expression of estrogen receptors alpha (er-alpha), beta (er-beta), and g protein-coupled receptor 30 (gpr30) in testicular tissue of men with klinefelter syndrome. Horm. Metab. Res. 2016, 48, 413–415. [Google Scholar] [CrossRef] [PubMed]
  52. Sonne, S.B.; Dalgaard, M.D.; Nielsen, J.E.; Hoei-Hansen, C.E.; Rajpert-De Meyts, E.; Gjerdrum, L.M.; Leffers, H. Optimizing staining protocols for laser microdissection of specific cell types from the testis including carcinoma in situ. PLoS ONE 2009, 4, e5536. [Google Scholar] [CrossRef] [PubMed] [Green Version]
  53. Jezek, D.; Knuth, U.A.; Schulze, W. Successful testicular sperm extraction (tese) in spite of high serum follicle stimulating hormone and azoospermia: Correlation between testicular morphology, tese results, semen analysis and serum hormone values in 103 infertile men. Hum. Reprod. 1998, 13, 1230–1234. [Google Scholar] [CrossRef] [PubMed] [Green Version]
  54. Johnsen, S.G. Testicular biopsy score count--a method for registration of spermatogenesis in human testes: Normal values and results in 335 hypogonadal males. Hormones 1970, 1, 2–25. [Google Scholar] [CrossRef]
  55. Guminska, A.; Oszukowska, E.; Kuzanski, W.; Sosnowski, M.; Wolski, J.K.; Walczak-Jedrzejowska, R.; Marchlewska, K.; Niedzielski, J.; Kula, K.; Slowikowska-Hilczer, J. Less advanced testicular dysgenesis is associated by a higher prevalence of germ cell neoplasia. Int. J. Androl. 2010, 33, e153–e162. [Google Scholar] [CrossRef]
  56. Holstein, A.F.; Roosen-Runge, E.C.; Schirren, C.S. The testis biopsy. In Ilustrated Pathology of Human Spermatogenesis; Holstein, A.F., Ed.; Grosse Verlag: Berlin, Germany, 1988; pp. 58–75. [Google Scholar]
  57. Guminska, A.; Slowikowska-Hilczer, J.; Kuzanski, W.; Sosnowski, M.; Oszukowska, E.; Marchlewska, K.; Walczak-Jedrzejowska, R.; Niedzielski, J.; Kula, K. Features of impaired seminiferous tubule differentiation are associated with germ cell neoplasia in adult men surgically treated in childhood because of cryptorchidism. Folia Histochem. Cytobiol. 2007, 45 (Suppl. 1), S163–S168. [Google Scholar]
  58. Svingen, T.; Jorgensen, A.; Rajpert-De Meyts, E. Validation of endogenous normalizing genes for expression analyses in adult human testis and germ cell neoplasms. Mol. Hum. Reprod. 2014, 20, 709–718. [Google Scholar] [CrossRef] [Green Version]
  59. Kotula-Balak, M.; Zielinska, R.; Glogowski, J.; Kowalski, R.K.; Sarosiek, B.; Bilinska, B. Aromatase expression in testes of xy, yy, and xx rainbow trout (oncorhynchus mykiss). Comp. Biochem. Physiol. A Mol. Integr. Physiol. 2008, 149, 188–196. [Google Scholar] [CrossRef]
  60. Lydka, M.; Kopera-Sobota, I.; Kotula-Balak, M.; Chojnacka, K.; Zak, D.; Bilinska, B. Morphological and functional alterations in adult boar epididymis: Effects of prenatal and postnatal administration of flutamide. Acta Vet. Scand. 2011, 53, 12. [Google Scholar] [CrossRef] [Green Version]
  61. Witkowski, M.; Pardyak, L.; Pawlicki, P.; Galuszka, A.; Profaska-Szymik, M.; Plachno, B.J.; Kantor, S.; Duliban, M.; Kotula-Balak, M. The g-protein-coupled membrane estrogen receptor is present in horse cryptorchid testes and mediates downstream pathways. Int. J. Mol. Sci. 2021, 22, 7131. [Google Scholar] [CrossRef]
  62. Smolen, A.J. Image analytic techniques for quantification of immunocytochemical staining in the nervous system. In Methods in Neurosciences; Conn, P.M., Ed.; Academic Press: New York, NY, USA, 1990. [Google Scholar]
  63. Filardo, E.J.; Graeber, C.T.; Quinn, J.A.; Resnick, M.B.; Giri, D.; DeLellis, R.A.; Steinhoff, M.M.; Sabo, E. Distribution of gpr30, a seven membrane-spanning estrogen receptor, in primary breast cancer and its association with clinicopathologic determinants of tumor progression. Clin. Cancer Res. 2006, 12, 6359–6366. [Google Scholar] [CrossRef] [PubMed] [Green Version]
  64. Andrade, D.L.; Viana, M.C.; Esteves, S.C. Differential diagnosis of azoospermia in men with infertility. J. Clin. Med. 2021, 10, 3144. [Google Scholar] [CrossRef] [PubMed]
  65. Lardone, M.C.; Piottante, A.; Valdevenito, R.; Ebensperger, M.; Castro, A. Histological and hormonal testicular function in oligo/azoospermic infertile men. Andrologia 2013, 45, 379–385. [Google Scholar] [CrossRef] [PubMed]
  66. Luboshitzky, R.; Kaplan-Zverling, M.; Shen-Orr, Z.; Nave, R.; Herer, P. Seminal plasma androgen/oestrogen balance in infertile men. Int. J. Androl. 2002, 25, 345–351. [Google Scholar] [CrossRef]
  67. Chevalier, N.; Vega, A.; Bouskine, A.; Siddeek, B.; Michiels, J.F.; Chevallier, D.; Fenichel, P. Gpr30, the non-classical membrane g protein related estrogen receptor, is overexpressed in human seminoma and promotes seminoma cell proliferation. PLoS ONE 2012, 7, e34672. [Google Scholar] [CrossRef] [Green Version]
  68. Sandner, F.; Welter, H.; Schwarzer, J.U.; Kohn, F.M.; Urbanski, H.F.; Mayerhofer, A. Expression of the oestrogen receptor gper by testicular peritubular cells is linked to sexual maturation and male fertility. Andrology 2014, 2, 695–701. [Google Scholar] [CrossRef] [Green Version]
  69. Revankar, C.M.; Cimino, D.F.; Sklar, L.A.; Arterburn, J.B.; Prossnitz, E.R. A transmembrane intracellular estrogen receptor mediates rapid cell signaling. Science 2005, 307, 1625–1630. [Google Scholar] [CrossRef] [Green Version]
  70. Filardo, E.J.; Thomas, P. Minireview: G protein-coupled estrogen receptor-1, gper-1: Its mechanism of action and role in female reproductive cancer, renal and vascular physiology. Endocrinology 2012, 153, 2953–2962. [Google Scholar] [CrossRef] [Green Version]
  71. Ghanami Gashti, N.; Sadighi Gilani, M.A.; Abbasi, M. Sertoli cell-only syndrome: Etiology and clinical management. J. Assist. Reprod. Genet. 2021, 38, 559–572. [Google Scholar] [CrossRef]
  72. Zitzmann, M.; Aksglaede, L.; Corona, G.; Isidori, A.M.; Juul, A.; T’Sjoen, G.; Kliesch, S.; D’Hauwers, K.; Toppari, J.; Slowikowska-Hilczer, J.; et al. European academy of andrology guidelines on klinefelter syndrome endorsing organization: European society of endocrinology. Andrology 2021, 9, 145–167. [Google Scholar] [CrossRef]
  73. Giudice, M.G.; Vermeulen, M.; Wyns, C. Blood testis barrier and somatic cells impairment in a series of 35 adult klinefelter syndrome patients. Int. J. Mol. Sci. 2019, 20, 5717. [Google Scholar] [CrossRef] [Green Version]
  74. Kim, S.Y.; Lee, B.Y.; Oh, A.R.; Park, S.Y.; Lee, H.S.; Seo, J.T. Clinical, hormonal, and genetic evaluation of idiopathic nonobstructive azoospermia and klinefelter syndrome patients. Cytogenet. Genome Res. 2017, 153, 190–197. [Google Scholar] [CrossRef] [PubMed]
  75. Boscia, F.; Passaro, C.; Gigantino, V.; Perdona, S.; Franco, R.; Portella, G.; Chieffi, S.; Chieffi, P. High levels of gpr30 protein in human testicular carcinoma in situ and seminomas correlate with low levels of estrogen receptor-beta and indicate a switch in estrogen responsiveness. J. Cell Physiol. 2015, 230, 1290–1297. [Google Scholar] [CrossRef] [PubMed]
  76. Lucas, T.F.; Pimenta, M.T.; Pisolato, R.; Lazari, M.F.; Porto, C.S. 17beta-estradiol signaling and regulation of sertoli cell function. Spermatogenesis 2011, 1, 318–324. [Google Scholar] [CrossRef] [PubMed] [Green Version]
  77. Steger, K.; Rey, R.; Kliesch, S.; Louis, F.; Schleicher, G.; Bergmann, M. Immunohistochemical detection of immature sertoli cell markers in testicular tissue of infertile adult men: A preliminary study. Int. J. Androl. 1996, 19, 122–128. [Google Scholar] [CrossRef] [PubMed]
  78. Hai, Y.; Hou, J.; Liu, Y.; Liu, Y.; Yang, H.; Li, Z.; He, Z. The roles and regulation of sertoli cells in fate determinations of spermatogonial stem cells and spermatogenesis. Semin. Cell Dev. Biol. 2014, 29, 66–75. [Google Scholar] [CrossRef]
  79. Mauduit, C.; Hamamah, S.; Benahmed, M. Stem cell factor/c-kit system in spermatogenesis. Hum. Reprod. Update 1999, 5, 535–545. [Google Scholar] [CrossRef] [Green Version]
  80. Feng, L.X.; Ravindranath, N.; Dym, M. Stem cell factor/c-kit up-regulates cyclin d3 and promotes cell cycle progression via the phosphoinositide 3-kinase/p70 s6 kinase pathway in spermatogonia. J. Biol. Chem. 2000, 275, 25572–25576. [Google Scholar] [CrossRef] [Green Version]
  81. Hasthorpe, S. Clonogenic culture of normal spermatogonia: In vitro regulation of postnatal germ cell proliferation. Biol. Reprod. 2003, 68, 1354–1360. [Google Scholar] [CrossRef] [Green Version]
  82. Correia, S.; Alves, M.R.; Cavaco, J.E.; Oliveira, P.F.; Socorro, S. Estrogenic regulation of testicular expression of stem cell factor and c-kit: Implications in germ cell survival and male fertility. Fertil. Steril. 2014, 102, 299–306. [Google Scholar] [CrossRef]
  83. Nagano, M.; Ryu, B.Y.; Brinster, C.J.; Avarbock, M.R.; Brinster, R.L. Maintenance of mouse male germ line stem cells in vitro. Biol. Reprod. 2003, 68, 2207–2214. [Google Scholar] [CrossRef] [PubMed]
  84. Pellegrini, M.; Grimaldi, P.; Rossi, P.; Geremia, R.; Dolci, S. Developmental expression of bmp4/alk3/smad5 signaling pathway in the mouse testis: A potential role of bmp4 in spermatogonia differentiation. J. Cell Sci. 2003, 116, 3363–3372. [Google Scholar] [CrossRef] [PubMed] [Green Version]
  85. Paduch, D.A.; Hilz, S.; Grimson, A.; Schlegel, P.N.; Jedlicka, A.E.; Wright, W.W. Aberrant gene expression by sertoli cells in infertile men with sertoli cell-only syndrome. PLoS ONE 2019, 14, e0216586. [Google Scholar] [CrossRef] [PubMed] [Green Version]
  86. Bialas, M.; Borczynska, A.; Rozwadowska, N.; Fiszer, D.; Kosicki, W.; Jedrzejczak, P.; Kurpisz, M. SCF and c-kit expression profiles in male individuals with normal and impaired spermatogenesis. Andrologia 2010, 42, 83–91. [Google Scholar] [CrossRef] [PubMed]
  87. Lasala, C.; Schteingart, H.F.; Arouche, N.; Bedecarras, P.; Grinspon, R.P.; Picard, J.Y.; Josso, N.; di Clemente, N.; Rey, R.A. Sox9 and sf1 are involved in cyclic amp-mediated upregulation of anti-mullerian gene expression in the testicular prepubertal sertoli cell line SMAT1. Am. J. Physiol. Endocrinol. Metab. 2011, 301, E539–E547. [Google Scholar] [CrossRef] [PubMed] [Green Version]
  88. Sansone, A.; Kliesch, S.; Isidori, A.M.; Schlatt, S. AMH and INSL3 in testicular and extragonadal pathophysiology: What do we know? Andrology 2019, 7, 131–138. [Google Scholar] [CrossRef] [Green Version]
  89. Lapoirie, M.; Dijoud, F.; Lejeune, H.; Plotton, I. Effect of androgens on sertoli cell maturation in human testis from birth to puberty. Basic Clin. Androl. 2021, 31, 31. [Google Scholar] [CrossRef]
  90. Edelsztein, N.Y.; Racine, C.; di Clemente, N.; Schteingart, H.F.; Rey, R.A. Androgens downregulate anti-mullerian hormone promoter activity in the sertoli cell through the androgen receptor and intact steroidogenic factor 1 sites. Biol. Reprod. 2018, 99, 1303–1312. [Google Scholar] [CrossRef]
  91. Edelsztein, N.Y.; Rey, R.A. Importance of the androgen receptor signaling in gene transactivation and transrepression for pubertal maturation of the testis. Cells 2019, 8, 861. [Google Scholar] [CrossRef] [Green Version]
  92. Maymon, B.B.; Yogev, L.; Paz, G.; Kleiman, S.E.; Schreiber, L.; Botchan, A.; Hauser, R.; Yavetz, H. Sertoli cell maturation in men with azoospermia of different etiologies. Fertil. Steril. 2002, 77, 904–909. [Google Scholar] [CrossRef]
  93. Van Saen, D.; Vloeberghs, V.; Gies, I.; De Schepper, J.; Tournaye, H.; Goossens, E. Characterization of the stem cell niche components within the seminiferous tubules in testicular biopsies of klinefelter patients. Fertil. Steril. 2020, 113, 1183–1195.e3. [Google Scholar] [CrossRef] [PubMed]
  94. Alfano, M.; Ventimiglia, E.; Locatelli, I.; Capogrosso, P.; Cazzaniga, W.; Pederzoli, F.; Frego, N.; Matloob, R.; Sacca, A.; Pagliardini, L.; et al. Anti-mullerian hormone-to-testosterone ratio is predictive of positive sperm retrieval in men with idiopathic non-obstructive azoospermia. Sci. Rep. 2017, 7, 17638. [Google Scholar] [CrossRef] [PubMed] [Green Version]
  95. Valeri, C.; Lovaisa, M.M.; Racine, C.; Edelsztein, N.Y.; Riggio, M.; Giulianelli, S.; Venara, M.; Bedecarras, P.; Ballerini, M.G.; di Clemente, N.; et al. Molecular mechanisms underlying AMH elevation in hyperoestrogenic states in males. Sci. Rep. 2020, 10, 15062. [Google Scholar] [CrossRef]
  96. Kotula-Balak, M.; Pawlicki, P.; Milon, A.; Tworzydlo, W.; Sekula, M.; Pacwa, A.; Gorowska-Wojtowicz, E.; Bilinska, B.; Pawlicka, B.; Wiater, J.; et al. The role of g-protein-coupled membrane estrogen receptor in mouse leydig cell function-in vivo and in vitro evaluation. Cell Tissue Res. 2018, 374, 389–412. [Google Scholar] [CrossRef] [PubMed] [Green Version]
  97. Gorowska-Wojtowicz, E.; Dutka, P.; Kudrycka, M.; Pawlicki, P.; Milon, A.; Plachno, B.J.; Tworzydlo, W.; Pardyak, L.; Kaminska, A.; Hejmej, A.; et al. Regulation of steroidogenic function of mouse leydig cells: G-coupled membrane estrogen receptor and peroxisome proliferator-activated receptor partnership. J. Physiol. Pharmacol. 2018, 69, 69. [Google Scholar]
  98. Duliban, M.; Gorowska-Wojtowicz, E.; Tworzydlo, W.; Rak, A.; Brzoskwinia, M.; Krakowska, I.; Wolski, J.K.; Kotula-Balak, M.; Plachno, B.J.; Bilinska, B. Interstitial leydig cell tumorigenesis-leptin and adiponectin signaling in relation to aromatase expression in the human testis. Int. J. Mol. Sci 2020, 21, 3649. [Google Scholar] [CrossRef] [PubMed]
  99. Miller, W.L.; Auchus, R.J. The molecular biology, biochemistry, and physiology of human steroidogenesis and its disorders. Endocr. Rev. 2011, 32, 81–151. [Google Scholar] [CrossRef] [PubMed] [Green Version]
  100. D’Aurora, M.; Ferlin, A.; Di Nicola, M.; Garolla, A.; De Toni, L.; Franchi, S.; Palka, G.; Foresta, C.; Stuppia, L.; Gatta, V. Deregulation of sertoli and leydig cells function in patients with klinefelter syndrome as evidenced by testis transcriptome analysis. BMC Genom. 2015, 16, 156. [Google Scholar] [CrossRef] [Green Version]
Figure 1. (a) Representative microphotograph of hematoxylin-eosin-stained histological sections of testicular biopsy from men with obstructive azoospermia. Seminiferous tubules (T) display a normal diameter and are lined with the seminiferous epithelium with complete spermatogenesis; between tubules, an interstitial space (I) is present with Leydig cell clusters (L) and blood vessels (Bv); (b) Higher magnification of the testicular area surrounded by the dash lines in (a); in seminiferous tubules, Sertoli cells characterized by large irregular nuclei with distinct nucleoli and extensive cytoplasmic processes extending from the basement membrane to the lumen of the tubule are present (S—Sertoli cell nucleus); Sertoli cell cytoplasm surrounds different types of germ cells: sg—spermatogonia, sc—spermatocytes, rs—round spermatids, es—elongated spermatids; (c) Representative microphotographs of the testicular biopsy from men with non-obstructive azoospermia presenting spermatogenic arrest at the spermatogonia and spermatocyte stage (spermatids are lacking), seminiferous tubules have a slightly decreased diameter, larger clusters of Leydig cells are present in the intertubular space; (d) Higher magnification of testicular area surrounded by the dash lines in (c) with marked testicular cells; (e) Representative microphotographs of the testicular biopsy from men with non-obstructive azoospermia presenting Sertoli cells-only syndrome; tubules have a decreased diameter, in the interstitial space, a larger cluster of Leydig cells is present, seminiferous tubules are devoid of germ cells and exclusively lined with Sertoli cells; notice the cytoplasm of Sertoli cells extends from the basement membrane to the lumen; (f) Higher magnification of testicular area surrounded by the dash lines in (e); (a,c,e)—magnification 200×, scale bar = 100 um; (b,d,f)—magnification 400×, scale bar = 50 µm.
Biology 11 00373 g001
Figure 2. GPER transcriptional level in the whole testicular tissue in studied group. AU—arbitrary units (relative quantification normalized to the reference gene RPS29 using the ΔCt method); OA—obstructive azoospermia with complete spermatogenesis; NOA—non-obstructive azoospermia with impaired spermatogenesis. p value—Mann–Whitney test.
Biology 11 00373 g002
Figure 3. GPER transcriptional level in the laser-microdissected testicular compartments: (a) laser-microdissected seminiferous tubules (ST); (b) laser-microdissected Leydig cell clusters (LC). AU—arbitrary units (relative quantification normalized to the reference gene RPS29 using the ΔCt method); p value—Mann–Whitney test.
Biology 11 00373 g003
Figure 4. Representative microphotographs presenting immunohistochemical staining of GPER in histological specimens from (a) men with obstructive azoospermia presenting complete spermatogenesis (CS); and (c) from men with non-obstructive azoospermia presenting Sertoli cell-only syndrome; insert in (a)—negative control; (b,d)—higher magnifications of microphotographs (a,c), respectively. The color reaction of the studied antigen (GPER) is visible as a brown coloration of Leydig and Sertoli cell cytoplasm; L—Leydig cells cluster; S—Sertoli cell nuclei; sg—spermatogonia; sc—spermatocyte; rs—round spermatids; es—elongated spermatids; * — Sertoli cell cytoplasm in (b,d). Note the lack of color reaction in the rim of the cytoplasm surrounding nuclei of germ cells (a,b); (a,c)—magnification 400×, scale bar = 50 µm; (b,d)—magnification 1000×, scale bar = 20 um.
Biology 11 00373 g004
Figure 5. Transcriptional levels of: (a) anti-Müllerian hormone (AMH); (b) bone morphogenic protein 4 (BMP4); (c) stem cell factor (SCF) in laser-microdissected seminiferous tubules in the analyzed subgroups (OA-ST and NOA-ST). AU—arbitrary units (relative quantification normalized to the reference gene RPS29 using the ΔCt method). Data are presented as mean ± SEM; p value—Mann–Whitney test.
Biology 11 00373 g005
Figure 6. Transcriptional levels of: (a) steroidogenic acute regulatory protein (StAR); (b) 17α-hydroxylase/17,20-lyase (CYP17A1); (c) 17 β-hydroxysteroid dehydrogenase 3 (HSD17B3) in the laser-microdissected Leydig cell clusters in the analyzed subgroups (OA-LC and NOA-LC). AU—arbitrary units (relative quantification normalized to the reference gene RPS29 using the ΔCt method). Data are presented as mean ± EM; p value—Mann–Whitney test.
Biology 11 00373 g006
Table 1. Histopathological description and Johnsen score (JS) of testicular biopsies.
Histological GroupDescriptionJS (Points)
Median (Q1–Q3)
CSAll tubules with complete spermatogenesis or at least up to elongated spermatids8.5 (8.1–8.8)
ARR/MIXTubules with germ cells until spermatogonia or spermatocytes or immature spermatids/single tubules with few elongated spermatids and others presenting maturational arrest at different stages or SCOS4.5 (3.1–5.2)
SCOSNo tubules containing germ cells2.0 (1.6–2.0)
ARR/MIX—maturation arrest or mixed pattern of disturbed spermatogenesis; CS—complete spermatogenesis; SCOS—Sertoli cell-only syndrome.
Table 2. TaqMan® Gene Expression Assays used in the study.
Target GeneAssay CodeWhole TissueST-LCMLC-LCM
GPERHs00173506_m1+++
RPS29Hs03004310_g1+++
AMHHs01006984_g1+
BMP4Hs00370078_m1+
SCFHs00931798_m1+
StARHs00986556_g1
CYP17A1Hs04981326_g1+
HSD173BHs00609319_m1+
AMH—anti-Müllerian hormone; BMP4—bone morphogenic protein 4; CYP17A1—17α-Hydroxylase/17,20-Lyase; CYP19A1—aromatase; GPER—G-protein-coupled estrogen receptor; HSD173B—17 β-hydroxysteroid dehydrogenase 3; LC-LCM—laser-microdissected Leydig cell cluster subgroups; SCF—stem cell factor; StAR—steroidogenic acute regulatory protein; ST-LCM—laser-microdissected seminiferous tubules subgroups; (+)—gene analysis performed; (−)—gene analysis not performed.
Table 3. Clinical parameters and results of histological evaluation in the studied groups.
OA
n = 19
NOA
n = 53
Age (years)32.0 (27.0–36.0)31.0 (29.0–32.0)
Testicular volume (mL) *15.2 (11.5–16.3)10.1 (8.7–11.8) a
STD (µm)199.9 (188.5–208.0)159.6 (139.5–181.8) a
TM (µm)6.5 (6.0–7.5)8.0 (6.9–10.3)
LC-score (points)1.5 (1.3–1.8)2.2 (1.9–2.8) a
Values are median (interquartile range); Mann–Whitney U test, a p < 0.05 with respect to OA; LC—Leydig cells; n—number of subjects; NOA—non-obstructive azoospermia with disturbed spermatogenesis; OA—obstructive azoospermia with complete spermatogenesis; STD—seminiferous tubules diameter; TM—thickness of tubular membrane; * volume of the biopsied testis.
Table 4. Serum hormonal profile in the studied groups.
OA
n = 19
NOA
n = 53
FSH (mIU/mL)3.5 (2.6–5.4)13.5 (10.0–19.9) a
LH (mIU/mL)4.5 (3.4–5.4)7.4 (5.8–9.8) a
Testosterone (T) (nmol/L)15.5 (10.9–20.1)15.9 (11.9–21.1)
Estradiol (E) (pmol/L)107.2(82.5–133.2)110.1 (82.2–151.9)
T/LH ratio4.0 (2.7–5.7)2.4 (1.5–3.1) a
E/T ratio7.2 (4.8–9.2)8.3 (6.9–10.2)
Values are median (interquartile range); Mann–Whitney U test, a p < 0.05 with respect to OA; n—number of subjects; NOA—non-obstructive azoospermia with disturbed spermatogenesis; OA—obstructive azoospermia with complete spermatogenesis.
Table 5. Spearman’s rank correlation (rs) between the GPER mRNA expression level and age, parameters of histological evaluation and hormonal levels in OA and NOA groups.
GPER mRNA
OA
n = 19
rs (p)
NOA
n = 53
rs (p)
Age (years)0.091 (0.7111)0.106 (0.4486)
Testicular volume (mL) *−0.142 (0.5620)−0.283 (0.0586)
STD (µm)0.331 (0.1653)−0.106 (0.4525)
TM (µm)0.058 (0.8105)0.157 (0.2635)
LC-score0.174 (0.4740)0.291 (0.0346)
FSH (mIU/mL)0.164 (0.5018)0.289 (0.0484)
LH (mIU/mL)−0.236 (0.3305)0.055 (0.7001)
Testosterone (T) (nmol/L)−0.254 (0.2928)−0.175 (0.2089)
Estradiol (E) (pmol/L)0.137 (0.6545)0.183 (0.2915)
T/LH ratio−0.061 (0.8054)−0.110 (0.4391)
E/T ratio0.157 (0.5599)0.184 (0.2958)
LC—Leydig cells; n—number of subjects; NOA—non-obstructive azoospermia with disturbed spermatogenesis; OA—obstructive azoospermia with complete spermatogenesis; r—Spearman’s rank correlation coefficient; STD—seminiferous tubule diameter; TM—thickness of tubular membrane; * volume of the biopsied testis. Statistical significance in the Spearman’s rank correlation was reached when p < 0.05.
Table 6. Spearman’s rank correlation (rs) between the GPER-ST mRNA expression level and age, parameters of histological evaluation and hormonal levels in OA-ST and NOA-ST groups.
GPER mRNA
OA-ST
n = 16
rs (p)
NOA-ST
n = 27
rs (p)
Age (years)0.375 (0.1528)−0.187 (0.3815)
Testicular volume (mL) *−0.184 (0.4797)−0.335 (0.1012)
STD (µm)−0.208 (0.4238)0.182 (0.3839)
TM (µm)0.306 (0.2670)0.291 (0.1582)
LC-score0.294 (0.2513)0.174 (0.4043)
FSH (mIU/mL)−0.158 (0.6627)0.627 (0.0008)
LH (mIU/mL)0.164 (0.6504)0.534 (0.0059)
Testosterone (T) (nmol/L)0.170 (0.6382)0.039 (0.8523)
Estradiol (E) (pmol/L)0.371 (0.4684)0.232 (0.3861)
T/LH ratio−0.212 (0.5550)−0.435 (0.0296)
E/T ratio0.285 (0.4927)−0.044 (0.8711)
LC—Leydig cells; n—number of subjects; NOA-ST—subgroup of men with non-obstructive azoospermia and disturbed spermatogenesis, whose biopsies were subjected to seminiferous tubule laser microdissection; OA-ST—subgroup of men with obstructive azoospermia and complete spermatogenesis, whose biopsies were subjected to seminiferous tubule laser microdissection; r—Spearman’s rank correlation coefficient; STD—seminiferous tubule diameter; TM—thickness of tubular membrane; * volume of the biopsied testis. Statistical significance in the Spearman’s rank correlation was reached when p < 0.05.
Table 7. Spearman’s rank correlation (rs) between the GPER-LC mRNA expression level and age, parameters of histological evaluation and hormonal levels in OA-LC and NOA-LC groups.
GPER mRNA
OA-LC
n = 13
rs (p)
NOA-LC
n = 14
rs (p)
Age (years)0.259 (0.4406)−0.103 (0.7375)
Testicular volume (mL) *0.082 (0.8084)0.262 (0.4094)
STD (µm)−0.301 (0.3701)0.126 (0.6807)
TM (µm)−0.329 (0.3528)0.192 (0.5291)
LC-score0.356 (0.2823)0.162 (0.6156)
FSH (mIU/mL)0.277 (0.4079)−0.209 (0.4911)
LH (mIU/mL)0.323 (0.3318)−0.197 (0.5171)
Testosterone (T) (nmol/L)0.059 (0.8626)−0.461 (0.1123)
Estradiol (E) (pmol/L)0.203 (0.6286)0.103 (0.7769)
T/LH ratio−0.123 (0.7186)−0.192 (0.5291)
E/T ratio0.460 (0.2125)0.272 (0.4458)
LC—Leydig cells; n—number of subjects; NOA-LC—subgroup of men with non-obstructive azoospermia and disturbed spermatogenesis, whose biopsies were subjected to Leydig cell clusters laser microdissection; OA-LM—subgroup of men with obstructive azoospermia and complete spermatogenesis, whose biopsies were subjected to Leydig cell clusters laser microdissection; r—Spearman’s rank correlation coefficient; STD—seminiferous tubule diameter; TM—thickness of tubular membrane; * volume of the biopsied testis. Statistical significance in the Spearman’s rank correlation was reached when p < 0.05.
Table 8. Intensity of immunohistochemical staining for GPER expression as relative optical density (ROD) of DAB brown reaction product.
GPEROA
n = 19
NOA
n = 53
ROD Leydig cells10.4 (8.5–15.8)10.3 (6.9–14.9)
ROD Sertoli cells8.4 (5.9–9.8)9.1 (8.7–10.3) a
Values are median (interquartile range); Mann–Whitney U test, a p < 0.05 with respect to OA; LC—Leydig cells; n—number of subjects; NOA—non-obstructive azoospermia with disturbed spermatogenesis; OA—obstructive azoospermia with complete spermatogenesis; ROD—relative optical density.
Table 9. Intensity of immunohistochemical staining for GPER expression as relative optical density (ROD) of DAB brown reaction product in the biopsies subjected to laser microdissection.
GPER IHCOA-LC
n = 13
NOA-LC
n = 14
ROD Leydig cells9.5 (5.7–14.1)8.4 (7.0–14.9)
OA-ST
n = 16
NOA-ST
n = 27
ROD Sertoli cells8.2 (5.8–10.3)10.9 (9.9–11.7) a
Values are median (interquartile range); Mann–Whitney U test, a p < 0.05 with respect to OA-LC; LC—Leydig cells; n—number of subjects; NOA-LC—subgroup of men with non-obstructive azoospermia and disturbed spermatogenesis, whose biopsies were subjected to Leydig cell clusters laser microdissection; NOA-ST—subgroup of men with non-obstructive azoospermia and disturbed spermatogenesis, whose biopsies were subjected to seminiferous tubules laser microdissection; OA-LC—subgroup of men with obstructive azoospermia and complete spermatogenesis, whose biopsies were subjected to Leydig cell clusters laser microdissection; OA-ST—subgroup of men with obstructive azoospermia and complete spermatogenesis, whose biopsies were subjected to seminiferous tubules laser microdissection; ROD—relative optical density.
Table 10. Spearman’s rank correlation (rs) between the GPER and Sertoli cell markers mRNA expression level in OA-ST and NOA-ST subgroups.
GPER mRNA
OA-ST
n = 16
rs (p)
NOA-ST
n = 27
rs (p)
AMH0.167 (0.6914)0.562 (0.0052)
BMP40.2029 (0.6997)0.028 (0.8190)
SCF−0.268 (0.4841)0.4148 (0.0867)
AMH—anti-Müllerian hormone; BMP4—bone morphogenic protein 4; n—number of subjects; NOA-ST—subgroup of men with non-obstructive azoospermia and disturbed spermatogenesis, whose biopsies were subjected to seminiferous tubule laser microdissection; OA-ST—subgroup of men with obstructive azoospermia and complete spermatogenesis, whose biopsies were subjected to seminiferous tubule laser microdissection; SCF—stem cell factor. Statistical significance in the Spearman’s rank correlation was reached when p < 0.05.
Table 11. Spearman’s rank (rs) correlation between the GPER and Leydig cell markers mRNA expression levels in OA-LC and NOA-LC subgroups.
GPER mRNA
OA-LC
n = 13
rs (p)
NOA-LC
n = 14
rs (p)
StAR-LC0.320 (0.3369)0.231 (0.5194)
CYP17A1-LC0.379 (0.2491)0.584 (0.0529)
HSD17B3-LC0.407 (0.2762)0.487 (0.1526)
CYP17A1—17α-hydroxylase/17,20-lyase; GPER—G-protein-coupled estrogen receptor; HSD173B—17 β-hydroxysteroid dehydrogenase 3; n—number of subjects; NOA-LC—subgroup of men with non-obstructive azoospermia and disturbed spermatogenesis, whose biopsies were subjected to Leydig cell cluster laser microdissection; OA-LC—subgroup of men with obstructive azoospermia and complete spermatogenesis, whose biopsies were subjected to Leydig cell cluster laser microdissection; StAR—steroidogenic acute regulatory protein. Statistical significance in the Spearman’s rank correlation was reached when p < 0.05.
Publisher’s Note: MDPI stays neutral with regard to jurisdictional claims in published maps and institutional affiliations.

