
Effects of Temperature and Salinity on Growth, Metabolism and Digestive Enzymes Synthesis of Goniopora columna

 ,
,  ,
, 

Abstract
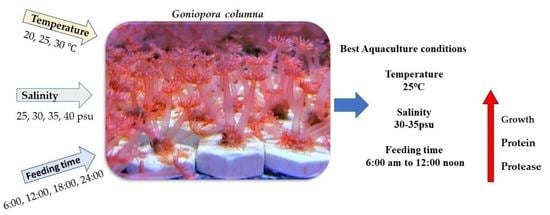
:Simple Summary
Abstract
1. Introduction
2. Materials and Methods
2.1. Experiment 1: Effects of Temperature and Salinity on G. columna Adaptability, Metabolism and Growth
2.1.1. Temperature and Salinity Control
2.1.2. Coral Adaptability Test against Changing Temperature and Salinity (Stretching and Contractile Behaviors)
2.1.3. Oxygen Consumption and Ammonia Excretion Test
2.1.4. Determination of Coral Growth and Polyp Count
2.2. Experiment 2: Effects of Temperature and Salinity on Digestive Enzyme Activities of G. columna
2.2.1. Analysis of Coral Body Composition and Feed
Glucose standard concentration (µg/mL)
2.2.2. Analysis of Digestive Enzymes
2.3. Experiment 3: Diurnal Changes Analysis of G. columna Body Composition and Digestive Enzymes
2.4. Statistical Analysis
3. Results
3.1. Experiment 1: Adaptation, Metabolism and Growth of G. columna
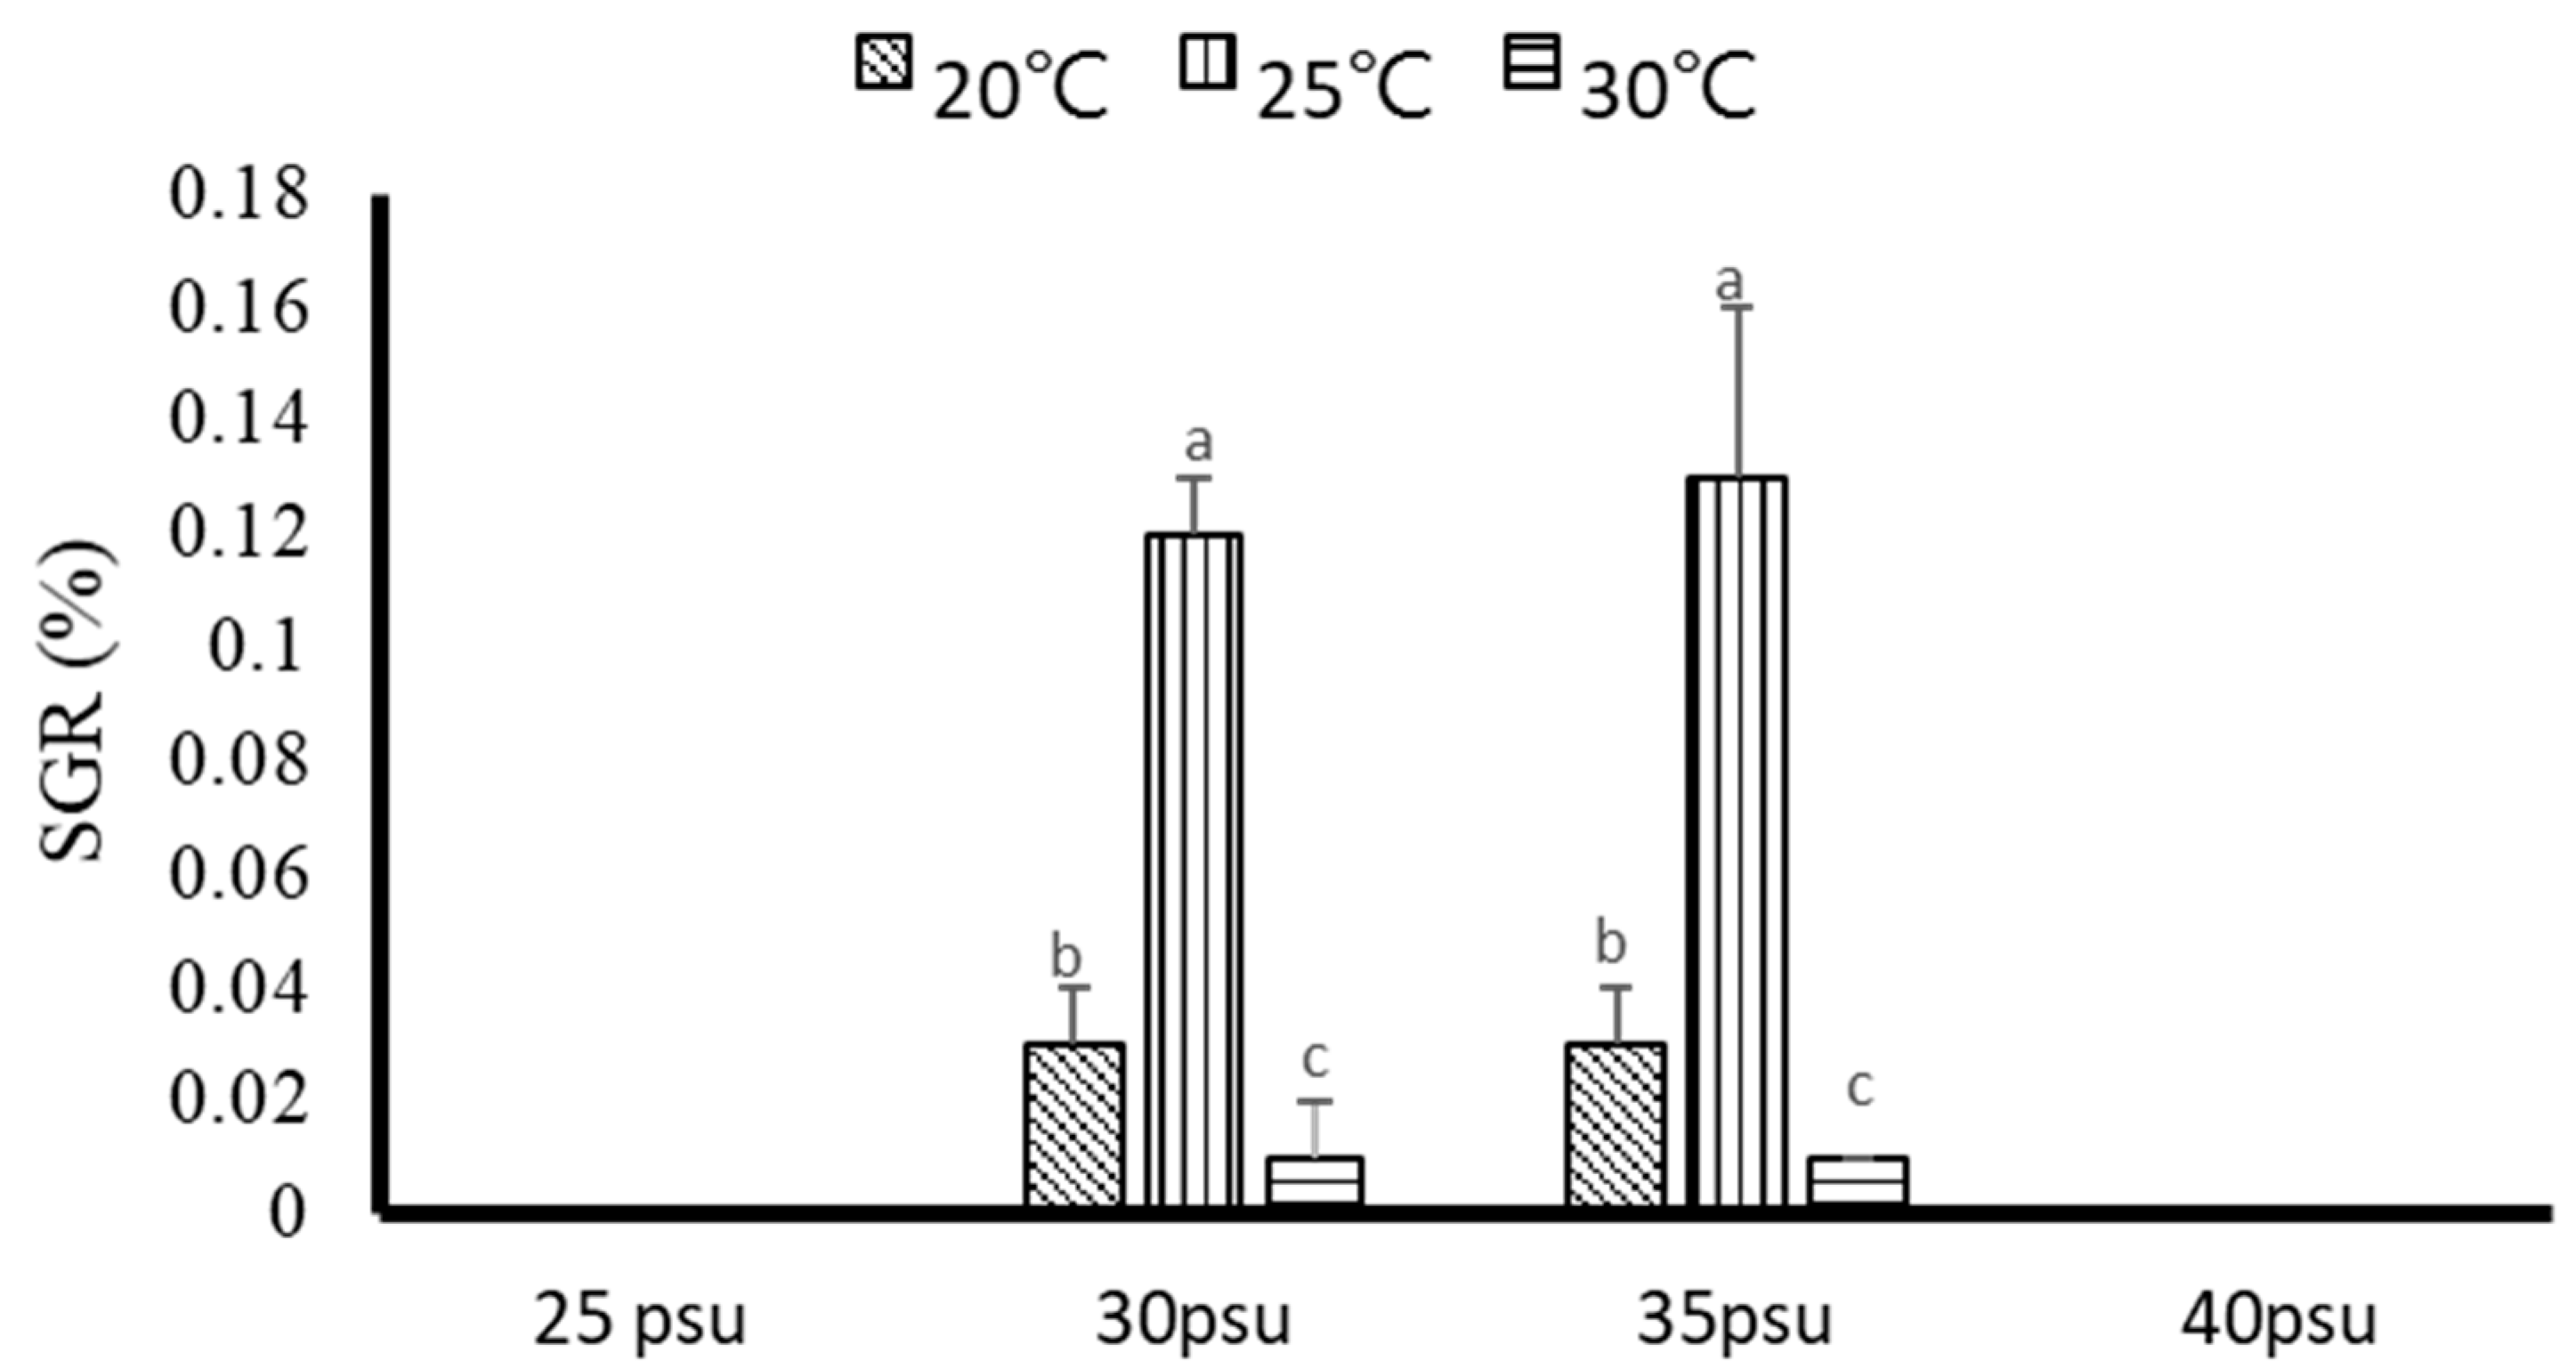
3.1.1. Growth and Survival
3.1.2. The Effect of Temperature and Salinity on Coral OXYGEN Consumption
3.1.3. The Effect of Temperature and Salinity on Ammonia Metabolism
3.1.4. Energy Metabolism Rate
3.1.5. The Effect of Temperature and Salinity on G. columna Adaptability
3.2. Experiment 2: Changes in Digestive Enzyme Activity
3.2.1. The Influence of Temperature and Salinity on G. columna Body Composition
3.2.2. The Effect of Temperature and Salinity on Digestive Enzyme Activity of G. columna
3.3. Experiment 3: Diurnal Variation of Digestive Enzyme Activity and Body Composition
Diurnal Changes Affecting Coral Body Composition and Digestive Enzymes Profile
4. Discussion
4.1. Growth and Survival
4.2. Body Composition and the Influence of Digestive Enzymes
4.3. Physiological Metabolism
4.4. The Effect of G. columna Adaptability and Best Time for Feeding
5. Conclusions
Author Contributions
Funding
Institutional Review Board Statement
Informed Consent Statement
Data Availability Statement
Acknowledgments
Conflicts of Interest
References
- Kinne, O. The effects of temperature and salinity on marine and brackish water animals: 2. Salinity and temperature-salinity combinations. In Oceanography and Marine Biology: An Annual Review; CRC Press: Boca Raton, FL, USA, 1964; Volume 2, pp. 281–339. [Google Scholar]
- Alderdice, D. 3 Osmotic and ionic regulation in teleost eggs and larvae. In Fish Physiology; Elsevier: Amsterdam, The Netherlands, 1988; Volume 11, pp. 163–251. [Google Scholar]
- Coles, S.L.; Jokiel, P.L. Effects of salinity on coral reefs. In Pollution in Tropical Aquatic Systems; CRC Press: Boca Raton, FL, USA, 2018; pp. 147–166. [Google Scholar]
- Bao, Y.; Zhou, X.-J.; Huang, M.-X.; Liang, K.-S.; Huang, X.-F.; Huang, S.-Q.; Qiu, Q.-C.; Zheng, X.-O. Study of artificial culture of coral Acroporidae. Mar. Sci. 2012, 1. [Google Scholar]
- Humphrey, C.; Weber, M.; Lott, C.; Cooper, T.; Fabricius, K. Effects of suspended sediments, dissolved inorganic nutrients and salinity on fertilisation and embryo development in the coral Acropora millepora (Ehrenberg, 1834). Coral Reefs 2008, 27, 837–850. [Google Scholar] [CrossRef] [Green Version]
- Chui, A.P.Y.; Ang, P. Elevated temperature enhances normal early embryonic development in the coral Platygyra acuta under low salinity conditions. Coral Reefs 2015, 34, 461–469. [Google Scholar] [CrossRef]
- Bhosale, S.; Nagle, V.; Jagtap, T. Antifouling potential of some marine organisms from India against species of Bacillus and Pseudomonas. Mar. Biotechnol. 2002, 4, 111–118. [Google Scholar] [CrossRef]
- Coles, S.; Jokiel, P.L. Synergistic effects of temperature, salinity and light on the hermatypic coral Montipora verrucosa. Mar. Biol. 1978, 49, 187–195. [Google Scholar] [CrossRef]
- Kuanui, P.; Chavanich, S.; Viyakarn, V.; Omori, M.; Lin, C. Effects of temperature and salinity on survival rate of cultured corals and photosynthetic efficiency of zooxanthellae in coral tissues. Ocean Sci. J. 2015, 50, 263–268. [Google Scholar] [CrossRef]
- Gegner, H.M.; Ziegler, M.; Rädecker, N.; Buitrago-López, C.; Aranda, M.; Voolstra, C.R. High salinity conveys thermotolerance in the coral model Aiptasia. Biol. Open 2017, 6, 1943–1948. [Google Scholar] [CrossRef] [Green Version]
- Glynn, P.; D’croz, L. Experimental evidence for high temperature stress as the cause of El Nino-coincident coral mortality. Coral Reefs 1990, 8, 181–191. [Google Scholar] [CrossRef]
- Darsey, K. The Influence of Temperature and Salinity on the Growth and Survival of California Brown Shrimp, Penaeus Californiensis (Holmes). Ph.D. Thesis, University of Arizona, Tucson, AZ, USA, 1990. [Google Scholar]
- Dias, M.; Madeira, C.; Jogee, N.; Ferreira, A.; Gouveia, R.; Cabral, H.; Diniz, M.; Vinagre, C. Oxidative stress on scleractinian coral fragments following exposure to high temperature and low salinity. Ecol. Indic. 2019, 107, 105586. [Google Scholar] [CrossRef]
- Chen, J.-C.; Lin, M.-N.; Ting, Y.-Y.; Lin, J.-N. Survival, haemolymph osmolality and tissue water of Penaeus chinensis juveniles acclimated to different salinity and temperature levels. Comp. Biochem. Physiol. Part A Physiol. 1995, 110, 253–258. [Google Scholar] [CrossRef]
- Jiang, D.-H.; Lawrence, A.L.; Neill, W.H.; Gong, H. Effects of temperature and salinity on nitrogenous excretion by Litopenaeus vannamei juveniles. J. Exp. Mar. Biol. Ecol. 2000, 253, 193–209. [Google Scholar] [CrossRef]
- Blaxter, J. 1 Pattern and Variety in Development. In Fish Physiology; Elsevier: Amsterdam, The Netherlands, 1988; Volume 11, pp. 1–58. [Google Scholar]
- Rombough, P.J. The effects of temperature on embryonic and larval development. In Global Warming: Implication of Fresh Water and Marine Fish; Cambridge University Press: Cambridge, UK, 1997. [Google Scholar]
- Hoegh-Guldberg, O.; Smith, G.J. The effect of sudden changes in temperature, light and salinity on the population density and export of zooxanthellae from the reef corals Stylophora pistillata Esper and Seriatopora hystrix Dana. J. Exp. Mar. Biol. Ecol. 1989, 129, 279–303. [Google Scholar] [CrossRef]
- Fitt, W.K.; Brown, B.E.; Warner, M.E.; Dunne, R.P. Coral bleaching: Interpretation of thermal tolerance limits and thermal thresholds in tropical corals. Coral Reefs 2001, 20, 51–65. [Google Scholar] [CrossRef]
- Kerswell, A.P.; Jones, R.J. Effects of hypo-osmosis on the coral Stylophora pistillata: Nature and cause of low-salinity bleaching1. Mar. Ecol. Prog. Ser. 2003, 253, 145–154. [Google Scholar] [CrossRef] [Green Version]
- Lasker, H.R. Light dependent activity patterns among reef corals: Montastrea cavernosa. Biol. Bull. 1979, 156, 196–211. [Google Scholar] [CrossRef]
- Levy, O.; Dubinsky, Z.; Achituv, Y. Photobehavior of stony corals: Responses to light spectra and intensity. J. Exp. Biol. 2003, 206, 4041–4049. [Google Scholar] [CrossRef] [PubMed] [Green Version]
- Sharp, J.W.; Sitts, R.M.; Knight, A.W. Effects of Kelthane and temperature on the respiration of Crangon franciscorum. Comp. Biochem. Physiol. Part C Comp. Pharmacol. 1978, 59, 75–79. [Google Scholar] [CrossRef]
- Wood, J. Nitrogen excretion in some marine teleosts. Can. J. Biochem. Physiol. 1958, 36, 1237–1242. [Google Scholar] [CrossRef]
- Zhu, B.; Wang, G.; Huang, B.; Tseng, C. Effects of temperature, hypoxia, ammonia and nitrate on the bleaching among three coral species. Chin. Sci. Bull. 2004, 49, 1923–1928. [Google Scholar] [CrossRef]
- Corner, E.; Cowey, C. Biochemical studies on the production of marine zooplankton. Biol. Rev. 1968, 43, 393–426. [Google Scholar] [CrossRef]
- Ding, D.-S.; Sun, W.-T.; Pan, C.-H. Feeding of a Scleractinian Coral, Goniopora columna, on Microalgae, Yeast, and Artificial Feed in Captivity. Animals 2021, 11, 3009. [Google Scholar] [CrossRef] [PubMed]
- Solorzano, L. Determination of ammonia in natural waters by the phenolhypochlorite method. Limnol. Oceanogr. 1969, 14, 799–801. [Google Scholar]
- Rocha, R.J.; Pimentel, T.; Serôdio, J.; Rosa, R.; Calado, R. Comparative performance of light emitting plasma (LEP) and light emitting diode (LED) in ex situ aquaculture of scleractinian corals. Aquaculture 2013, 402, 38–45. [Google Scholar] [CrossRef]
- Schutter, M.; Van Velthoven, B.; Janse, M.; Osinga, R.; Janssen, M.; Wijffels, R.; Verreth, J. The effect of irradiance on long-term skeletal growth and net photosynthesis in Galaxea fascicularis under four light conditions. J. Exp. Mar. Biol. Ecol. 2008, 367, 75–80. [Google Scholar] [CrossRef]
- AOAC. Official Methods for the Analysis, 14th ed.; Association of Official Analytical Chemists: Arlington, WA, USA, 1984. [Google Scholar]
- Duben-Engelkirk, J.L.; Fody, E.P. Clinical Chemistry: Principles, Procedures, Correlations; Lippincott Williams & Wilkins: Philadelphia, PA, USA, 2000. [Google Scholar]
- Tietze, W. Fundamentals of Clinical Chemistry, 2nd ed.; WB Saunders Co.: New York, NY, USA, 1982; pp. 994–995. [Google Scholar]
- Sun, J.-Y.; Du, J.; Qian, L.-C.; Jing, M.-Y.; Weng, X.-Y. Distribution and characteristics of endogenous digestive enzymes in the red-eared slider turtle, Trachemys scripta elegans. Comp. Biochem. Physiol. Part A Mol. Integr. Physiol. 2007, 147, 1125–1129. [Google Scholar] [CrossRef]
- Borlongan, I.G. Studies on the digestive lipases of milkfish, Chanos chanos. Aquaculture 1990, 89, 315–325. [Google Scholar] [CrossRef]
- Bernfeld, P. [17] Amylases, α and β; Elsevier: Amsterdam, The Netherlands, 1955. [Google Scholar]
- D’angelo, C.; Hume, B.C.; Burt, J.; Smith, E.G.; Achterberg, E.P.; Wiedenmann, J. Local adaptation constrains the distribution potential of heat-tolerant Symbiodinium from the Persian/Arabian Gulf. ISME J. 2015, 9, 2551–2560. [Google Scholar] [CrossRef] [Green Version]
- Howells, E.J.; Abrego, D.; Meyer, E.; Kirk, N.L.; Burt, J.A. Host adaptation and unexpected symbiont partners enable reef-building corals to tolerate extreme temperatures. Glob. Change Biol. 2016, 22, 2702–2714. [Google Scholar] [CrossRef]
- Hennig, O.; Andreatta, E. Effect of temperature in an intensive nursery system for Penaeus paulensis (Pérez Farfante, 1967). Aquaculture 1998, 164, 167–172. [Google Scholar] [CrossRef]
- Harriott, V.; Banks, S. Latitudinal variation in coral communities in eastern Australia: A qualitative biophysical model of factors regulating coral reefs. Coral Reefs 2002, 21, 83–94. [Google Scholar] [CrossRef]
- Vernberg, W.B.; Vernberg, F.J. Environmental Physiology of Marine Animals; Springer Science & Business Media: Berlin, Germany, 2012. [Google Scholar]
- Rand, M.; Greenberg, A.; Taras, M. Standard Methods for the Examination of Water and Wastewater: Prepared and Published Jointly by American Public Health Association; American Water Works Association, and Water Pollution Control Federation: Denver, CO, USA, 1976. [Google Scholar]
- Hochachka, P.W.; Somero, G.N. Strategies of Biochemical Adaptation; W.B. Saunders: Philadelphia, PA, USA, 1973. [Google Scholar]
- Mantel, L.H.; Farmer, L.L. Osmotic and ionic regulation. Intern. Anat. Physiol. Regul. 1983, 5, 53–161. [Google Scholar]
- Castille, F.L., Jr.; Lawrence, A.L. The effect of salinity on the osmotic, sodium and chloride concentrations in the hemolymph of euryhaline shrimp of the genus Penaeus. Comp. Biochem. Physiol. Part A Physiol. 1981, 68, 75–80. [Google Scholar] [CrossRef]
- Moberg, F.; Nyström, M.; Kautsky, N.; Tedengren, M.; Jarayabhand, P. Effects of reduced salinity on the rates of photosynthesis and respiration in the hermatypic corals Porites lutea and Pocillopora damicornis. Mar. Ecol. Prog. Ser. 1997, 157, 53–59. [Google Scholar] [CrossRef]
- True, J.D. Salinity as a structuring force for near shore coral communities. In Proceedings of the 12th International Coral Reef Symposium, Cairns, Australia, 9–13 July 2012; p. e13. [Google Scholar]
- Chui, A.P.Y.; Ang, P., Jr. High tolerance to temperature and salinity change should enable scleractinian coral Platygyra acuta from marginal environments to persist under future climate change. PLoS ONE 2017, 12, e0179423. [Google Scholar] [CrossRef] [Green Version]
- Jokiel, P.; Hunter, C.; Taguchi, S.; Watarai, L. Ecological impact of a fresh-water “reef kill” in Kaneohe Bay, Oahu, Hawaii. Coral Reefs 1993, 12, 177–184. [Google Scholar] [CrossRef]
- Sebens, K.; Koehl, M. Predation on zooplankton by the benthic anthozoans Alcyonium siderium (Alcyonacea) and Metridium senile (Actiniaria) in the New England subtidal. Mar. Biol. 1984, 81, 255–271. [Google Scholar] [CrossRef]
- Hii, Y.-S.; Soo, C.-L.; Liew, H.-C. Feeding of scleractinian coral, Galaxea fascicularis, on Artemia salina nauplii in captivity. Aquac. Int. 2009, 17, 363–376. [Google Scholar] [CrossRef]
- Muscatine, L. The role of symbiotic algae in carbon and energy flux in reef corals. Coral Reefs 1990, 25, 75–87. [Google Scholar]
- Osinga, R.; Janssen, M.; Janse, M. The role of light in coral physiology and its implications for coral husbandry. Adv. Coral Husb. Public Aquar. 2008, 2, 173–183. [Google Scholar]
- Alutoin, S.; Boberg, J.; Nyström, M.; Tedengren, M. Effects of the multiple stressors copper and reduced salinity on the metabolism of the hermatypic coral Porites lutea. Mar. Environ. Res. 2001, 52, 289–299. [Google Scholar] [CrossRef]
- Parks, J.E.; Pomeroy, R.S.; Balboa, C.M. The economics of live rock and live coral aquaculture. In Marine Ornamental Species: Collection, Culture and Conservation; Iowa State Press: Iowa City, IA, USA; A Balckwell Publishing Company: Hoboken, NJ, USA, 2003; pp. 185–206. [Google Scholar]
- Susiloningtyas, D.; Handayani, T.; Amalia, A. The impact of coral reefs destruction and climate change in Nusa Dua and Nusa Penida, Bali, Indonesia. In IOP Conference Series: Earth and Environmental Science; IOP Publishing: Bristol, UK, 2018; p. 012054. [Google Scholar]
- Tito, C.; Ampou, E.; Wibawa, T. Stressor-Response of Reef-Building Corals to Climate Change in the Menjangan Island, West Bali National Park, Indonesia. In IOP Conference Series: Earth and Environmental Science; IOP Publishing: Bristol, UK, 2019; p. 012011. [Google Scholar]


| Water Quality Conditions | Optimum |
|---|---|
| pH | 8.0 ± 0.31 |
| Ammonia nitrogen | 0.04 ± 0.04 mg/L |
| Nitrous acid | 0.02 ± 0.01 mg/L |
| Nitric acid | 0.10 ± 0.01 PPM |
| Calcium | 400 ± 32.03 PPM |
| Magnesium | 1280 ± 63.21 PPM |
| Phosphate | 0.02 ± 0.01 PPM |
| Salinity and Temperature | ||||||||||||
|---|---|---|---|---|---|---|---|---|---|---|---|---|
| 25 psu | 30 psu | 35 psu | 40 psu | |||||||||
| 20 °C | 25 °C | 30 °C | 20 °C | 25 °C | 30 °C | 20 °C | 25 °C | 30 °C | 20 °C | 25 °C | 30 °C | |
| Initial Polyps (Number ± 95%) | 5.00 (0.00) | 5.00 (0.00) | 5.00 (0.00) | 5.00 (0.00) | 5.00 (0.00) | 5.00 (0.00) | 5.00 (0.00) | 5.00 (0.00) | 5.00 (0.00) | 5.00 (0.00) | 5.00 (0.00) | 5.00 (0.00) |
| End Polyp (Number ± 95%) | 7.67 d (0.44) | 7.67 d (0.89) | 7.33 d (0.44) | 12.33 b (1.78) | 38.33 a (1.11) | 9.33 c (0.44) | 13.67 b (1.11) | 39.33 a (1.11) | 6.00 e (0.00) | 5.00 e (0.00) | 5.00 e (0.00) | 5.00 e (0.00) |
| Net Increase (Number ± 95%) | 2.67 d (0.44) | 2.67 d (0.89) | 5.33 b (0.44) | 7.33 b (1.78) | 33.33 a (1.11) | 4.33 c (0.44) | 8.67 b (1.11) | 34.33 a (1.11) | 1.00 e (0.00) | 0.00 f (0.00) | 0.00 f (0.00) | 0.00 f (0.00) |
| Ammonia nitrogen (mg/L) | 0.02 c (0.01) | 0.03 c (0.01) | 0.02 c (0.01) | 0.14 ab (0.02) | 0.13 ab (0.04) | 0.12 ab (0.03) | 0.14 ab (0.02) | 0.16 a (0.05) | 0.01 c (0.01) | 0.01 c (0.01) | 0.01 c (0.01) | 0.01 c (0.01) |
| Oxygen consumption (mg/L) | 0.10 d (0.01) | 0.20 d (0.01) | 0.30 e (0.02) | 2.50 b (0.02) | 2.40 b (0.05) | 2.10 c (0.07) | 2.10 c (0.03) | 2.60 a (0.05) | 0.10 d (0.01) | 0.10 d (0.01) | 0.10 d (0.01) | 0.10 d (0.01) |
| O/N | 5.00 d (1.25) | 6.67 d (1.09) | 15.00 b (1.32) | 17.86 ab (1.43) | 18.46 a (1.45) | 17.50 ab (1.39) | 15.00 b (1.29) | 16.25 ab (1.24) | 10.00 c (1.58) | 10.00 c (0.10) | 10.00 c (0.10) | 10.00 c (0.10) |
| Score | 0 | 1 | 2 | 3 | 4 |
|---|---|---|---|---|---|
| Tentacle form |  |  |  |  |  |
| behaviors | Polyps fully contracted | Polyps were slightly elongated | The polyps begin to stretch, but the total length does not exceed 50%. | The polyps begin to stretch, but the total length does not exceed 75%. | Polyps fully extended |
Publisher’s Note: MDPI stays neutral with regard to jurisdictional claims in published maps and institutional affiliations. |
© 2022 by the authors. Licensee MDPI, Basel, Switzerland. This article is an open access article distributed under the terms and conditions of the Creative Commons Attribution (CC BY) license (https://creativecommons.org/licenses/by/4.0/).
Share and Cite
Ding, D.-S.; Patel, A.K.; Singhania, R.R.; Chen, C.-W.; Dong, C.-D. Effects of Temperature and Salinity on Growth, Metabolism and Digestive Enzymes Synthesis of Goniopora columna. Biology 2022, 11, 436. https://doi.org/10.3390/biology11030436
Ding D-S, Patel AK, Singhania RR, Chen C-W, Dong C-D. Effects of Temperature and Salinity on Growth, Metabolism and Digestive Enzymes Synthesis of Goniopora columna. Biology. 2022; 11(3):436. https://doi.org/10.3390/biology11030436
Chicago/Turabian StyleDing, De-Sing, Anil Kumar Patel, Reeta Rani Singhania, Chiu-Wen Chen, and Cheng-Di Dong. 2022. "Effects of Temperature and Salinity on Growth, Metabolism and Digestive Enzymes Synthesis of Goniopora columna" Biology 11, no. 3: 436. https://doi.org/10.3390/biology11030436
APA StyleDing, D.-S., Patel, A. K., Singhania, R. R., Chen, C.-W., & Dong, C.-D. (2022). Effects of Temperature and Salinity on Growth, Metabolism and Digestive Enzymes Synthesis of Goniopora columna. Biology, 11(3), 436. https://doi.org/10.3390/biology11030436