Article

Effects of Hypoxia on Coral Photobiology and Oxidative Stress

1
MARE—Marine and Environmental Sciences Centre, Laboratório Marítimo da Guia and ARNET—Aquatic Research Infrastructure Network Associated Laboratory, Faculdade de Ciências da Universidade de Lisboa, Av. Nossa Senhora do Cabo, 939, 2750-374 Cascais, Portugal
2
Division for Ecology and Biodiversity, Swire Institute of Marine Science, School of Biological Sciences, The University of Hong Kong, Pokfulam, Hong Kong SAR, China
3
MARE—Marine and Environmental Sciences Centre and ARNET—Aquatic Research Infrastructure Network Associated Laboratory, Faculdade de Ciências da Universidade de Lisboa, Campo Grande, 1749-016 Lisboa, Portugal
4
Departamento de Biologia Animal, Faculdade de Ciências da Universidade de Lisboa, Campo Grande, 1749-016 Lisboa, Portugal
5
Departamento de Biologia Vegetal, Faculdade de Ciências da Universidade de Lisboa, Campo Grande, 1749-016 Lisboa, Portugal
*
Author to whom correspondence should be addressed.
Biology 2022, 11(7), 1068; https://doi.org/10.3390/biology11071068
Submission received: 17 February 2022 / Revised: 21 June 2022 / Accepted: 8 July 2022 / Published: 18 July 2022

Abstract

:

Simple Summary

With the growing importance of climate change research, the biological effects of oxygen loss on marine biota remain understudied. Coral reefs support diverse marine organisms and provide valuable ecosystem services. Deoxygenation may induce mass coral mortality and reduce species richness on coral reefs. Corals exposed to nocturnal hypoxia may experience detrimental effects due to induced oxidative stress caused by the increase in reactive oxygen species (ROS). The stress interferes with the most fundamental biological processes vital for the symbiosis between corals and photosynthetic algae. In this study, the coral Acropora spp. exhibited evident injury in photosynthetic apparatus, de-epoxidation state and DNA. However, besides that, there were no signs of engaged antioxidant defense mechanisms against ROS or pigment degradation, which leads to a conclusion that these corals may be resilient to such oxygen daily oscillations. Nevertheless, while corals might survive such short-term abiotic stress, the growing number and intensity of hypoxic events across the global ocean may pose a massive threat to these keystone invertebrate species.

Abstract

Global ocean oxygen (O2) content is decreasing as climate change drives declines in oxygen solubility, strengthened stratification of seawater masses, increased biological oxygen consumption and coastal eutrophication. Studies on the biological effects of nocturnal decreased oxygen concentrations (hypoxia) on coral reefs are very scarce. Coral reefs are fundamental for supporting one quarter of all marine species and essential for around 275 million people worldwide. This study investigates acute physiological and photobiological responses of a scleractinian coral (Acropora spp.) to overnight hypoxic conditions (<2 mg/L of O2). Bleaching was not detected, and visual and physical aspects of corals remained unchanged under hypoxic conditions. Most photobiological-related parameters also did not show significant changes between treatments. In addition to this, no significant differences between treatments were observed in the pigment composition. However, hypoxic conditions induced a significant decrease in coral de-epoxidation state of the xanthophyll cycle pigments and increase in DNA damage. Although the present findings suggest that Acropora spp. is resilient to some extent to short-term daily oxygen oscillations, long-term exposure to hypoxia, as predicted to occur with climate change, may still have deleterious effects on corals.

1. Introduction

Dissolved oxygen is decreasing in the global ocean, with potential harmful impacts on diversity and abundance of marine organisms [1,2,3]. According to the Intergovernmental Panel on Climate Change (representative concentration pathway, RCP 2.6–8.5), the dissolved oxygen content in the global oceans will decline by 1.7% and 4% by 2100 as a result of general drivers of climate change [1,4]. Additionally, the oceans’ buffering capacity is diminishing due to increasing CO2 absorption and excess heat produced from anthropogenic activities [5,6,7,8]. The consequent ocean warming causes a reduction in oxygen solubility in seawater, which results in higher physiological oxygen demands of many marine organisms [3,9], with potential cascading effects (e.g., alteration of behavioural responses, migrations, reductions in growth rates and fecundity, and increased mortality rates) [3,10,11,12,13]. Oxygen concentrations in the range of 2 to 3.5 mg O2/L or below are considered as the hypoxic threshold for marine organisms [14,15,16,17]. Hypoxia is known to marine life at all levels of biological organization and induce stronger deleterious effects than ocean warming, ocean acidification, and their interaction [3,10]. Hypoxic or anoxic conditions appear in coastal zones and open oceans (known as oxygen minimum zones; OMZs) as a consequence of water column stratification, warming, organic matter production, increased rates of oxygen utilization, excessive agricultural run-off and limited circulation [18,19,20,21,22]. Coastal ecosystems are specially affected by increased warming waters and nutrient intrusion with more frequent marine heat waves and eutrophication. Therefore, the expansion of oxygen deprived coastal waters, specifically lethal acute hypoxic events, creates “dead zones” that lead to the occurrence of mass-mortalities of residing organisms, including corals [10,11,23,24,25,26,27].
Hermatypic scleractinian corals, the main reef-building species due to their calcium carbonate skeleton, have a mutualistic relationship with endosymbiotic dinoflagellate algae (Symbiodiniaceae), also termed zooxanthellae. Symbiodiniaceae are found in the hosts’ tissue and produce energy to meet most of scleractinian corals’ metabolic requirements via photosynthesis. Corals inhabit shallow, warm water areas with sufficient light, where they thrive in symbiosis [26,28,29,30,31]. Coral reefs cover one per cent of the global sea surface, yet they sustain many marine taxa by providing organisms with food, refuge, and substrate [30,31]. Perceptible lightening of the coral tissue defines coral bleaching, which can happen under multiple environmental conditions, including warming, acidification, algal blooms, pollution, and hypoxia [29,31,32,33,34]. This happens as the coral polyp expels the zooxanthellae, turning the colony into white or pale colours [35]. Marine hypoxia is known to impact corals’ health and can cause bleaching [10,36]. Global efforts to observe the impacts of hypoxia on coral reefs have only recently increased [3,24]. Corals conditioned to hypoxia for long-term periods are susceptible to severe bleaching resulting in benthic habitat degradation and mass mortalities of benthic and pelagic organisms [29,31,32,33,34,37].
Photo-oxidative stress, among a myriad of cellular, physiological and molecular responses, plays a major role in mass bleaching mortalities, which entails the production and accumulation of reactive oxygen species (ROS), following the oxidative theory of coral bleaching [37,38,39]. ROS are unstable molecules produced in the mitochondria of the coral-algal composite and principally in Symbodiniaceae chloroplasts [38]. Symbiodiniaceae are capable of overcoming antioxidant defence mechanisms in the coral cells and consequently restrict re-oxidation of reduced chemical species required for crucial elemental cycling [10]. The effects of ROS involve the inhibition of the photosynthetic and calcification rates, and impairment of metabolic pathways. Subsequently, this can prompt cellular damage and expulsion of symbionts to prevent physiological damage and potentially evade exocytosis, apoptosis of the host cells, separation of host cells and deterioration of the symbiotic cells through autophagy [38,39,40]. However, ROS are not solely responsible for initiating bleaching in corals since numerous cellular responses and diverse cell types are involved in the breakdown of the cellular functions and symbiont expulsion [39]. Hence, whether ROS initiates bleaching relies on the environmental perturbations and Symbiodiniaceae taxa [33]. Nonetheless, intracellular ROS production induces signaling cascades and can damage proteins, lipids and DNA if the organism fails to quench ROS accumulation that induces cellular oxidation [37].
The reaction pathways of antioxidant enzymes have the potential to remove ROS. The detoxification process to mitigate the effects of ROS begins with antioxidant defence reductive potential where superoxide dismutase (SOD) transforms superoxide anions (O2) to hydrogen peroxide (H2O2). The latter is further reduced to non-toxic H2O and O2 by antioxidant enzyme catalase (CAT) [39,40,41,42]. The production of ROS in host and symbiont increases with lowered oxygen concentration, yet the complete antioxidant defence processes in host and symbionts remain unknown.
Evidence indicates that low DO concentration appears almost ubiquitously in coral reef landscapes. However, the diurnal fluctuations directed by respiration/consumption at night and photosynthetic oxygen production during the day create very complex conditions for the in situ benthos, with hypoxic conditions during the night and hyperoxic during the day. Hence, the severity of nocturnal hypoxia is extensively influenced by the biological activity of the associated benthos [15,37]. Moreover, nocturnal hypoxia is highly contingent on the tides and coral reef landscape, where entrapment of water and absence of water circulation (e.g., semi-enclosed lagoons, atolls and tidal pools) lead to night-time minimum O2 concentrations. Nocturnal hypoxia has been reported on coral reefs in the Red Sea [37,43]. The coral reefs of the Lizard and Heron Island lagoons in Australia demonstrated nocturnal O2 levels at around 20% or less due to oxygen consumption by organisms and photosynthesis absence [43,44]. Thus, shallow coral reefs are more inclined to exhibit daily oxygen depletion, in contrast to vast periodical or persistent ocean deoxygenation linked to ocean warming and anthropogenic nutrient intrusion. For instance, coral reefs in the Caribbean exhibited episodic anthropogenic hypoxia with lowest O2 content of around 0.5 mg O2/L, causing coral bleaching and mortality. Additionally, the northern Gulf of Mexico and East China Sea showed patterns of increasing hypoxic areas due to high nutrient loading [10,24,36,45,46,47]. Occurrence of nocturnal hypoxia is a more recurrent phenomena and higher threat as generally anticipated.
This study investigates, for the first time, the photochemical responses and antioxidant enzymatic defences of a scleractinian coral (Acropora spp.) to recurrent nocturnal hypoxic conditions (<2 mg/L of O2). More specifically, we evaluated the impacts of reduced oxygen levels during the night-time on: (i) survival, (ii) key photobiological parameters (e.g., absorption energy flux, electron transport energy flux, the density of the reaction centre II within the photosystem (PS) II antenna chlorophyll bed), (iii) pigment concentrations (chlorophyll a, chlorophyll c2, pheophytin a, β-carotene, diadinoxanthin, diatoxanthin and peridinin) and de-epoxidation state and (iv) oxidative stress biomarkers (e.g., DNA damage, lipid peroxidation, and catalase and superoxide dismutase activities).

2. Materials and Methods

2.1. Species Collection

The colony of scleractinian stony coral Acropora spp. (CITES 588369/02) was supplied and transported by commercial supplier TMC Iberia (Lisbon, Portugal) to Laboratório Maritimo da Guia facilities (Cascais, Portugal). The coral colony was fragmented into 29 pseudo-replicate fragments (average height 3.53 ± 0.99 cm) attached to clay tiles and (randomly) placed in an individual aquarium tank (4.2 L).

2.2. Acclimation Procedure and Hypoxia Exposure

After the acclimation time (7 days) under normoxic conditions (n = 29; O2 = 6.73 mg/L; T = 25.7 °C), the corals were exposed to two different experimental oxygen level treatments: (1) saturated O2 concentrations (control, n = 15; O2 = 6.73 mg/L, T = 25.7 °C) or (2) nocturnal hypoxia conditions (12 h) below the corals physiological threshold (hypoxia, n = 14; O2 = 1.75 mg/L, T = 25.7 °C) with daily normoxic conditions (n = 29; O2= 6.73 mg/L; T = 25.7 °C), that remained for 8 consecutive days of the experimental period.
Each coral fragment was placed in a separate aquarium tank and kept in a semi-open aquatic system. Natural seawater, pumped from the sea, was filtered (0.35 μm; Harmsco, Riviera Beach, FL, USA) and UV light sterilized (Vecton 150, TMC Iberia, Lisbon, Portugal) and was renewed daily (100–300 L). Aquarium tanks containing corals (control) were supplied by pumping (2200 w pump; TMC Iberia, Lisbon, Portugal) the seawater from the water outflow tank. However, seawater supplying the corals in the hypoxic treatment was pumped (3000 w pump; TMC Iberia, Lisbon, Portugal) from the water outflow tank to the cylindrical column and further to the designated tanks containing the corals. The cylindrical column tanks were injected with nitrogen gas with wooden air diffusers to remove oxygen synchronized with the night cycle (t = 12 h) and regulated by a solenoid valve connected to a timer. To maintain the O2 levels below 2 mg/L during the exposure, the injection of the nitrogen flow was manually adjusted and regulated with a pneumatic flow control valve (diameter 8 mm). The flow in all the individual tanks had been adjusted to 0.2 L/min and remained constant within all the experimental tanks. To ensure the stability of the water temperature, the experimental tanks containing the corals were placed in the water bath and the water temperature was controlled and kept steady by digital heaters (200 w; TMC Iberia, Lisbon, Portugal) and chillers (Frimar C250; Fernando Ribeiro, Lisbon, Portugal) recirculating water in the water outflow tank. To maintain the stability of water properties, a protein skimmer (V2skim Pro 450; TMC Iberia, Lisbon, Portugal) was installed in the water outflow tank with bioballs (matured with nitrifying bacteria) for biological quality (Ourico®; Fernando Ribeiro, Lisbon, Portugal). Throughout the experiment, oxygen concentrations had been constantly measured (in intervals of 1 s) with fibre-optic oxygen meter Firesting O2 (Pyro Science GmbH, Aachen, Germany) connected to the portable computer where the data had been recorded.
Light periodicity was 12 h night and 12 h day cycles at quantum irradiance of 300 μmol/ms (Aquaray lights; TMC Iberia, Lisbon, Portugal). Water physical and chemical parameters were monitored daily. Nitrates, nitrites, ammonium, phosphates, potassium, calcium and magnesium were measured daily with colourimetric tests (TMC Iberia, Lisbon, Portugal). The pH was measured using a manual measuring device (VWR pHenomenal® pH 1100 H connected to an epoxy electrode (pH electrode DJ 113); VWR, Radnor, PA, USA), salinity with a refractometer (V2; TMC Iberia, Lisbon,, Portugal), carbonate chemistry (e.g., total alkalinity) was measured daily by spectrophotometry using the absorbance at 595 nm (Asys UVM 340 microplate reader, Biochrom Ltd., Cambridge, UK). To measure total alkalinity, formic acid and dye (bromophenol-blue) were added to the seawater to engage neutralization adapted from Sarazin et al. [48]. Temperature and oxygen were also monitored daily with a manual multi-parameter measuring device (WTW Multi 3510 IDS equipped with optical IDS dissolved oxygen sensors FDO®925; Weilheim, Germany). The daily measurements of seawater parameters can be found in Table S1.

2.3. Chlorophyll a Pulse Amplitude Modulated Fluorometry

On daily basis, Pulse Amplitude Modulated (PAM) chlorophyll fluorescence measurements were performed using PSI FluorPen MP 100-A (Photon System Instruments, Drásov, Czech Republic) [49,50,51] after dark-adapting the coral fragments for 15 min. A minimum of nine pseudo-replicates from each treatment was monitored for high data reliability due to replication effort [52,53]. The photochemical process was evaluated by the polyphasic rise in fluorescence (JIP-test) transient using OJIP protocol of the FluorPen and several photochemical parameters were extracted (Table 1). The JIP-test was performed daily in the afternoon (at 5:00 p.m.), and it comprises four phases. Level O represents all the open reaction centres at the onset of illumination with no reduction of QA (fluorescence intensity during 10 ms). The rise of transient from O to J indicates the net photochemical reduction of QA (the stable primary electron acceptor of PS II) to QA (lasts for 2 ms). The phase from J to I is due to all reduced states of closed RCs such as QA QB, QA QB2− and QA QBH2 (duration of 2–30 ms). The level P (300 ms) coincides with the maximum concentration of QA−QB with a plastoquinol pool maximally reduced. Phase P also reflects a balance between the light incident at the PS II side and the rate of utilization of the chemical (potential) energy and the rate of heat dissipation [54]. JIP-test and LC1 test were performed using PSI FluorPen AP 150 (Photon System Instruments, Drásov, Czech Republic) on the last experimental day. Kautsky curves were obtained as results from JIP-test and rapid light curves (RLCs) from the LC1 test. The electron transport rate (ETR) at each light level and derived parameters were calculated with an absorptivity factor of 1 [52].

2.4. Coral Fragment Preparation and Homogenization Procedure

After the experimental period, each coral was fragmented using cutters (TMC Iberia, Lisbon, Portugal) and stored at −80 °C. Coral fragments were mixed in 1:5 (w/v) with K2HPO4/KH2PO buffer (pH 7.4) containing 1 mM DTT (dithiothreitol), 0.1 mM PMSF (phenylmethylsulfonyl fluoride), 1 mM EDTA (ethylenediaminetetraacetic acid) and 100 mM KCl (potassium chloride). To achieve tissue and cell disruption, sonification (Nanografi Nano Technology, City, Germany) was performed, and the homogenates were centrifuged at 1000× g for 10 s to ensure the complete separation of tissue from the skeleton. The resulting supernatant aliquots were used for oxidative stress and enzymatic antioxidant activity assays that were evaluated using a microplate reader (TECAN, Männedorf, Switzerland), and the reading was performed in triplicate.

2.5. Pigment Composition

Pigments capturing light are chlorophyll a, chlorophyll c2 and peridinin with pheophytin a and photoprotection pigments such as β-carotene, diadinoxanthin and diatoxanthin are distinctive for photosynthetic organisms [55]. Coral fragments for pigment analysis were extracted using 100% ice-cold acetone and subjected to an ultra-sound bath for 3 s to disrupt the symbiont pigment bearing cells. Extraction occurred for 24 h in the dark at −20 °C. After the extraction period, the resultant mix was centrifuged for 4000× g for 15 min at 4 °C, and the supernatant was used for spectral analysis in a dual-beam spectrophotometer. Absorbance was recorded against an acetone blank between 350 and 750 nm, at 0.5 nm steps and resultant data were analyzed using Gauss Peak Spectra fitting library, using SigmaPlot Software Kupper [56]. De-epoxidation state (DES) was used as an index to troubleshoot the accessory pigments in the xanthophyll cycle and was calculated as:
D E S = D i a t o x a n t h i n D i a t o x a n t h i n + D i a d i n o x a n t h i n

2.6. Oxidative Stress and Antioxidant Enzyme Assay

DNA damage was assessed using DNA alkaline precipitation adapted from Olive [57] by monitoring DNA concentration in the remaining supernatant. Samples were mixed with 2% SDS consisting of 50 mM NaOH, 100 mM Tris base, 100 mM EDTA and 105 mL ultra-pure water. In addition, 0.12 M KCl was added to the mixture and incubated at 60 °C for 10 min and cooled in an ice bath for 15 min. Samples were centrifuged at 8000× g for 5 min at 4 °C. The supernatant was removed and 150 μL of DNA concentration was mixed with fluorescent Hoechst dye (150 μL, 1 μg mL−1 in 0.1 M K-phosphate buffer, pH 7.4), loaded into a microtiter plate (XPTO, non-binding), and fluorescence was measured at 360/460 nm of excitation and emission wavelength for 1 min using a Sinergy HT Microplate Reader (BioTek Instruments, Winooski, VT, USA). DNA damage (DNAd) was denoted as μg DNA per mg of total protein.
Lipid peroxidation (LPO) was evaluated according to Ohkawa et al. [58] as a measure of oxidative stress, whereby membrane lipid polyunsaturated fatty acid peroxides and thiobarbituric acid reactive substances (TBARS) degradation products react with 2-thiobarbituric acid (TBA). Samples (150 μL) were mixed with TCA 12%, TBA 0.73% Tris-HCl (pH 7.4), TBA 0.73% and 0.1 mM EDTA (150 μL). The samples were incubated at 97 °C for 60 min. Subsequently, they were cooled for 30 min and centrifuged at 13,400× g for 3 min at 25 °C. The sample was loaded into the 96-well microtiter plate and the concentration of TBARS was read at 535 nm (ε = 1.56 × 10⁵ M−1 cm−1) using the absorbance microplate reader. LPO was determined as nmol of TBARS produced per mg of total protein.
Total protein content followed the assay from Bradford [59], in which bovine serum albumin was used as a standard. Samples (4 μL sample tissue and 36 μL ultra-pure water) were added with 250 μL of Sigma Bradford solution into 96-well microtiter plates, and the absorbance was read at 595 nm with an absorbance microplate reader after 15 min of dark incubation at 25 °C. The calibration standard curve was obtained using dilution solution (0–10 μL standard protein solution bovine serum albumin (BSA) standards and 0–10 μL ultra-pure water) and Bradford solution (250 μL).
Catalase (CAT), an enzyme which protects the cell from ROS damage, was measured according to Aebi [60]. Hydrogen peroxide (150 μL 30 M H2O2 in 130μL 50 mM KH2PO4 buffer, pH 7) was added to each sample (20 μL) into the 96-well microtiter plate. The consumption of H2O2 and decrease in absorbance at 240 nm (ε = −39.4 mM−1 cm−1) was measured using the absorbance microplate reader. The CAT activity was compared with calibration and is denoted as μmol min−1 mg−1 of total protein.
Superoxide dismutase (SOD), another enzyme which protects the cell from ROS damage, was assayed following McCord and Fridovich [61] and modified according to Lima et al. [62] for 96-well microplate reading. SOD activity was determined using sample (10 μL), reaction mix (140 μL, 50 mM phosphate buffer (pH 7.8), 0.1 mM EDTA, 1.5 mM hypoxanthine, 0.15 mM cytochrome c), 30 mU ml−1 xanthine oxidase (60 μL) and the absorbance measured at 550 nm in a microplate reader. The reaction occurs when the xanthine oxidase/hypoxanthine system reduces the cytochrome c, indicating the inhibition of cytochrome c reduction by 50% by one unit of SOD enzyme. SOD activity was denoted as U mg−1 of total protein content.

2.7. Statistical Analyses

We used generalized linear models (GLM) with Gaussian or gamma family to determine the probability distribution of differences between the two treatment groups adopted from Zuur et al. [63]. Gamma family GLMs were used for rapid light curves variables (RLC) and Kautsky cuves (only M0, N, PG). Obtained values from each analysis have been analysed as response variables, and the treatment groups were used as predictor variables. The assumptions of the models (e.g., independence, normality and homogeneity of variance) were graphically verified [63]. Significance of the GLM was assumed when the probability was lower than 0.05 and was confirmed using Type-II test sum of squares using Anova function from the car package [64] in statistical software RStudio ver. 4.0.3 [65]. The results from the GLM statistical analyses for each variable are shown in Table 2.

3. Results

3.1. Photobiological Response

After the experimental period, no significant changes were observed in the maximum ETR (ETRmax), light saturation (EK), photosynthetic (α) and respiratory (β) efficiency derived from rapid light curves (Table 2 and Table S2) in corals exposed to hypoxia.
Observed fluorescence parameters (Figure 1) resulted in a significant reduction in oxidized pool size (Area) under hypoxic conditions. However, the reaction centre turnover rate (N) and the energy needed to close all reaction centres remained stable (SM). In contrast, the net rate of PS II reaction centres closure (M0) showed a significant increase under hypoxia.
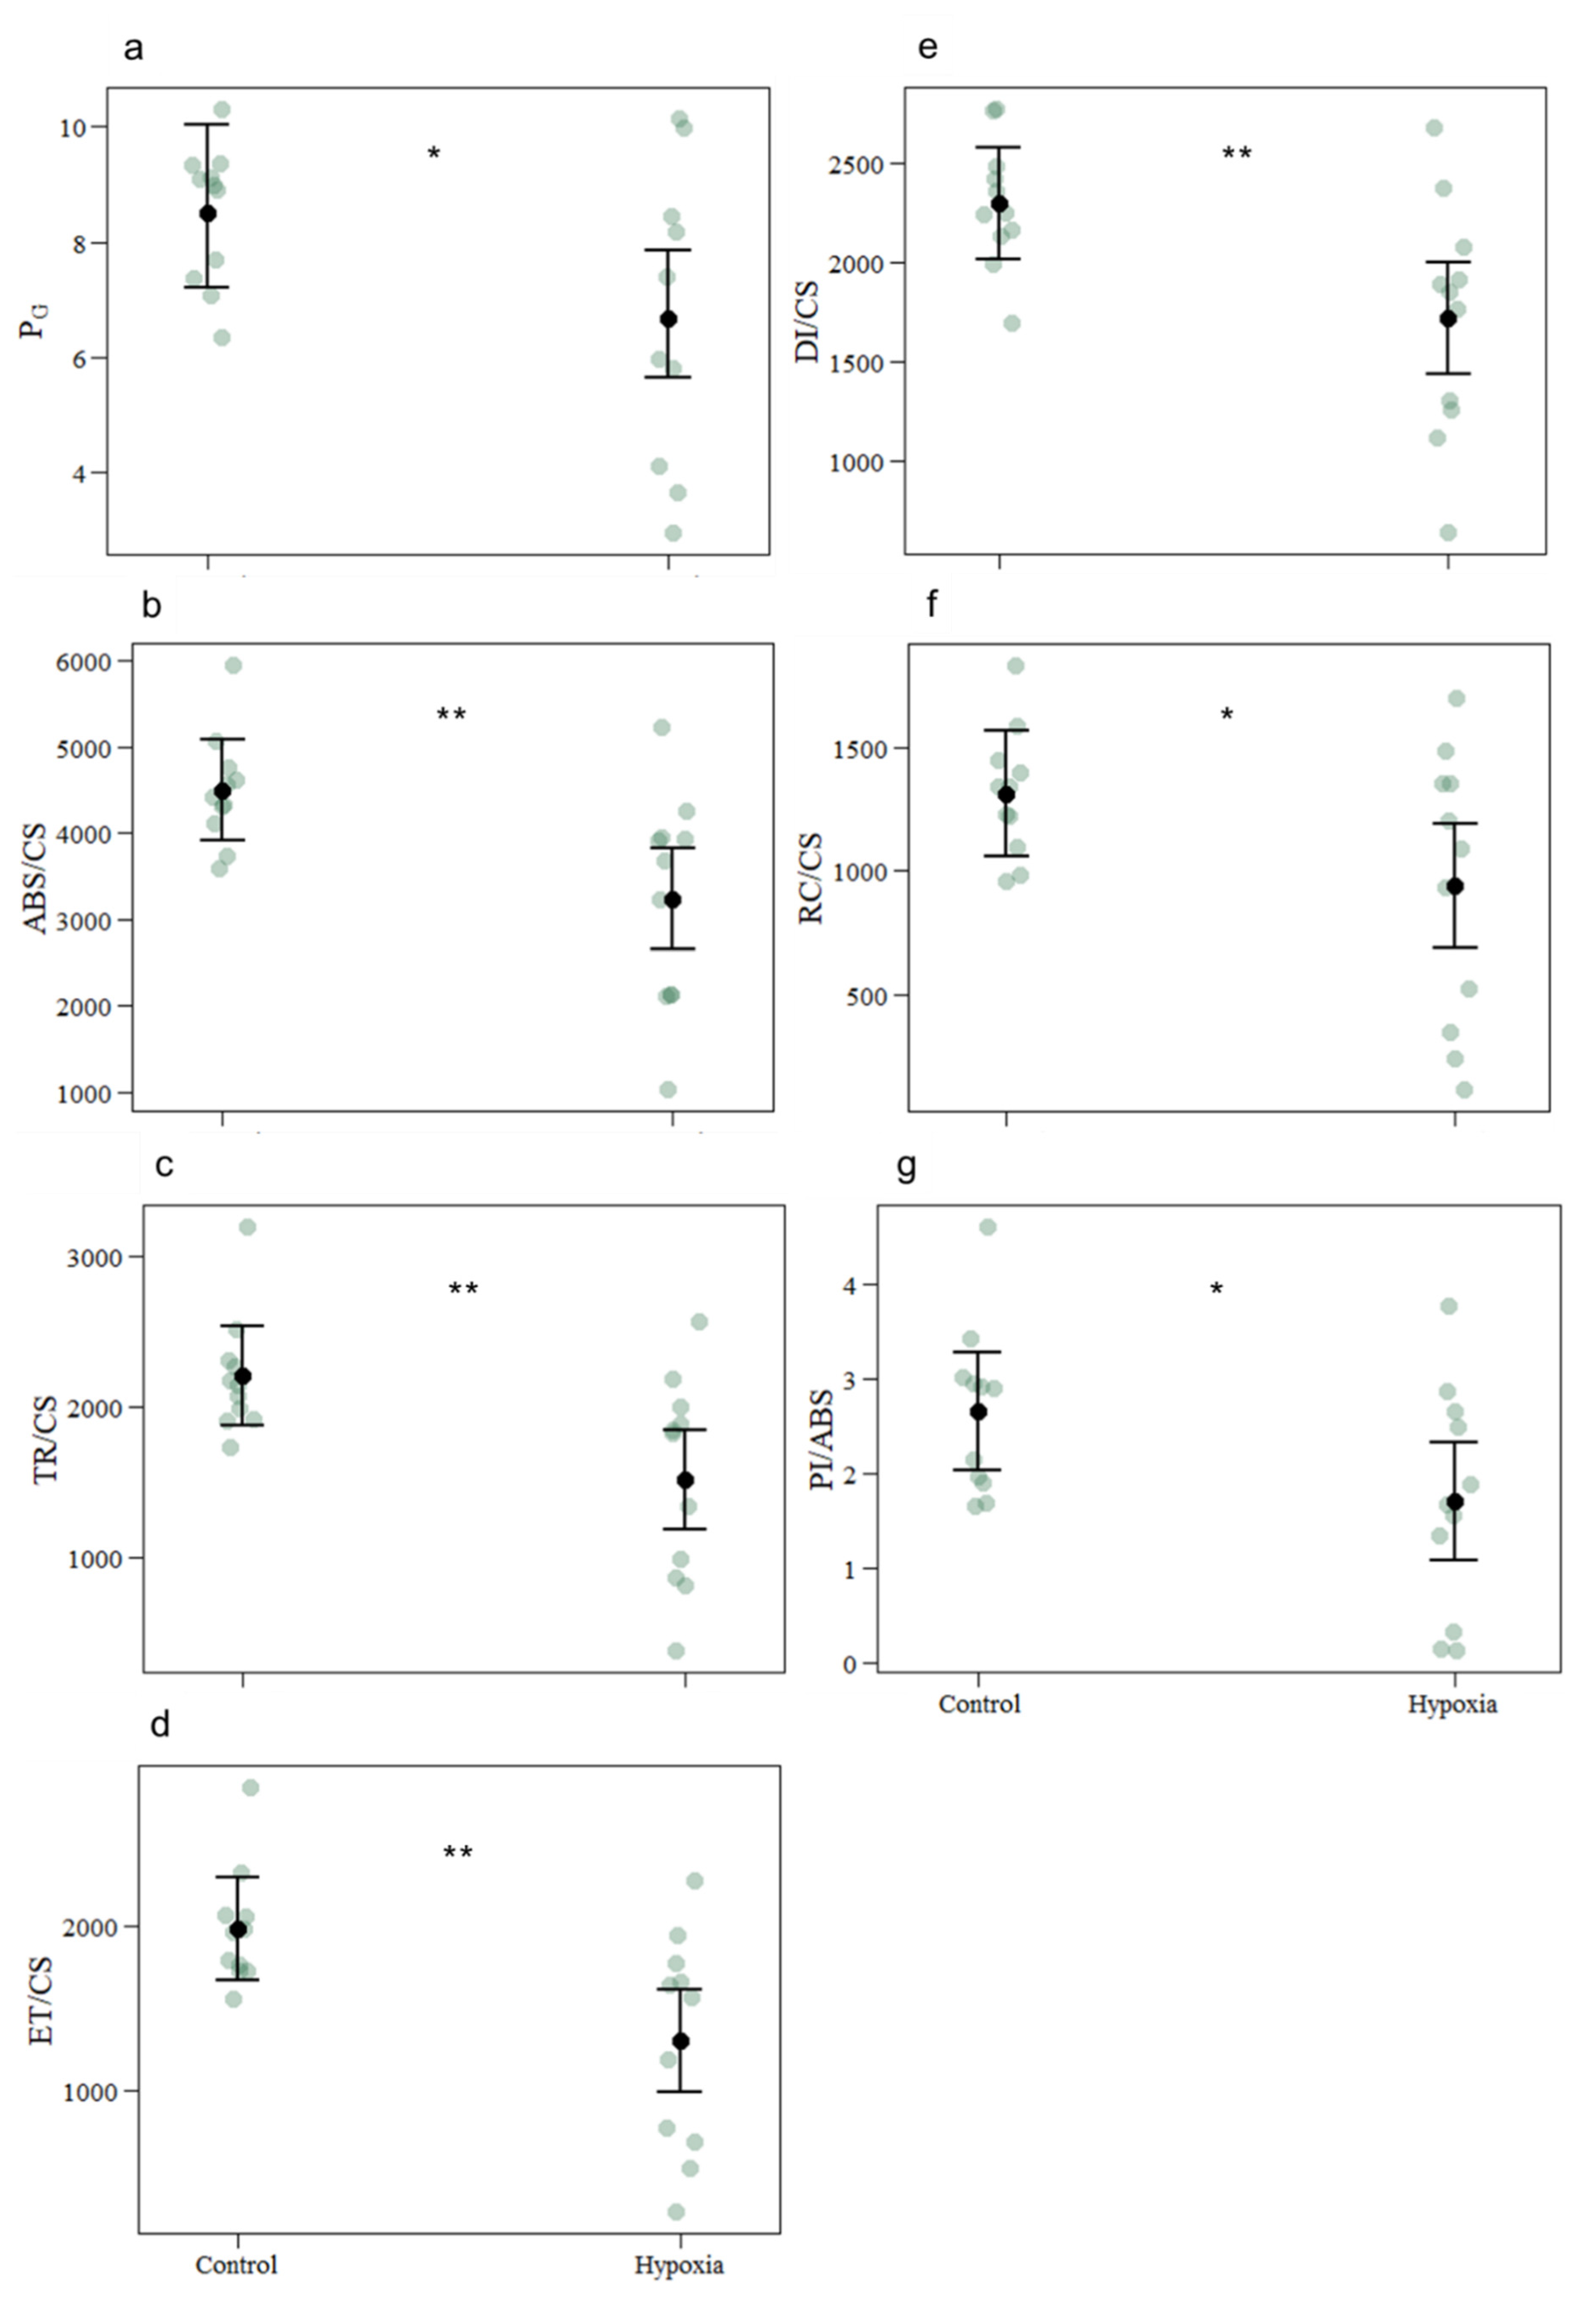
Contrarily to the values obtained from RLCs, several significant changes from JIP-test results (Figure 2) were detected (per cross-section). These values represent main phenomenological energetic fluxes that involve photochemical processes, from light-harvesting to its dissipation. There was a significant reduction in connectivity between the two PS II units (PG) and energy absorption by the PS II antennae (ABS/CS). Consistently with the ABS/CS results, the hypoxia induced a significant decrease in the effectively trapped energy flux in the PS II (TR/CS) and the energy flux transport in the electronic transport chain (ETC) (ET/CS). Concomitantly, a significant reduction was observed in energy dissipation flux (DI/CS) and the number of oxidized PS II reaction centres (RC/CS). The reaction centre density within the PS II antenna chlorophyll bed (RC/ABS) demonstrated no significant differences. Finally, the performance index (PI/ABS) exhibited a significant reduction under hypoxia.

3.2. Pigment Content

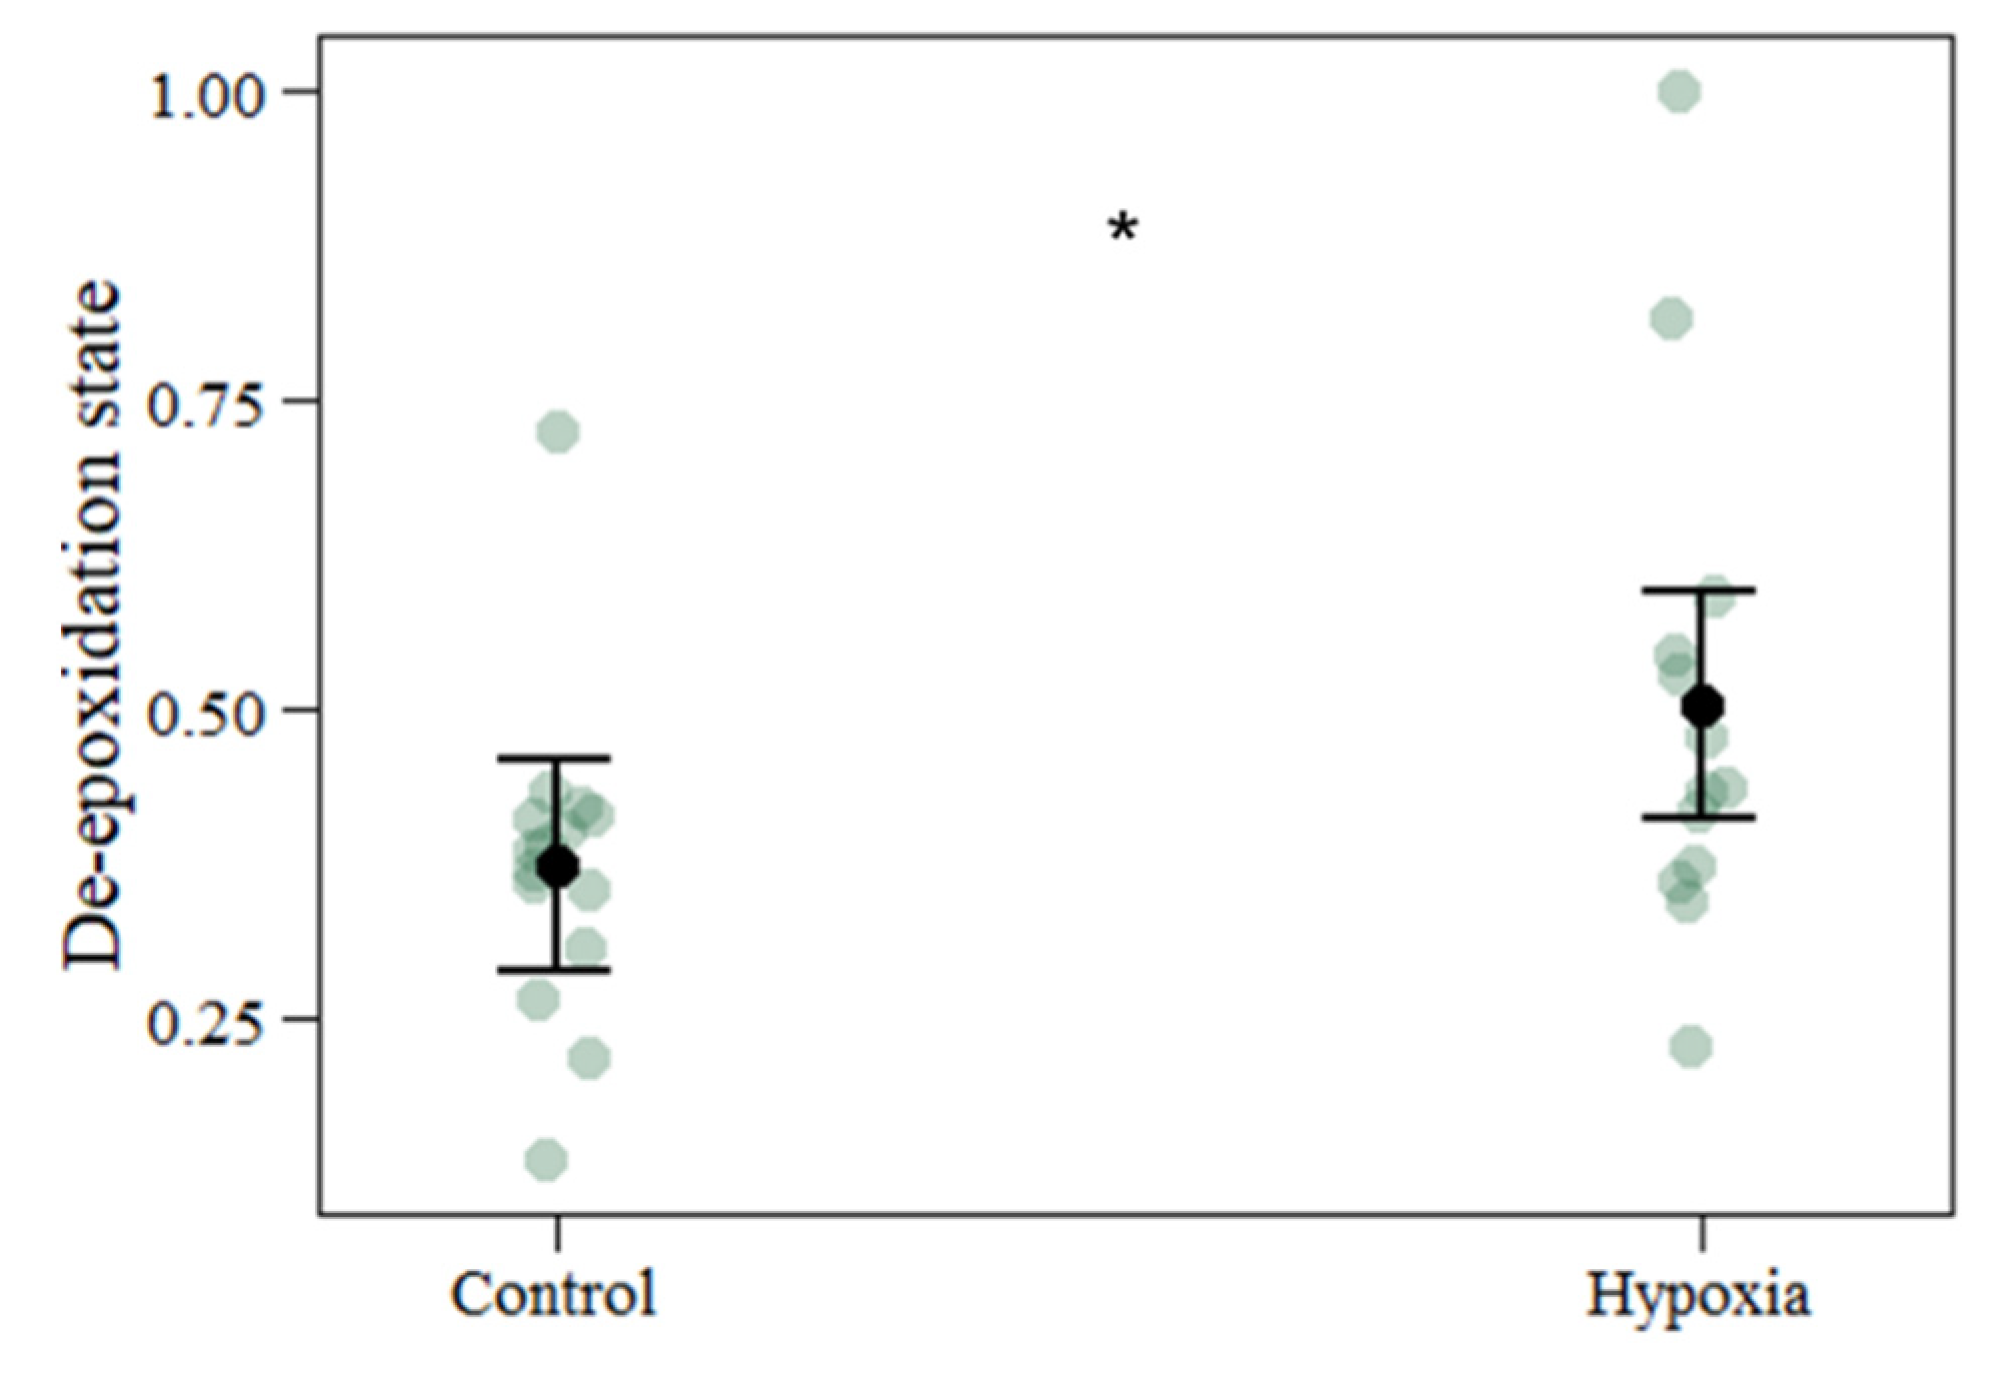
Pigment analyses (Table 2 and Table S3), performed as an oxidative stress biomarker, revealed no significant differences between the hypoxic and control treatment group. The pigment assay involved the quantification of chlorophyll a, chlorophyll c2, pheophytin a, β-carotene, diadinoxanthin, diatoxanthin and peridinin. However, the de-epoxidation state (Figure 3), entailing conversion from diadinoxanthin to diatoxanthin, was significantly increased under the overnight hypoxia treatment.

3.3. Oxidative Stress Biomarkers

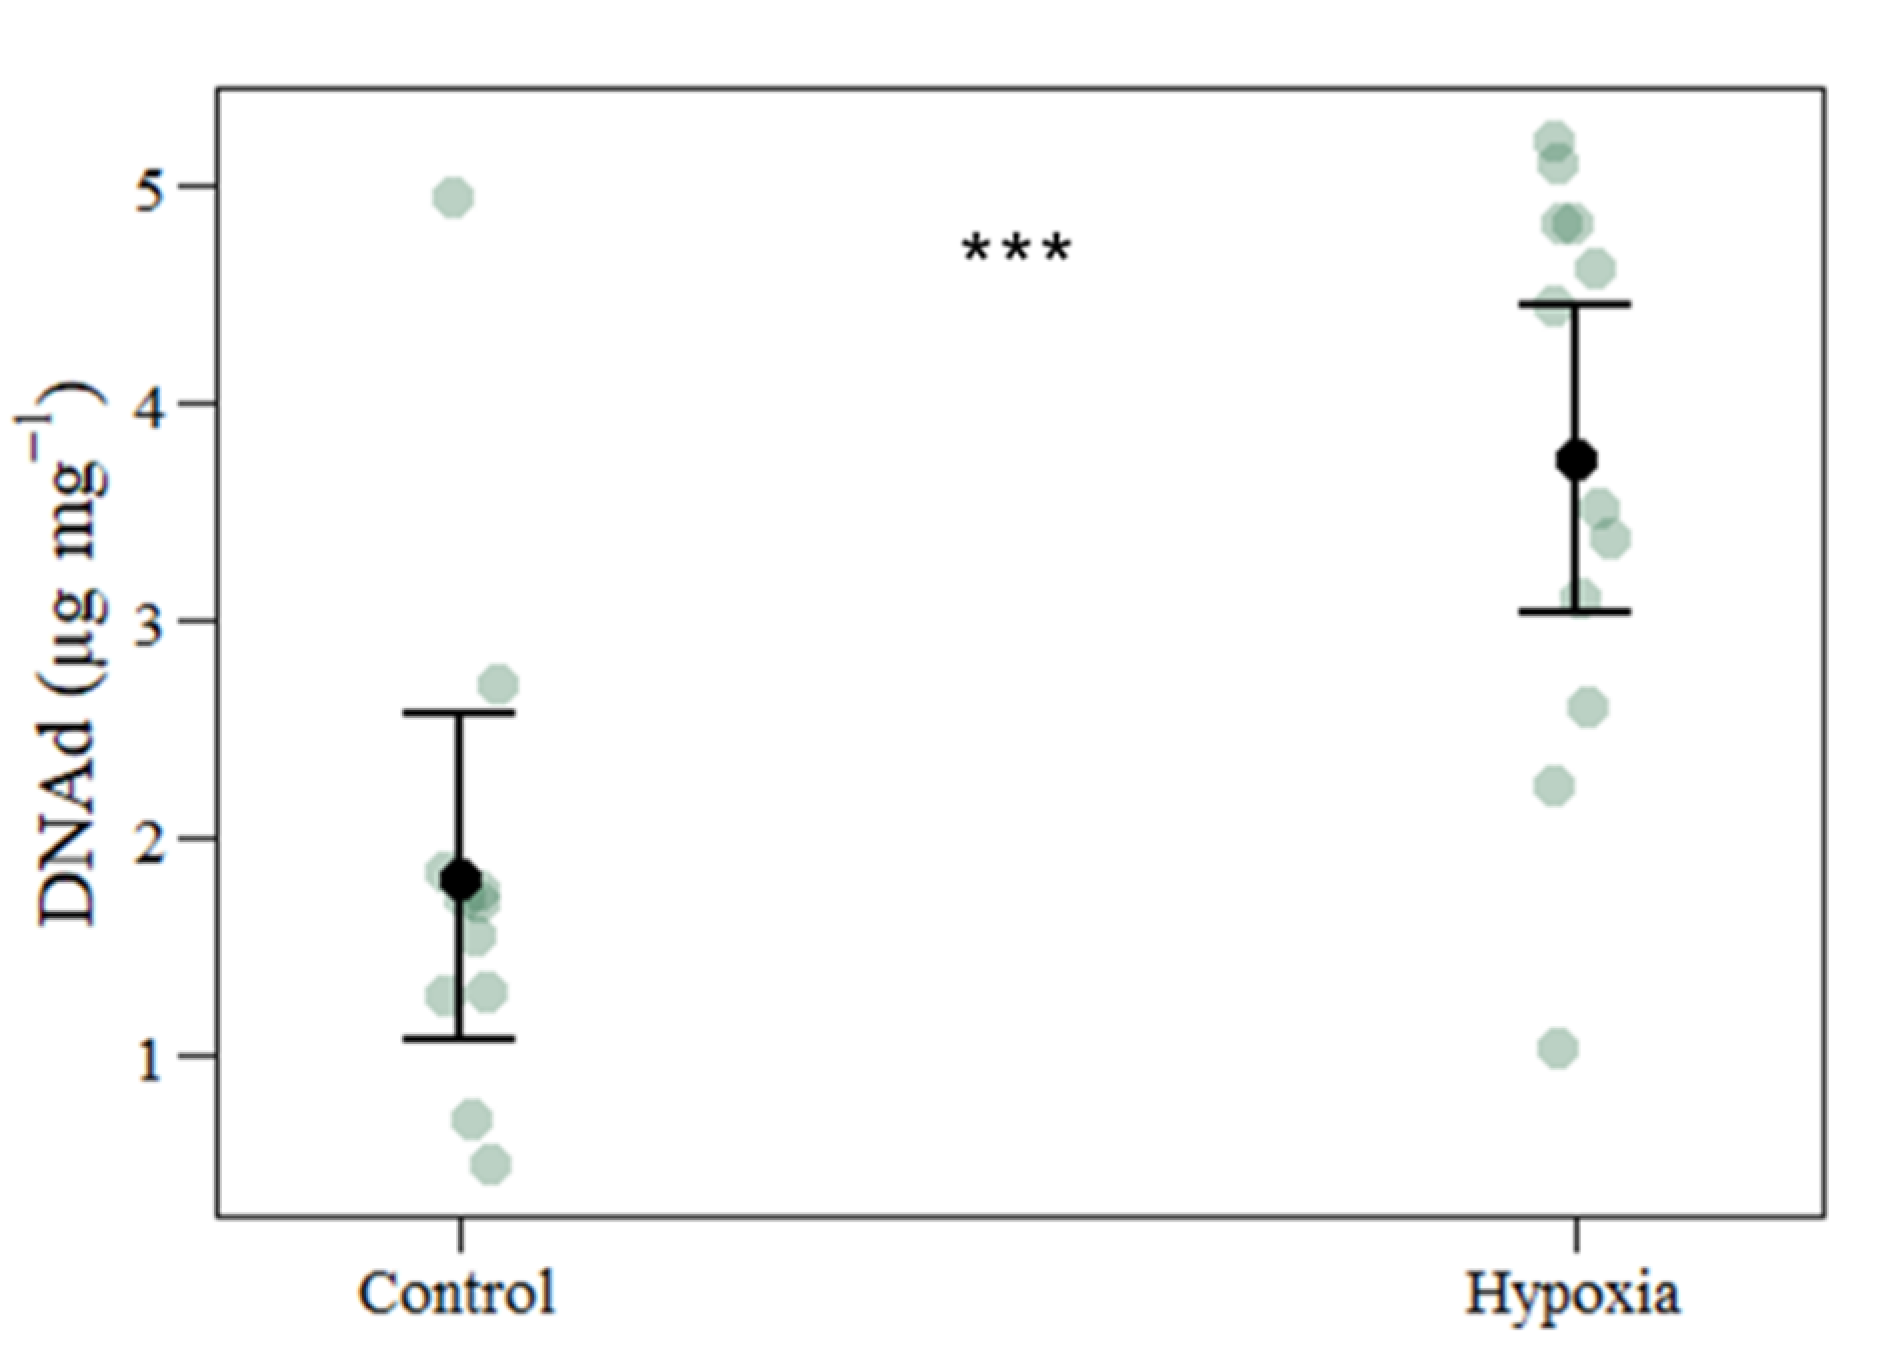
Regarding cellular damage (Table 2), there was a significant increase in DNA damage (Figure 4) under hypoxia, while the LPO demonstrated no changes among the treatment groups. Protein content was assessed as enzymatic antioxidant response (Table 2) to disclose the potential defence mechanisms against abiotic stress; however, no differences were observed between the two treatment groups. Considering SOD and CAT activities (Table 2 and Table S4), there were no changes between the control and hypoxia treatments.

4. Discussion

Severe decreases in nocturnal DO concentrations have been documented in Australia due to warming, which decreases oxygen solubility and increases the rate of biological oxygen consumption. In certain regions of the Caribbean, it is also known that oxygen levels may go below 2 mg/L as a result of anthropogenic eutrophication and nutrient input, and these hypoxic episodes usually last several days [10,15,17,36,43,66]. Acropora coral species are known to exhibit high susceptibility to climate change, including ocean warming and deoxygenation [10,15,27,34,67,68]. Symbiodiniaceae produce oxygen that corals utilize to maintain sufficient oxygen concentrations in their tissue and surrounding of the coral. The coral-algal interaction enables corals to cope with decreased oxygen concentrations to a certain extent by the nutrient and metabolite exchange [10,26].
Symbiodiniaceae provide corals with most of the required energy by producing ATP from NADPH at the light-harvesting complexes through electron transport chain (ETC) between photosystem II (PS II) and photosystem I located in the chloroplasts thylakoid membrane [69]. Previous studies found that the oxidative stress that emerges from hypoxia induces a decrease in photosynthetic electron transport and PS II reaction centres’ efficiency. Hence, photosynthetic defence mechanisms are responsible for preventing excess excitation energy accumulation, which is the source of high ROS production that damages lipids, proteins and pigments [70,71].
The present study assessed the effects of nocturnal hypoxia in photochemical energy fluxes at the oxygen-evolving complexes. While there were no changes in photosynthetic (α) or respiratory (β) efficiency, the photochemical activity reduction was caused by the impairment of the electron transport and thus a decrease in the electron transport energy flux, as shown by the significant change in connectivity between the PS II antennae (PG) in samples exposed to nocturnal hypoxia [52,72]. Decreased connectivity has cascading effects on subsequent electron transport due to reduced PS II antennae energy transduction. This was evident in the phenomenological energy fluxes measured per excited cross-section (CS) of the photosynthetic symbionts [53]. The reduction in the pigment antenna absorption of the photon flux (ABS/CS) and the decrease in the energy dissipation (DI/CS) led to an insufficient amount of transported energy to the reaction centres (ET/CS). Despite that, the number of transferred electrons in the ETC (N) was unchanged. Nonetheless, there was an increase in the demand for light-harvesting to tackle the remaining energy depletion [73]. Following the diminished absorption energy flux, the reduced reaction centres (RC/CS) density explains the lowered amounts of energy absorbed and trapped by the PS II [54,74]. An increase in the net rate of closure of all PS II RC (M0) could account for light absorption energy flux preservation. The efficiency of the harvested energy could be explained by the decrease in reaction centre density and trapped electrons at PS II (TR/CS) [52]. Regardless, the change in energy required to close all the RCs (SM) was unaltered. However, the reduction in oxidized quinone pool size (Area) supports the decrease in the electron transport energy flux, which involves electron transport from plastoquinol to end receptors of PS I [54]. Due to the reduced transport of excessive energy with limited oxidized quinone pool size, this could have altered PS II efficiency [73]. Furthermore, the reduced need for redox potential dissipation produced during light-harvesting is due to the lowered energy fluxes [52]. According to Ulstrup et al. [75], symbiotic malfunction of the photosynthetic apparatus of Pocillopora damicornis, when subjected to 0% air-saturation, demonstrated similar photochemical responses to those exhibited from the decline and changes in the JIP-test values. This could be a result of a reduction in electron receptors of PS II, the cycle of the electron transport encompassing the PS I, or photorespiration.
Hypoxic conditions may affect the behaviour and function of PS II on account of the decreased trapped energy amounts and lower energy flux to the ETC, followed by less excitation energy dissipation and lower performance index (PI/ABS) [76]. As suggested by Finelli et al. [77], depleted oxygen concentrations (0.3% air-saturation) in an environment without flow lead to a decrease in photosynthetic activity (caused by the excess photo dissipation from photorespiration) in the coral Agaricia agaricites. Mass et al. [78] also support this by showing that photorespiration impeded photosynthesis in the coral Favia veronica, the red alga Gracilaria cornea and the seagrass Halophila stipulacea under lowered oxygen conditions.
In the present study, pigment composition assays did not exhibit any differences in the contents of chlorophyll a, chlorophyll c2, peridinin that are typical for Symbiodiniaceae [42], as well as for β-carotene, diadinoxanthin, diatoxanthin and pheophytin a under both treatments. Among these pigments, carotenoids are known to act as ROS quenchers in regard to their photoprotective functions [40,79]. Their involvement in the antioxidant activity, xanthophyll cycle and quenching of 1O2 constitute the protection against oxidative stress, with β-carotene having the highest relevance in ROS scavenging [69,80,81]. Carotenoid pool de-epoxidation state as a photoprotection mechanism against photo-oxidative damage defends the thylakoid membrane in the chloroplasts when the excitation energy at PS II exceeds the ETC capabilities and increases the non-photochemical quenching [60,72]. This process involves the conversion of diadinoxanthin to diatoxanthin in order to dissipate underutilized energy and release its excess as heat by xanthophyll pigments during the de-epoxidation reaction [73,81,82]. Here, we showed an observable increase in carotenoid content in the hypoxic treatment group.
The production of ROS is capable of inducing cellular damage, should the coral defence system fail to suppress their production and quench the accumulation [37,83,84]. Hydrogen peroxide (H2O2) is an oxygen reactive intermediate that can harm nuclear and plastidial DNA. Breakdown of DNA results in mutations, deletions and other genetic complications due to Fenton reactions that produce hydroxyl radical as opposed to H2O2 and O2 [84,85]. In the present study, DNA damage was notably higher under hypoxia, in opposition to the unaltered results obtained from the antioxidant enzyme activity. This may be a consequence of the ROS build-up in the intracellular space that triggers DNA degradation.
Another threat to cellular function is oxidative damage, such as lipid peroxidation (LPO), which deteriorate to aldehydes and hydrocarbons when the PS II is over-excited and excess energy accumulates, prompting the production of ROS, namely superoxide radicals [69,84,86]. However, the LPO assay did not reveal any differences between treatments, which is in accordance with the antioxidant defence responses. Moreover, oxidative stress is known to inflict the destruction of proteins, leading to deformation of amino acids, peptide chain fragmentation, electrical charge alteration and an increase in the predisposition to dispose and degrade amino acids [84,85]. Exposure to nocturnal hypoxia can increase the activity of the defence system of enzymatic antioxidants as an effective strategy to overcome increased ROS production. Superoxide dismutase (SOD) is linked to the antioxidant defence mechanisms, which is responsible for the catalysis of superoxide radicals. The latter promote the free radical oxidation chain that eventually leads to the inactivation of enzymes and the formation of other ROS. The main reason for increased ROS production is accelerated mitochondrial respiration rate since the hypoxia limits the oxygen supply [87]. However, another source of superoxide radical lies in the electron acceptor of PS I [69]. Such an increasing trend in SOD activity was not detected in this study, which is consistent with Teixeira et al. [88], suggesting that mitochondrial damage was absent. In contrast, the mitochondrial damage would cause decreased respiration and superoxide radical production during the oxidative phosphorylation process located in the cytochrome pathway of the mitochondrial ETC [69]. There is evidence of higher cellular reoxygenation injury in Acropora nobilis and Alveopora verrilliana, while the SOD activity was lower when exposed to hypoxia. In addition, seemingly the SOD activity is positively associated with chlorophyll content in symbiotic anemones Anthopleura elengantissima, because photosynthetic production of O2 and O2 in zooxanthellae regulates SOD activity [89]. These prior studies support the findings of this study, where SOD and chlorophyll content did not differ under oxidative stress.
To preserve symbiosis, it is necessary for catalase (CAT) activity to have a high sensitivity to both oxidative and temperature stress [84]. CAT activity showed no variation between treatments, which is consistent with the LPO levels, chlorophyll concentrations and SOD activity. While there is a strong correlation of antioxidant enzyme responses and chlorophyll content, other enzymes (i.e., peroxidases), antioxidants (i.e., ascorbic acid, glutathione, tocopherol and carotenoids) and fluorescent proteins could prevent the deleterious effects of ROS as antioxidant defence mechanisms [84,86].

5. Conclusions

The findings of this study suggest that the coral Acropora spp. exhibited resilience to nocturnal low oxygen conditions. Indeed, corals showed an increase in oxidative stress with observable impacts on the photosynthetic apparatus functioning and DNA. Different metabolic and physiological processes are executed by cells of the host and symbionts to limit stress and prevent death due to ROS production and accumulation. However, the antioxidant defence system was not stimulated under hypoxic stress conditions in this study. However, it is important to note that corals could have exceed the threshold of physiological performance under more prolonged hypoxic conditions. Climate change can severely affect coral reefs, and, with decreasing oxygen concentration trends and more frequent hypoxic events, there is a high probability of losing a massive part of coral reefs in the Anthropocene [25,32]. Coral bleaching is a biological indicator of the extreme environmental perturbation effects related to climate change driven oxygen oscillations that force many marine species towards their survival threshold and hence reduce their ability to develop the crucial tolerance [23,90].

Supplementary Materials

The following are available online at https://www.mdpi.com/article/10.3390/biology11071068/s1, Table S1: Seawater physicochemical parameters in all experimental setups. Table S2: Analysis of deviance table (Type II tests) for the generalized mixed models for photobiological responses of corals exposed to control and hypoxic treatment. Table S3: Analysis of deviance table (Type II tests) for the generalized mixed models for pigment composition analysis of corals exposed to control and hypoxic treatment. Table S4: Analysis of deviance table (Type II tests) for the generalized mixed models for oxidative stress biomarker analysis of corals exposed to control and hypoxic treatment.

Author Contributions

Conceptualization, M.D., J.R.P., B.D. and R.R.; Methodology, M.D., M.F., V.F.F. and B.D.; Validation, M.D. and R.R.; Formal analysis, M.D., J.R.P. and R.R.; Investigation, M.D., J.R.P., M.F., M.B., V.L. and S.S.; Resources, T.R. and R.R.; Data curation, M.D., M.F., V.F.F. and B.D.; Writing—original draft preparation, M.D., B.D. and R.R.; Writing—review and editing, M.D., J.R.P., T.R., M.F., M.B., V.L., S.S., V.F.F., B.D. and R.R.; Visualization, M.D. and J.R.P.; Supervision, B.D. and R.R.; Project administration, R.R.; Funding acquisition, T.R. and R.R. All authors have read and agreed to the published version of the manuscript.

Funding

The authors would like to thank Fundação para a Ciência e a Tecnologia (FCT) for funding the research via the project grant UIDB/04292/2020 and project ASCEND (PTDC/BIA-BMA/28609/2017), co-funded by Programa Operacional Regional de Lisboa, Portugal 2020 and the European Union within the project LISBOA-01-0145-FEDER-028609. The authors would also like to thank to FCT for funding MARE (Marine and Environmental Sciences Centre, UIDB/04292/2020 and UIDB/04292/2020) and ARNET (Aquatic Research Infrastructure Network Associated Laboratory, LA/P/0069/2020). B.D., V.F.F. and T.R. were supported by FCT research contracts (CEECIND/00511/2017, 2021.00244.CEECIND, DL57/2016/CP1479/CT0023).

Institutional Review Board Statement

Not applicable.

Informed Consent Statement

Not applicable.

Data Availability Statement

The statistical analysis code script and dataset are available in the repository, 10.6084/m9.figshare.19077413.

Conflicts of Interest

The authors declare no conflict of interest.

References

  1. Bopp, L.; Resplandy, L.; Orr, J.C.; Doney, S.C.; Dunne, J.P.; Gehlen, M.; Halloran, P.; Heinze, C.; Ilyina, T.; Séférian, R.; et al. Multiple Stressors of Ocean Ecosystems in the 21st Century: Projections with CMIP5 Models. Biogeosciences 2013, 10, 6225–6245. [Google Scholar] [CrossRef] [Green Version]
  2. Camp, E.F.; Schoepf, V.; Mumby, P.J.; Hardtke, L.A.; Rodolfo-Metalpa, R.; Smith, D.J.; Suggett, D.J. The Future of Coral Reefs Subject to Rapid Climate Change: Lessons from Natural Extreme Environments. Front. Mar. Sci. 2018, 5, 4. [Google Scholar] [CrossRef] [Green Version]
  3. Sampaio, E.; Santos, C.; Rosa, I.C.; Ferreira, V.; Pörtner, H.-O.; Duarte, C.M.; Levin, L.A.; Rosa, R. Impacts of Hypoxic Events Surpass Those of Future Ocean Warming and Acidification. Nat. Ecol. Evol. 2021, 5, 311–321. [Google Scholar] [CrossRef] [PubMed]
  4. Pörtner, H.-O.; Roberts, D.C.; Masson-Delmotte, V.; Zhai, P.; Tignor, M.; Poloczanska, E.; Mintenbeck, K.; Alegría, A.; Nicolai, M.; Okem, A.; et al. (Eds.) IPCC, 2019: Summary for Policymakers. In IPCC Special Report on the Ocean and Cryosphere in a Changing Climate; Cambridge University Press: Cambridge, UK; New York, NY, USA, 2022; pp. 3–35. [Google Scholar] [CrossRef]
  5. Gattuso, J.-P.; Magnan, A.K.; Bopp, L.; Cheung, W.W.L.; Duarte, C.M.; Hinkel, J.; Mcleod, E.; Micheli, F.; Oschlies, A.; Williamson, P.; et al. Ocean Solutions to Address Climate Change and Its Effects on Marine Ecosystems. Front. Mar. Sci. 2018, 5, 337. [Google Scholar] [CrossRef] [Green Version]
  6. Henson, S.A.; Beaulieu, C.; Lampitt, R. Observing Climate Change Trends in Ocean Biogeochemistry: When and Where. Glob. Chang. Biol. 2016, 22, 1561–1571. [Google Scholar] [CrossRef] [PubMed] [Green Version]
  7. Levin, L.A.; Le Bris, N. The Deep Ocean under Climate Change. Science 2015, 350, 766–768. [Google Scholar] [CrossRef] [PubMed] [Green Version]
  8. Torda, G.; Donelson, J.M.; Aranda, M.; Barshis, D.J.; Bay, L.; Berumen, M.L.; Bourne, D.G.; Cantin, N.; Foret, S.; Matz, M.; et al. Rapid Adaptive Responses to Climate Change in Corals. Nat. Clim. Chang. 2017, 7, 627–636. [Google Scholar] [CrossRef]
  9. Sørensen, C.; Munday, P.L.; Nilsson, G.E. Aerobic vs. Anaerobic Scope: Sibling Species of Fish Indicate That Temperature Dependence of Hypoxia Tolerance Can Predict Future Survival. Glob. Chang. Biol. 2014, 20, 724–729. [Google Scholar] [CrossRef]
  10. Hughes, D.J.; Alderdice, R.; Cooney, C.; Kühl, M.; Pernice, M.; Voolstra, C.R.; Suggett, D.J. Coral Reef Survival under Accelerating Ocean Deoxygenation. Nat. Clim. Chang. 2020, 10, 296–307. [Google Scholar] [CrossRef]
  11. Raj, K.D.; Mathews, G.; Obura, D.O.; Laju, R.L.; Bharath, M.S.; Kumar, P.D.; Arasamuthu, A.; Kumar, T.K.A.; Edward, J.K.P. Low Oxygen Levels Caused by Noctiluca Scintillans Bloom Kills Corals in Gulf of Mannar, India. Sci. Rep. 2020, 10, 22133. [Google Scholar] [CrossRef]
  12. Altieri, A.H. Dead zones enhance key fisheries species by providing predation refuge. Ecology 2008, 89, 2808–2818. [Google Scholar] [CrossRef]
  13. Breitburg, D.; Levin, L.A.; Oschlies, A.; Grégoire, M.; Chavez, F.P.; Conley, D.J.; Garçon, V.; Gilbert, D.; Gutiérrez, D.; Isensee, K.; et al. Declining Oxygen in the Global Ocean and Coastal Waters. Science 2018, 359, eaam7240. [Google Scholar] [CrossRef] [PubMed] [Green Version]
  14. Bijma, J.; Pörtner, H.-O.; Yesson, C.; Rogers, A.D. Climate Change and the Oceans–What Does the Future Hold? Mar. Pollut. Bull. 2013, 74, 495–505. [Google Scholar] [CrossRef]
  15. Haas, A.F.; Smith, J.E.; Thompson, M.; Deheyn, D.D. Effects of Reduced Dissolved Oxygen Concentrations on Physiology and Fluorescence of Hermatypic Corals and Benthic Algae. PeerJ 2014, 2, e235. [Google Scholar] [CrossRef] [PubMed]
  16. Klein, S.G.; Steckbauer, A.; Duarte, C.M. Defining CO2 and O2 Syndromes of Marine Biomes in the Anthropocene. Glob. Chang. Biol. 2020, 26, 355–363. [Google Scholar] [CrossRef] [PubMed]
  17. Vaquer-Sunyer, R.; Duarte, C.M. Thresholds of Hypoxia for Marine Biodiversity. Proc. Natl. Acad. Sci. USA. 2008, 105, 15452–15457. [Google Scholar] [CrossRef] [PubMed] [Green Version]
  18. Diaz, R.J.; Breitburg, D.L. Chapter 1 The Hypoxic Environment. In Fish Physiology; Elsevier: Amsterdam, The Netherlands, 2009; Volume 27, pp. 1–23. ISBN 978-0-12-374632-0. [Google Scholar]
  19. Keeling, R.F.; Körtzinger, A.; Gruber, N. Ocean Deoxygenation in a Warming World. Annu. Rev. Mar. Sci. 2010, 2, 199–229. [Google Scholar] [CrossRef] [PubMed] [Green Version]
  20. Oschlies, A.; Brandt, P.; Stramma, L.; Schmidtko, S. Drivers and Mechanisms of Ocean Deoxygenation. Nat. Geosci. 2018, 11, 467–473. [Google Scholar] [CrossRef]
  21. Rabalais, N.N.; Díaz, R.J.; Levin, L.A.; Turner, R.E.; Gilbert, D.; Zhang, J. Dynamics and Distribution of Natural and Human-Caused Hypoxia. Biogeosciences 2010, 7, 585–619. [Google Scholar] [CrossRef] [Green Version]
  22. Stramma, L.; Johnson, G.C.; Sprintall, J.; Mohrholz, V. Expanding Oxygen-Minimum Zones in the Tropical Oceans. Science 2008, 320, 655–658. [Google Scholar] [CrossRef] [PubMed] [Green Version]
  23. Altieri, A.H.; Harrison, S.B.; Seeman, J.; Collin, R.; Diaz, R.J.; Knowlton, N. Tropical dead zones and mass mortalities on coral reefs. Proc. Natl. Acad. Sci. USA. 2017, 114, 3660–3665. [Google Scholar] [CrossRef] [PubMed] [Green Version]
  24. Anthony, K.; Bay, L.K.; Costanza, R.; Firn, J.; Gunn, J.; Harrison, P.; Heyward, A.; Lundgren, P.; Mead, D.; Moore, T.; et al. New Interventions Are Needed to Save Coral Reefs. Nat. Ecol. Evol. 2017, 1, 1420–1422. [Google Scholar] [CrossRef] [PubMed]
  25. Dance, A. These Corals Could Survive Climate Change—and Help Save the World’s Reefs. Nature 2019, 575, 580–582. [Google Scholar] [CrossRef] [PubMed]
  26. D’Angelo, C.; Wiedenmann, J. Impacts of Nutrient Enrichment on Coral Reefs: New Perspectives and Implications for Coastal Management and Reef Survival. Curr. Opin. Environ. Sustain. 2014, 7, 82–93. [Google Scholar] [CrossRef] [Green Version]
  27. Munday, P.L. Habitat Loss, Resource Specialization, and Extinction on Coral Reefs: Specialization and extinction. Glob. Chang. Biol. 2004, 10, 1642–1647. [Google Scholar] [CrossRef]
  28. Pernice, M.; Hughes, D.J. Forecasting Global Coral Bleaching. Nat. Clim. Chang. 2019, 9, 803–804. [Google Scholar] [CrossRef]
  29. Bourne, D.; Iida, Y.; Uthicke, S.; Smith-Keune, C. Changes in Coral-Associated Microbial Communities during a Bleaching Event. ISME J. 2008, 2, 350–363. [Google Scholar] [CrossRef]
  30. Liao, B.; Xiao, B.; Li, Z. Coral Reef Ecosystem. In Symbiotic Microbiomes of Coral Reefs Sponges and Corals; Li, Z., Ed.; Springer: Berlin/Heidelberg, Germany, 2019; pp. 1–15. ISBN 978-94-024-1610-7. [Google Scholar]
  31. Raphael, A.; Dubinsky, Z.; Iluz, D.; Netanyahu, N.S. Neural Network Recognition of Marine Benthos and Corals. Diversity 2020, 12, 29. [Google Scholar] [CrossRef] [Green Version]
  32. Baird, A.H.; Bhagooli, R.; Ralph, P.J.; Takahashi, S. Coral Bleaching: The Role of the Host. Trends Ecol. Evol. 2009, 24, 16–20. [Google Scholar] [CrossRef]
  33. Suggett, D.J.; Smith, D.J. Coral Bleaching Patterns Are the Outcome of Complex Biological and Environmental Networking. Glob. Chang. Biol. 2020, 26, 68–79. [Google Scholar] [CrossRef]
  34. Zhu, B.; Wang, G.; Huang, B.; Tseng, C.K. Effects of Temperature, Hypoxia, Ammonia and Nitrate on the Bleaching among Three Coral Species. Chin. Sci. Bull. 2004, 49, 1923–1928. [Google Scholar] [CrossRef]
  35. Alva-Basurto, J.C.; Arias-González, J.E. Modelling the Effects of Climate Change on a Caribbean Coral Reef Food Web. Ecol. Modell. 2014, 289, 1–14. [Google Scholar] [CrossRef]
  36. Figuerola, B.; Grossman, E.L.; Lucey, N.; Leonard, N.D.; O’Dea, A. Millennial-scale Change on a Caribbean Reef System That Experiences Hypoxia. Ecography 2021, 44, 1270–1282. [Google Scholar] [CrossRef]
  37. Nelson, H.R.; Altieri, A.H. Oxygen: The Universal Currency on Coral Reefs. Coral Reefs 2019, 38, 177–198. [Google Scholar] [CrossRef]
  38. DeSalvo, M.K.; Estrada, A.; Sunagawa, S.; Medina, M. Transcriptomic Responses to Darkness Stress Point to Common Coral Bleaching Mechanisms. Coral Reefs 2012, 31, 215–228. [Google Scholar] [CrossRef]
  39. Nielsen, D.A.; Petrou, K.; Gates, R.D. Coral Bleaching from a Single Cell Perspective. ISME J. 2018, 12, 1558–1567. [Google Scholar] [CrossRef]
  40. Yakovleva, I.; Bhagooli, R.; Takemura, A.; Hidaka, M. Differential Susceptibility to Oxidative Stress of Two Scleractinian Corals: Antioxidant Functioning of Mycosporine-Glycine. Comp. Biochem. Physiol. Part B Biochem. Mol. Biol. 2004, 139, 721–730. [Google Scholar] [CrossRef]
  41. Grabb, K.C.; Kapit, J.; Wankel, S.D.; Manganini, K.; Apprill, A.; Armenteros, M.; Hansel, C.M. Development of a Handheld Submersible Chemiluminescent Sensor: Quantification of Superoxide at Coral Surfaces. Environ. Sci. Technol. 2019, 53, 13850–13858. [Google Scholar] [CrossRef]
  42. Oakley, C.A.; Davy, S.K. Cell Biology of Coral Bleaching. In Coral Bleaching; van Oppen, M.J.H., Lough, J.M., Eds.; Ecological Studies; Springer International Publishing: Berlin/Heidelberg, Germany, 2018; Volume 233, pp. 189–211. ISBN 978-3-319-75392-8. [Google Scholar]
  43. Nilsson, G.E.; Hobbs, J.P.A.; Ostlund-Nilsson, S. Tribute to PL Lutz: Respiratory ecophysiology of coral-reef teleosts. J. Exp. Biol. 2007, 210, 1673–1686. [Google Scholar] [CrossRef] [Green Version]
  44. Routley, M.H.; Nilsson, G.E.; Renshaw, G.M. Exposure to hypoxia primes the respiratory and metabolic responses of the epaulette shark to progressive hypoxia. Comp. Biochem. Physiol. A Mol. Int. Physiol. 2002, 131, 313–321. [Google Scholar] [CrossRef]
  45. Diaz, R.J. Overview of hypoxia around the world. J. Environ. Qual. 2001, 30, 275–281. [Google Scholar] [CrossRef] [PubMed]
  46. Forrest, D.R.; Hetland, R.D.; DiMarco, S.F. Multivariable statistical regression models of the areal extent of hypoxia over the Texas–Louisiana continental shelf. Environ. Res. Lett. 2011, 6, 045002. [Google Scholar] [CrossRef] [Green Version]
  47. Wu, R.S. Hypoxia: From molecular responses to ecosystem responses. Mar. Pollut. Bull. 2002, 45, 35–45. [Google Scholar] [CrossRef]
  48. Sarazin, G.; Michard, G.; Prevot, F. A rapid and accurate spectroscopic method for alkalinity measurements in sea water samples. Water Res. 1999, 33, 290–294. [Google Scholar] [CrossRef]
  49. Stirbet, A.; Lazár, D.; Kromdijk, J.; Govindjee, G. Chlorophyll a Fluorescence Induction: Can Just a One-Second Measurement Be Used to Quantify Abiotic Stress Responses? Photosynthecita 2018, 56, 86–104. [Google Scholar] [CrossRef]
  50. Strasser, R.J.; Tsimilli-Michael, M.; Srivastava, A. Analysis of the chlorophyll a fluorescence transient. In Hlorophyll a Fluorescence: A Singature of Photosynthesis; Papageorgiou, C., Govindjee, Eds.; Springer: Berlin/Heidelberg, Germany, 2004; pp. 321–362. ISBN 978-1-4020-3218-9. [Google Scholar]
  51. Strasser, R.J.; Srivastava, A.; Tsimilli-Michael, M. The fluorescence transient as a tool to characterize and screen photosynthetic samples. In Probing Photosynthesis: Mechanisms, Regulation and Adaptation; Yunus, M., Pathre, U., Mohanty, P., Eds.; Taylor and Francis: Boca Raton, FL, USA, 2000; pp. 445–483. [Google Scholar]
  52. Duarte, B.; Goessling, J.W.; Marques, J.C.; Caçador, I. Ecophysiological Constraints of Aster Tripolium under Extreme Thermal Events Impacts: Merging Biophysical, Biochemical and Genetic Insights. Plant Physiol. Biochem. 2015, 97, 217–228. [Google Scholar] [CrossRef] [PubMed]
  53. Duarte, B.; Pedro, S.; Marques, J.C.; Adão, H.; Caçador, I. Zostera Noltii Development Probing Using Chlorophyll a Transient Analysis (JIP-Test) under Field Conditions: Integrating Physiological Insights into a Photochemical Stress Index. Ecol. Indic. 2017, 76, 219–229. [Google Scholar] [CrossRef]
  54. Duarte, B.; Cabrita, M.T.; Gameiro, C.; Matos, A.R.; Godinho, R.; Marques, J.C.; Caçador, I. Disentangling the Photochemical Salinity Tolerance in Aster Tripolium L.: Connecting Biophysical Traits with Changes in Fatty Acid Composition. Plant Biol. J. 2017, 19, 239–248. [Google Scholar] [CrossRef]
  55. Torres-Pérez, J.L.; Guild, L.S.; Armstrong, R.A.; Corredor, J.; Zuluaga-Montero, A.; Polanco, R. Relative pigment composition and remote sensing reflectance of Caribbean shallow-water corals. PLoS ONE 2015, 10, e0143709. [Google Scholar] [CrossRef]
  56. Küpper, H.; Seibert, S.; Parameswaran, A. Fast, Sensitive, and Inexpensive Alternative to Analytical Pigment HPLC: Quantification of Chlorophylls and Carotenoids in Crude Extracts by Fitting with Gauss Peak Spectra. Anal. Chem. 2007, 79, 7611–7627. [Google Scholar] [CrossRef]
  57. Olive, P.L. DNA Precipitation Assay: A Rapid and Simple Method for Detecting DNA Damage in Mammalian Cells. Environ. Mol. Mutagen. 1988, 11, 487–495. [Google Scholar] [CrossRef] [PubMed]
  58. Ohkawa, H.; Ohishi, N.; Yagi, K. Assay for Lipid Peroxides in Animal Tissues by Thiobarbituric Acid Reaction. Anal. Biochem. 1979, 95, 351–358. [Google Scholar] [CrossRef]
  59. Bradford, M.M. A Rapid and Sensitive Method for the Quantitation of Microgram Quantities of Protein Utilizing the Principle of Protein-Dye Binding. Anal. Biochem. 1976, 72, 248–254. [Google Scholar] [CrossRef]
  60. Aebi, H. Catalase in Vitro. In Methods in Enzymology; Elsevier: Amsterdam, The Netherlands, 1984; Volume 105, pp. 121–126. ISBN 978-0-12-182005-3. [Google Scholar]
  61. McCord, J.M.; Fridovich, I. Superoxide Dismutase. J. Biol. Chem. 1969, 244, 6049–6055. [Google Scholar] [CrossRef]
  62. Lima, I.; Moreira, S.M.; Osten, J.R.-V.; Soares, A.M.V.M.; Guilhermino, L. Biochemical Responses of the Marine Mussel Mytilus Galloprovincialis to Petrochemical Environmental Contamination along the North-Western Coast of Portugal. Chemosphere 2007, 66, 1230–1242. [Google Scholar] [CrossRef]
  63. Zuur, A.F.; Ieno, E.N.; Walker, N.J.; Saveliec, A.A.; Smith, G.M. Mixed effects modelling for nested data. In Mixed Effects Models and Extensions in Ecology with R; Gail, M., Krickeber, J.M., Samet, M., Tsiatis, A., Wong, W., Eds.; Statistics for Biology and Health; Springer: New York, NY, USA, 2009; pp. 101–142. ISBN 978-0-387-87457-9. [Google Scholar]
  64. Fox, J.; Fox, J. Applied Regression Analysis and Generalized Linear Models, 3rd ed.; SAGE: Los Angeles, CA, USA, 2016; ISBN 978-1-4522-0566-3. [Google Scholar]
  65. Team, C.R. R: A Language and Environment for Statistical Computing; R Foundation for Statistical Computing: Vienna, Austria; Available online: https://www.R-project.org/ (accessed on 16 February 2022).
  66. Nilsson, G.E.; Östlund-Nilsson, S. Hypoxia in Paradise: Widespread Hypoxia Tolerance in Coral Reef Fishes. Proc. R. Soc. Lond. B 2004, 271, S30–S33. [Google Scholar] [CrossRef] [PubMed] [Green Version]
  67. Alderdice, R.; Suggett, D.J.; Cárdenas, A.; Hughes, D.J.; Kühl, M.; Pernice, M.; Voolstra, C.R. Divergent Expression of Hypoxia Response Systems under Deoxygenation in Reef-forming Corals Aligns with Bleaching Susceptibility. Glob. Chang. Biol. 2021, 27, 312–326. [Google Scholar] [CrossRef]
  68. Alderdice, R.; Pernice, M.; Cárdenas, A.; Hughes, D.J.; Harrison, P.L.; Boulotte, N.; Chartrand, K.; Kühl, M.; Suggett, D.J.; Voolstra, C.R. Hypoxia as a physiological cue and pathological stress for coral larvae. Mol. Ecol. 2022, 31, 571–587. [Google Scholar] [CrossRef]
  69. Feijão, E.; Cruz de Carvalho, R.; Duarte, I.A.; Matos, A.R.; Cabrita, M.T.; Novais, S.C.; Lemos, M.F.L.; Caçador, I.; Marques, J.C.; Reis-Santos, P.; et al. Fluoxetine Arrests Growth of the Model Diatom Phaeodactylum Tricornutum by Increasing Oxidative Stress and Altering Energetic and Lipid Metabolism. Front. Microbiol. 2020, 11, 1803. [Google Scholar] [CrossRef]
  70. Albright, R. Ocean Acidification and Coral Bleaching. In Coral Bleaching; van Oppen, M.J.H., Lough, J.M., Eds.; Ecological Studies; Springer International Publishing: Berlin/Heidelberg, Germany, 2018; Volume 233, pp. 295–323. ISBN 978-3-319-75392-8. [Google Scholar]
  71. Warner, M.E.; Fitt, W.K.; Schmidt, G.W. Damage to Photosystem II in Symbiotic Dinoflagellates: A Determinant of Coral Bleaching. Proc. Natl. Acad. Sci. USA 1999, 96, 8007–8012. [Google Scholar] [CrossRef] [Green Version]
  72. Strasser, R.J.; Stirbet, A.D. Estimation of the Energetic Connectivity of PS II Centres in Plants Using the Fluorescence Rise O–J–I–P. Math. Comput. Simul. 2001, 56, 451–462. [Google Scholar] [CrossRef]
  73. Feijão, E.; Gameiro, C.; Franzitta, M.; Duarte, B.; Caçador, I.; Cabrita, M.T.; Matos, A.R. Heat Wave Impacts on the Model Diatom Phaeodactylum Tricornutum: Searching for Photochemical and Fatty Acid Biomarkers of Thermal Stress. Ecol. Indic. 2018, 95, 1026–1037. [Google Scholar] [CrossRef]
  74. Franzitta, M.; Feijão, E.; Cabrita, M.T.; Gameiro, C.; Matos, A.R.; Marques, J.C.; Goessling, J.W.; Reis-Santos, P.; Fonseca, V.F.; Pretti, C.; et al. Toxicity Going Nano: Ionic Versus Engineered Cu Nanoparticles Impacts on the Physiological Fitness of the Model Diatom Phaeodactylum Tricornutum. Front. Mar. Sci. 2020, 7, 539827. [Google Scholar] [CrossRef]
  75. Ulstrup, K.; Hill, R.; Ralph, P. Photosynthetic Impact of Hypoxia on in Hospite Zooxanthellae in the Scleractinian Coral Pocillopora Damicornis. Mar. Ecol. Prog. Ser. 2005, 286, 125–132. [Google Scholar] [CrossRef]
  76. Duarte, B.; Matos, A.R.; Caçador, I. Photobiological and Lipidic Responses Reveal the Drought Tolerance of Aster Tripolium Cultivated under Severe and Moderate Drought: Perspectives for Arid Agriculture in the Mediterranean. Plant Physiol. Biochem. 2020, 154, 304–315. [Google Scholar] [CrossRef]
  77. Finelli, C.M.; Helmuth, B.S.T.; Pentcheff, N.D.; Wethey, D.S. Water Flow Influences OxygenTransport and Photosynthetic Efficiency in Corals. Coral Reefs 2006, 25, 47–57. [Google Scholar] [CrossRef]
  78. Mass, T.; Genin, A.; Shavit, U.; Grinstein, M.; Tchernov, D. Flow Enhances Photosynthesis in Marine Benthic Autotrophs by Increasing the Efflux of Oxygen from the Organism to the Water. Proc. Natl. Acad. Sci. USA 2010, 107, 2527–2531. [Google Scholar] [CrossRef] [Green Version]
  79. Roth, M.S. The Engine of the Reef: Photobiology of the Coral–algal Symbiosis. Front. Microbiol. 2014, 5. [Google Scholar] [CrossRef]
  80. Duarte, B.; Feijão, E.; Goessling, J.W.; Caçador, I.; Matos, A.R. Pigment and Fatty Acid Production under Different Light Qualities in the Diatom Phaeodactylum Tricornutum. Appl. Sci. 2021, 11, 2550. [Google Scholar] [CrossRef]
  81. Roberty, S.; Furla, P.; Plumier, J.-C. Differential Antioxidant Response between Two Symbiodinium Species from Contrasting Environments: Antioxidant Responses of Symbiodinium sp. Plant Cell Environ. 2016, 39, 2713–2724. [Google Scholar] [CrossRef]
  82. Wehner, A.; Storf, S.; Jahns, P.; Schmid, V.H. De-epoxidation of violaxanthin in light-harvesting complex I proteins. J. Biol. Chem. 2004, 279, 26823–26829. [Google Scholar] [CrossRef] [PubMed] [Green Version]
  83. Downs, C.A.; Fauth, J.E.; Halas, J.C.; Dustan, P.; Bemiss, J.; Woodley, C.M. Oxidative Stress and Seasonal Coral Bleaching. Free Radical. Biol. Med. 2002, 33, 533–543. [Google Scholar] [CrossRef]
  84. Lesser, M.P. Oxidative stress in marine environments: Biochemistry and Physiological Ecology. Annu. Rev. Physiol. 2006, 68, 253–278. [Google Scholar] [CrossRef] [PubMed] [Green Version]
  85. Lesser, M.P. Experimental Biology of Coral Reef Ecosystems. J. Exp. Mar. Biol. Ecol. 2004, 300, 217–252. [Google Scholar] [CrossRef]
  86. Dias, M.; Madeira, C.; Jogee, N.; Ferreira, A.; Gouveia, R.; Cabral, H.; Diniz, M.; Vinagre, C. Oxidative Stress on Scleractinian Coral Fragments Following Exposure to High Temperature and Low Salinity. Ecol. Indic. 2019, 107, 105586. [Google Scholar] [CrossRef]
  87. Abele, D. Toxic Oxygen: The Radical Life-Giver. Nature 2002, 420, 27. [Google Scholar] [CrossRef] [Green Version]
  88. Teixeira, T.; Diniz, M.; Calado, R.; Rosa, R. Coral Physiological Adaptations to Air Exposure: Heat Shock and Oxidative Stress Responses in Veretillum Cynomorium. J. Exp. Mar. Biol. Ecol. 2013, 439, 35–41. [Google Scholar] [CrossRef]
  89. Dykens, J.A.; Shick, J.M. Oxygen production by endosymbiotic algae controls superoxide dismutase activity in their animal host. Nature 1982, 297, 579–580. [Google Scholar] [CrossRef]
  90. Altieri, A.H.; Johnson, M.D.; Swaminathan, S.D.; Nelson, H.R.; Gedan, K.B. Resilience of Tropical Ecosystems to Ocean Deoxygenation. Trends Ecol. Evol. 2021, 36, 227–238. [Google Scholar] [CrossRef]
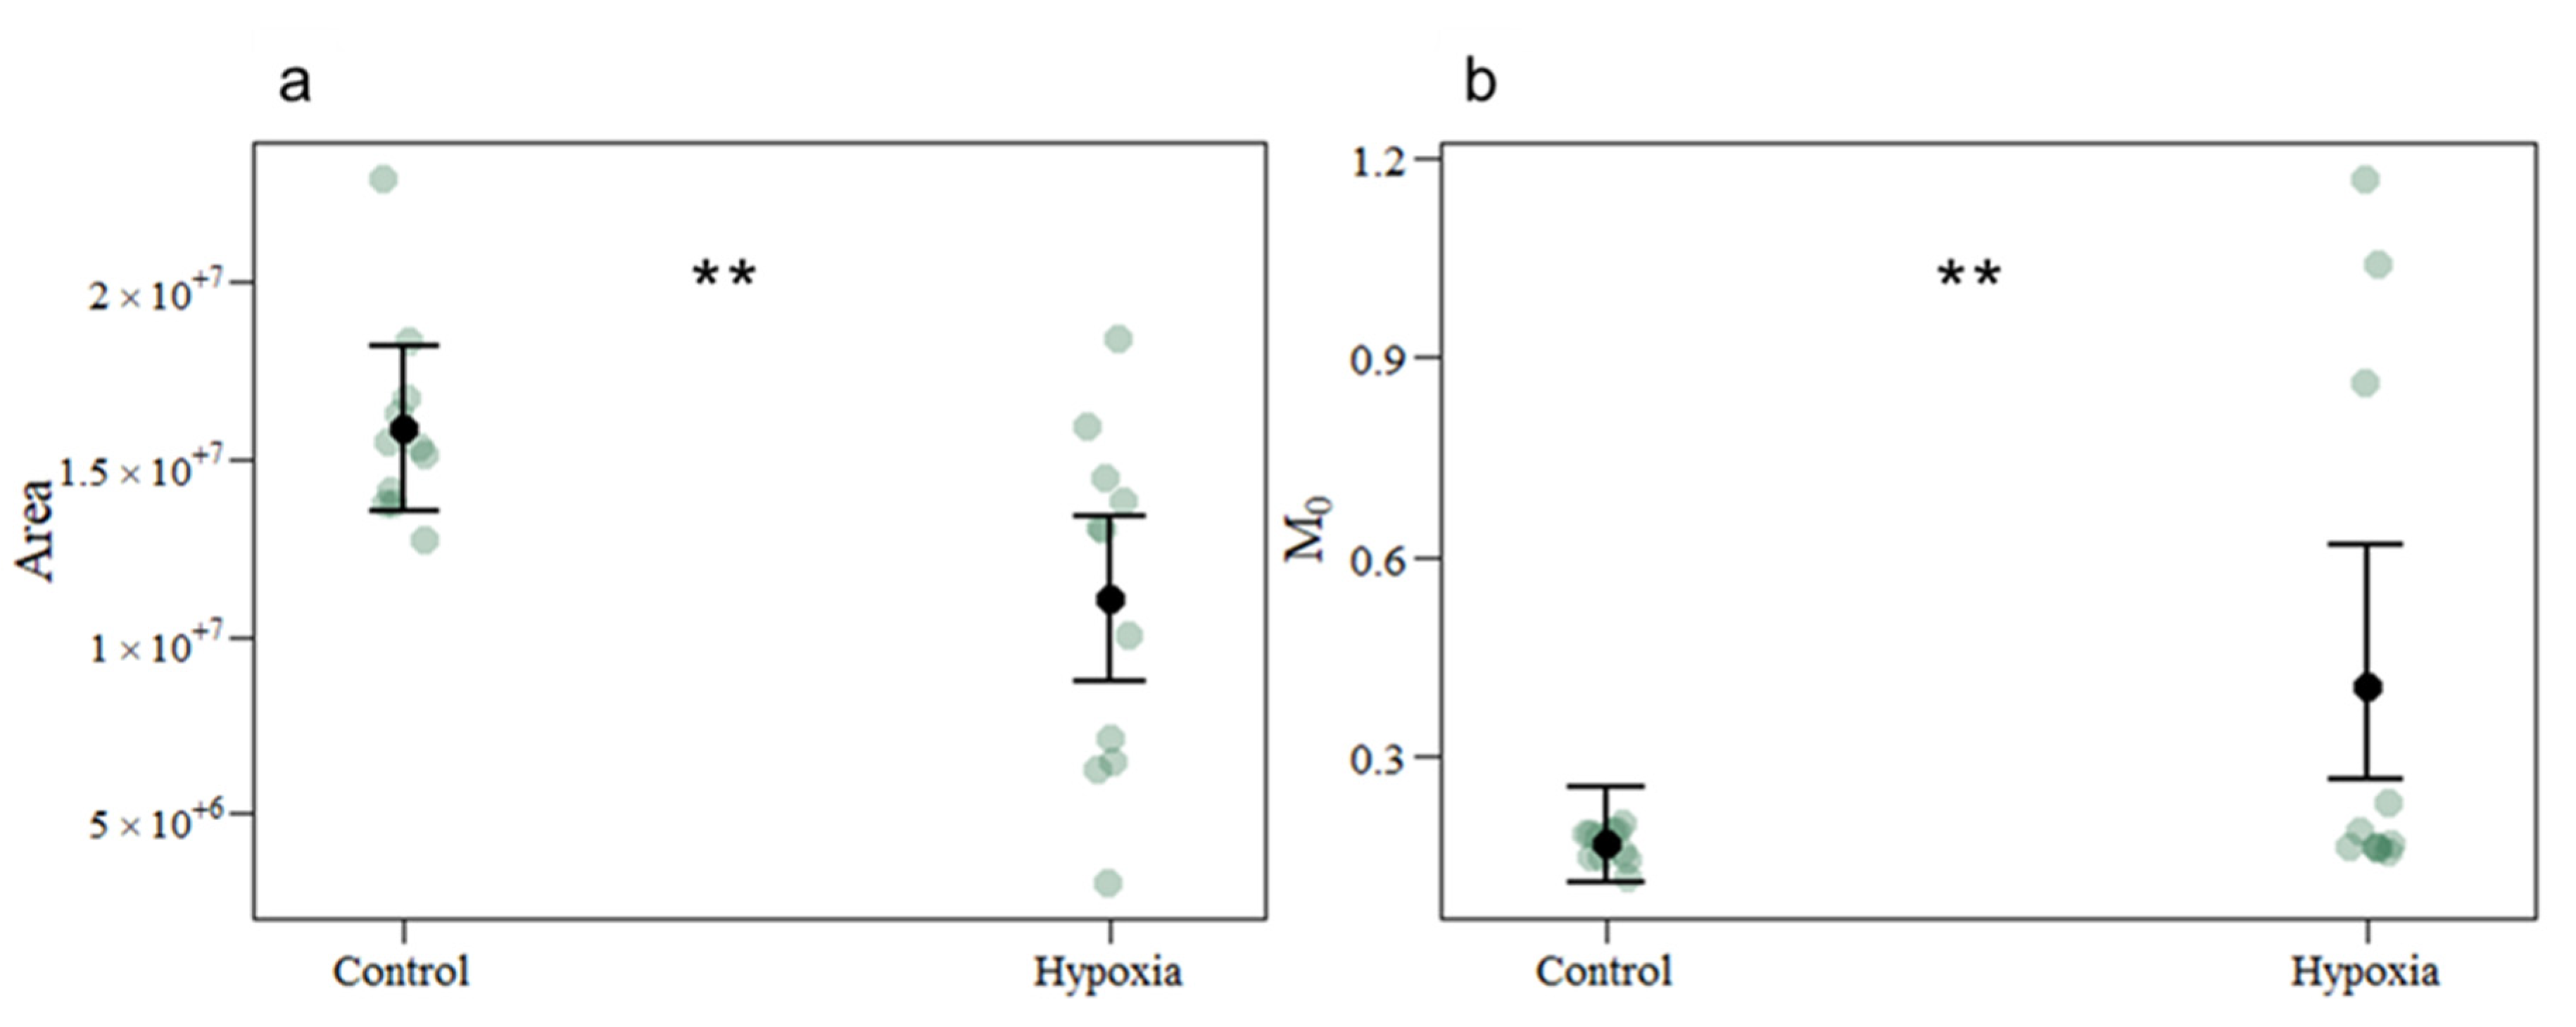
Figure 1. Extracted fluorescence parameters in coral fragments exposed to control and hypoxic conditions. (a) Oxidized quinone pool size (Area) and (b) net rate of PS II reaction centres closure (M0). The values represent mean and standard deviation, asterisks indicate significant differences between the treatment groups at: p < 0.01 (**) (control n = 11; hypoxia n = 11). The n denotes the number of coral samples assessed in the analysis. CI from the model and each measurement point are represented.
Biology 11 01068 g001
Figure 2. Photobiology-related phenomenological energetic parameters in coral fragments exposed to control and hypoxic conditions. (a) grouping probability between the two PS II (PG); (b) absorbed energy flux per cross-section (ABS/CS); (c) trapped energy flux per cross-section (TR/CS); (d) electron transport energy flux per cross-section (ET/CS); (e) dissipated energy flux per cross-section (DI/CS); (f) number of oxidized PS II reaction centres (RC/CS); (g) performance index (PI/ABS). The values represent mean and standard deviation, asterisks indicate significant differences between the treatment groups at: p < 0.05 (*); p < 0.01 (**) (control n = 11; hypoxia n = 11). The n denotes the number of coral samples assessed in the analysis. CI from the model and each measurement point are represented.
Biology 11 01068 g002
Figure 3. De-epoxidation state of coral fragments exposed to control and hypoxic conditions. The values represent mean and standard deviation, asterisks indicate significant differences between the treatment groups at: p < 0.05 (*) (control n = 15; hypoxia n = 13). The n denotes number of coral samples assessed in the analysis. CI from the model and each measurement point are represented.
Biology 11 01068 g003
Figure 4. Oxidative DNA damage caused by ROS of coral fragments exposed to control and hypoxic treatments. The values represent mean and standard deviation, asterisks indicate significant differences between the treatment groups at: p < 0.001 (***) (control n = 12; hypoxia n = 12). The n denotes the number of coral samples assessed in the analysis. Abbreviations: µg: microgram; mg: milligram. CI from the model and each measurement point are represented.
Biology 11 01068 g004
Table 1. Summary of the extracted fluorometric parameters in the analysis.
VariableDescription
Rapid light curves
ETRmaxMaximum ETR obtained from the RLC
EKThe onset of light saturation
αPhotosynthetic efficiency extracted from the RLC initial slope
βRespiratory efficiency
Kautsky curves
AreaOxidized quinone pool size available for reduction and is a function of the area above the Kautsky plot
SMThe energy needed to close all reaction centres
M0The net rate of PS II reaction centres closure.
NReaction centre turnover rate
PGGrouping probability between the two PS II units
ABS/CSAbsorbed energy flux per cross-section.
TR/CSTrapped energy flux per cross-section.
ET/CSElectron transport energy flux per cross-section.
DI/CSDissipated energy flux per cross-section
RC/CSThe density of available reaction centres (QA-reducing PS II reaction centres) per cross-section
RC/ABSThe density of the reaction centres II within the PS II antenna chlorophyll bed
PI/ABSPerformance index on equal absorption basis
Table 2. GLM outcomes for all the analysed variable responses of corals exposed to control and hypoxic treatment. Statistical significance at p-value < 0.05 in bold. Abbreviations: SE: standard error.
VariableMean
(Control)
Mean
(Hypoxia)
SEEstimatet-Valuep
Rapid light curves
ETRmax15.333318.63640.38040.19510.5130.608
EK475.8107313.36520.3994−0.4177−1.0460.299
α0.04220.04320.10790.02230.2060.837
β0.18850.18110.0625−0.0403−0.6440.520
Kautsky curves
Area15,891,063.454511,075,497.2727167,746−4,815,566−2.8710.004
SM3696.16554012.1709181.93161.7380.082
M00.16760.40650.30210.88592.9320.004
N6.25438.16710.16340.26681.6330.103
PG8.50906.67170.1182−0.2433−2.0580.040
ABS/CS4498.27273237.8182420.3−1260.5−2.9990.003
TR/CS2201.46571520.1228236.4−681.3−2.8820.004
ET/CS1982.74971303.6097223.8−679.1−3.0350.002
DI/CS2296.80701717.6954201.3−579.1−2.8760.004
RC/CS1311.6541940.8176182.1−370.8−2.0360.042
RC/ABS0.32260.30940.0273−0.0132−0.4820.630
PI/ABS2.65281.71120.4471−0.9416−2.1060.035
Pigment composition
Chlorophyll a0.00410.00350.0004−0.0007−1.7350.083
Chlorophyll c23.85 × 10−53.2 × 10−51.02 × 10−5−6.54 × 10⁻⁶−0.6400.522
Pheophytin a0.00400.00430.00060.00030.4590.647
β-carotene0.00410.00370.0005−0.0005−1.0100.313
Diadinoxanthin1.61 × 10−41.29 × 10−43.07 × 10−5−3.27 × 10⁻⁵−1.0650.287
Diatoxanthin1.07 × 10−41.41 × 10−43.50 × 10−53.37 × 10−50.9630.336
Peridinin1.96862.32350.30010.35491.1830.237
De-epoxidation state0.37210.50370.06400.13162.0570.039
Oxidative stress
DNA damage1.81683.74310.52641.92633.6600.001
Lipid peroxidation1.87962.05880.28840.17920.6210.534
Total protein2.50622.77330.20040.26721.3330.183
Catalase14.329818.26012.8823.931.3640.173
Superoxide dismutase0.52750.49730.0466−0.0302−0.6490.516
Publisher’s Note: MDPI stays neutral with regard to jurisdictional claims in published maps and institutional affiliations.