Article

Effects of the Density of Invasive Lantana camara Plants on the Biodiversity of Large and Small Mammals in the Groenkloof Nature Reserve (GNR) in South Africa

1
Institute of System Science, Durban University of Technology, 4-43 M L Sultan Road, Durban 4000, South Africa
2
Disaster Management Training and Education Centre for Africa, University of the Free State, Bloemfontein 9301, South Africa
*
Author to whom correspondence should be addressed.
Biology 2023, 12(2), 296; https://doi.org/10.3390/biology12020296
Submission received: 30 December 2022 / Revised: 6 February 2023 / Accepted: 8 February 2023 / Published: 13 February 2023
(This article belongs to the Section Zoology)

Abstract

:

Simple Summary

Weeds have been extensively reported to cause numerous disturbances in ecosystems worldwide. However, the impacts of these weeds on biodiversity, especially for mammals, has received little attention in South Africa. Therefore, this study explored the impact of one specific weed, Lantana camara, on the mammals of an urban Game Reserve in South Africa. Small mammal weights were varied by treatment type and the degree of invasion. Moreover, the weight of these small mammals varied by season across different treatments. This finding implies that the weight of the small mammals in the study was seasonally affected by the quantity of weeds. For large mammals, the distance of treatments (where large mammal tracks were sampled) from a water source was not a significant predictor of species richness, but density of L. camara was a significant predictor of large mammal species richness. This study concludes that the L. camara weed influences mammals of the Groenkloof Nature Reserve (GNR) negatively.

Abstract

Multi-scale approaches have been used to determine scales at which mammal species are responding to habitat destruction due to invasion, but the impacts of weeds on mammals have not been extensively studied, especially in Africa. Inside the Groenkloof Nature Reserve (GNR), we assessed how mammals are affected by an invasive weed Lantana camara. A series of models were applied to determine the differences in species abundance as well as richness, separated for large and small mammals. When diversity indices were used, an Analysis of Variance (ANOVA) revealed no statistically significant difference between treatments (F5 = 0.233, p = 0.945) for large mammals. The results of a Generalised Linear Mixed Model (GLMM) showed that vegetation type (Wald χ22 = 120.156; p < 0.01) and foraging guilds (Wald χ23 = 76.771; p < 0.01) were significant predictors of large mammal species richness. However, for small mammals, the results of a GLMM showed that only treatment type (Wald χ25 = 10.62; p = 0.050) was a significant predictor of the number of small mammals trapped. In addition, the ANOVA revealed statistically significant differences in species diversity between treatments (F5 = 0.934; p < 0.001) and by season (F1 = 9.122 p = 0.003) for small mammals. The presence of L. camara coupled with other predictors was associated with differences in large mammal abundances and diversity, and differences in how these large mammals were distributed across the landscape. Furthermore, the highest species diversity was found in the spring for small mammals. Therefore, for all the mammals studied, the presence of L. camara negatively affected species abundance, richness, and diversity, as well as how these species were distributed across the invaded and cleared areas.

1. Introduction

Globally, invasive species have severe negative impacts on biodiversity [1,2,3]. In Australia, van Wilgen et al. [4] identified 1321 native plants and 158 native animal species that are threatened by the invasive weed Lantana camara, and that 275 of the native plants and 24 native animal species required immediate protection from L. camara invasions. This could be because L. camara, like most invasive shrubs, affects the grass layer [5,6]. The impacts of invasive weeds on terrestrial mammals have received little attention, even though these mammals are reported to promote ecotourism and improve the economy of the communities surrounding protected areas [7].

Problem

Worldwide habitat loss due to invasive species has been reported by numerous studies [8,9]. Stuart et al. [8] reported that these losses threaten 48% of rapidly declining animal species and are driving species, especially mammals, to extinction. The lack of conservation solutions for these invasive plant-species-induced declines could mean that hundreds of mammals worldwide now face extinction, which will be a serious and holistic problem for biodiversity. As habitats are altered, an untold number of mammals are disappearing before they have been recognised, much less studied [9]. This is especially true for protected areas in most urban setups of developing countries. For example, less mammal research has been conducted in the study area, most likely because the Groenkloof Nature Reserve (GNR) is very commercialised, and some research methodologies will not work due to aspects such as noise pollution [2]. This leaves the effects of invasive species in this type of setup unstudied. Ceballos et al. [10] documented the population extinctions in 177 mammals and found that the rate of population loss in terrestrial mammals due to invasive weeds was extremely high between 1900 and 2015, which is a serious problem in itself. Furthermore, Amin et al. [11] identified invasive weeds as a threat to 212 mammals in Nepal. On oceanic islands, habitat loss due to introduced invasive plant species has driven the extinction of mammals [12]. In South Africa, invasive alien plants have also been recognised as a threat to native biodiversity for more than two decades [1].
Ewel et al. [13] identified the negative impacts of invasive species on the shelter and protection of mammals, and Ehrenfeld [14] reported that the thorny and bushy habitat of Japanese barberry (Berberis thunbergii) makes it an ineffective shelter for mammals. However, less attention has been paid to other weeds in the grassland’s biomes, especially in South Africa [15], and the importance of the present study is an effort to rectify this situation.
The L. camara leaves are reported to be unpalatable or even toxic to mammalian herbivores due to the presence of secondary plant metabolites, mainly triterpene acids. In addition, L. camara alters the quality of the habitat by potentially reducing the diversity and abundance of forage species available to mammals [16].
The present study is focused on the effects of L. camara on mammals of the GNR. For large mammals, the studies referenced above provide the bases of three hypotheses: (1) Large mammalian species richness will be affected by vegetation type but this will be dependent on foraging guild [17]; (2) L. camara will affect large mammalian species richness based on the distance of the treatments from a water source, with the expectation of higher species richness in treatments nearer to a water source [18]; (3) Large mammal species richness will be lower in areas with higher L. camara density compared to areas with lower L. camara density [19].
The impacts of most invasive species on small terrestrial mammals have not been extensively quantified. Invasion biology focuses more on large flagship mammals for ecotourism purposes [20]. A literature scan has revealed only one study in England that explored the impacts of the invasive Rhoddendron ponticum shrub on wood mice (Apodemus sylvaticus). The lack of attention paid to the effects of biological invasion on small mammals [21,22] is surprising because these mammals are important in the ecosystem. Thus, case-specific studies are needed from different protected areas, with different invasion and clearing times, in order to enable the generation of a better understanding of biological invasion on a global level [23]. Ceradini and Chalfoun [24] reported a decrease in the occupancy of two rodent species due to invasive cheatgrass in North America, indicating modification in species composition. Similarly, Haack et al. [25] also reported that invasive L. camara influences small mammal assemblages because of its canopy and thickets. The invasive Lonicera maackii has been shown to change rodent foraging behaviour and decrease foraging activity because of the thicker foliage typical of invasive weeds [26]. In addition, weed thickets can cover native seeds preferred by granivorous rodents [27].
The canopies and thickets of L. camara can shift the community composition of small mammals adapted to warmer habitats and affect their assemblage. In this study, rodents were captured to assess the impacts of L. camara on the terrestrial small mammals and their assemblage inside the GNR with the objective of quantifying the impact of L. camara on these terrestrial small mammals inside the reserve. The study made two predictions as follows: (1) L. camara shrubs will have a negative effect on rodent species assemblage, and (2) the biggest rodents in terms of weight will be found in the control areas compared to smaller rodents and in the spring season. This last prediction is based on reports that rodents are more territorial in the spring season compared to other seasons [28,29].

2. Materials and Methods

2.1. Study Area

This study was conducted from October 2019 to February 2021 inside the Groenkloof Nature Reserve (GNR) in South Africa. The GNR (25°47′23″ S–28°11′46.1″ E) is 600 ha in extent [4]. The GNR has a diverse mammal fauna [30], and is mainly dominated by a variety of grasses, where animals spend most of their time grazing [31]. However, some areas inside the reserve have been converted into shrubland by L. camara invasion, limiting the growth of the grass that used to dominate. While grass still dominates overall, there are areas where L. camara dominates with higher densities compared to other areas.
In the early 1990s, Eckhardt et al. [32] recognized three vegetation types inside the GNR: mixed bushveld, highveld grassland, and rocky highveld grassland. Currently, there is an abundance of L. camara weed inside the reserve, as shown by the GNR invasive species abundance map, and this is a concern for the management of the GNR. However, grassland comprises 55% of the reserve [33]. There are bush-dominated areas inside the GNR, but the extent of these has not been documented.
The very patchy information regarding small mammal populations and diversity in the GNR is a severe constraint on proper management planning to assist in its biodiversity conservation [34]. The most common weeds in the GNR are pompom (Eupatorium macrocephalum) and common lantana (L. camara). L. camara is selected here because this weed is reported as amongst the most notorious and problematic of all invasive plants globally, and is ranked amongst the world’s ten worst weeds [12]. Compared to E. macrocephalum, L. camara is common in the study area and its threats and effects are undeniably recognizable in the park. Information about the environmental conditions of the study area (Table 1) was obtained from the GNR database.

2.2. Site Selection

To assess how L. camara affected large mammals inside the GNR, two sites with differing vegetation types were identified inside the reserve. Using historical maps (provided by GNR management), the study sampled two distinct sites threatened by L. camara, each with a different dominant vegetation type: a grass-dominated site and a bush-dominated site. The sites selected consisted of at least ~60% of the dominant vegetation, even though L. camara was also present in both sites. These sites were strategically selected so that some L. camara control work was conducted on both sites. Using the GNR L. camara clearing map, six treatment tracking plots were constructed within each site. In total, 12 five meters long and two meters wide treatment tracking plots were created for this study across the two sites. Large-scale control of L. camara was underway during the study because L. camara is the most problematic weed inside the reserve. During our study, the weed control team of the reserve was already removing large swaths of this weed using the cut-stump method of Rovero et al. [35]. The research team therefore worked with the L. camara control team to select the twelve treatment tracking plots for large mammal identification.

2.3. Treatment Design

To assess how L. camara affected mammals inside the GNR, the study analysed historical L. camara invasion and clearing maps (provided by GNR management) to identify and determine the study sites. Six treatment areas were selected from the maps that were equidistant, approximately 1 km from each other, after determining the duration of L. camara invasion and cleared periods. In total, twelve treatment tracking plots were selected across the different vegetation types, with six treatment plots in each vegetation type, grass-dominated and bush-dominated. These represented (1) plots that had been invaded by L. camara approximately 20 years (ca. 20 yrs) before the study commenced; (2) plots invaded for approximately for 10 years (ca. 10 yrs); (3) those invaded for approximately 2 years (ca. 2 yrs); (4) plots that were cleared between 3 and 5 years (cl. 3–5 yrs) from the start of the study; (5) plots that had been cleared in less than 2 years (cl. < 2 yrs); (6) plots that had never been invaded (the control plots) across each vegetation type. Differing clearing times, cl., in this study is the number of years since L. camara was removed, and ca. refers to the period since an invasion. Because L. camara is very invasive, it is assumed that treatments ca. 2 yrs to ca. 20 yrs represent increasing L. camara and similarly for cl. < 2 yrs to cl. 3–5 yrs. The removal of every L. camara weed to create treatment tracking plots was conducted with the reserves’ L. camara clearing team for record keeping as management of this weed is continuous inside the GNR. Removal of all vegetation to create tracking plots was approved by Reserve Management for the City of Tshwane (Protocol number: GNR 2019/20). In addition, treatments were in areas with minimal active management activities to eliminate human disturbances.

2.4. Mammal Sampling

2.4.1. Large Mammals

Data collected for this study (L. camara density and large mammal tracks) was demarcated to 100 m2 region for each treatment type. Similar studies by Dumalisile and Somers [15] and Rovero et al. [35] used a 100 m2 study area for large mammal sampling using tracks in two separate conservation areas. Throughout the present study, treatment tracking plots were kept relatively small for large mammals at 5 × 2 m to avoid clearing a larger area and interfering with the predator/prey hideouts. Esparton et al. [36] sampled large mammals on 0.5 × 0.5 m plots in a forest in Brazil. To track large mammal, 12 treatment tracking plots across the two vegetations type were demarcated in the GNR. The size of these plots was 2 × 5 m2.
The study used track counts to sample large mammals inside the GNR. All tracking plots were examined for tracks every second day for four hours from 06h00 to 08h00, and again from 16h00 to 18h00, throughout the study. After recording the tracks, the research team raked and smoothed the plots after adding smooth soil from the surrounding areas. Track counts are used across many different geographic areas to monitor the abundance of mammal species in most mammal-tracking studies [37]. To account for inter-observer variabilities, the double-observer protocol was adopted for this study [38]. The exercise was conducted twice, whereby two trained observers conducted the survey simultaneously [39].
Identifying tracks is a question of practice and experience, animal species seen often develop familiarity and confidence in identification [3]. Tracks of antelopes, such as Tragelaphus strepsiceros, Hippotragus niger, Connochaetes taurinus, and Aepyceros melampus, can be confusing. However, the size and the curves of their prints make them distinguishable from each other. For instance, C. taurinus tracks are bigger at the back and come to a point at the front that faces outwards, compared to the similarly shaped but smaller Tragelaphus strepsiceros tracks, which have sharper front points that face inside. Tragelaphus strepsiceros, Hippotragus niger, and Aepyceros melampus have somewhat similar tracks but the shape of their tracks at the back are different [39].
Two trained observers with digital cameras walked around the plot perimeters to identify and photograph any evidence of large mammals inside the plots and to record any evidence such as droppings and the number of tracks identified during each observation [39]. Distance of tracking plots from the water source were recorded using a Global Positioning System (GPS) and L. camara density was estimated inside the 100 m2 data collection area across all treatments by counting L. camara stems [40].

2.4.2. Small Mammals

To assess how L. camara affected small mammals inside the GNR, the study analysed historical L. camara invasion and clearing maps (provided by GNR management) to identify and determine the study sites. Five treatment areas were selected from the maps that were equidistant, approximately 1 km from each other, after determining the duration of L. camara invasion and cleared periods: treatments that had been (1) recently invaded by L. camara (approximately ca. 2 years before the study commenced); (2) invaded for approximately 10 and 20 years before the study commenced; (3) cleared for less than 2 years; (4) cleared for between 3 and 5 years; and (5) ones never invaded by L. camara. Trapping quadrats of 100 m2 were created using white PVC poles demarcated in each treatment to sample small mammals [3].
A capture, mark, identify, and release protocol technique was used to sample small mammals [41,42,43] in each of the 12 different treatment areas. Trapping was conducted monthly from November 2019 to February 2020. Traps were set in the quadrats in each treatment ensuing a balanced design. A total of 120 PVC Sherman-lookalike traps were used across the study, resulting in 4800 trap nights for a total of 40 trapping days. Trapping sessions across the study were set for 10 consecutive days each month. This was conducted to enhance trapping success because the study took place in a small, protected area compared to similar studies in larger, protected areas that trapped for eight consecutive days [42,43].

2.4.3. Mammal Identifications

All large mammal species identified in this study could be readily identified using the Stuart, 2013 [39] field guidebook. For data analysis, reconciled data after reaching a consensus was used as the official record of tracks recorded [44]. There was typically little variation between observers across the study.
For small mammal captures, the protocol of Mills et al. [21] was used to prepare the trap baits and set traps and was checked twice a day, once in the morning between 6 am and 10 am and in the afternoon between 5 pm and 6 pm. Traps were insulated when baiting with wet cotton wool to allow the mammal to survive the heat. Trapped individuals were identified at the species level [8]. The trapped animals were transferred from the traps to a clear plastic bag and weighed (to the nearest gram) using a German Calibration Service handheld spring balance.
To recognise previously captured individuals, each captured individual was marked by trimming the hair on the back of the neck with a pair of scissors to reveal the undercoat colour, which varies [44,45]. Gentian violet was sprayed on the clipped area, a semi-permanent marking, to assist in identifying recaptures. However, during the study, there were no recaptures. This study was approved by the Reserve Management of the City of Tshwane (Protocol number: GNR 2019/21).

2.5. Statistical Analysis

2.5.1. Large Mammals

Menhinick, Margalef’s Shannon–Weiner, Simpson, and Pilou indices were calculated as per Supplementary Table S1 using R statistical software. Non-parametric tests were used for hypothesis testing, otherwise data were log-transformed to meet normality requirements. One-way ANOVA with log-transformed data was used to evaluate the differences between plots using the diversity indices and the abundance index at a 5% level of significance. In addition, ANOSIM was used to assess large mammal species abundances. Furthermore, the Simpson and Shannon–Wiener indices were used to measure the abundances of large mammal species across treatments [46]. In addition, Non-Metric Multidimensional Scaling (nMDS) calculations were constructed to gauge similarities between treatments.
A multiple regression analysis was applied to tests if species richness was influenced by the distance of treatment from the water source or L. camara density around treatment plots. The number of tracks was the outcome variable and the distance of tracks from the water source and the density of L. camara around the treatments were set as predictor variables. A Pearson’s product-moment correlation test was applied to ascertain the relationship between the density of L. camara around the treatments and the distance of treatments from the water source.
Lastly, a Generalised linear mixed model (GLMM) with a Poisson distribution using the glmer function in the lme4 package of the R statistical software package was used to assess whether either vegetation type or foraging guild affect species richness. The number of tracks identified inside the treatments was analysed as the response variable, whereas vegetation type, foraging guild, and their interactions were set as predictor variables.

2.5.2. Small Mammals

Nonparametric species richness estimator Jack1 (i.e., first-order Jack-knife) and Chao1 [47,48] were used to detect changes in species richness. Three diversity indices were also calculated: Margalef’s index, the Simpson diversity index, and the Shannon–Wiener index of Diversity.
Data were tested for normality and—when necessary—transformed to be normally distributed. Then, a one-way ANOVA was used to determine how species differ in richness across treatments. A two-way ANOVA test was also applied to assess species diversity between the treatments using the Shannon index as the response variable with treatments and seasons set as independent variables.
Two separate GLMMs were used to assess relationships between Model (1), treatment type and the number of rodents captured, and Model (2), the weight of the rodents captured and season across treatments. The weight of the rodents and the number of rodents captured were analysed as outcome variables for Model 1 and Model 2, respectively, with the type of treatment and season as independent variables.
Each GLMM included the distance of treatments from the road as a random factor. The best model was checked by computing the AIC value because it is more robust for smaller sample sizes. Graphs for this study were produced using the GGplot2 package in the R statistical software package, and all data were analysed using this software.

3. Results

3.1. Large Mammals Results

A total of 829 individual large mammal species tracks comprising ten species from four foraging guilds were recorded by this study as follows: browsers (n = 287 tracks), grazers (n = 465), mixed feeders (n = 34), and carnivores (n = 43) across the 12 treatments and two vegetation types inside the GNR. Only Equus quagga, Canis moesomelas, and Giraffa camelopardalis were found across all the treatments; some individuals were detected in multiple plots within and/or across treatments and some individuals were detected across multiple days throughout the study. Large mammal tracks were recorded most in treatments that had never been invaded by L. camara (186 tracks). This number decreased with time from when invasions began, reaching 96 tracks in plots with 20 years of invasion. When sites were cleared, the species recovered, with 155 tracks in plots cleared in the period of 3–5 years (Supplementary Table S1).

3.1.1. Differences between Treatments

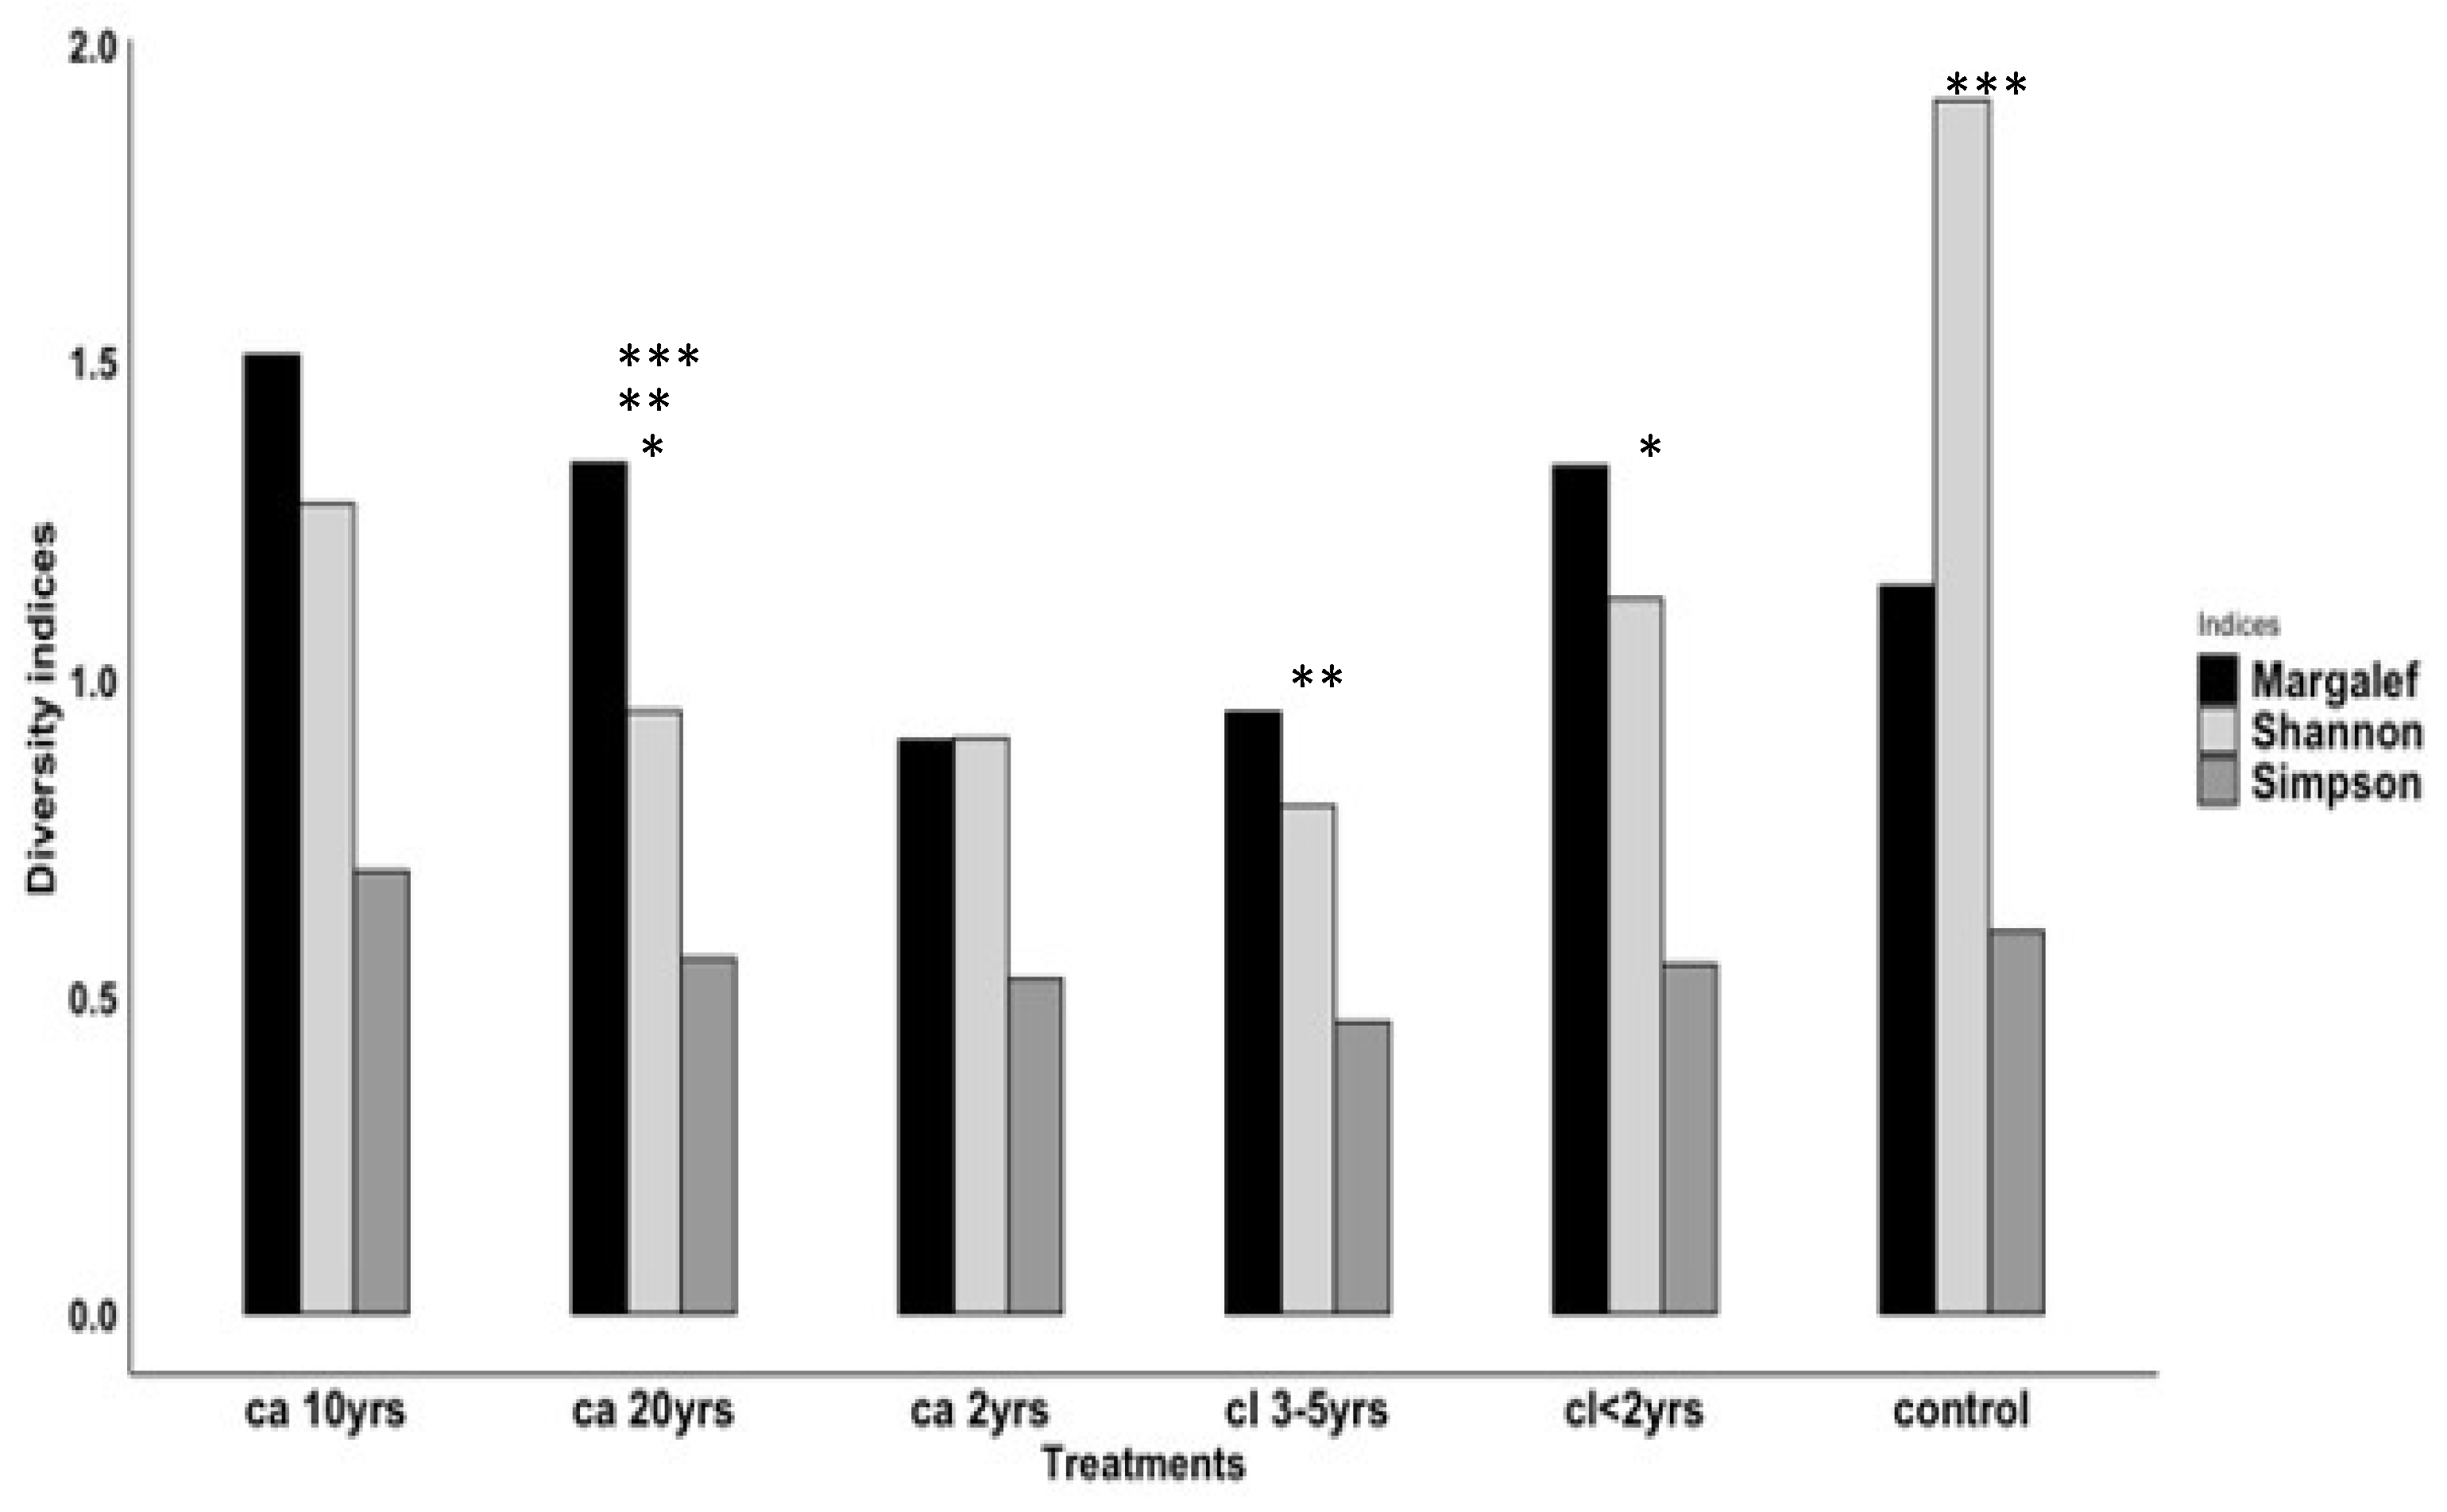
For large mammal diversity indices, the ANOVA revealed no statistically significant difference between treatments (F5 = 0.233, p = 0.945). However, the highest diversity (Shannon and Simpson) and richness (Menhinick’s) indices were in the control treatment (Figure 1). In addition, the lowest species diversity was in the ca. 20 yrs treatment plots (Figure 1).
All ANOSIM tests for pairwise comparisons of treatments were significant (p = <0.05, Table 2). The strengths of the differences are shown in Table 3.
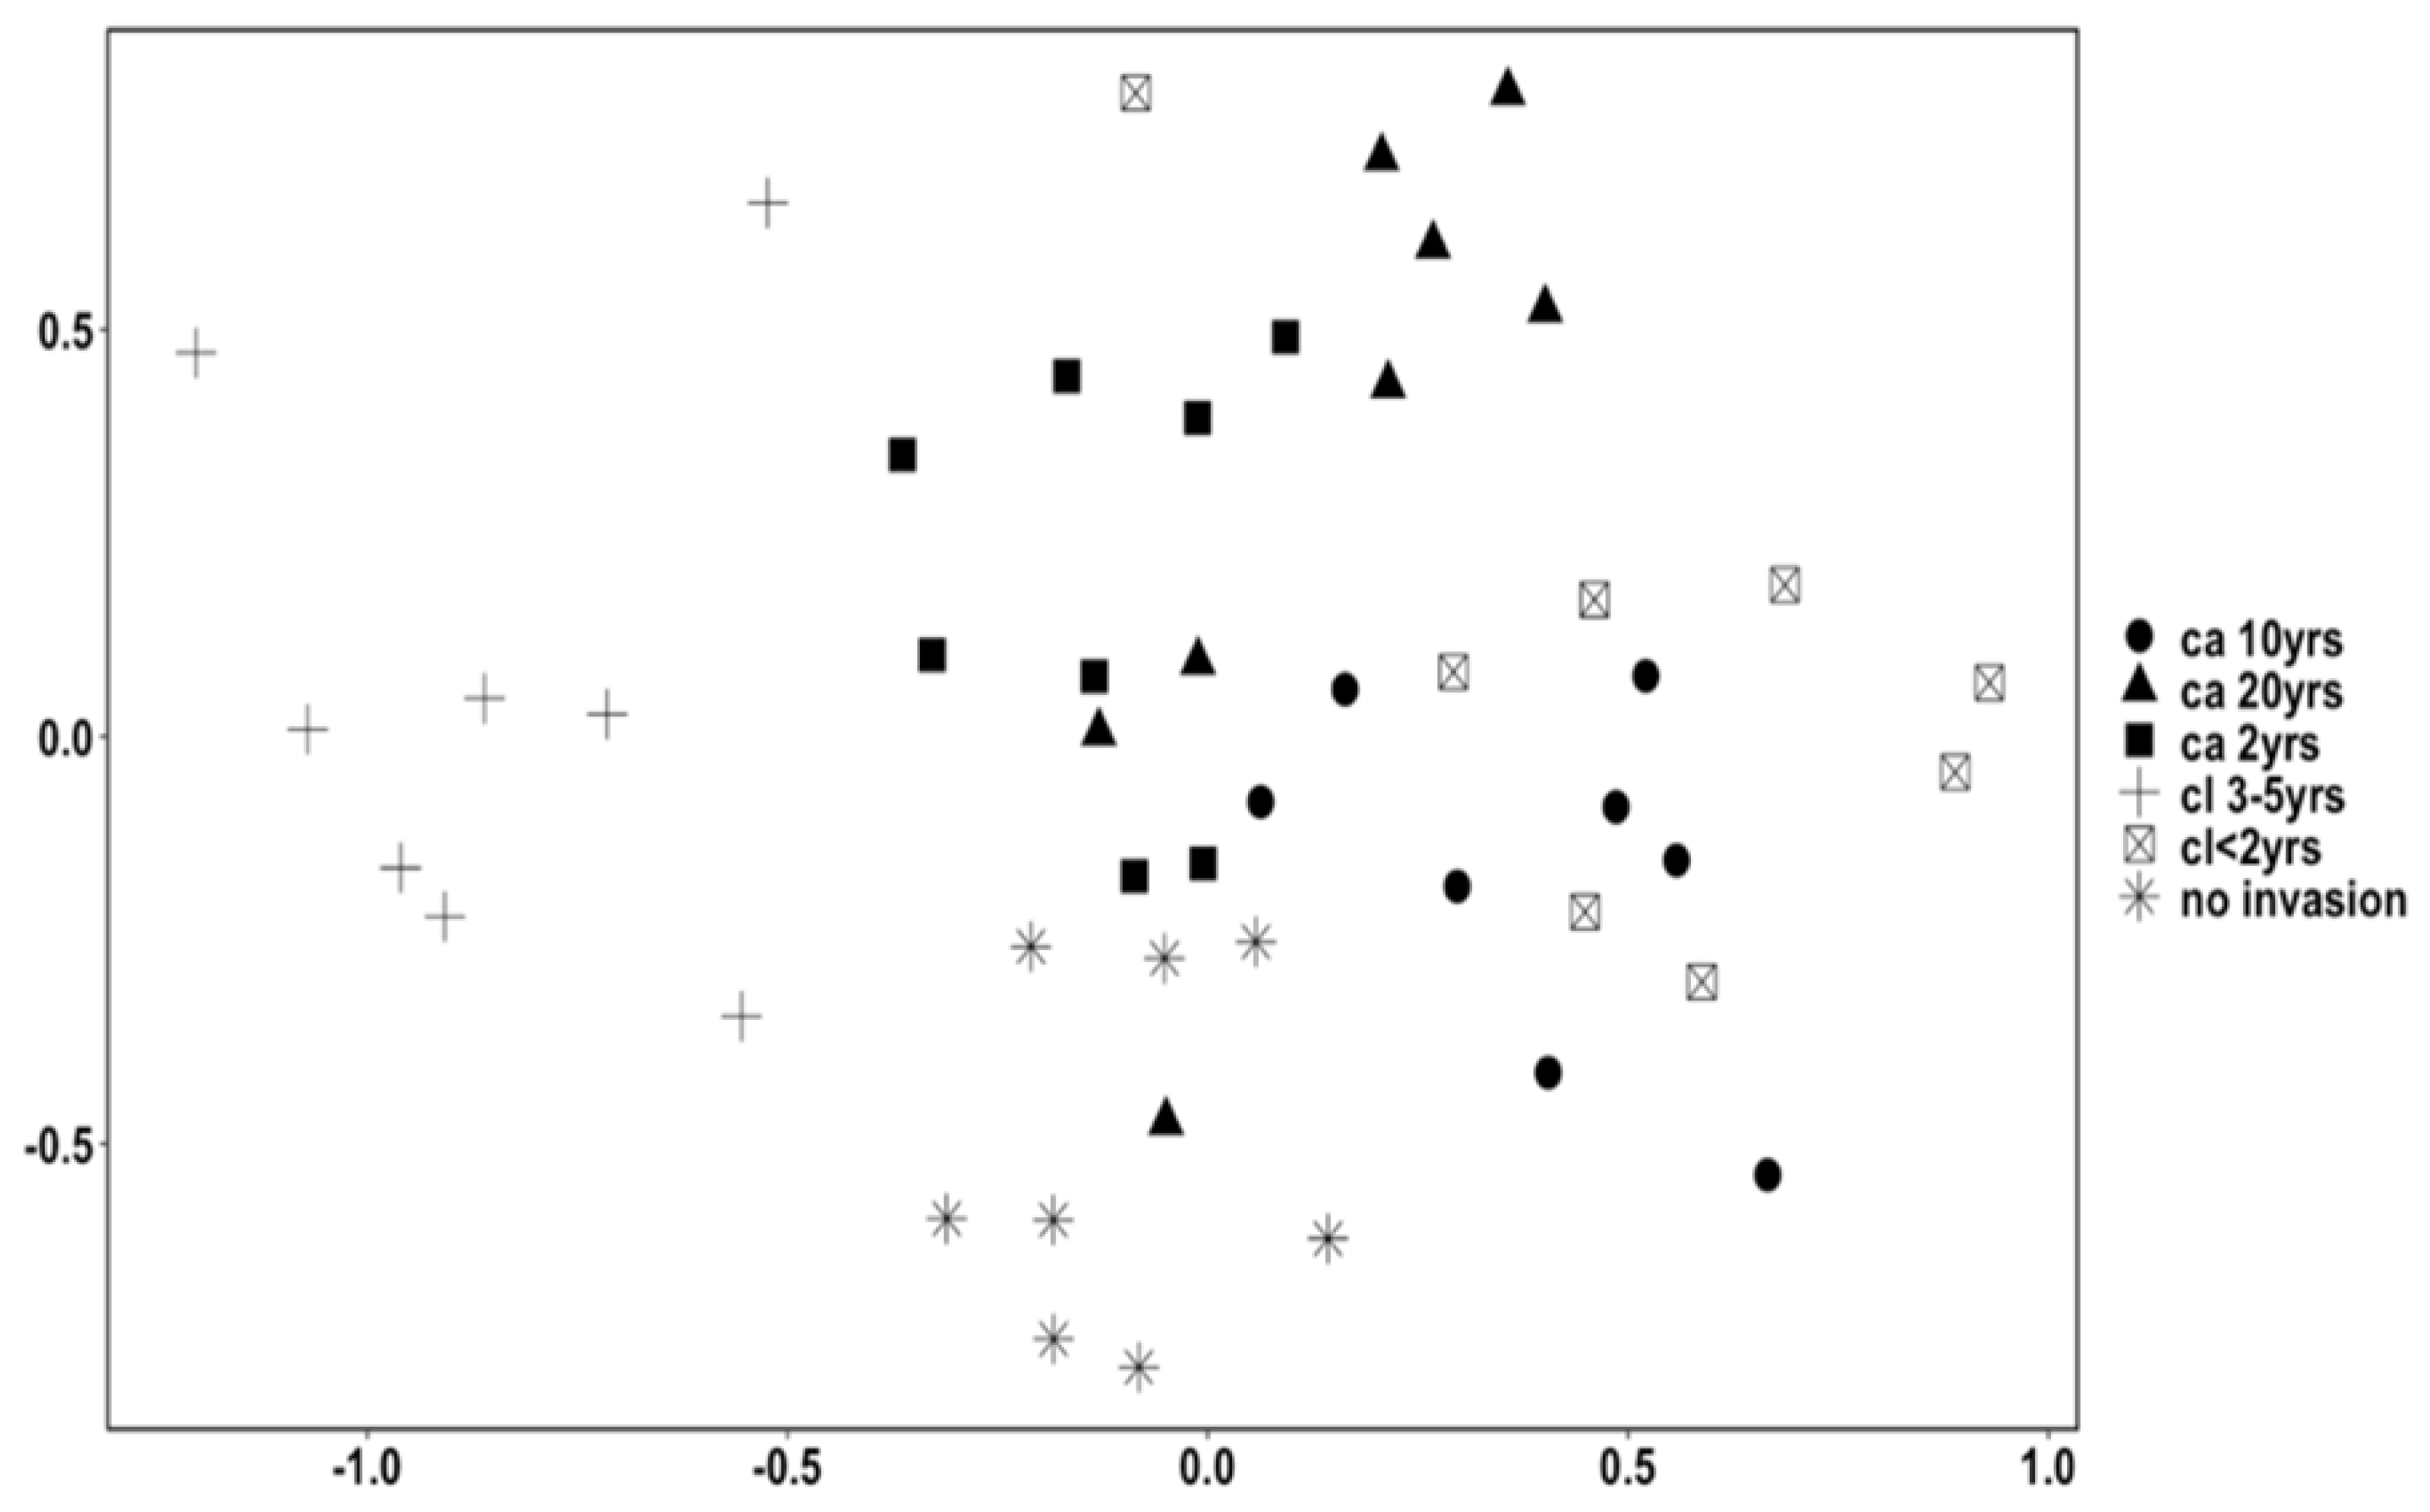
The nMDS results show differences in species composition across the treatments. The control treatments had the largest species composition (Figure 2).

3.1.2. Treatments’ Proximity to the Water Source and L. Camara Density

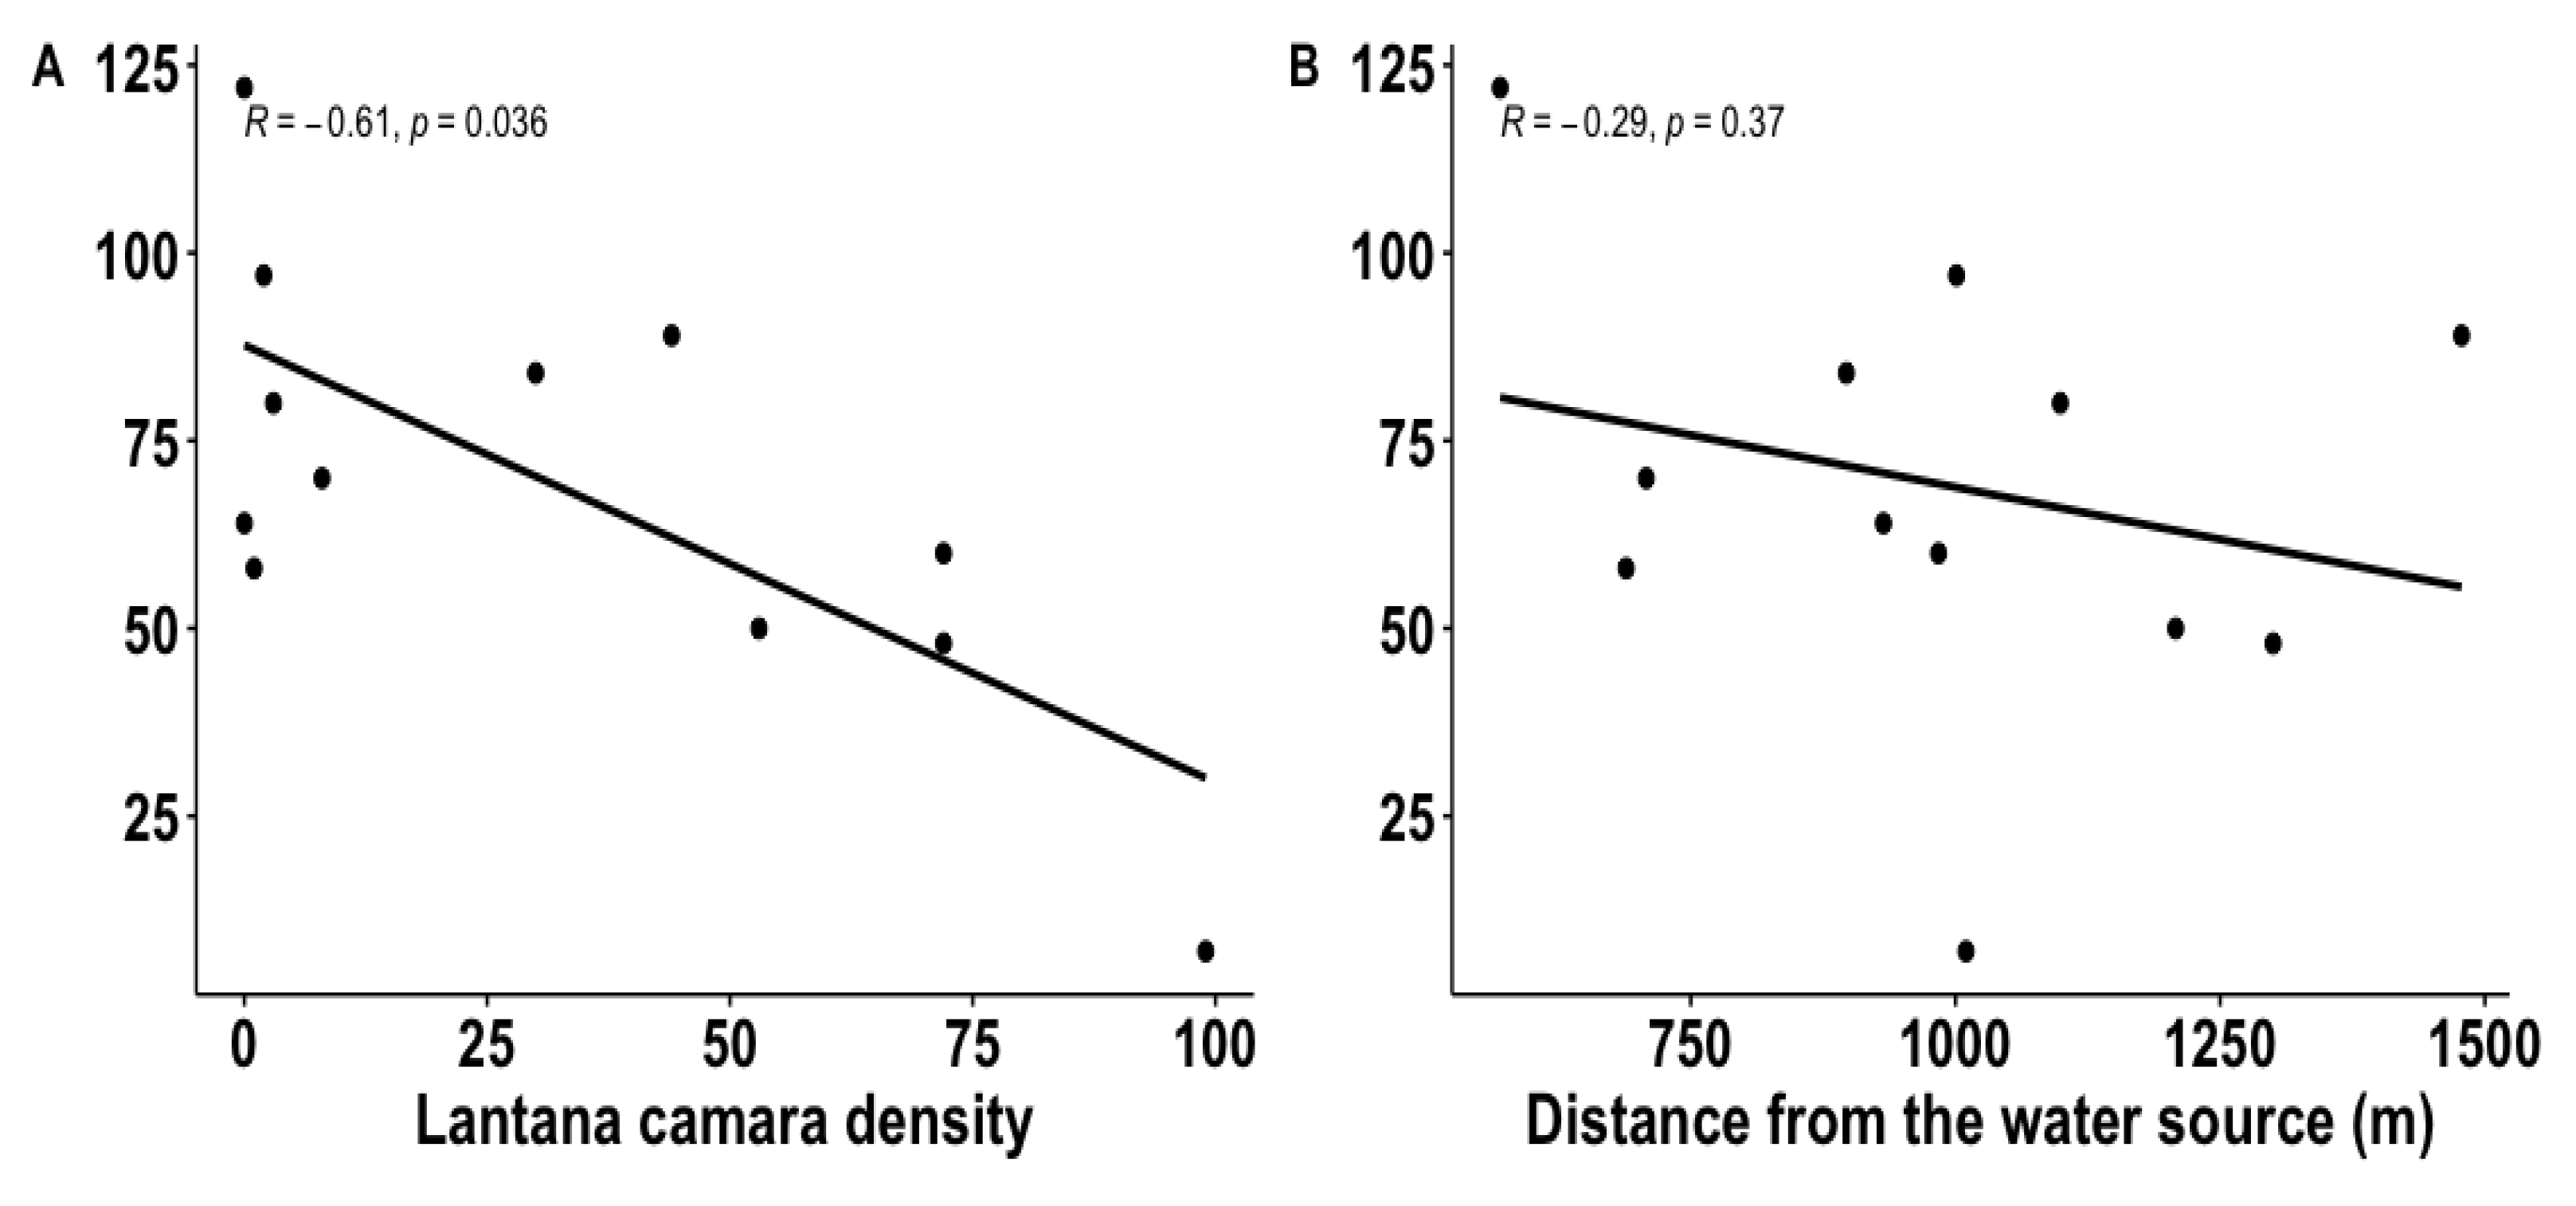
For plots where large mammal tracks were sampled, regression indicated that the two independent variables (distance to the water source and L. camara density) explained 70.0% of the variance (R2 = 0.735, F2,15 = 20.89, p < 0.001). Distance of treatments from the water source was not a significant predictor of species richness (β = −0.07, p = 0.37; Figure 3), but the density of L. camara in the treatments was a significant predictor of species richness (β = −0.55, p = 0.036; Figure 3A). The relationship between the predictor variables, the density of L. camara inside the treatment plots, and the distance of treatments from the water source was not significant (t = 1.919; d = 16; p = 0.073). However, species richness was far higher in plots with very little L. camara (Figure 3A).

3.1.3. Variation in Species Richness by Vegetation Type and Foraging Guilds

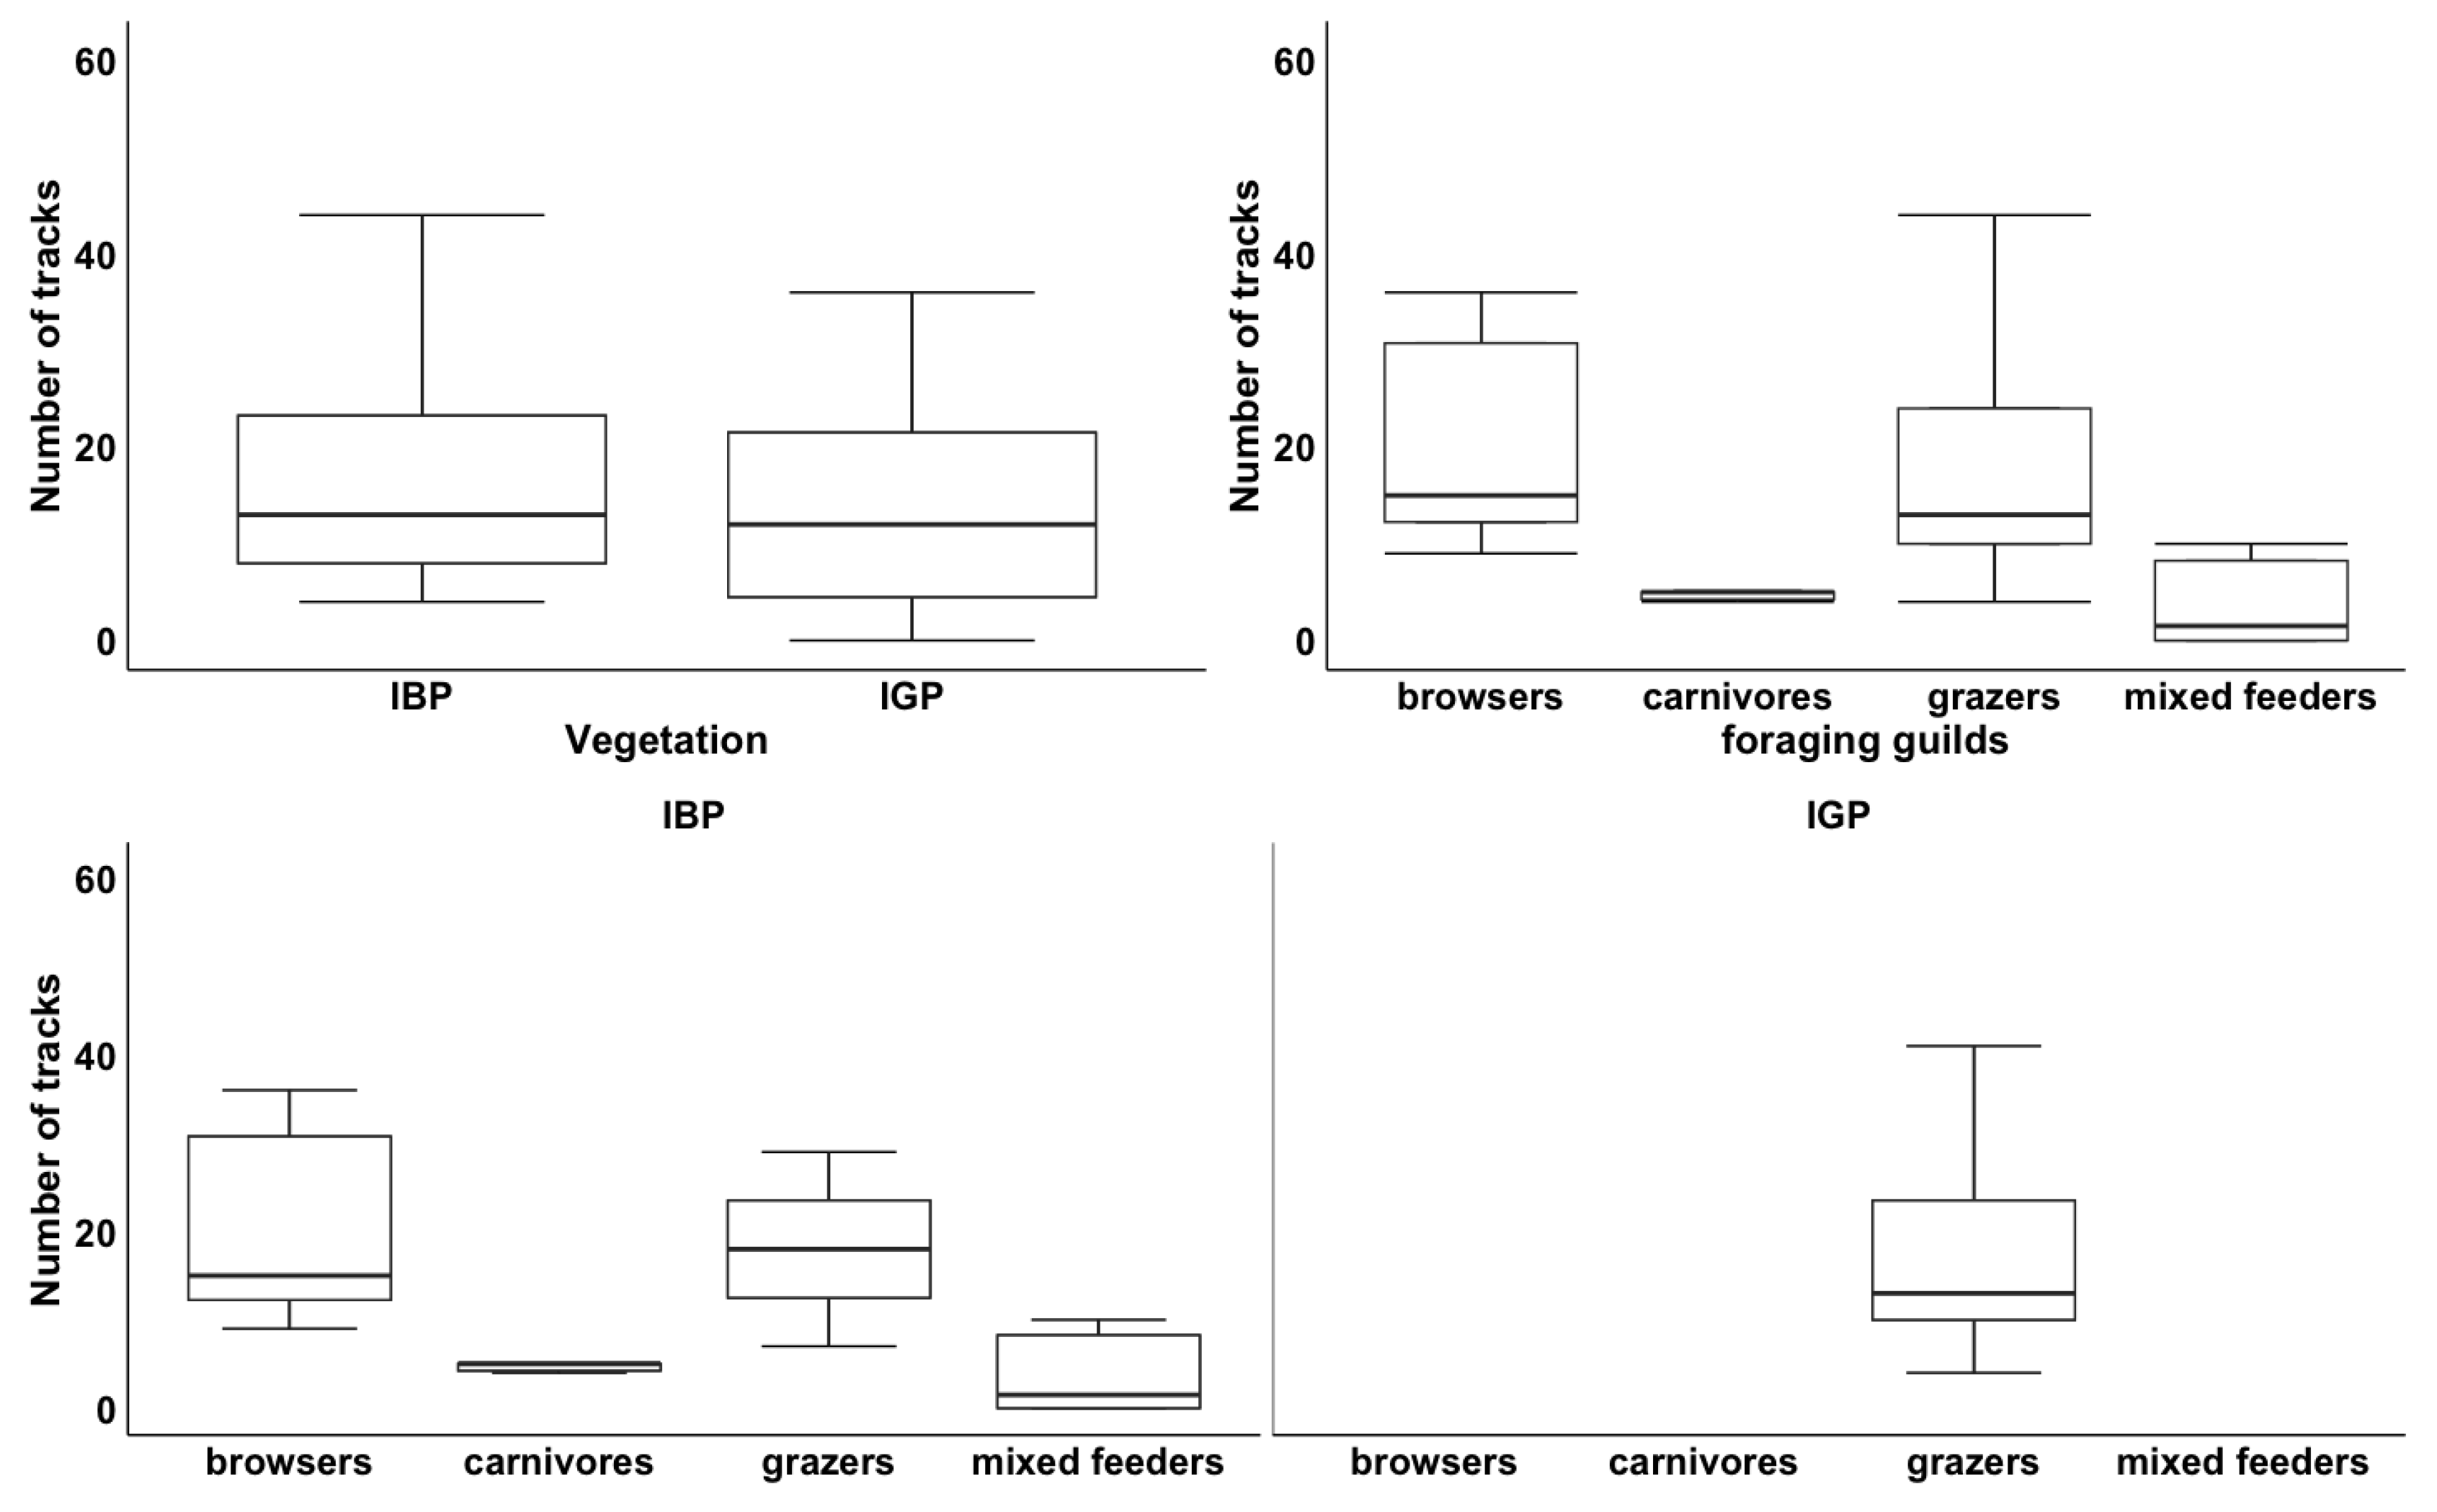
The GLMM results showed that the vegetation type (Wald χ22 = 120.156; p < 0.01) and foraging guild of large mammals (Wald χ23 = 76.771; p < 0.01) were significant predictors of large mammal densities. Overall, the highest number of large mammals was recorded in the bush-dominated sites compared to the grass-dominated sites. Furthermore, the study recorded, in order of numbers, grazers followed by browsers, carnivores, and mixed feeders, respectively (Figure 4). Interestingly, only grazers were found across both vegetation types, but the median of grazers in the grass-dominated plots was very negligible (~10) in comparison to the median in the bush-dominated plots (Figure 4). The highest number of grazers followed by browsers, carnivores, and mixed feeders, respectively, were found in the bush-dominated plots (Figure 4). Significant differences in large mammal densities were found for all treatment types except for cl. 20-year plots (Table 4), and a significant difference was found for Indigenous grass-dominated sites (Table 4).

3.2. Small Mammals Results

3.2.1. Rodents Trapping

The study captured 66 individual rodent species of the Muridae family, which includes mice and rats. Rhabdomys pumilio (de Winton, 1897) [49,50] was the most captured species (n = 38; Supplementary Table S1) across the study. Because the two Aethomys species (A. chrysophilus and A. ineptus) occurring in South Africa cannot be distinguished from each other in the field [7], all Aethomys species captured by this study were analysed together as Aethomys sp. (Supplementary Table S1).
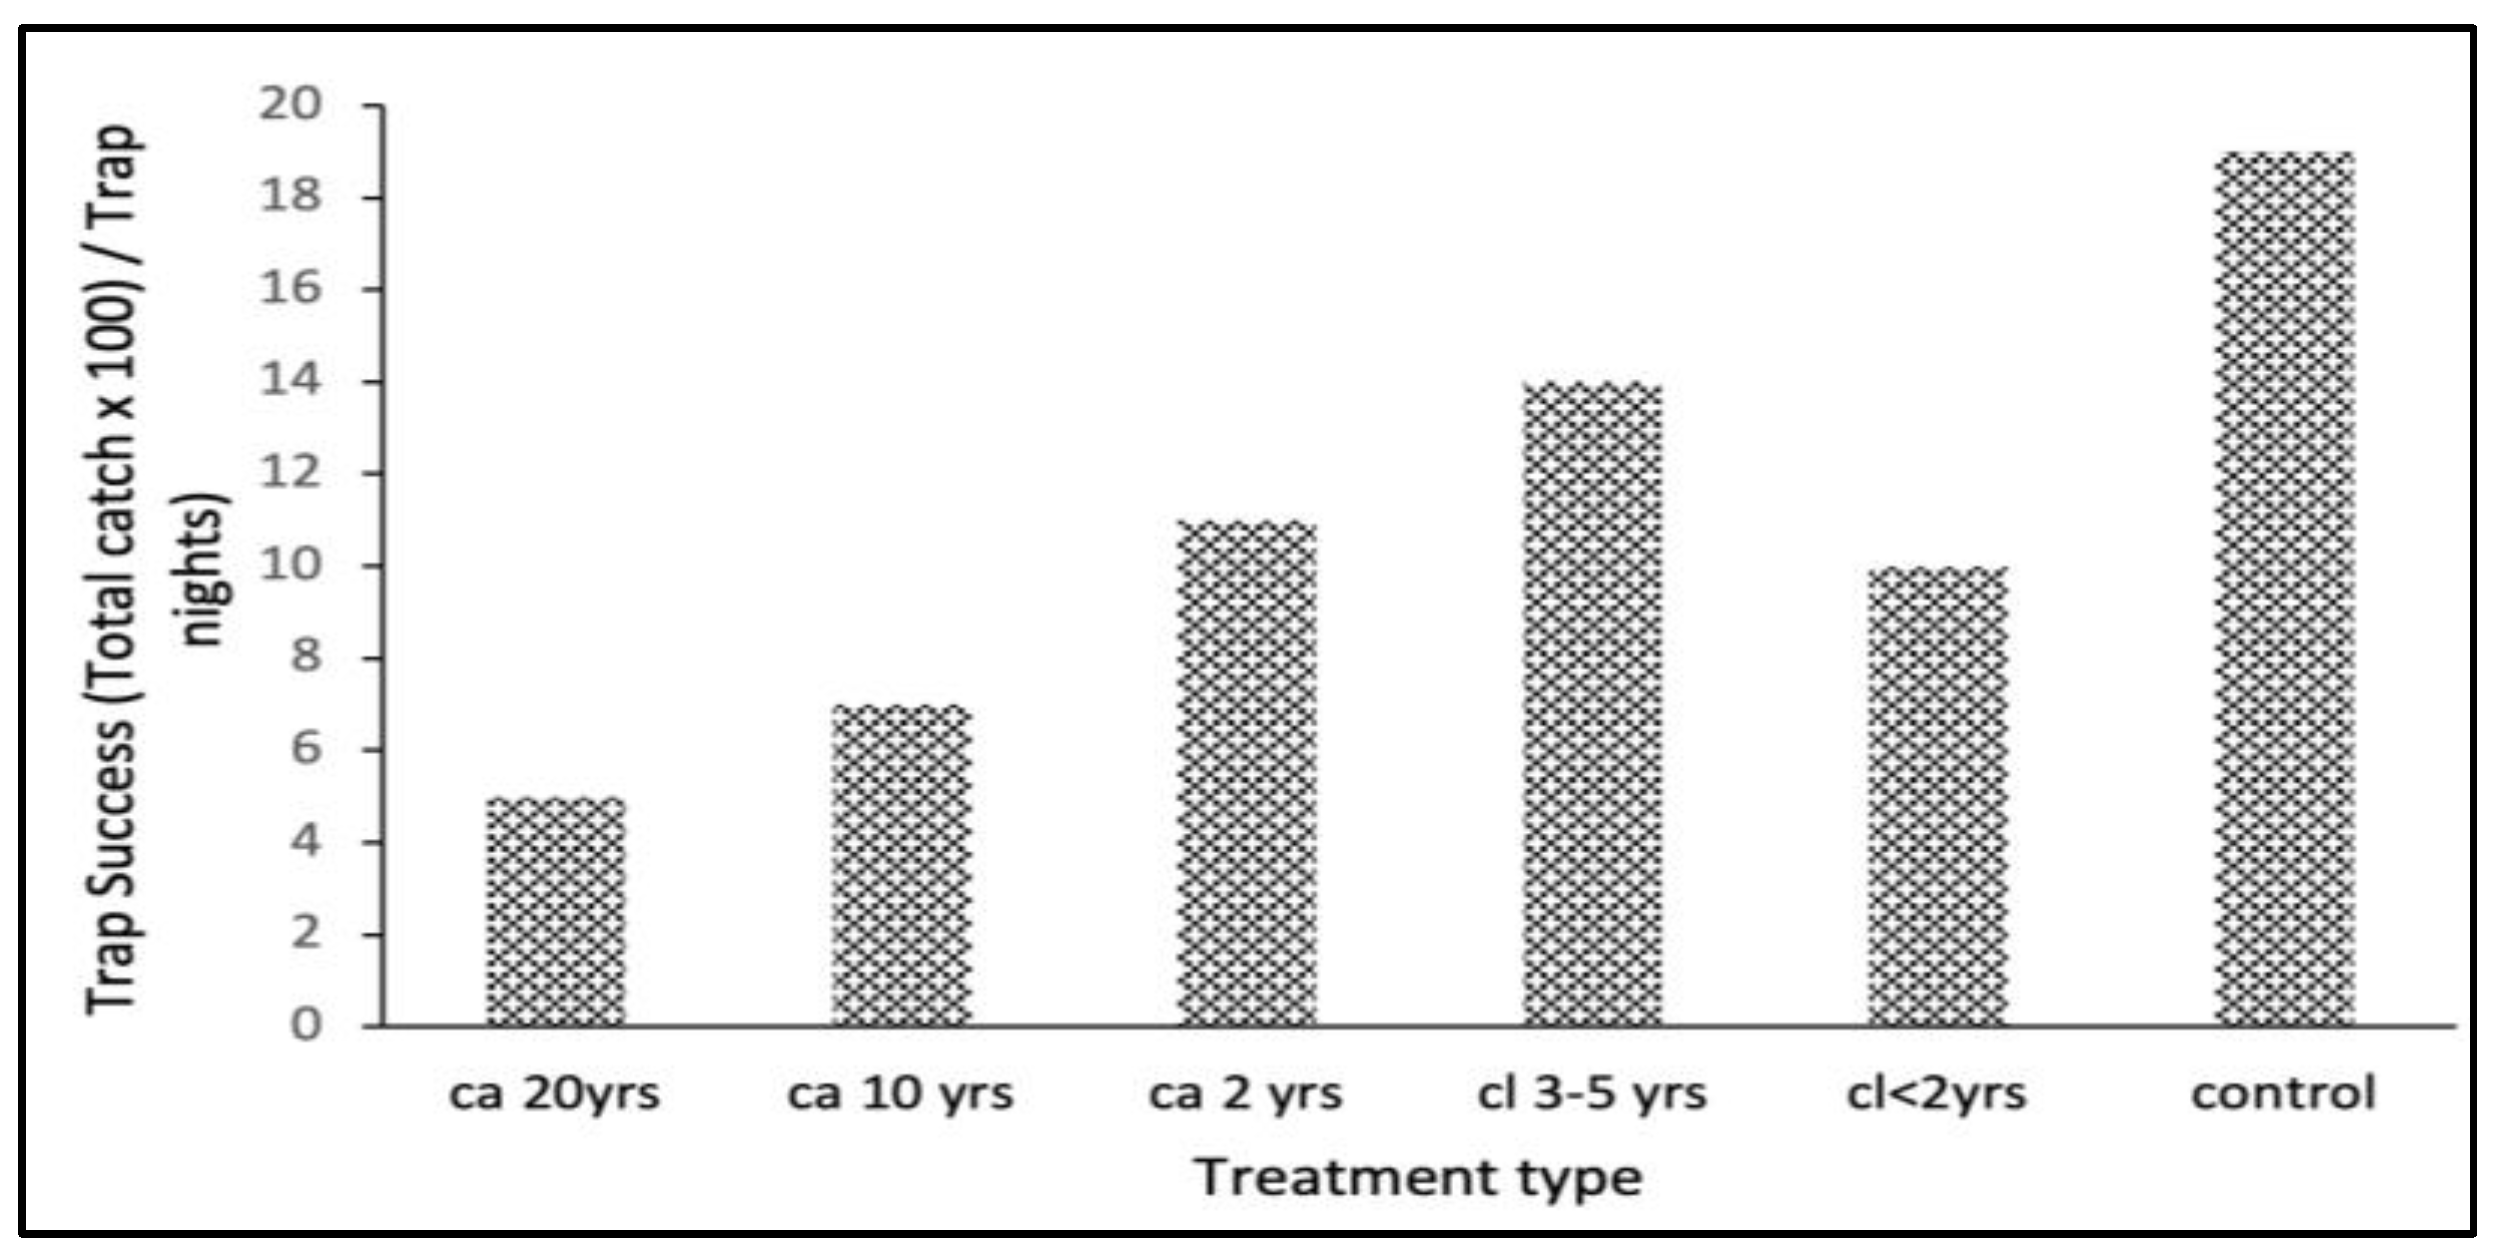
Trap success generally decreased with an increase in invasion by L. camara. The highest trap success was in the control area, the area that had not been invaded by L. camara, followed by the areas that had been cleared and those that had not been invaded in order of expected L. camara invasion (Figure 5). The area cleared in the previous 2 years had a lower trap success than the control but did not match the overall trend.
The Jack-knife 1 species richness estimators indicated that the study species inventory was between 80% and 98% complete, and the Chao1 showed it to be between 68% and 87% complete (Supplementary Table S2).
The ANOVA revealed a significant difference in rodent species richness across the treatments (F5 = 3.877, p = 0.025; Figure 1). Multiple pairwise comparisons were used to determine which treatment pairs were significantly different. The Tukey test revealed differences between the pairs cl. < 2 yrs–ca. 20 yrs, cl. 3–5 yrs–ca. 20 yrs and ca. 20 yrs–control (Figure 6), with adjusted p-values of 0.050, 0.020, and 0.001, respectively.
The results of a GLMM showed that treatment type (Wald χ25 = 10.62; p = 0.050) was a significant predictor of the number of small mammals trapped, with the highest number of rodents trapped in the control followed by areas that had been cleared of L. camara for cl. 3–5 yrs, cl < 2 yrs, and areas that have been invaded by L. camara as follows: ca. 2 yrs, ca. 10 yrs, ca. 20 yrs, respectively (Figure 7).
There were significant differences in species richness found for treatments: cl. 3–5 yrs, cl. < 2 yrs, ca. 2 yrs, and the control. However, no significant differences were found for treatments ca. 20 yrs (Table 5).

3.2.2. Species Diversity by Treatments and Season

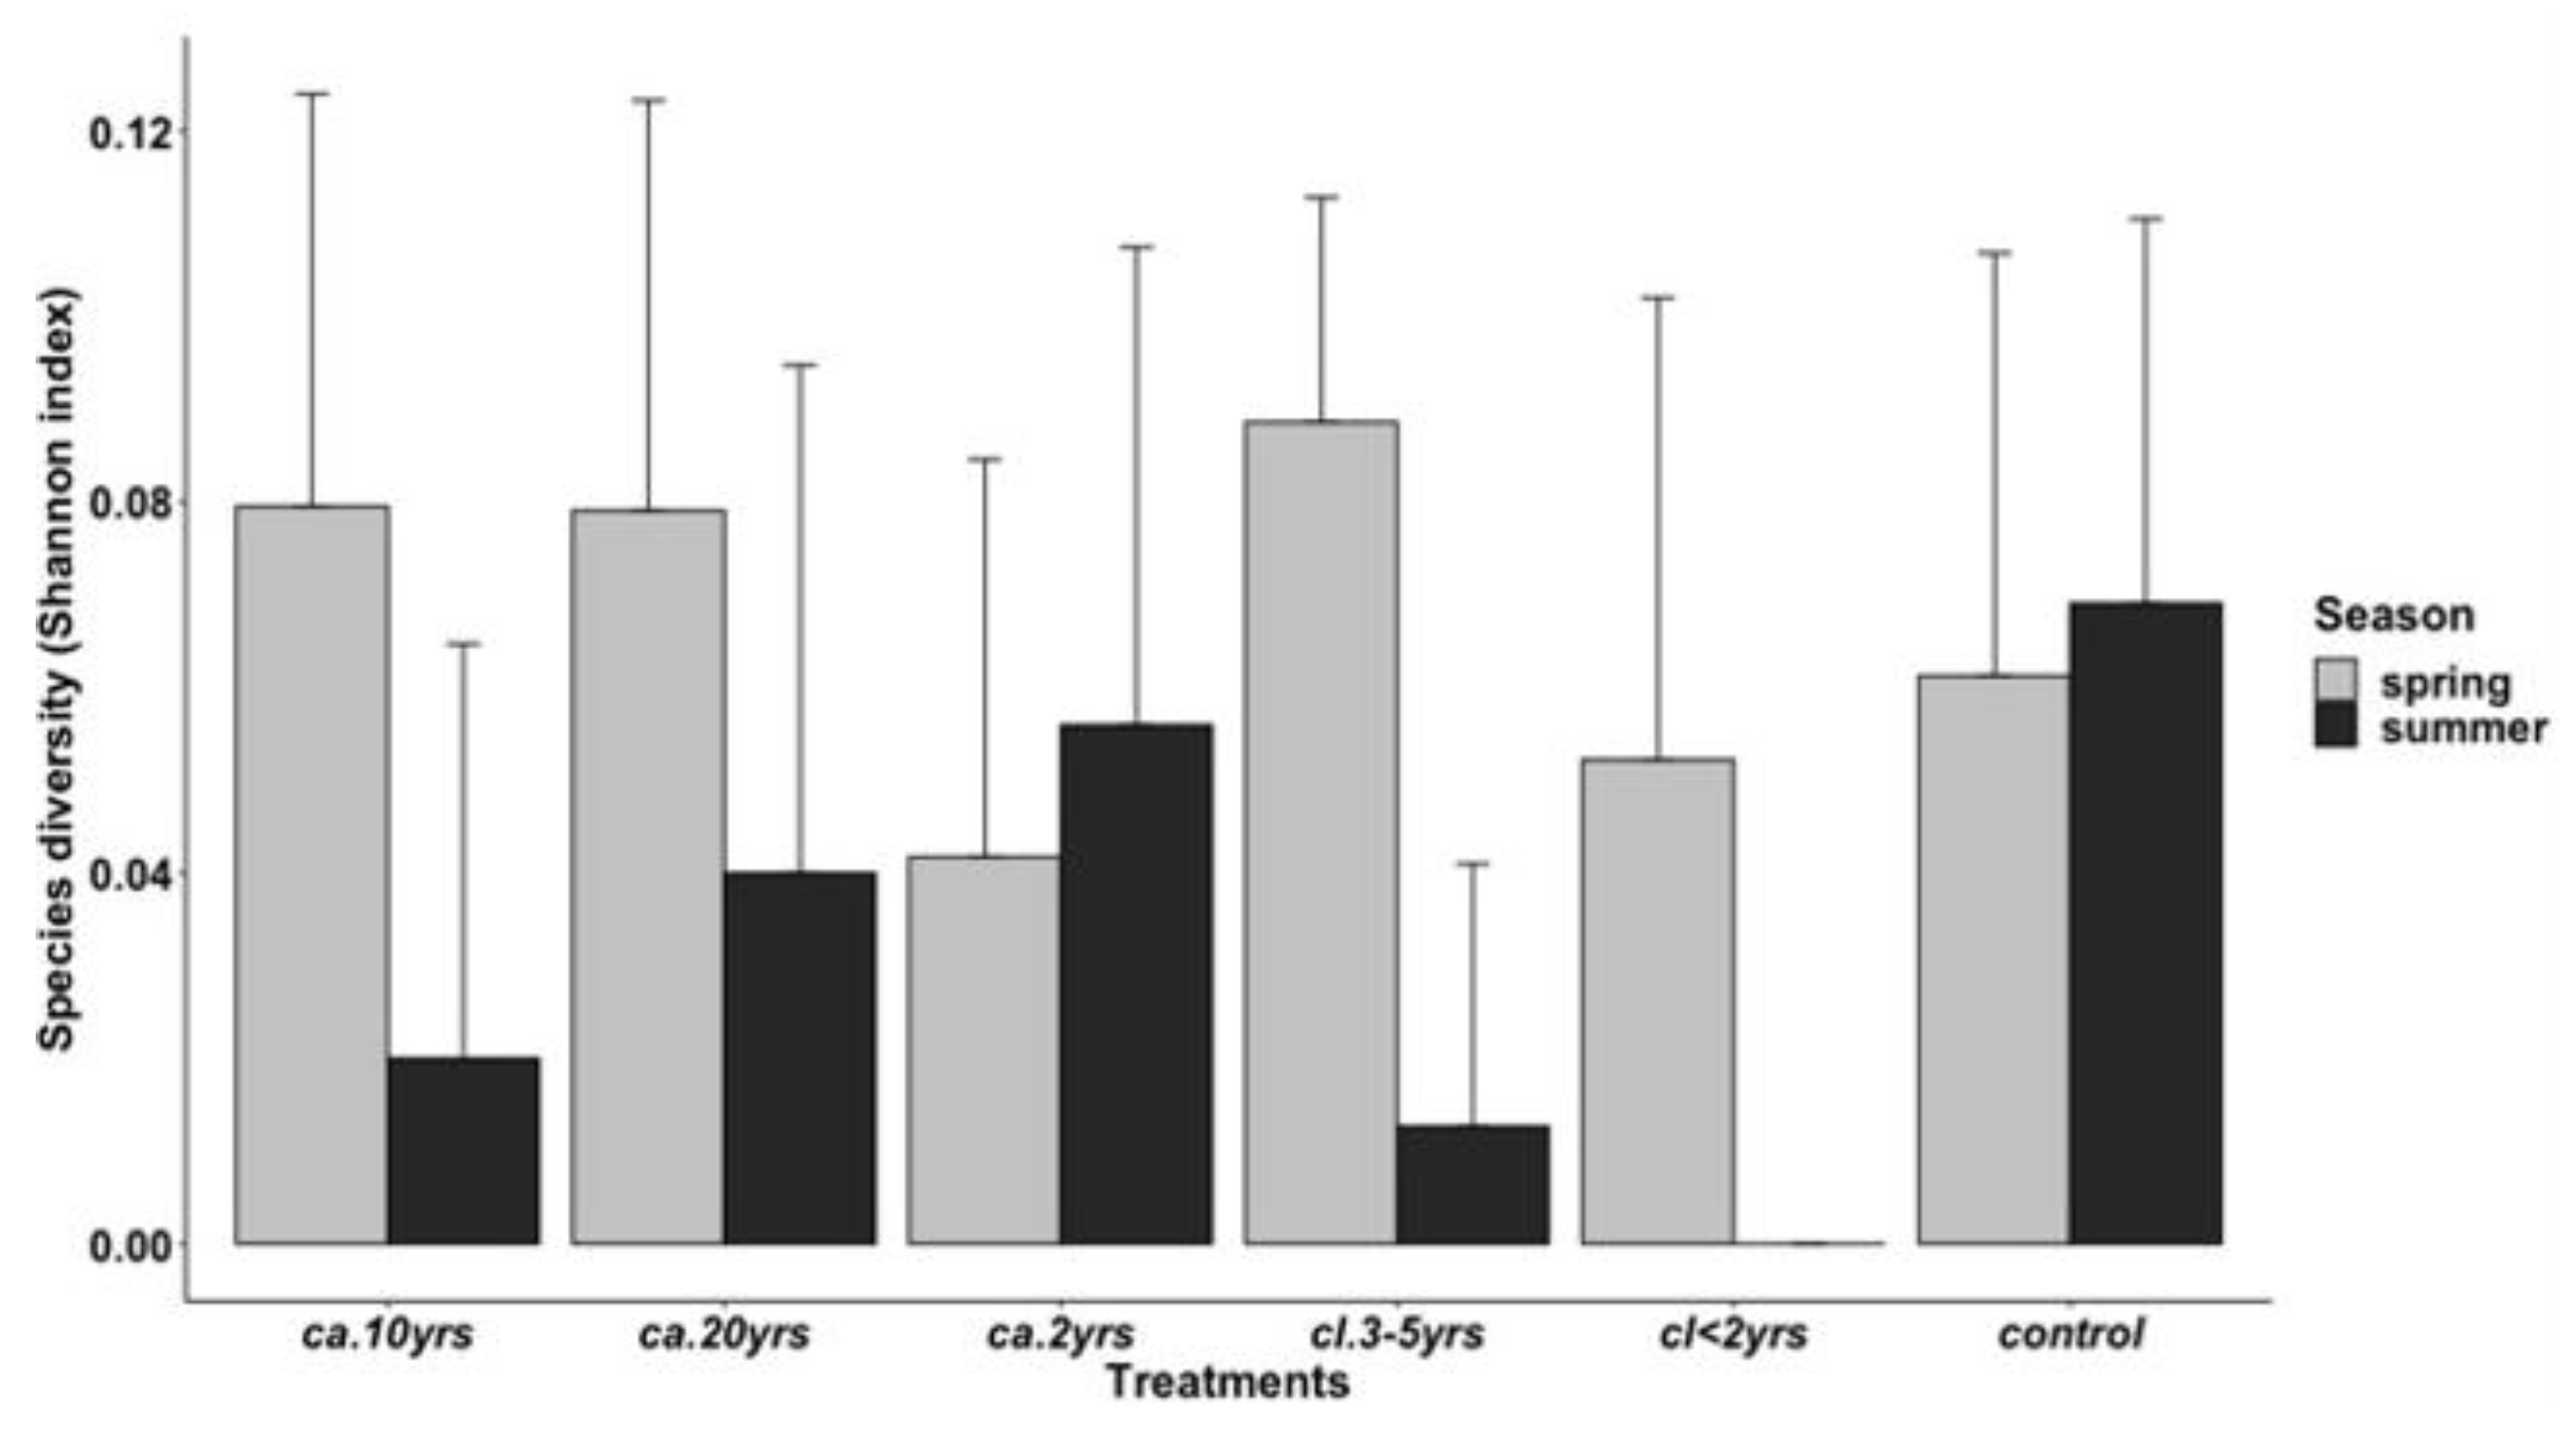
The ANOVA revealed statistically significant differences for species diversity between treatments (F5 = 0.934; p < 0.001) and by season (F1 = 9.122 p = 0.003). For most treatments, species diversity was higher during the spring season except for the ca. 2 yrs and the control (Figure 8).

3.2.3. Rodent Weight by Seasons across Treatments

A series of separate GLMMs were applied as follows: models with (1) no interaction, (2) one-way, (3) two-way interaction for the weight of the rodents as the outcome variable. The model with a two-way interaction produced the lowest AIC value (3614.1) in comparison to the other two models.
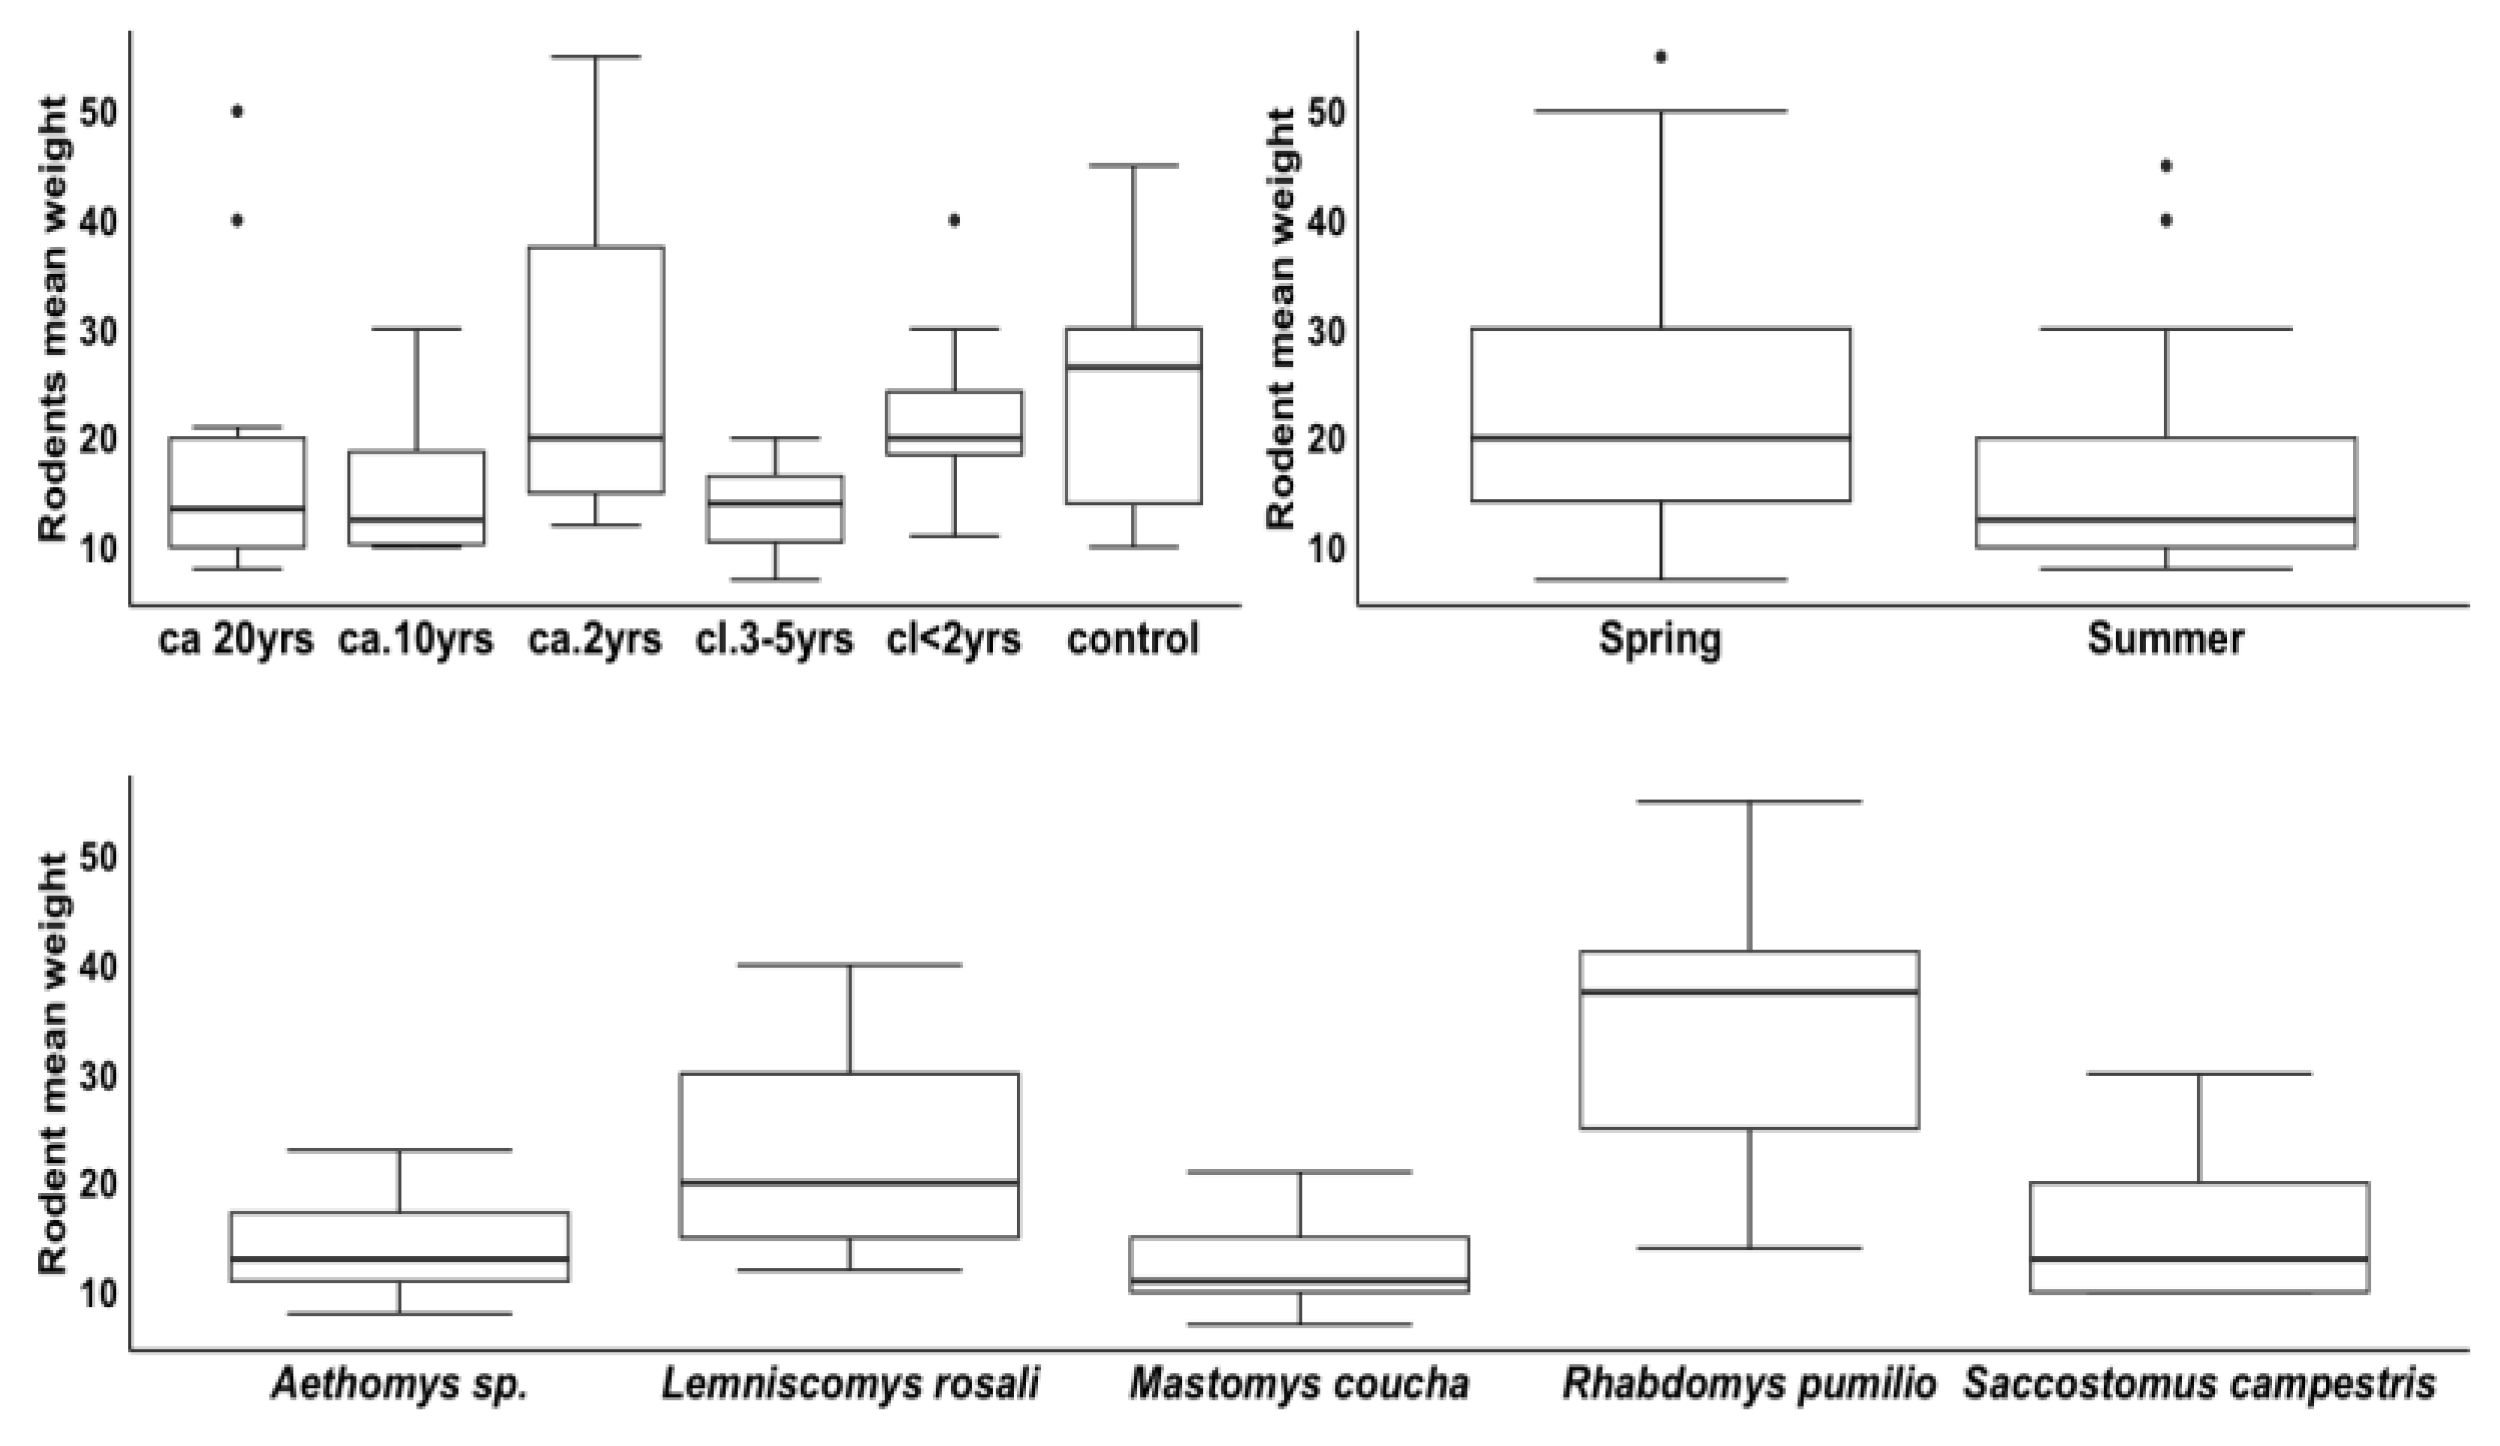
The weight of the rodents was significantly predicted by treatment (Wald χ25 = 47.52; p < 0.001), season (Wald χ21 = 16.98; p < 0.001) and species (Wald χ24 = 129.53; p < 0.001; Figure 9). However, the two-way interaction between season and species (Wald χ24 = 1.236; p = 0.873) did not predict the weight of the rodents. Rodents with the highest mean weights were found in the control area, in the spring season, and Rhabdomys pumilio was the most captured rodent across all treatments (Figure 9).
There were significant differences found for the weight of the rodents for treatments ca. 2 yrs, cl. 3–5 yrs; control for season: summer and for species: Lemniscomys rosalia, Mastomys coucha, and Saccostomus campestris (Table 6).

4. Discussion

The study assessed the impact of an invasive shrub L. camara on mammals of the Groenkloof Nature Reserve. For large mammals, the highest species abundance, richness, and diversity occurred where no L. camara had ever invaded. For small mammals, their weight was found to vary by treatment type, and these weights also varied by season across different treatments. The distance of treatments from the water source had no effect on large mammal species richness, which is especially surprising because large mammals are reported by most studies to frequent a water source to hydrate [51,52,53,54,55]. One explanation for this lack of effect could be that distances to the water are relatively short for a large mammal and do not affect long-term species richness. Nevertheless, the L. camara density around the treatments had a significant influence on species richness inside the GNR, as expected; treatments with the lower density of L. camara carried the highest species richness. A number of studies have reported that invasive plants can cause a significant impact on animals in the natural environment [5,15,51]. Pyšek et al. [56] reported that invasive plants caused a significant impact on resident animal richness in a global assessment study that included 167 invasive species belonging to 49 families. In South Africa, Dumalisile and Somers [15] published a study in 2017 that found that the invasive Chromolena odorata negatively affected large mammal species diversity in the Hluhluwe-Imfolozi Park. Studies have shown that landscapes with a higher density of invasive plant species can increase predation risk because they provide dense patches that can create an opportunity for carnivores to attack their prey [57,58].
Sampson et al. [59] reported that specific vegetation over general habitat types drives wildlife habitat use. In this study, the hypothesis that large mammal species richness would be affected differently across vegetation types based on their foraging guild was found to be true. Only grazers were recorded across the two vegetation types, but the highest number of grazers were recorded in the bush-dominated plots. L. camara has been shown to destroy grass where it occurs [5,60] and to limit or exclude native grass species through competition [61]. These effects are likely to explain the negligible number of grazers in the grass-dominated plots. Mixed feeders were only found in the bush-dominated plots, which could be due to similar reasons.
Canis moesomelas, the only carnivore found in the study, was affected by L. camara invasion across all feeding guilds. Dutra et al. [57] reported that invasive plant species alter consumer behaviour by providing refuge from predation. C. moesomelas were recorded in this study with potential prey such as the browser antelopes Tragelaphus strepsiceros and Sylvicapra grimmia and more in bush-dominated sites. The absence of mixed feeders and browsers in grass-dominated sites most likely limited the hunting range to bush-dominated sites. However, C. moesomelas are reported to be opportunistic and only rarely hunt antelopes when the availability of carcasses is reduced [62]. In a small, protected area like the GNR, this predation behaviour is more likely because there are no larger carnivores to kill prey for them to scavenge on. Thickets formed by L. camara could be a hindrance in this predation and could also provide a hideout for prey. These possibilities might explain the larger number of C. moesomelas found in the plots with no L. camara.
Most Equus quagga in the study were found in one ca. 2 yrs treatment that was next to a natural water source. This finding could be attributed to the possibility that Equus quagga could be less sensitive to food shortages, as suggested by long-term research in the Serengeti ecosystem and in the Kruger National Park [37].
In Kenya, L. camara was reported to replace indigenous vegetation, threatening the habitat of Hippotragus niger antelope [63]. This should be a concern for the management of the study area because Hippotragus niger antelope were recently introduced to the reserve.
Plumptre et al. [63] reported food supply, and availability of vegetation for herbivores and prey for carnivores, as one of the determining factors for large mammal abundance. This could also be attributed to the fact that large mammals tend to neglect any disturbed habitat [64]. Thus, as expected, the study found the invasive weed L. camara to be linked with decreases in large mammal abundance relative to the control treatments and cleared treatments. In addition, L. camara affected the space use of these large mammals. These findings are consistent with a global assessment study by Schirmer et al. [56].
For small mammals, the most captured animal was a rodent, Rhabdomys Pumilio, which was not surprising because this mouse is common and widely distributed in Southern Africa, especially in the urban Gauteng protected areas. Skinner and Chimimba [7] reported that it entered residential areas in several localities in the Gauteng Province. Julius et al. [65] captured 84 Rhabdomys sp. in one locality in Pretoria. The negligible number of Aethomys sp. in the study was also not surprising because a scan of the literature did not reveal any capture of this species in the Gauteng province. However, this species has been successfully captured in the Limpopo [66,67,68] and KwaZulu-Natal [69] provinces.
ANOVA results indicated that rodents’ species richness and diversity differed between the treatments. From the results, species richness increased for decreasing invasion. This finding is consistent with a study by Shackleton et al. [69] in Eastern Africa that showed the negative impacts of the invasive C. odorata on native biodiversity as far as species richness was concerned. A significant relationship was also found between trap success and the diversity indices. Overall, MacDonald [70] also showed that rodent richness and diversity decreased with increasing invasion in Western Ghana. Moreover, Baker and Frischknecht [71] reported a higher small mammal population on recently cleared juniper Rangeland in Utah compared to the invaded areas. These findings suggest that habitat preference decreases with an increase in the duration of weed invasion. One likely reason for this pattern is that, apart from some rodents such as the Aethomys spp., most rodent species are unable to tolerate the high (up to 90%) shade under L. camara thickets [72].
Treatment, season, species, and all the interactions between these variables significantly predicted the median weight of the small mammal species. This study predicted that the biggest rodents in terms of weight would be found in the control area. Bigger rodents in terms of weight were found in the control area, consistent with the study prediction, and these bigger rodents were captured during the spring season. These findings were expected because most weed thickets cover native seeds preferred by granivorous rodents [27]. The L. camara weed has been reported to be unpalatable and poisonous to some mammals [73,74,75]; L. camara is toxic and invasion leads to an unavailability of natural indigenous food. In addition, the study took place during a drought period when natural food was scarce inside the reserve, which could have exacerbated the situation. In addition, the breeding activities and abundance of food have been reported to influence the movements of rodents [76].
In another laboratory study, Pour et al. [76] confirm that L. camara shows a pro-toxic effect on mice. Finally, this study confirms the avoidance of L. camara patches by rodents due to toxicity in the natural setup. Moreover, the reproductive competition model showed that striped mice (Rhabdomys pumilio) were group-living during the spring season when they become most territorial and population density was high, supporting the ecological constraints model of Schradin and Pillay [77], which could explain the biggest Rhabdomys pumilio captured in the study during the spring.
Overall, for all the mammals studied, the presence of L. camara negatively affected species abundance, richness, and diversity and how these species were distributed across the invaded and cleared areas.

5. Conclusions

In conclusion, this study emphasises the importance of alien plant invasions coupled with other factors such as season in contributing to a loss in mammal diversity. Alien plants are already known to impact other aspects of biodiversity. Thus, these results compound the need to control alien plant invasions in natural areas. The study also found that L. camara presence is associated with decreased mammal abundance and composition in invaded areas, which could cause ecosystem imbalance resulting from changes in mammal species distributions because of L. camara.

Supplementary Materials

The following supporting information can be downloaded at: https://www.mdpi.com/article/10.3390/biology12020296/s1, Table S1: Number of tracks of large mammal species and the treatments where the species were recorded inside the Groenkloof Nature Reserve, South Africa. See methodology for treatment definition; Table S2: Abundance and species richness of rodents in six treatments inside the Groenkloof Nature Reserve, in South Africa surveyed in 2019 and 2020. See methodology for a description of treatments; Table S3 Output of a GLMM model for comparisons of the weight of the rodents by treatments, season, and species. Significant predictors are shown in bold.

Author Contributions

All authors, T.D.R. and K.J.D. contributed to the study’s conception and design. Material preparation, data collection, and analysis were performed by T.D.R. The first draft of the manuscript was written by T.D.R. and all authors commented on previous versions of the manuscript. All authors have read and agreed to the published version of the manuscript.

Funding

This research was funded by the National Research Foundation of South Africa (Grant Number 131604).

Institutional Review Board Statement

Trapping was conducted with the approval of the GNR Management and the City of Tshwane Animal ethics committee (GNR 2019/21).

Informed Consent Statement

Not applicable.

Data Availability Statement

The data set used for this study is with the corresponding author and is available upon request.

Acknowledgments

The authors would like to thank the Groenkloof Nature Reserve interns from the Tshwane University of Technology for assistance with fieldwork, and Nokuthula Ngwenyama for coordinating the assistance every morning throughout the study.

Conflicts of Interest

The authors declare no conflict of interest.

References

  1. Cilliers, C.J.; Neser, S. Biological control of Lantana camara (Verbenaceae) in South Africa. Agric. Ecosyst. Environ. 1991, 37, 57–75. [Google Scholar] [CrossRef]
  2. De Lacy, P.; Shackleton, C.M. Woody plant species richness, composition, and structure in urban sacred sites, Grahamstown, South Africa. Urban Ecosyst. 2017, 20, 1169–1179. [Google Scholar] [CrossRef]
  3. Waits, L.P.; Paetkau, D. Non-invasive genetic sampling tools for wildlife biologists: A review of applications and recommendations for accurate data collection. J. Wildl. Manag. 2005, 69, 1419–1433. [Google Scholar] [CrossRef]
  4. Van Wilgen, B.W.; Reyers, B.; Le Maitre, D.C.; Richardson, D.M.; Schonegevel, L. A biome-scale assessment of the impact of invasive alien plants on ecosystem services in South Africa. J. Environ. Manag. 2016, 89, 336–349. [Google Scholar] [CrossRef]
  5. Howison, R.A.; Olff, H.; van de Koppel, J.; Smit, C. Biotically driven vegetation mosaics in grazing ecosystems: The battle between bioturbation and biocompaction. Ecol. Monogr. 2017, 87, 363–378. [Google Scholar] [CrossRef]
  6. Van Oosterhout, C.; Hutchinson, W.F.; Wills, D.P.; Shipley, P. MICRO-CHECKER: Software for identifying and correcting genotyping errors in microsatellite data. Mol. Ecol. Notes 2004, 4, 535–538. [Google Scholar] [CrossRef]
  7. Skinner, J.D.; Chimimba, C.T. The Mammals of the Southern African Sub-Region, 3rd ed.; Skinner, J.D., Chimimba, C.T., Eds.; Cambridge University Press: Pretoria, South Africa, 2005. [Google Scholar]
  8. Stuart, S.N.; Chanson, J.S.; Cox, N.A.; Young, B.E.; Rodrigues, A.S.; Fischman, D.L.; Waller, R.W. Status and trends of amphibian declines and extinctions worldwide. Science 2004, 306, 1783–1786. [Google Scholar] [CrossRef] [PubMed]
  9. Sisk, T.D.; Launer, A.E.; Switky, K.R.; Ehrlich, P.R. Identifying extinction threats: Global analyses of the distribution of biodiversity and the expansion of the human enterprise. In Ecosystem Management; Springer: New York, NY, USA, 1994; pp. 53–68. [Google Scholar]
  10. Ceballos, G.; Ehrlich, P.R.; Dirzo, R. Biological annihilation via the ongoing sixth mass extinction signaled by vertebrate population losses and declines. Proc. Natl. Acad. Sci. USA 2017, 114, E6089–E6096. [Google Scholar] [CrossRef]
  11. Amin, R.; Baral, H.S.; Lamichhane, B.R.; Poudyal, L.P.; Lee, S.; Jnawali, S.R.; Acharya, K.P.; Upadhyaya, G.P.; Pandey, M.B.; Shrestha, R.; et al. The status of Nepal’ s mammals. J. Threat. Taxa 2018, 10, 11361–11378. [Google Scholar] [CrossRef]
  12. Brooks, T.M.; Mittermeier, R.A.; Mittermeier, C.G.; Da Fonseca, G.A.; Rylands, A.B.; Konstant, W.R.; Flick, P.; Pilgrim, J.; Oldfield, S.; Magin, G.; et al. Habitat loss and extinction in the hotspots of biodiversity. Conserv. Biol. 2002, 16, 909–923. [Google Scholar] [CrossRef] [Green Version]
  13. Ewel, J.J.; O’Dowd, D.J.; Bergelson, J.; Daehler, C.C.; D’Antonio, C.M.; Gómez, L.D.; Gordon, D.R.; Hobbs, R.J.; Holt, A.; Hopper, K.R.; et al. Deliberate introductions of species: Research needs: Benefits can be reaped, but risks are high. BioScience 1999, 49, 619–630. [Google Scholar] [CrossRef]
  14. Ehrenfeld, J.G. Invasion of deciduous forest preserves in the New York metropolitan region by Japanese barberry (Berberis thunbergii DC.). J. Torrey Bot. Soc. 1997, 124, 210–215. [Google Scholar] [CrossRef]
  15. Dumalisile, L.; Somers, M.J. The effects of an invasive alien plant (Chromolaena odorata) on large African mammals. Nat. Conserv. Res. 2017, 2, 102–108. [Google Scholar] [CrossRef]
  16. Ramaswami, G.; Sukumar, R. Invasive plants in the tropics and the Case of Lantana camara. In Tropical Conservation: Perspectives on Local and Global Priorities; Aguirre, A.A., Sukumar, R., Eds.; Oxford University Press: New York, NY, USA, 2016; p. 154. [Google Scholar]
  17. Maluleke, X.G. Modeling and Explaining the Distribution of Lantana camara in South African Savanna Ecosystems. Ph.D. Thesis, University of KwaZulu-Natal, Durban, South Africa, 2019. [Google Scholar]
  18. Lasmar, C.J.; Rosa, C.; Queiroz, A.; Nunes, C.A.; Imata, M.M.; Alves, G.P.; Nascimento, G.B.; Ázara, L.N.; Vieira, L.; Louzada, J.; et al. Temperature and productivity distinctly affect the species richness of ectothermic and endothermic multitrophic guilds along a tropical elevational gradient. Oecologia 2021, 197, 243–257. [Google Scholar] [CrossRef] [PubMed]
  19. Paredes, O.S.L.; Norris, D.; Oliveira, T.G.D.; Michalski, F. Water availability not fruitfall modulates the dry season distribution of frugivorous terrestrial vertebrates in a lowland Amazon forest. PLoS ONE 2017, 12, e0174049. [Google Scholar] [CrossRef]
  20. Weidlich, E.W.; Flórido, F.G.; Sorrini, T.B.; Brancalion, P.H. Controlling invasive plant species in ecological restoration: A global review. J. Appl. Ecol. 2020, 57, 1806–1817. [Google Scholar] [CrossRef]
  21. Mills, J.N.; Childs, J.E.; Ksiazek, T.G.; Peters, C.J.; Velleca, W.M. Methods for Trapping and Sampling Small Mammals for Virologic Testing; U.S. Department of Health & Human Services: Atlanta, GA, USA, 1995.
  22. Kuiper, T.R.; Parker, D.M. Grass height is the determinant of sheep grazing effects on small mammals in a savanna ecosystem. Rangel. J. 2013, 35, 403–408. [Google Scholar] [CrossRef]
  23. Osborn, T.C.; Butrulle, D.V.; Sharpe, A.G.; Pickering, K.J.; Parkin, I.A.; Parker, J.S.; Lydiate, D.J. Detection and effects of a homeologous reciprocal transposition in Brassica napus. Genetics 2003, 165, 1569–1577. [Google Scholar] [CrossRef] [PubMed]
  24. Ceradini, J.P.; Chalfoun, A.D. Species’ traits help predict small mammal responses to habitat homogenization by an invasive grass. Ecol. Appl. 2017, 27, 1451–1465. [Google Scholar] [CrossRef]
  25. Haack, N.; Grimm-Seyfarth, A.; Schlegel, M.; Wirth, C.; Bernhard, D.; Brunk, I.; Henle, K. Patterns of richness across forest beetle communities—A methodological comparison of observed and estimated species numbers. Ecol. Evol. 2021, 11, 626–635. [Google Scholar] [CrossRef]
  26. McHugh, D.; Goldingay, R.L.; Parkyn, J.; Goodwin, A.; Letnic, M. Short-term response of threatened small macropods and their predators to prescribed burns in subtropical Australia. Ecol. Manag. Restor. 2020, 21, 97–107. [Google Scholar] [CrossRef]
  27. Apolloni, N.; Grüebler, M.U.; Arlettaz, R.; Gottschalk, T.K.; Naef-Daenzer, B. Habitat selection and range use of little owls in relation to habitat patterns at three spatial scales. Anim. Conserv. 2018, 21, 65–75. [Google Scholar] [CrossRef]
  28. Austad, S.N.; Kristan, D.M. Are mice calorically restricted in nature? Aging Cell 2003, 2, 201–207. [Google Scholar] [CrossRef] [PubMed]
  29. Malo, A.F.; Godsall, B.; Prebble, C.; Grange, Z.; McCandless, S.; Taylor, A.; Coulson, T. Positive effects of an invasive shrub on aggregation and abundance of a native small rodent. Behav. Ecol. 2013, 24, 759–767. [Google Scholar] [CrossRef]
  30. Van Wyk, J. Groenkloof Nature Reserve The oldest in Africa? Afr. Wildl. Eppindust- 2004, 58, 10–14. [Google Scholar]
  31. Tauoatsoala, P.; Coetzee, W.J.L.; Hermann, U.P. Perceptions of visitors on sustainable tourism practices in an urban nature reserve: The case of Groenkloof Nature Reserve, South Africa. Afr. J. Phys. Act. Health Sci. 2017, 23, 608–620. [Google Scholar]
  32. Eckhardt, H.C.; Van Rooyen, N.; Bredenkamp, G.J. Plant communities and species richness of the Agrostis lachnantha–Eragrostis plana wetlands of northern KwaZulu-Natal. S. Afr. J. Bot. 1996, 62, 306–315. [Google Scholar] [CrossRef]
  33. Grobler, C.H. The Vegetation Ecology of Urban Open Spaces in Gauteng. Ph.D. Thesis, University of Pretoria, Pretoria, South Africa, 2006. [Google Scholar]
  34. Kamffer, D. ECOCHECK. 2006. Available online: https://sahris.sahra.org.za/sites/default/files/additionaldocs/Appendix%20D-%20Biodiversity%20EIA%20Report%28EIA%29.pdf (accessed on 10 February 2023).
  35. Rovero, F.; Martin, E.; Rosa, M.; Ahumada, J.A.; Spitale, D. Estimating species richness and modeling habitat preferences of tropical forest mammals from camera trap data. PLoS ONE 2014, 9, e103300. [Google Scholar] [CrossRef]
  36. Espartosa, K.D.; Pinotti, B.T.; Pardini, R. Performance of camera trapping and track counts for surveying large mammals in rainforest remnants. Biodivers. Conserv. 2011, 20, 2815–2829. [Google Scholar] [CrossRef]
  37. Schwarz, C.J.; Seber, G.A. Estimating animal abundance: Review III. Stat. Sci. 1999, 14, 427–456. [Google Scholar] [CrossRef]
  38. Suryawanshi, K.R.; Bhatnagar, Y.V.; Mishra, C. Standardizing the double-observer survey method for estimating mountain ungulate prey of the endangered snow leopard. Oecologia 2012, 169, 581–590. [Google Scholar] [CrossRef] [PubMed]
  39. Stuart, C. Field Guide to Tracks and Signs of Southern, Central, and East African Wildlife; Penguin Random House South Africa: Cape Town, South Africa, 2013. [Google Scholar]
  40. Conway, T.M.; Bourne, K.S. A comparison of neighborhood characteristics related to canopy cover, stem density, and species richness in an urban forest. Landsc. Urban Plan. 2013, 113, 10–18. [Google Scholar] [CrossRef]
  41. Aurélio, M.; Faleiro, F.; Lopes, V.M.; Pires, V.; Lopes, A.R.; Pimentel, M.S.; Repolho, T.; Baptista, M.; Narciso, L.; Rosa, R. Physiological and behavioral responses of temperate seahorses (Hippocampus guttulatus) to environmental warming. Mar. Biol. 2013, 160, 2663–2670. [Google Scholar] [CrossRef]
  42. Brehm, A.M.; Tironi, S.; Mortelliti, A. Effects of trap confinement on personality measurements in two terrestrial rodents. PLoS ONE 2020, 15, e0221136. [Google Scholar]
  43. Dumalisile, L. Effects of Chromolaena odorata on Mammalian Biodiversity in Hluhluwe-iMfolozi Park, South Africa. Ph.D. Thesis, University of Pretoria, Pretoria, South Africa, 2009. [Google Scholar]
  44. Jenkins, K.J.; Manly, B.F.J. A double-observer method for reducing bias in fecal pellet surveys of forest ungulates. J. Appl. Ecol. 2008, 45, 1339–1348. [Google Scholar] [CrossRef]
  45. Twigg, G.I. Marking mammals by tissue removal. In Animal Marking; Palgrave: London, UK, 1978; pp. 109–118. [Google Scholar]
  46. Krebs, C.J. Ecological Methodology; Harper and Row: New York, NY, USA, 1989. [Google Scholar]
  47. Magnussen, S.; Nord-Larsen, T. A jack-knife estimator of variance for a random tessellated stratified sampling design. For. Sci. 2019, 65, 543–547. [Google Scholar]
  48. Symonds, M.R.; Moussalli, A. A brief guide to model selection, multimodel inference, and model averaging in behavioral ecology using Akaike’s information criterion. Behav. Ecol. Sociobiol. 2011, 65, 13–21. [Google Scholar] [CrossRef]
  49. De Winton, W.E. XXXV.—On a collection of rodents from Angola. J. Nat. Hist. 1897, 20, 320–324. [Google Scholar] [CrossRef]
  50. Avery, D.M.; Avery, G. Micromammals in the Northern Cape Province of South Africa, past and present. Afr. Nat. Hist. 2011, 7, 9–39. [Google Scholar]
  51. Dickman, C.R. Habitat fragmentation and vertebrate species richness in an urban environment. J. Appl. Ecol. 1987, 24, 337–351. [Google Scholar] [CrossRef]
  52. Lamprey, H.F. Ecological separation of the large mammal species in the Tarangire game reserve, Tanganyika. Afr. J. Ecol. 1963, 1, 63–92. [Google Scholar] [CrossRef]
  53. O’Brien, C.S.; Waddell, R.B.; Rosenstock, S.S.; Rabe, M.J. Wildlife use of water catchments in southwestern Arizona. Wildl. Soc. Bull. 2006, 34, 582–591. [Google Scholar] [CrossRef]
  54. Kochenderfer, J.D.; Kochenderfer, J.N.; Miller, G.W. Controlling beech root and stump sprouts using the cut-stump treatment. North. J. Appl. For. 2006, 23, 155–165. [Google Scholar] [CrossRef]
  55. Schirmel, J.; Bundschuh, M.; Entling, M.H.; Kowarik, I.; Buchholz, S. Impacts of invasive plants on resident animals across ecosystems, taxa, and feeding types: A global assessment. Glob. Change Biol. 2016, 22, 594–603. [Google Scholar] [CrossRef] [PubMed]
  56. Pyšek, P.; Jarošík, V.; Hulme, P.E.; Pergl, J.; Hejda, M.; Schaffner, U.; Vilà, M. A global assessment of invasive plant impacts on resident species, communities and ecosystems: The interaction of impact measures, invading species’ traits and environment. Glob. Change Biol. 2012, 18, 1725–1737. [Google Scholar] [CrossRef]
  57. Dutra, H.P.; Barnett, K.; Reinhardt, J.R.; Marquis, R.J.; Orrock, J.L. Invasive plant species alter consumer behavior by providing refuge from predation. Oecologia 2011, 166, 649–657. [Google Scholar] [CrossRef] [PubMed]
  58. Mattos, K.J.; Orrock, J.L. Behavioral consequences of plant invasion: An invasive plant alters rodent antipredator behavior. Behav. Ecol. 2010, 21, 556–561. [Google Scholar] [CrossRef]
  59. Sampson, C.; Leimgruber, P.; Tonkyn, D.; Pastorini, J.; Janaka, H.K.; Sotherden, E.; Fernando, P. Effects of illegal grazing and invasive Lantana camara on Asian elephant habitat use. Biol. Conserv. 2018, 220, 50–59. [Google Scholar] [CrossRef]
  60. Te Beest, M.; Esler, K.J.; Richardson, D.M. Linking functional traits to impacts of invasive plant species: A case study. Plant Ecol. 2015, 216, 293–305. [Google Scholar] [CrossRef]
  61. Shannon, G.; Larson, C.L.; Reed, S.E.; Crooks, K.R.; Angeloni, L.M. Ecological consequences of ecotourism for wildlife populations and communities. In Ecotourism’s Promise and Peril; Springer: Cham, Switzerland, 2017; pp. 29–46. [Google Scholar]
  62. Do Linh San, E.; Malongwe, N.B.; Fike, B.; Somers, M.J.; Walters, M. A diverse autumn diet without dominant prey for opportunistic black-backed jackals Canis mesomelas. Wildl. Biol. Pract. 2009, 5, 96–103. [Google Scholar] [CrossRef]
  63. Plumptre, A.J.; Kirunda, B.; Mugabe, H.; Stabach, J.; Driciru, M.; Picton-Phillipps, G.; Ayebare, S.; Nangendo, G.; Laporte, N. The Impact of Fire and Large Mammals on the Ecology of Queen Elizabeth National Park; Wildlife Conservation Society and Woods Hole Research Centre: New York, NY, USA, 2010. [Google Scholar]
  64. Walton, C. Lantana camara (shrub); Department of Natural Resources, Queensland, Australia and IUCN/SSC, Invasive Species Specialist Group (ISSG). Available online: https://vital.seals.ac.za/vital/access/services/Download/vital:42893/SOURCE1 (accessed on 10 February 2023).
  65. Julius, R.S.; Schwan, E.V.; Chimimba, C.T. Helminth composition and prevalence of indigenous and invasive synanthropic murid rodents in urban areas of Gauteng Province, South Africa. J. Helminthol. 2018, 92, 445–454. [Google Scholar] [CrossRef]
  66. Taylor, P.J.; Munyai, A.; Gaigher, I.; Baxter, R. Afromontane small mammals do not follow the hump-shaped rule: Altitudinal variation in the Soutpansberg Mountains, South Africa. J. Trop. Ecol. 2015, 31, 37–48. [Google Scholar] [CrossRef]
  67. Wang, W.; Zhou, J.; Chen, M.; Huang, X.; Xie, X.; Li, W.; Cao, Q.; Kan, H.; Xu, Y.; Ying, Z. Exposure to concentrated ambient PM 2.5 alters the composition of gut microbiota in a murine model. Part. Fiber Toxicol. 2018, 15, 17. [Google Scholar] [CrossRef] [PubMed]
  68. Hagenah, N. Among Rodents and Rhinos: Interplay between Small Mammals and Large Herbivores in a South African Savanna. Ph.D. Thesis, Wageningen University, Wageningen, The Netherlands, 2006. [Google Scholar]
  69. Shackleton, R.T.; Witt, A.B.; Piroris, F.M.; van Wilgen, B.W. Distribution and socio-ecological impacts of the invasive alien cactus Opuntia stricta in eastern Africa. Biol. Invasions 2017, 19, 2427–2441. [Google Scholar] [CrossRef]
  70. MacDonald, I.A.W. Alien trees, shrubs and creepers invading indigenous vegetation in the Hluhluwe-Umfolozi Game Reserve Complex in Natal. Bothalia 1983, 14, 949–959. [Google Scholar] [CrossRef] [Green Version]
  71. Baker, M.F.; Frischknecht, N.C. Small mammals increase on recently cleared and seeded juniper rangeland. J. Range Manag. 1973, 26, 101–103. [Google Scholar] [CrossRef]
  72. Isabirye-Basuta, G.; Kasenene, J.M. Small rodent populations in selectively felled and mature tracts of Kibale Forest, Uganda. Biotropica 1987, 19, 260–266. [Google Scholar] [CrossRef]
  73. Negi, G.C.; Sharma, S.; Vishvakarma, S.C.; Samant, S.S.; Maikhuri, R.K.; Prasad, R.C.; Palni, L.M. Ecology and use of Lantana camara in India. Bot. Rev. 2019, 85, 109–130. [Google Scholar] [CrossRef]
  74. Akhter, M.H.; Mathur, M.; Bhide, N.K. Skin and liver toxicity in experimental Lantana camara poisoning in albino rats. Ind. J. Physiol. Pharmacol. 1990, 34, 13–16. [Google Scholar]
  75. Quirici, V.; Castro, R.A.; Ortiz-Tolhuysen, L.; Chesh, A.S.; Burger, J.R.; Miranda, E.; Cortés, A.; Hayes, L.D.; Ebensperger, L.A. Seasonal variation in the range areas of the diurnal rodent Octodon degus. J. Mammal. 2010, 91, 458–466. [Google Scholar] [CrossRef]
  76. Pour, B.M.; Latha, L.Y.; Sasidharan, S. Cytotoxicity and oral acute toxicity studies of Lantana camara leaf extract. Molecules 2011, 16, 3663–3674. [Google Scholar] [CrossRef] [PubMed]
  77. Schradin, C.; Pillay, N. Female striped mice (Rhabdomys pumilio) change their home ranges in response to seasonal variation in food availability. Behav. Ecol. 2006, 17, 452–458. [Google Scholar] [CrossRef] [Green Version]
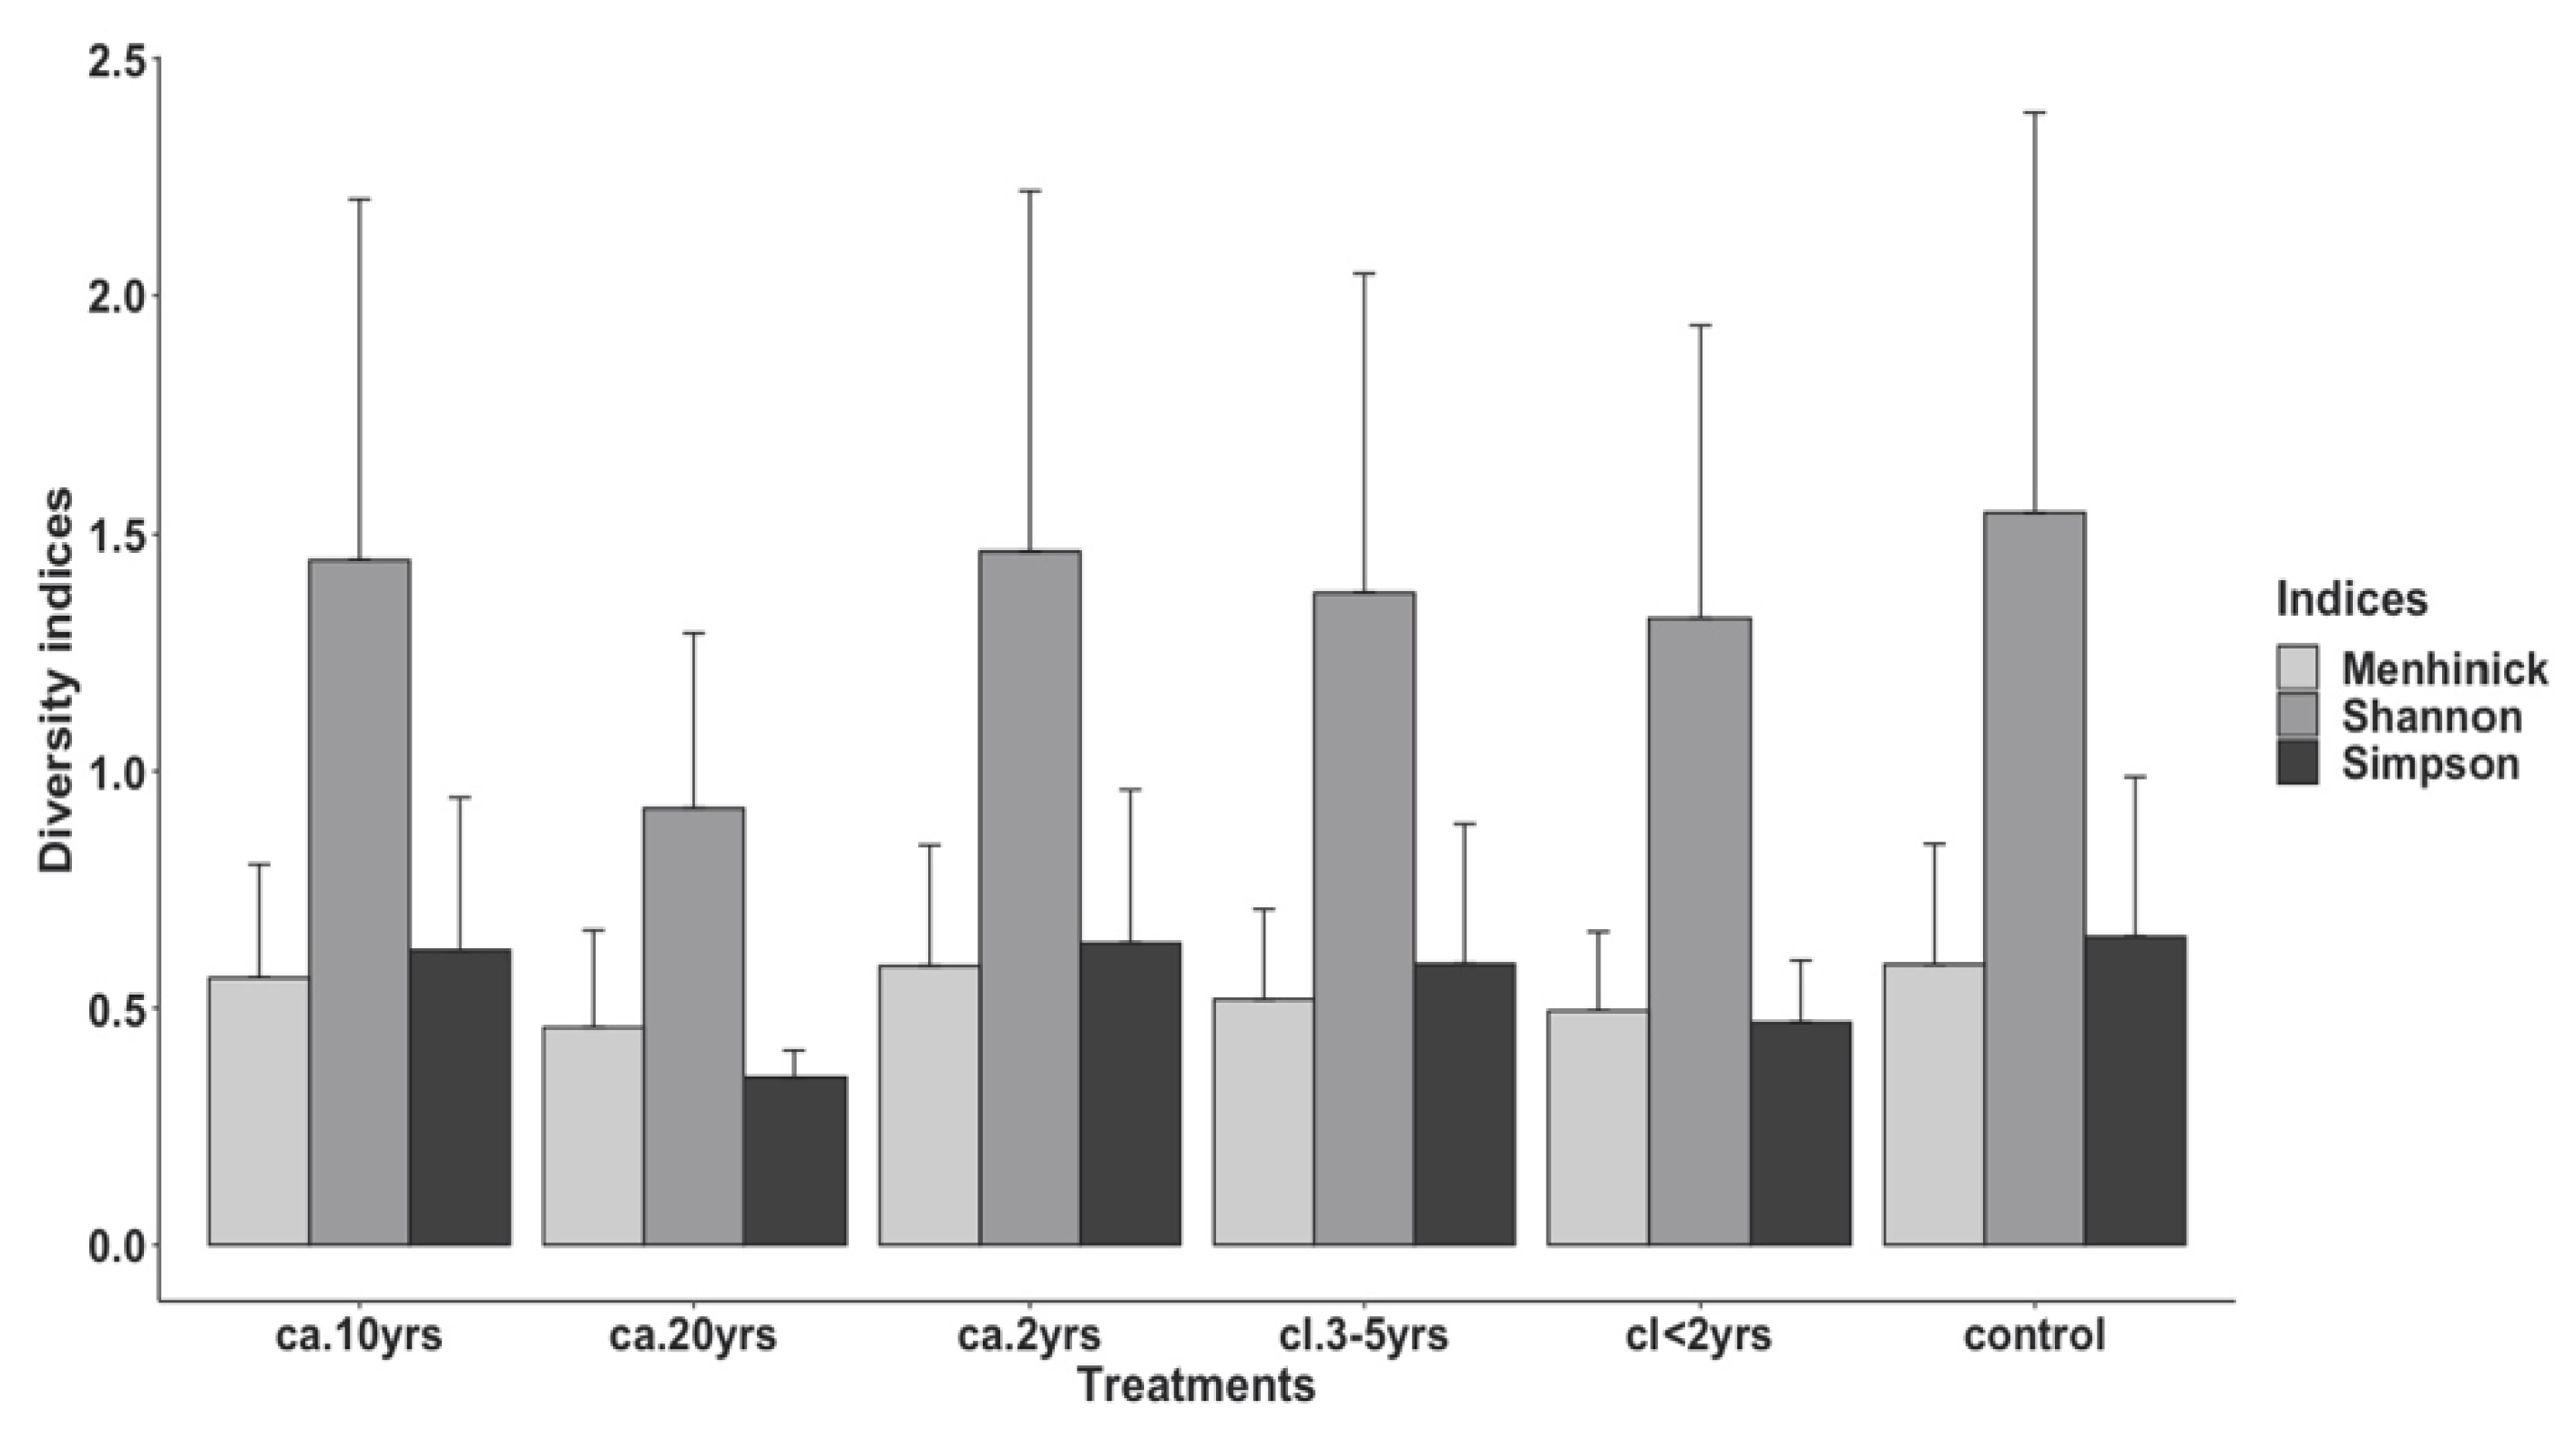
Figure 1. Mean ± SE of the diversity indices of large mammals of the Groenkloof Nature Reserve from areas of different treatments of L. camara invasion durations (ca. 2 yrs; ca. 10 yrs and ca. 20 yrs), differing L. camara clearing times (cl < 2 yrs and cl. 3–5 yrs), and a control area with no history of L. camara invasion. See Supplementary Table S1 for treatments and indices definitions.
Biology 12 00296 g001
Figure 2. MDS plot (derived from Bray_Curtis dissimilarity in square root transformed data, Stress value = 0.148) showing large mammal assemblages of the six areas with differing L. camara invasion durations (ca), differing L. camara clearing (cl) times, and a control area with no L. camara invasion in Groenkloof Nature Reserve, South Africa.
Biology 12 00296 g002
Figure 3. Scatterplots of the distribution of the overall species richness (track counts per species and per treatment type) by the density of Lantana camara around the treatments (A) and the distance of treatments from the water source (B) inside the Groenkloof Nature Reserve, South Africa.
Biology 12 00296 g003
Figure 4. Frequency of occurrence of the number of tracks per treatment by vegetation type (top left), foraging guilds for both vegetation types (top right), and the interaction between vegetation and foraging guilds, bottom two plots (IBP = Indigenous bush-dominated plots, IGP = Indigenous grass-dominated plots). Boxes show medians (solid black line across the box) and 1st and 3rd quartiles.
Biology 12 00296 g004
Figure 5. Trap success by treatment type inside the reserve.
Biology 12 00296 g005
Figure 6. Showing the mean of the diversity indices for captured animals in six different treatments inside the reserve. Asterisks show the treatment pairs that are significantly different from each other.
Biology 12 00296 g006
Figure 7. Counts of rodents trapped by treatment type.
Biology 12 00296 g007
Figure 8. Mean ± SE of the species diversity of rodents of the Groenkloof Nature Reserve from areas of differing treatments of Lantana camara invasion durations (ca. 2 yrs, ca. 10 yrs, and ca. 20 yrs), differing Lantana camara clearing times (cl. < 2 yrs and cl. 3–5 yrs), and a control area with no history of Lantana camara across two seasons.
Biology 12 00296 g008
Figure 9. The median weight of rodents by treatments, season, and species inside the Groenkloof Nature Reserve. (Lantana camara invasion durations (ca), differing Lantana camara clearing (cl) times, and a control area without Lantana camara invasion inside the Groenkloof Nature Reserve, South Africa). Dots outside the boxes represent outliers.
Biology 12 00296 g009
Table 1. Environmental conditions of the study area.
Environmental FactorsValues and SI Units
Mean annual temperature18.7 °C–24.9 °C
Average Maximum Temperature recorded24.5 °C–36 °C
Mean Annual precipitation670 mm
Altitude1082 m–1899 m above sea level
Table 2. Simper pairwise comparison test between the six treatments inside the Groenkloof Nature Reserve, South Africa. Significant values are indicated by an asterisk.
Simper Pairwise Tests between TreatmentsTest Statistics (R)Significant level%
control—ca. 2 yrs0.9410.1 *
control—ca. 10 yrs0.9930.1 *
control—ca. 20 yrs0.8730.1 *
control—cl. < 2 yrs1.0000.1 *
control—cl. < 3–5 yrs0.8060.1 *
ca. 2 yrs–ca. 10 yrs0.8950.1 *
ca. 2 yrs–ca. 20 yrs0.8830.1 *
ca. 2 yrs–cl. < 2 yrs0.9980.1 *
ca. 2 yrs–cl. < 3–5 yrs0.880.1 *
ca. 10 yrs–ca. 20 yrs0.1153.2 *
ca. 10 yrs–cl. < 2 yrs0.9960.1 *
ca. 10 yrs–cl. < 3–5 yrs0.6710.1 *
ca. 20 yrs–cl. < 2 yrs0.8490.1 *
ca. 20 yrs–cl. 3–5 yrs0.5310.1 *
cl. < 2 yrs–cl. 3–5 yrs0.6210.1 *
Table 3. Pairwise ANOSIM comparisons for the different treatment plots. Significant values are indicated by an asterisk.
Controlca. 2 yrsca. 10 yrsca. 20 yrscl. < 2 yrs
ca. 2 yrs0.211
ca. 10 yrs0.2350.874
ca. 20 yrs0.0650.3930.186
cl. < 2 yrs0.019 *0.034 *0.0510.187
cl. 3–5 yrs0.014 *0.019 *0.027 *0.0560.335
Table 4. The output of a generalized linear mixed model fitted by a maximum likelihood (Laplace Approximation) showing treatment types and vegetation type. Significant values are indicated by an asterisk.
VariablesEstimateStd ErrorZ Valuep Value
Treatments—ca. 20 yrs0.0400.0570.709p = 0.478
Treatments—ca. 2 yrs2.9670.3558.341p < 0.001 *
Treatments—cl. 3–5 yrs5.7600.2787.090p < 0.001 *
Treatments—cl. < 2 yrs7.0780.95474.163p < 0.001 *
Treatments—control6.5520.13946.848p < 0.001 *
Vegetation–IGP0.2080.9972.134p = 0.032 *
Table 5. The output of a GLMM model showing species richness by treatment types. Significant values are indicated by an asterisk.
ParametersEstimatesStd ErrorZ Valuep Value
treatments—ca. 20 yrs1.0995.774 × 10−11.903p = 0.061
treatments—ca. 2 yrs−2.340 × 1016.965 × 1040.000p = 0.040 *
treatments—cl. 3–5 yrs2.877 × 10−17.638 × 10−10.377p < 0.001 *
treatments—cl. < 2 yrs−4.055 × 10−19.129 × 10 −1−0.444p = 0.001 *
treatments—control−1.0991.155−0.951p = 0.023 *
Table 6. Output of a GLMM model for comparisons of the weight of the rodents by treatments, seasons, and species. Significant predictors are shown with asterisks.
VariablesEstimateStd ErrorZ Valuep Value
Treatments: ca. 10 yrs−0.2110.113−1.855p = 0.063
Treatments: ca. 2 yrs0.3560.1123.171p = 0.001 *
Treatments: cl. 3–5 yrs−0.2750.135−2.031p = 0.042 *
Treatments: cl. < 2 yrs0.1880.1171.600p = 0.109
Treatments: control0.3090.1182.619p = 0.008 *
Season: summer−0.3560.161−2.205p = 0.027 *
Species: Lemniscomys rosalia0.3900.1352.873p = 0.004 *
Species: Mastomys coucha−0.1420.150−0.947p = 0.343 *
Species: Rhabdomys pumilio0.8450.1276.617p < 0.001
Species: Saccostomus campestris0.0420.1460.293p = 0.769 *
Season: Summer—Species: Lemniscomys rosali0.1720.2010.855p = 0.392
Season: Summer—Species: Mastomys coucha0.0260.2360.114p = 0.909
Season: Summer—Species: Rhabdomys pumilio0.1590.1880.843p = 0.398
Season: Summer—Species: Saccostomus campestris0.0980.2180.451p = 0.652
Disclaimer/Publisher’s Note: The statements, opinions and data contained in all publications are solely those of the individual author(s) and contributor(s) and not of MDPI and/or the editor(s). MDPI and/or the editor(s) disclaim responsibility for any injury to people or property resulting from any ideas, methods, instructions or products referred to in the content.