Article

Comparative Analysis of Complete Mitochondrial Genome of Ariosoma meeki (Jordan and Snider, 1900), Revealing Gene Rearrangement and the Phylogenetic Relationships of Anguilliformes

1
Anhui Provincial Key Laboratory for Quality and Safety of Agri-Products, School of Resource and Environment, Anhui Agricultural University, Hefei 230036, China
2
State Key Laboratory of Estuarine and Coastal Research, Institute of Eco-Chongming, East China Normal University, Shanghai 200241, China
3
School of Materials and Environmental Engineering, Chizhou University, Chizhou 247000, China
4
College of Life Sciences, Hainan Normal University, Haikou 571158, China
*
Authors to whom correspondence should be addressed.
Biology 2023, 12(3), 348; https://doi.org/10.3390/biology12030348
Submission received: 14 November 2022 / Revised: 14 January 2023 / Accepted: 18 January 2023 / Published: 22 February 2023
(This article belongs to the Special Issue Palaeolimnology and Hydrobiology)

Abstract

:

Simple Summary

In this study, we report the complete mitochondrial genome of Ariosoma meeki (Anguilliformes (Congridae)), the mitochondrial genome structure and composition were analyzed. We found the mitogenome of A. meeki has undergone gene rearrangement: The ND6 and the conjoint tRNA-Glu genes were translocated to the location between the tRNA-Thr and tRNA-Pro genes, and a duplicated D-loop region was translocated to move upstream of the ND6 gene. At the same time, we speculated the possible evolutionary process of gene rearrangement, and made the hypothesis of tandem repeat and random loss for explanation. The results of phylogeny also echo this inference in Anguilliformes.

Abstract

The mitochondrial genome structure of a teleostean group is generally considered to be conservative. However, two types of gene arrangements have been identified in the mitogenomes of Anguilliformes. In this study, we report the complete mitochondrial genome of Ariosoma meeki (Anguilliformes (Congridae)). For this research, first, the mitochondrial genome structure and composition were analyzed. As opposed to the typical gene arrangement pattern in other Anguilliformes species, the mitogenome of A. meeki has undergone gene rearrangement. The ND6 and the conjoint tRNA-Glu genes were translocated to the location between the tRNA-Thr and tRNA-Pro genes, and a duplicated D-loop region was translocated to move upstream of the ND6 gene. Second, comparative genomic analysis was carried out between the mitogenomes of A. meeki and Ariosoma shiroanago. The gene arrangement between them was found to be highly consistent, against the published A. meeki mitogenomes. Third, we reproduced the possible evolutionary process of gene rearrangement in Ariosoma mitogenomes and attributed such an occurrence to tandem repeat and random loss events. Fourth, a phylogenetic analysis of Anguilliformes was conducted, and the clustering results supported the non-monophyly hypothesis regarding the Congridae. This study is expected to provide a new perspective on the A. meeki mitogenome and lay the foundation for the further exploration of gene rearrangement mechanisms.

Graphical Abstract

1. Introduction

The gene rearrangement patterns among vertebrate mitogenomes were initially considered to be conservative. The convincing nature of this concept was reinforced after the complete mitochondrial genome of mammalians was uncovered and was proven to share the same genetic order [1]; it was then weakened as more gene-rearranged species have been reported. The improvement of sequencing technology has led to an increase in the discovery of gene rearrangement in vertebrate mitogenomes over the past few years [2,3]. Approximately 4% of the reported fish mitogenomes revealed gene rearrangements [4], such as transfer, translocation, and inversion, involving 34 families, according to an analysis covering 1300 species from the National Biotechnology Information Center (NCBI) database. The occurrence of gene rearrangement has been considered as a valuable evolutionary trace of retrospective species genesis in previous research [5,6]. The Anguilliformes, which are distributed in a wide variety of environments, include 2 suborders, 19 families, and 147 genera, and comprise approximately 600 species in total [7]. To date, two types of gene arrangement patterns (traditional gene arrangement and special gene rearrangement) have been reported; the latter occurs in a small percentage of the Anguilliformes population [8,9].
The conjectures regarding gene rearrangement in mitochondrial genomes that have been proposed so far can be classified into three main hypotheses [10]. In the first scenario, Poulton et al. [11] initially analyzed human mitochondrial rearrangements and found that mitochondrial genomes were involved in DNA strand-breaking and reconnection, before homologous recombination. This model of gene rearrangement has been shown in subsequent studies involving mussels, birds, and frogs, being used as a practical tool to assist interpretation and analysis [12,13]. The second model was proposed by Arndt et al. [14] and has been widely accepted; it features the interpretation of tandem replication and the random loss of mitochondrial genomes (TDRL model). In this model, the mitochondrial rearrangement was considered to be the result of structural variation caused by the random deletion of duplicates after tandem replication in some genes [15]. This hypothesis has been adopted in many gene rearrangement studies [16,17]. The third model was proposed by Lavrov et al. [18] in the mitochondrial genome report of millipedes. The model indicates that random loss is activated after full replication by mitochondrial genes, and the loss ultimately depends on the polarity and position of the genes. Unlike the TDRL model, this one emphasizes tandem repetition and nonrandom loss (TDNL model). Given the above pioneering and characteristic hypotheses, there is no conclusive interpretation of how gene rearrangements occur and what their implications are. Slowly but surely, details about facilitation in gene rearrangement are starting to trickle in with the enrichment of the genomic databases.
Comparative genomics analysis is widely regarded as an efficient approach for phylogenetic analysis, owing to the richness of molecular information that is characterized by maternal inheritance, a high rate of evolution, and a relatively low rate of intermolecular recombination [19]. Generally, most eels are snake-like in size, featuring narrow gill pores and no pelvic fins [20]. For these reasons, much fuzziness is involved in their identification and the corresponding phylogenetic research. In this context, the advantages of molecular approaches become prominent when it comes to species with insufficient morphological data. Nevertheless, genetic information for most Anguilliformes species is insufficiently disclosed, and the location of each species within the Anguilliformes phylogeny remains elusive [8], resulting in poor understanding and controversies.
In this paper, we report a new version of the complete mitochondrial genome sequence of A. meeki; the genetic composition and arrangement of A. meeki have been described in detail and a comparative genomic analysis has been conducted for A. meeki (this study) and Ariosoma shiroanago. Interestingly, gene rearrangement was detected in both Ariosoma mitogenomes, differing from the genetic features of two published A. meeki mitogenomes (KX641476 and MN616974), which have been marked as “Unverified” in the NCBI database. Therefore, we have performed the correct sequence test and publication. At the same time, for this study, we have carried out a systematic analysis of the species evolution of Anguilliformes.

2. Materials and Methods

2.1. Sample Collection, DNA Extraction, and PCR Amplification and Sequencing

Individual A. meeki samples were collected using traditional trawling methods that have been approved in Zhoushan City, Zhejiang Province, China (30°40′30″ N, 121°20′28″ E). After the samples were collected, we preserved them with 95% ethanol and kept them permanently in a freezer at −80 °C in the museum of the National Marine Facility’s aquaculture engineering technology research center. Total DNA was extracted from the tissue of 6 individual specimens’ muscles, using an Aidlab Genomic DNA Extraction Kit (Beijing, China), following the manufacturer’s instructions. The complete mitochondrial genome of A. meeki was sequenced by Sangon Biotech (Shanghai, China), and the design primers were based on the published mitochondrial genome and then amplified in strict accordance with the requirements of the kit (Takara, China) [21].

2.2. Sequence Analysis and Assembly and Mitochondrial Genome Annotation

The complete mitogenome of the invertebrate genetic sequence was annotated using the MITOS web server (http://mitos2.bioinf.uni-leipzig.de/index.py, (accessed on 15 July 2022) [22,23] and was then manually corrected. After correcting the sequenced DNA fragment results, the CodonCode Aligner 5.1.5 (CodonCode Corporation, Dedham, MA, USA) was applied to splice the fragments and complete the creation of the mitotic genome. The Sequin software (version 15.10) was used to mark and annotate the complete mitochondrion genome sequence, to determine the location and boundary of protein-coding and the ribosomal RNA gene; the results were verified via NCBI-BLAST (http://blast.ncbi.nlm.nih.gov, accessed on 4 July 2022) comparison. MitoFish (version 3.69, http://mitofish.aori.u-tokyo.ac.jp/annotation/input.html, (accessed on 4 July 2022) was used to predict the sequence characteristics of the A. meeki mitochondrial annular genome and to map the cyclical gene. The gene rearrangements were defined using the CREx program (http://pacosy.informatik.uni-leipzig.de/crex, (accessed on 28 July 2022) [24]. The relative synonymous codon usage (RSCU) values were analyzed with MEGA 11.09 [25]. Composition skew values were calculated according to the following formulas: AT-skew = (A − T)/(A + T); GC-skew = (G − C)/(G + C) [26].

2.3. Phylogenetic Analyses

Thirty-one complete Anguilliformes mitochondrial genomes were downloaded from GenBank (https://www.ncbi.nlm.nih.gov/genbank/, (accessed on 28 July 2022) for phylogenetic studies (Table 1). Saccopharyngiformes have been thought to be closely related to Anguilliformes [27]. Therefore, two Saccopharyngiformes species, Eurypharynx pelecanoides and Saccopharynx lavenbergi, were selected as the outgroup. In the analysis, 12 PCGs sequences were selected in order to construct a phylogenetic tree using DAMBE, version 7.2.3 [28]. These PCGs did not include ND6 since the base composition was more irregular than other sequences and led to poor phylogenetic performance [29]. Sequences were aligned with default parameters, using Clustal X 2.0 [30], and were manually checked using BioEdit [31]. Ambiguous sequences were eliminated using Gblock [32]. Substitution vs. the Tamura–Nei (TN93) genetic distance in pairwise comparisons was used to test for substitution saturation, using DAMBE (version5.3.19) [33]. The third codon positions showed significant saturation, which, as a result, were defined only as purines and pyrimidines (3RY) [34]. The phylogenetic analyses were conducted utilizing the MrBayes 3.2.6 and PhyML80 software, based on Bayesian inference (BI) and maximum likelihood (ML), respectively [35,36]. The best-fit models of nucleotide substitution for each of the sequences were selected, using MrModelTest 2.2, from 33 models [37]. ML analysis uses bootstrap analysis (1000 repetitions) to verify the relative support levels [38]. Bayesian analysis was performed using default settings over four independent sets; the average standard deviation of split frequencies was < 0.01, the estimated sample size was >200, the potential scale reduction factor approached 1.0, and all parameters were checked with Tracer v. 1.6 [39]. The resulting phylogenetic trees were visualized using FigTree v. 1.4.4 and its tool (https://itol.embl.de, (accessed on 29 July 2022) [40].

3. Results and Discussion

3.1. Genome Structure and Composition

Compared to the published mitochondrial genome of bony fish, the complete mitogenome of A. meeki (17,695 bp) is within the normative range (16,099–18,247 bp) (Table 1). In all, 37 typical coding regions (13 PCGs, 22 tRNAs, 2 rRNAs) and 1 origin of replication between the WANCY structures (tRNA-Trp, tRNA-Ala, tRNA-Asn, tRNA-Cys, and tRNA-Tyr) were found in the mitogenome of A. meeki. However, two control regions (D-loops) were detected next to the tRNA-Thr and tRNA-Pro genes, respectively; the features of duplicated D-loops were distinct from most vertebrate mitogenomes [1]. The gene order of the A. meeki mitogenome was also distinctive. It indicated that the ND6 and tRNA-Glu genes were translocated upstream of tRNA-Pro and downstream of tRNA-Thr, respectively. The additional D-loop was translocated to the site ahead of ND6 as well; such structural heterogeneity is regarded as an uncommon trait among vertebrate mitogenomes [6,44].
The mitogenomic compositions and corresponding gene order for most bony fish are considered to be relatively conserved. Previous research revealed that the mitochondrial gene structure of homologous species could be analogous. For instance, many Anguilliformes species, such as the Anguilla, Simenchelys, and Synaphobranchus populations, revealed typical mitogenomic compositions (37 coding regions and two non-coding regions), and the gene arrangement among them showed a high degree of consistency, while it would be another story when it comes to other Anguilliformes species, such as Facciolella, Ariosoma, and Muraenesox, of which the species in the Ariosoma genus revealed a distinct gene rearrangement pattern [8]. In the mitogenome of A. meeki, an additional control region was detected, while one coding protein, ND6, underwent translocation (Figure 1). Compared with other non-rearranged species, such a genetic phenomenon between Cytb and ND6 can be found across the published Ariosoma mitogenome (GenBank accession number: AP010861). Nevertheless, there is only one control region in the reported mitogenome of A. shiroanago. In this study, we performed a comparison and analysis of other genetic locations between A. meeki and A. shiroanago (Table 2 and Table 3) (Figure 2, Figure 3 and Figure 4). The overall base composition was 28.93% (A), 25.39% (C), 26.14% (T), and 19.54% (G) for A. meeki, and the overall base composition was 32.54% (A), 23.90% (C), 26.85% (T), and 16.71% (G) for A. shiroanago (Table 2 and Table 3). Typically, most of the molecular components in mitochondrial genomes were closely linked with each other; 11 intergenic spacers consisting of 107 base pairs were observed in the A. meeki mitogenome. The largest region contained 49 pairs of nucleotides and was located between ND5 and Cytb; the smallest area was formed by a single 1 bp between Cytb and tRNA-Thr. As for the A. shiroanago mitogenome, the corresponding length thresholds for non-coding regions were 154 bp and 41 bp, which were situated between ND6 and tRNA-Thr, Cytb, and ND5, respectively.

3.2. PCGs and Codon Usage

Thirteen PCGs of the A. meeki and A. shiroanago mitogenomes contained 11,477 bp and 11,482 bp encoding 3825 and 3827 amino acids, respectively. The PCGs consisted of seven NADH dehydrogenases (ND1, ND2, ND3, ND4, ND4L, ND5, and ND6), three cytochrome b oxidases (COX1, COX2, and COX3), two ATPases (ATP6 and ATP8), and one cytochrome b (Cytb) [31]. Twelve genes were encoded in the H-strand, with only ND6 genes in the L-strand. Gene arrangement in both mitogenomes was similar to that of the typical vertebrate mitogenome [45,46].
The initiation codons for most PCGs were ATG, except for the COX1 gene, which was initiated with GTG (Table 2). The utilization of such an extraordinary initiation codon for the COX1 gene is observable in most teleostean mitogenomes [47]. In the A. meeki mitogenome, five PCGs (ATP8, ATP6, COX3, ND4L, and Cybt) ended by TAA, while 5 PCGs (ND1, ND2, ND3, ND5, and ND6) were terminated by TAG, COX2 and ND4 terminated with a single T, and COX1 was stopped by AGA. The phenomenon of the coding proteins ended by incomplete codons is widespread in invertebrate as well as vertebrate mitogenomes [48,49]. The probable mechanism adopted to explain this occurrence is that the codon TAA has generated the subsequent polyadenylation process through transcription [50]. Three PCGs in the A. shiroanago mitogenome owned different types of stop codons, which showed ND5 and ND6 terminated with TAA and COX1 terminated with AGG.
The modes for the codon usage of 13 PCGs between the A. meeki and A. shiroanago mitogenomes are shown in Figure 2. The amino acids primarily used in PCGs for the previous species could be Leu1, Ser2, Pro, and Thr, with Leu1, Leu2, Ser1, and Ser2 for the latter. The relative synonymous codon usage (RSCU) analysis in two Ariosoma species, in terms of the third position, is depicted in Figure 2. The utilization among two- and four-fold degenerate codons presented an overall bias toward those codons that are abundant in A.

3.3. Transfer RNAs, Ribosomal RNAs, and D-Loops

Twenty-two tRNAs in A. meeki and A. shiroanago were detected, based on their unique codons. Fourteen tRNAs were located on the heavy chain, and the rest were tRNAs (tRNA-Gln, tRNA-Ala, tRNA-Asn, tRNA-Cys, tRNA-Tyr, tRNA-Ser, tRNA-Glu, and tRNA-Pro), which were found on the light chain (Figure 1). A typical clover structure was detected among most tRNAs in both species, with the exception of tRNA-Ser1 (Figure 3 and Figure 4), which was unable to form a stable clover structure due to the lack of a complete dihydrouridine arm [51]. Twenty-two tRNAs contained 1560 base pairs in the A. meeki mitogenome, with 1562 in the A. shiroanago mitogenome. The length of each tRNA gene ranged from 64 to 76 bp in the mitogenome of A. meeki and from 66 to 76 bp in the mitogenome of A. shiroanago. The base composition was 29.03% (A), 27.12% (T), 20.45% (C), and 23.40% (G) for the former, and 29.71% (A), 28.17% (T), 20.23% (C), and 21.90% (G) for the latter. The anticodons of the mitogenomes in two Ariosoma species reflected the same usage pattern (Table 2).
The genes 12S and 16S were found to be surrounded by tRNA-Phe and tRNA-Leu1 and were separated by tRNA-Val in the A. meeki and A. shiroanago mitogenomes (Table 3). The total length of rRNAs was 2652 bp and 2687 bp in both Ariosoma mitogenomes, respectively. The base compositions of the rRNAs were 33.78% (A), 20.06% (T), 22.25% (C), and 23.91% (G) for the mitogenome of A. meeki, and 36.55% (A), 20.54% (T), 22.29% (C), and 20.62% (G) for the mitogenome of A. meek. The AT-skew and GC-skew values were 0.04 and 0.26 for the former and 0.28 and −0.04 for the latter. Such a base bias revealed the higher percentages of the adenine and cytosine nucleotides of two rRNA genes in both mitogenomes.
In the A. meeki mitogenome, two D-loops were detected downstream of tRNA-Thr and tRNA-Pro, respectively. The total length of the D-loops was 1929 bp (969 bp for D-loop1 and 960 bp for D-loop2), with an identical AT bias of 62.00% (Table 2 and Table 3). Compared to other components, both D-loops presented a higher percentage in terms of AT bias. For this reason, the D-loop region, as the main non-coding area, has been called the “AT-rich region”. The AT- and GC-skew values were 0.17 and −0.17 in both D-loops, reflecting the abundance of adenine and cytosine and the thymine deficiency and guanine. The termination of heavy chain replication could be located in two D-loops, based on the palindrome element motifs, such as “TACAT” and “ATGTA” [52] (Figure 5).
The exploration of a substitution saturation index was implemented, utilizing the aligned PCGs of 33 Anguilliformes mitogenomes. Compared to the third codon, substitution in the first and second codons was relatively low (Figure 6). The impact on the whole amino acid released by the mutation of the third codons is rather vulnerable, in comparison with that of the first two codons, which possess a constrained evolving freedom [53,54]. The substitution in the third codons, even in insect mitogenomes, remains observable, as the amino acid products were relatively insensitive to the variation in the third codons [55].

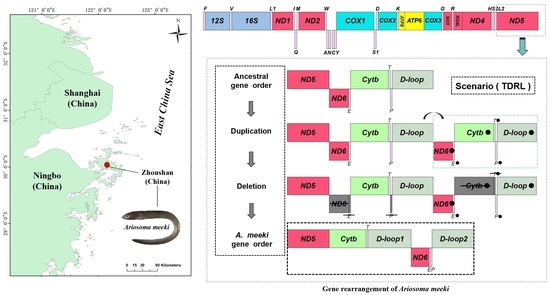
3.4. Gene Rearrangement

Since one of the published A. meeki mitogenomes (MN616974) was not annotated, another A. meeki mitogenome (KX641476) was selected to conduct a comparative genomic analysis. The results indicated that there were not any other genes behind the tRNA-Thr in KX641476; three typical genes, ND6, tRNA-Glu, and tRNA-Pro, cannot be identified, as in most mitochondrial genomes of vertebrates. On the contrary, both A. meeki (this study) and A. shiroanago have experienced gene rearrangement, with the rearranged protein-coding ND6, transfer RNA Glu, and a duplicated non-coding region, D-loop (Figure 7A).
Generally, a teleostean group possesses unique or highly similar gene arrangements. Nevertheless, two types of gene arrangements have been detected in the mitogenomes of Anguilliformes. As observed in the mitogenomes of Anguilla marmorata (Anguillidae), Ilyophis brunneus (Synaphobranchidae), Serrivomer sector (Serrivomeridae), and Gymnothorax minor (Muraenidae), which possess the typical mitochondrial structure, the genes ND6 and the conjoint tRNA-Glu were found to be typically situated between ND5 and Cytb, among which the Cytb was sandwiched by tRNA-Glu and tRNA-Pro, without the insertion of a D-loop between Cytb and ND6 [56] (Figure 7C). In the mitogenomes of A. meeki and A. shiroanago, ND6 and tRNA-Glu were translocated upstream of tRNA-Pro and downstream of tRNA-Thr, respectively, accompanied by the insertion of a larger non-coding region. Nucleotide composition and the base arrangement of two control regions display similarities to a high and low degree in the mitogenomes of A. meeki and A. shiroanago, respectively.
Three typical models are expected to explain the gene rearrangement features in Ariosoma mitogenomes. The model, based on the recombination hypothesis, was initially proposed for gene rearrangement in the nuclear genome and was generally adopted to explain small-fragment exchanges and inversion events in mitogenomes. However, our comparative analysis shows that the Ariosoma mitogenomes have undergone gene translocation and genome-scale expansion. Therefore, the discovery of mitochondrial gene rearrangement in Ariosoma mitogenomes is too far-fetched to be explained by this model. The TDNL model placed an emphasis on non-random loss. In this case, the duplication followed by the loss of genes is a predesigned resorting to the corresponding transcriptional polarity and position in the genome; the genes are clustered in the same polarity (light- or heavy-strand coding) and the gene order remains unchanged (for example, the GCT cannot be produced by gene loss alone during the duplication from TCG to TCGTCG) [18,57]. This hypothesis does not apply to the findings, as the structural variation in Ariosoma mitogenomes is not the result of alterations in the genes’ transcriptional polarity. The TDRL model underlined the rearrangement, based on the incomplete deletion of repeated genes [58]. In the A. meeki mitogenome, an extra D-loop was found downstream of tRNA-Thr; both D-loops revealed a high degree of resemblance in terms of nucleotide composition and bas-e arrangement. In addition, ND6, combined with the tRNA-Glu genes, was translocated from the stream downstream of ND5 to the upstream of tRNA-Pro. In the TDRL model, the intergenic spacers or pseudogenes were commonly detected in the rearrangement region [59,60]. In the mitochondrial genome of A. meeki, the existence of a considerable interval among ND5 and Cytb further indicated the bias to this model (Table 2). In light of that, the TDRL model was suggested for the interpretation of rearrangement events in the mitochondrial genomes of A. meeki and A. shiroanago; among them, more detections of intergenic spacers or pseudogenes may occur in the A. shiroanago mitogenome during the random loss process.
Using the hypothesis proposed that is based on the TDRL model, we reproduced the ins and outs of the gene rearrangement in the A. meeki mitogenome (Figure 7B). The probable progressive process can be illustrated as follows: firstly, the duplication of the typical mitochondrial gene block (“ND6”-“tRNA-Glu”-“Cytb”-“tRNA-Thr”-“tRNA-Pro”-“D-loop”) commenced and led to the consecutive intermediate product (“ND6”-“tRNA-Glu”-“Cytb”-“tRNA-Thr”-“tRNA-Pro”-“D-loop”-“ND6”-“tRNA-Glu”-“Cytb”-“tRNA-Thr”-“tRNA-Pro”-“D-loop”); secondly, the randomly lost events took place in the mitochondrial components, while the redundant genes (ND6, tRNA-Glu, Cytb, tRNA-Thr, and tRNA-Pro) were randomly lost during that process; finally, the gene-rearranged structure was formed as (“ND5”-“Cytb”-“tRNA-Thr”-“D-loop”-“ND6”-“tRNA-Glu”-“tRNA-Pro”-“D-loop”), although there might be an explanation as to why there is a strong resemblance between the two D-loops, in terms of nucleotide composition [44].

3.5. Phylogenetic Analysis

Fourteen highly related families (Eurypharynx pelecanoides and Saccopharynx lavenbergi, functioning as outgroups) were selected to explore the phylogenetic location of A. meeki. The phylogenetic analysis was implemented with the information revealed by phylogenetic trees (BI and ML), based on 12PCGs (the highly varied sections were manually corrected). The topology of both trees presented a high degree of consistency (Figure 8) and indicated that families (e.g., the Nettastomatidae, Muraenesocidae, and Colocongridae) with gene rearrangement grouped together and formed an independent clade, while the rest of the families (e.g., the Anguillidae, Synaphobranchidae, and Muraenidae) with the traditional gene order formed another clade. The result implied the evolution and origin of the diversified Anguilliformes species, as this pattern of the presence/absence of gene arrangement may be a potential phylogenetic marker for the identification of this morphologically conservative group of eels at the suborder level.
Both the BI and ML phylogenetic trees revealed that A. meeki and A. shiroanago were strongly related to each other; they formed a separate clade of Congridae (BI posterior probabilities [PP] = 1; ML bootstrap [BP] = 100). Consistent with previous studies, Congridae was closely related to the Muraenidae, Myrocongridae, and Synaphobranchidae [8]. Except for the family Congridae, which was deemed to be the non-monophyletic taxa [10], the rest of the families unanimously revealed the monophyletic clade, while two phylogenetic trees highly supported the non-monophyletic Congridae, and two clades were observed; such clustering results were compatible with those of previously published studies [61]. Regarding the clustering results released by an increasing number of phylogenetic studies on Anguilliformes, an independent subfamily (including Ariosoma) may be forming or may even have formed. This may offer a new perspective on the Anguilliformes taxonomy, but more available mitogenomes are needed to test this hypothesis.
The phylogeny within Anguilliformes can be further routed into two major clades: one consists of eels that presented non-gene rearrangement patterns (Synaphobranchidae, Nemichthyidae, and Serrivomeridae), while another one comprised eels demonstrating gene rearrangement features (Nettastomatidae, Congridae, Ophichthidae, Muraenesocidae, and Derichthyidae). Similar consequences can be identified in other phylogenetic research on Anguilliformes [10]. The phylogenetic tree implied the evolutionary relationship of diversified Anguilliformes species and revealed the non-monophyly of the Congridae. According to previous studies, gene rearrangements may have originated from a common ancestral species for the Congroidei population. These features, which are found on the mitochondrial genomes of the partial population, were viewed as cryptic evolutionary population traces to distinguish them from other related species that possess a relatively conserved morphology [20,62]. However, with few available Anguilliformes species with gene rearrangements, a thorough confirmation of this hypothesis or clarification of the phylogenetic relationships among Anguilliformes species could be unattainable; depictions of the phylogenetic relationships resort to abundant genomic resources among this taxon would be more authoritative.
Given the remarkable resemblance in terms of the composition (Table 2 and Table 3) and the codon usage (Table 2) (Figure 2) of PCGs, the structure of tRNA (Figure 3 and Figure 4) and the results of phylogenetic analysis (Figure 8) between A. meeki and A. shiroanago, it may be a proof of a congener and two species that belong to the Congridae genetically. The variations in mitogenome length may be attributed to incomplete sequencing or annotation. One of the D-loops that should have been located between tRNA-Thr and ND6 was found to be missing.

4. Conclusions

The arrangement of the mitochondrial genome is consistent in most vertebrate mitogenomes; two kinds of gene arrangements have been revealed in the order Anguilliformes, which leads us to some confusion about the mechanism involved. In particular, some Anguilliformes populations were known to converge into non-monophyletic results, such as species in the Congridae and Nettastomatidae [9]. As of now, there is no comprehensive elaboration for this, since the relevant research is in its infancy [63].
In this study, we reported the complete mitochondrial genome of A. meeki, analyzed the corresponding genomic information, compared it with the reported mitogenomes of A. meeki and congeneric species, and depicted the phylogenetic relationship among Anguilliformes species. The complete mitogenome of A. meeki exhibited a rearrangement of gene order, in contrast to the typical vertebrate mitogenomes; ND6 and tRNA-Glu genes were translocated upstream of tRNA-Pro and downstream of tRNA-Thr, respectively, accompanied by the insertion of a D-loop. Both D-loops exhibited a high degree of resemblance in terms of nucleotide composition and base arrangement. The phylogenetic analysis indicated that A. meeki was closely related to its congeneric, A. shiroanago. The two species clustered together as a separate clade of the Congridae family. According to previous phylogenetic studies on Anguilliformes, the non-monophyly of Congridae was reflected by utilizing a comparative genomic analysis, based on 33 mitochondrial genomes of the Anguilliformes species. Both phylogenetic trees strongly support the non-monophyly of Congridae, offering a theoretical basis for more advanced phylogenetic studies of Anguilliformes. In addition, our results provide new insight into the evolution of A. meeki and an in-depth understanding of the mechanism of gene rearrangement in the A. meeki mitogenome.

Author Contributions

In this research report, Y.H.; conceived and designed the experiments and performed sample collection, performed the experiments, analyzed the data, prepared figures and tables, wrote the original draft preparation, and reviewed and edited drafts of the paper. Z.L., J.Y. and Y.Y. analyzed the data, prepared the figures and tables, and reviewed and edited the paper. L.F., C.J. and J.C. conceived and designed the experiments, analyzed the data, contributed reagents and materials, and reviewed and edited drafts of the paper. K.Z. and H.J. conducted sample collection, performed the experiments, analyzed the data, prepared the figures and tables, wrote the original draft preparation, reviewed and edited drafts of the paper, and approved the final draft. All authors have read and agreed to the published version of the manuscript.

Funding

This work was financially supported by the Project of Materials and Chemical Engineering First-class Undergraduate Talent Demonstration and Leading Base (2020rcsfjd28), the Natural Science Foundation of the Higher Education Institutions of Anhui Province (KJ2021A1132, KJ2019A0865), Key Discipline of Materials Science and Engineering, Chizhou University (czxyylxk03) and School-level key projects of Chizhou College (CZ2021ZRZ12).

Institutional Review Board Statement

The study was conducted in accordance with the Declaration of Helsinki, and approved by the Institutional Review Board of Zhejiang University (protocol code GBT 35823-2018 and 2 July 2021).

Informed Consent Statement

Not applicable.

Data Availability Statement

Due to ethical restrictions, the data presented in this study are available to researchers eligible under the Research Ethics Board rules on request from the corresponding author.

Conflicts of Interest

The authors declare no conflict of interest.

References

  1. Bibb, M.J.; Van Etten, R.A.; Wright, C.T.; Walberg, M.W.; Clayton, D.A. Sequence and gene organization of mouse mitochondrial DNA. Cell 1981, 26, 167–180. [Google Scholar] [CrossRef] [PubMed]
  2. Zhang, J.Y.; Zhang, L.P.; Yu, D.N.; Storey, K.B.; Zheng, R.Q. Complete mitochondrial genomes of Nanorana taihangnica and N. yunnanensis (Anura: Dicroglossidae) with novel gene arrangements and phylogenetic relationship of Dicroglossidae. BMC Evol. Biol. 2018, 18, 26. [Google Scholar]
  3. Jie, Y.; Li, H.D.; Zhou, K.Y. Evolution of the mitochondrial genome in snakes: Gene rearrangements and phylogenetic relationships. BMC Genom. 2008, 9, 569. [Google Scholar]
  4. Gong, L.; Shi, W.; Yang, M.; Li, D.H.; Kong, X.Y. Novel gene arrangement in the mitochondrial genome of Bothus myriaster (Pleuronectiformes: Bothidae): Evidence for the Dimer-Mitogenome and Non-random Loss model. Mitochondrial DNA Part A 2014, 27, 3089–3092. [Google Scholar] [CrossRef]
  5. Song, X.J.; Tang, W.Q. Complete mitochondrial DNA sequence of Brachysomophis crocodilinus (Anguilliformes: Ophichthidae). Mitochondrial DNA Part B 2017, 2, 187–188. [Google Scholar] [CrossRef] [Green Version]
  6. Jiang, Z.J.; Castoe, T.A.; Austin, C.C.; Burbrink, F.T.; Herron, M.D.; McGuire, J.A.; Parkinson, C.L.; Pollock, D.D. Comparative mitochondrial genomics of snakes: Extraordinary substitution rate dynamics and functionality of the duplicate control region. BMC Evol. Biol. 2007, 7, 123. [Google Scholar] [CrossRef] [Green Version]
  7. Mehta, R.S. Ecomorphology of the moray bite: Relationship between dietary extremes and morphological diversity. Physiol. Biochem. Zool. 2009, 82, 90–103. [Google Scholar] [CrossRef] [Green Version]
  8. Inoue, J.G.; Miya, M.; Miller, M.J.; Sado, T.; Hanel, R.; Hatooka, K.; Aoyama, J.; Minegishi, Y.; Nishida, M.; Tsukamoto, K. Deep-ocean origin of the freshwater eels. Biol. Lett. 2010, 6, 363–366. [Google Scholar] [CrossRef]
  9. Tang, K.L.; Fielitz, C. Phylogeny of moray eels (Anguilliformes: Muraenidae), with a revised classification of true eels (Teleostei: Elopomorpha: Anguilliformes). Mitochondrial DNA 2013, 24, 55–66. [Google Scholar] [CrossRef]
  10. Lu, Z.M.; Zhu, K.H.; Jiang, H.; Lu, X.T.; Liu, B.J.; Ye, Y.Y.; Jiang, L.H.; Liu, L.Q.; Gong, L. Complete mitochondrial genome of Ophichthus brevicaudatus reveals novel gene order and phylogenetic relationships of Anguilliformes. Int. J. Biol. Macromol. 2019, 135, 609–618. [Google Scholar] [CrossRef]
  11. Poulton, J.; Deadman, M.E.; Bindoff, L.; Morten, K.; Land, J.; Brown, G. Families of mtDNA re-arrangements can be detected in patients with mtDNA deletions: Duplications may be a transient intermediate form. Hum. Mol. Genet. 1993, 2, 23–30. [Google Scholar] [CrossRef]
  12. Ladoukakis, E.D.; Zouros, E. Recombination in animal mitochondrial DNA: Evidence from published sequences. Mol. Biol. Evol. 2001, 18, 2127–2131. [Google Scholar] [CrossRef] [Green Version]
  13. Christoph, B.; Svenja, S.; Ralph, T. Full mitochondrial genome sequences of two endemic Philippine hornbill species (Aves: Bucerotidae) provide evidence for pervasive mitochondrial DNA recombination. BMC Genom. 2011, 12, 35. [Google Scholar]
  14. Arndt, A.; Smith, M.J. Mitochondrial gene rearrangement in the sea cucumber genus Cucumaria. Mol. Biol. Evol. 2018, 8, 1009. [Google Scholar] [CrossRef] [PubMed] [Green Version]
  15. Moritz, C.; Brown, T. Evolution of animal mitochondrial DNA: Relevance for population biology and systematics. Annu. Rev. Ecol. Syst. 1987, 18, 269–292. [Google Scholar] [CrossRef]
  16. Schirtzinger, E.E.; Tavares, E.S.; Gonzales, L.A.; Eberhard, J.R.; Miyaki, C.Y.; Sanchez, J.J.; Hernandez, A.; Mueller, H.; Graves, G.R.; Fleischer, R.C.; et al. Multiple independent origins of mitochondrial control region duplications in the order Psittaciformes. Mol. Phylogenet. Evol. 2012, 64, 342–356. [Google Scholar] [CrossRef] [PubMed] [Green Version]
  17. Mauro, D.S.; Gower, D.J.; Wilkinson, Z.M. A hotspot of gene order rearrangement by tandem duplication and random loss in the vertebrate mitochondrial genome. Mol. Biol. Evol. 2006, 23, 227–234. [Google Scholar] [CrossRef]
  18. Lavrov, D.V.; Boore, J.L.; Brown, W.M. Complete mtDNA sequences of two millipedes suggest a new model for mitochondrial gene rearrangements: Duplication and nonrandom loss. Mol. Biol. Evol. 2002, 19, 163–169. [Google Scholar] [CrossRef] [PubMed] [Green Version]
  19. Shi, G.H.; Cui, Z.X.; Hui, M.; Liu, Y.; Chan, T.Y.; Song, C.W. The complete mitochondrial genomes of Umalia orientalis and Lyreidus brevifrons: The phylogenetic position of the family Raninidae within Brachyuran crabs. Mar. Genom. 2015, 21, 53–61. [Google Scholar] [CrossRef]
  20. Mehta, R.S.; Wainwright, P.C. Raptorial jaws in the throat help moray eels swallow large prey. Nature 2007, 449, 79–82. [Google Scholar] [CrossRef]
  21. Zhang, K.; Zhu, K.H.; Liu, Y.F.; Zhang, H.; Gong, L.; Jiang, L.H.; Liu, L.Q.; Lu, Z.M.; Liu, B.J. Novel gene rearrangement in the mitochondrial genome of Muraenesox cinereus and the phylogenetic relationship of Anguilliformes. Sci. Rep. 2021, 11, 2411. [Google Scholar] [CrossRef] [PubMed]
  22. Jourda, C.; Santini, S.; Rocher, C.; Le, B.A.; Claverie, J. Mitochondrial genome sequence of the glass sponge Oopsacas minuta. Genome Announcements. 2011, 3, e00823-15. [Google Scholar] [CrossRef] [PubMed] [Green Version]
  23. Liu, Y.; Wu, P.D.; Zhang, D.Z.; Zhang, H.B.; Tang, B.P.; Liu, Q.N.; Dai, L.S. Mitochondrial genome of the yellow catfish Pelteobagrus fulvidraco and insights into Bagridae phylogenetics. Genomics 2018, 111, 1258–1265. [Google Scholar] [CrossRef] [PubMed]
  24. Bernt, M.; Merkle, D.; Ramsch, K.; Fritzsch, G.; Perseke, M.; Bernhard, D.; Schlegel, M.; Stadler, P.F.; Middendorf, M. CREx: Inferring genomic rearrangements based on common intervals. Bioinformatics 2007, 23, 2957–2958. [Google Scholar] [CrossRef] [PubMed] [Green Version]
  25. Koichiro, T.; Glen, S.; Sudhir, K. MEGA11: Molecular evolutionary genetics analysis Version 11. Mol. Biol. Evol. 2021, 38, 3022–3027. [Google Scholar]
  26. Perna, N.T.; Kocher, T.D. Patterns of nucleotide composition at fourfold degenerate sites of animal mitochondrial genomes. J. Mol. Evol. 1995, 41, 353–358. [Google Scholar] [CrossRef] [PubMed]
  27. Day, J.J. Fishes of the World, 4th Edition. Fish Fish. 2006, 7, 334. [Google Scholar] [CrossRef]
  28. Xia, X. DAMBE7: New and improved tools for data analysis in molecular biology and evolution. Mol. Biol. Evol. 2018, 6, 1550–1552. [Google Scholar] [CrossRef] [Green Version]
  29. Miya, M.; Takeshima, H.; Endo, H.; Ishiguro, N.B.; Inoue, J.G.; Mukai, T.; Satoh, T.P.; Yamaguchi, M.; Kawaguchi, A.; Mabuchi, K.; et al. Major patterns of higher teleostean phylogenies: A new perspective based on 100 complete mitochondrial DNA sequences. Mol. Phylogenet. Evol. 2003, 26, 121–138. [Google Scholar] [CrossRef]
  30. Larkin, M.; Blackshields, G.; Brown, N.P.; Chenna, R.; McGettigan, P.A.; McWilliam, H.; Valentin, F.; Wallace, I.M.; Wilm, A.; Lopez, R.; et al. Clustal W and Clustal X v. 2.0. Bioinformatics 2007, 23, 2947–2948. [Google Scholar] [CrossRef] [Green Version]
  31. Hall, T.A. BioEdit: A user-friendly biological sequence alignment program for Windows 95/98/NT. Nucleic Acids Symp. Ser. 1999, 41, 95–98. [Google Scholar]
  32. Gerard, T.; Jose, C. Improvement of phylogenies after removing divergent and ambiguously aligned blocks from protein sequence alignments. Syst. Biol. 2007, 56, 564–577. [Google Scholar]
  33. Xia, X. DAMBE6: New Tools for Microbial Genomics, Phylogenetics, and Molecular Evolution. J. Hered. 2017, 108, 431–437. [Google Scholar] [CrossRef] [PubMed] [Green Version]
  34. Campbell, M.A.; Lopez, J.A.; Satoh, T.P.; Chen, W.J.; Miya, M. Mitochondrial genomic investigation of flatfish monophyly. Gene 2014, 551, 176–182. [Google Scholar] [CrossRef]
  35. Gascuel, O. New algorithms and methods to estimate maximum-likelihood phylogenies: Assessing the performance of PhyML 3.0. Syst. Biol. 2010, 59, 307–321. [Google Scholar]
  36. Huelsenbeck, J.P. MrBayes 3.2: Efficient bayesian phylogenetic inference and model choice across a large model space. Syst. Biol. 2012, 61, 539–542. [Google Scholar]
  37. Posada, D.; Crandall, K.A. MODELTEST: Testing the model of DNA substitution. Bioinformatics 1998, 14, 817–818. [Google Scholar] [CrossRef] [Green Version]
  38. Sitnikova, T.; Rzhetsky, A.; Nei, M. Interior-branch and bootstrap tests of phylogenetic trees. Mol. Biol. Evol. 1995, 2, 319–333. [Google Scholar] [CrossRef] [Green Version]
  39. Puts, D.A. Beauty and the beast: Mechanisms of sexual selection in humans. Evol. Hum. Behav. 2010, 31, 157–175. [Google Scholar] [CrossRef]
  40. Drummond, A.J. Bayesian Phylogenetics with BEAUti and the BEAST 1.7. Mol. Biol. Evol. 2012, 29, 1969–1973. [Google Scholar] [CrossRef] [Green Version]
  41. Minegishi, Y.; Aoyama, J.; Inoue, J.G.; Miya, M.; Nishida, M.; Tsukamoto, K. Molecular phylogeny and evolution of the freshwater eels genus Anguilla based on the whole mitochondrial genome sequences. Mol. Phylogenet. Evol. 2005, 34, 134–146. [Google Scholar] [CrossRef] [PubMed]
  42. Inoue, J.G.; Miya, M.; Tsukamoto, K.; Nishida, M. Mitogenomic evidence for the monophyly of elopomorph fishes (Teleostei) and the evolutionary origin of the leptocephalus larva. Mol. Phylogenet. Evol. 2004, 32, 274–286. [Google Scholar] [CrossRef] [PubMed]
  43. Inoue, J.G.; Miya, M.; Tsukamoto, K.; Nishida, M. Evolution of the deep-sea gulper eel mitochondrial genomes: Large-scale gene rearrangements originated within the eels. Mol. Biol. Evol. 2003, 20, 1917–1924. [Google Scholar] [CrossRef] [PubMed] [Green Version]
  44. Shi, W.; Dong, X.L.; Wang, Z.M.; Miao, X.G.; Wang, S.Y.; Kong, X.Y. Complete mitogenome sequences of four flatfishes (Pleuronectiformes) reveal a novel gene arrangement of L-strand coding genes. BMC Evol. Biol. 2013, 13, 173. [Google Scholar] [CrossRef] [PubMed] [Green Version]
  45. Gong, L.; Lu, Z.M.; Guo, B.Y.; Ye, Y.Y.; Liu, L.Q. Characterization of the complete mitochondrial genome of the tidewater goby, Eucyclogobius newberryi (Gobiiformes; Gobiidae; Gobionellinae) and its phylogenetic implications. Conserv. Genet. Resour. 2018, 10, 93–97. [Google Scholar] [CrossRef]
  46. Elmerot, C.; Arnason, U.; Gojobori, T.; Janke, A. The mitochondrial genome of the pufferfish, Fugu rubripes, and ordinal teleostean relationships. Gene 2002, 295, 163–172. [Google Scholar] [CrossRef]
  47. Ponce, M.; Infante, C.; Jimenez-Canfizano, R.M.; Perez, L.; Manchado, M. Complete mitochondrial genome of the blackspot seabream, Pagellus bogaraveo (Perciformes: Sparidae), with high levels of length heteroplasmy in the WANCY region. Gene 2008, 409, 44–52. [Google Scholar] [CrossRef]
  48. Lin, J.P.; Tsai, M.H.; Kroh, A.; Trautman, A.; Machado, D.J.; Chang, L.Y.; Reid, R.; Lin, K.T.; Bronstein, O.; Lee, S.J.; et al. The first complete mitochondrial genome of the sand dollar Sinaechinocyamus mai (Echinoidea: Clypeasteroida). Genomics 2020, 112, 1686–1693. [Google Scholar] [CrossRef]
  49. Xu, T.J.; Cheng, Y.Z.; Sun, Y.N.; Shi, G.; Wang, R.X. The complete mitochondrial genome of bighead croaker, Collichthys niveatus (Perciformes, Sciaenidae): Structure of control region and phylogenetic considerations. Mol. Biol. Rep. 2011, 38, 4673–4685. [Google Scholar] [CrossRef]
  50. Ojala, D.; Montoya, J.; Attardi, G. tRNA punctuation model of RNA processing in human mitochondria. Nature 1981, 290, 470–474. [Google Scholar] [CrossRef]
  51. Prabhu, V.R.; Singha, H.S.; Kumar, R.G.; Gopalakrishnan, A.; Nagarajan, M. Characterization of the complete mitochondrial genome of Barilius malabaricus and its phylogenetic implications. Genomics 2020, 112, 2154–2163. [Google Scholar] [CrossRef] [PubMed]
  52. Wang, X.Z.; Wang, J.; He, S.P.; Mayden, R.L. The complete mitochondrial genome of the Chinese hook snout carp Opsariichthys bidens (Actinopterygii: Cypriniformes) and an alternative pattern of mitogenomic evolution in vertebrate. Gene 2007, 399, 11–19. [Google Scholar] [CrossRef] [PubMed]
  53. Yan, L.P.; Pape, T.; Elgar, M.A.; Gao, Y.Y.; Zhang, D. Evolutionary history of stomach bot flies in the light of mitogenomics. Syst. Entomol. 2019, 44, 797–809. [Google Scholar] [CrossRef] [Green Version]
  54. Dutta, C.; Paul, S. Microbial lifestyle and genome signatures. Curr. Genom. 2012, 13, 153–162. [Google Scholar]
  55. Yan, L.P.; Xu, W.T.; Zhang, D.; Li, J.Q. Comparative analysis of the mitochondrial genomes of flesh flies and their evolutionary implication. Int. J. Biol. Macromol. 2021, 174, 385–391. [Google Scholar] [CrossRef]
  56. Gong, L.; Liu, B.J.; Lu, Z.M.; Liu, L.Q. Characterization of the complete mitochondrial genome of Wuhaniligobius polylepis (Gobiiformes: Gobiidae) and phylogenetic studies of Gobiiformes. Mitochondrial DNA Part B 2018, 3, 1117–1119. [Google Scholar] [CrossRef] [Green Version]
  57. Shi, W.; Miao, X.G.; Kong, X.Y. A novel model of double replications and random loss accounts for rearrangements in the Mitogenome of Samariscus latus (Teleostei: Pleuronectiformes). BMC Genom. 2014, 15, 352. [Google Scholar] [CrossRef] [Green Version]
  58. Eberhard, J.R.; Wright, T.F. Rearrangement and evolution of mitochondrial genomes in parrots. Mol. Phylogenet. Evol. 2015, 94, 34–46. [Google Scholar] [CrossRef] [Green Version]
  59. Shi, W.; Gong, L.; Wang, S.Y.; Miao, X.G.; Kong, X.Y. Tandem duplication and random loss for mitogenome rearrangement in Symphurus (Teleost: Pleuronectiformes). BMC Genom. 2015, 16, 355. [Google Scholar] [CrossRef] [Green Version]
  60. Gong, L.; Jiang, H.; Zhu, K.H.; Lu, X.T.; Liu, L.Q.; Liu, B.J.; Jiang, L.H.; Ye, Y.Y.; Lu, Z.M. Large-scale mitochondrial gene rearrangements in the hermit crab Pagurus nigrofascia and phylogenetic analysis of the Anomura. Gene 2019, 695, 75–83. [Google Scholar] [CrossRef]
  61. Chen, J.N.; Lopez, J.A.; Lavoue, S.; Miya, M.; Chen, W.J. Phylogeny of the Elopomorpha (Teleostei): Evidence from six nuclear and mitochondrial markers. Mol. Phylogenet. Evol. 2014, 70, 152–161. [Google Scholar] [CrossRef] [PubMed]
  62. Forey, P.L.; Littlewood, D.T.; Ritchie, P.; Meyer, A. Interrelationships of Elopomorph Fishes. Interrelationships of Fishes. 1996, 175–191. [Google Scholar]
  63. Inoue, J.G.; Miya, M.; Tsukamoto, K.; Nishida, M. Complete mitochondrial DNA sequence of Conger myriaster (Teleostei: Anguilliformes): Novel gene order for vertebrate mitochondrial genomes and the phylogenetic implications for anguilliform families. J. Mol. Evol. 2001, 52, 311. [Google Scholar] [CrossRef] [PubMed]
Figure 1. Gene map of the Ariosoma meeki mitogenome.
Biology 12 00348 g001
Figure 2. Amino acid composition in the mitogenome of A. meeki (A) and A. shiroanago (B) (The x- and y-axis refer to the amino acid composition and the number of each amino acid in 13 PCGs, respectively). Relative synonymous codon usage (RSCU) in the mitogenome of A. meeki (C) and A. shiroanago (D). (The y-axis represents the usage frequency of the corresponding amino acid codons in 13 PCGs. Different colors represent the different codons in the amino acids).
Biology 12 00348 g002
Figure 3. The cloverleaf structure of 22 tRNAs in the mitochondrial genome of A. meeki.
Biology 12 00348 g003
Figure 4. The cloverleaf structure of 22 tRNAs in the mitochondrial genome of A. shiroanago.
Biology 12 00348 g004
Figure 5. Compositional features of the control region of the A. meeki mitochondrial genome. The palindromic motif sequences “TACAT” and “ATGTA” are marked in blue and red, respectively.
Biology 12 00348 g005
Figure 6. Nucleotide substitution saturation plots for all 13 PCGs. (A) First codon positions; (B) second codon positions; (C) third codon positions. Plots in blue and green indicate the transition and transversion, respectively.
Biology 12 00348 g006
Figure 7. Analysis of the A. meeki mitochondrial gene rearrangement. (A) Structure of the mitochondrial genome and gene rearrangement of A. meeki; (B) replication and random deletion during gene rearrangement; (C) structural comparison of the gene rearrangement and non-gene rearrangement.
Biology 12 00348 g007
Figure 8. Phylogenetic tree of the Anguilliformes inferred from the nucleotide sequences of 12 PCGs (except for ND6) using the Bayesian inference (BI) and maximum likelihood (ML) methods. The numbers on the branches indicate posterior probability (BI) and bootstrap (ML).
Biology 12 00348 g008
Table 1. List of the 31 Anguilliformes species and 2 outgroups used in this paper.
SpeciesFamilySize (bp)Accession No.References
Leptocephalus sp. Nettastomatidae18,037 bpNC_013615[8]
Nettastoma parvicepsNettastomatidae17,714 bpNC_013625[8]
Facciolella oxyrhynchaNettastomatidae17,789 bpNC_013621[8]
Hoplunnis punctataNettastomatidae17,828 bpNC_013623[8]
Paraconger notialisCongridae17,729 bpNC_013630[8]
Heteroconger hassiCongridae17,768 bpNC_013629[8]
Conger japonicuCongridae17,778 bpKR131863[8]
Ariosoma shiroanagoCongridae16,922 bpNC_013632[8]
Ariosoma meekiCongridae17,659 bpOK585090This Study
Cynoponticus feroxMuraenesocidae17,822 bpNC_013617[8]
Muraenesox bagioMuraenesocidae18,247 bpNC_013614[8]
Kaupichthys hyoproroidesChlopsidae16,662 bpNC_013607[8]
Robinsia catherinaeChlopsidae16,627 bpNC_013633[8]
Nessorhamphus ingolfianusDerichthyidae17,782 bpNC_013608[8]
Coloconger cadenatiColocongridae17,755 bpNC_013606[8]
Moringua microchir *Moringuidae15,858 bpNC_013602[8]
Moringua edwardsiMoringuidae16,841 bpNC_013622[8]
Ophichthus rotundusOphichthidae17,785 bpKY081397[5]
Pythonichthys microphthalmusHeterenchelyidae17,042 bpNC_013601[8]
Serrivomer sectorSerrivomeridae16,099 bpNC_013436[8]
Stemonidium hypomelasSerrivomeridae16,566 bpNC_013628[8]
Anguilla marmorataAnguillidae16,714 bpNC_006540[41]
Anguilla interiorisAnguillidae16,713 bpNC_006539[41]
Anguilla dieffenbachiiAnguillidae16,687 bpNC_006538[41]
Simenchelys parasiticaSynaphobranchidae16,689 bpNC_013605[4]
Synaphobranchus kaupiiSynaphobranchidae16,166 bpNC_005805[42]
Ilyophis brunneusSynaphobranchidae16,682 bpNC_013634[4]
Myroconger compressusMyrocongridae16,642 bpNC_013631[4]
Scuticaria tigrinaMuraenidae16,521 bpKP874183[6]
Gymnothorax minorMuraenidae16,575 bpMK204283[42]
Rhinomuraena quaesitaMuraenidae16,566 bpNC_013610[6]
Eurypharynx pelecanoidesEurypharyngidae18,978 bpAB046473[43]
Saccopharynx lavenbergiSaccopharyngidae18,495 bpAB047825[43]
Note: * the length excludes the control region.
Table 2. Features of the mitochondrial genomes of A. meeki and A. shiroanago.
MitogenomePosition
from/to
Length
(bp)
Amino
Acid
Start/Stop
Codon
AnticodonIntergenic Region from to (bp) *Strand #
A. meeki
tRNA-Phe (F)17171 GAA0H
12S RNA721024953 0H
tRNA-Val (V)1025109571 TAC0H
16S RNA109627941699 0H
tRNA-LeuUUA (L1)2795287076 TAA0H
ND128713839969323ATG/TAG 0H
tRNA-Ile (I)3839390668 GAT−1H
tRNA-Gln (Q)3908397871 TTG1L
tRNA-Met (M)3978404669 CAT−1H
ND2404750931047349ATG/TAG 0H
tRNA-Trp (W)5092516372 TCA−2H
tRNA-Ala (A)5165523369 TGC1L
tRNA-Asn (N)5235530773 GTT1L
tRNA-Cys (C)5347541064 GCA39L
tRNA-Tyr (Y)5411548171 GTA0L
COX1548370901608536GTG/AGA 1H
tRNA-SerUCA (S1)7086715671 TGA−5L
tRNA-Asp (D)7162723170 GTC5L
COX272377927691230ATG/T 5H
tRNA-Lys (K)7928800275 TTT0H
ATP88004817116856ATG/TAA 1H
ATP681628845684228ATG/TAA −10H
COX388459630786262ATG/TAA −1H
tRNA-Gly (G)9630970172 TCC−1H
ND3970210,052351117ATG/TAG 0H
tRNA-Arg (R)10,05110,12070 TCG0H
ND4L10,12110,41729799ATG/TAA 0H
ND410,41111,7911381460ATG/T −7H
tRNA-His (H)11,79211,86271 GTG0H
tRNA-SerAGC (S2)11,86311,93371 GCT0H
tRNA-LeuCUA (L2)11,93412,00774 TAG0H
ND512,00813,8461839613ATG/TAG 0H
Cyt b13,89615,0351140380ATG/TAA 49H
tRNA-Thr(T)15,03715,10771 TGT1H
D-loop 115,10816,076969 0H
ND616,07716,592516172ATG/TAG 0L
tRNA-Glu (E)16,59316,66169 TTC0L
tRNA-Pro (P)16,66516,73571 TGG3L
D-loop 216,73617,695960 0H
A. shiroanago
tRNA-Phe (F)17070 GAA0H
12S RNA711032962 0H
tRNA-Val (V)1033110371 TAC0H
16S RNA110428281725 0H
tRNA-LeuUUA (L1)2823289977 TAA−6H
ND129003862963321ATG/TAG 0H
tRNA-Ile (I)3862392968 GAT−1H
tRNA-Gln (Q)3931400171 TTG1L
tRNA-Met (M)4001404646 CAT−1H
ND2407051161047349ATG/TAG 23H
tRNA-Trp (W)5115518773 TCA−2H
tRNA-Ala (A)5189525769 TGC1L
tRNA-Asn (N)5259533173 GTT1L
tRNA-Cys (C)5365543066 GCA33L
tRNA-Tyr (Y)5431550171 GTA0L
COX1550371101608536GTG/AGG 1H
tRNA-SerUCA (S1)7106717671 TGA−5L
tRNA-Asp (D)7182725372 GTC5H
COX272587948691230ATG/T 4H
tRNA-Lys (K)7949802375 TTT0H
ATP88025819216856ATG/TAA 1H
ATP681838866684228ATG/TAA −10H
COX388669651786262ATG/TAA −1H
tRNA-Gly (G)9651972272 TCC−1H
ND3972310,073351117ATG/TAG 0H
tRNA-Arg (R)10,07210,14170 TCG−2H
ND4L10,14210,43829799ATG/TAA 0H
ND410,43211,8111380460ATG/TAA −7H
tRNA-His (H)11,81311,88169 GTG1H
tRNA-SerAGC (S2)11,88211,95271 GCT0H
tRNA-LeuCUA (L2)11,95312,02674 TAG0H
ND512,02713,8771851617ATG/TAA 0H
Cyt b13,91915,0581140380ATG/TAA 41H
tRNA-Thr (T)15,06115,13272 TGT2H
ND615,28715,802516172ATG/TAG 154L
tRNA-Glu (E)15,80315,87169 TTC0L
tRNA-Pro (P)15,88615,95570 TGG14L
D-loop15,95616,922967 0H
* Intergenic region: non-coding bases between the feature on the same line and the line below, with a negative number indicating an overlap. # H: heavy strand; L: light strand.
Table 3. Composition and skewness of the A. meeki and A. shiroanago mitogenomes.
TCAGA + T%AT-SkewGC-SkewLength (bp)
A. meeki
Mitogenome26.1425.3928.9319.5455.070.05−0.1317,695
ND128.4828.9020.9521.6749.43−0.15−0.14969
ND228.2725.2126.2720.2554.54−0.04−0.111047
COX129.4224.1327.4219.0356.84−0.04−0.121608
COX227.4923.6030.3918.5257.880.05−0.12691
ATP826.7925.0034.5213.6961.310.13−0.29168
ATP628.8028.5128.6514.0457.450.00−0.34684
COX328.5027.3624.0420.1052.54−0.09−0.15786
ND329.3429.3522.2219.0951.56−0.14−0.21351
ND428.2425.1327.7318.9055.97−0.01−0.141381
ND4L26.9430.3026.6016.1653.54−0.01−0.30297
ND526.9728.1125.7219.1252.69−0.02−0.191839
Cytb29.4727.8123.9518.7753.42−0.10−0.191140
ND633.3320.9314.5331.2147.86−0.390.20516
tRNA27.1220.4529.0323.4056.150.030.071560
rRNA20.0622.2533.7823.9153.840.260.042652
D-loop25.8222.2936.1815.7162.000.17−0.171929
A. shiroanago
Mitogenome26.8523.9032.5416.7159.380.10−0.1816,922
ND129.0824.9228.8717.1357.940.00−0.19963
ND226.4624.4533.7215.3860.170.12−0.231047
COX131.5922.2627.8018.3559.39−0.06−0.101608
COX228.5123.3031.2616.9359.770.05−0.16691
ATP826.7926.1938.698.3365.480.18−0.52168
ATP630.5626.3229.9713.1660.53−0.01−0.33684
COX328.7524.9428.2418.0757.00−0.01−0.16786
ND331.9125.0727.9215.1059.83−0.07−0.25351
ND429.1325.9429.5715.3658.700.01−0.261380
ND4L32.3225.5927.6114.4859.93−0.08−0.28297
ND528.3125.0732.3614.2660.670.07−0.271851
Cytb30.4424.8229.6515.0960.09−0.01−0.241140
ND641.6714.7314.9228.6856.59−0.470.32516
tRNA28.1720.2329.7121.9057.870.030.041562
rRNA20.5422.2936.5520.6257.090.28−0.042687
D-loop26.3717.8940.4315.3166.800.21−0.08967
Disclaimer/Publisher’s Note: The statements, opinions and data contained in all publications are solely those of the individual author(s) and contributor(s) and not of MDPI and/or the editor(s). MDPI and/or the editor(s) disclaim responsibility for any injury to people or property resulting from any ideas, methods, instructions or products referred to in the content.

