Simple Summary
The autonomic nervous system (ANS) modulates the oscillation of electrocardiogram segments and their intervals so much that its balance could be investigated throughout the heart rate variability analysis. It is noteworthy that the ANS is able to modulate the myocardial repolarization phase too. Head-up/-down tilt test modifies acutely the ANS balance by means of a deactivation of the cardiopulmonary reflexes. The present study examines the influence of head-up/-down tilt on a number of ECG segments, assuming that the cardiopulmonary postural reflexes modulate most of the ECG interval oscillations in terms of their lengths and short-period temporal dispersion. The T wave amplitude diminished during head-up tilt and significantly correlated with the left ventricular end-systolic volume.
Abstract
The head-up/-down tilt test acutely modifies the autonomic nervous system balance throughout a deactivation of the cardiopulmonary reflexes. The present study examines the influence of head-up/-down tilt on a number of ECG segments. A total of 20 healthy subjects underwent a 5 min ECG and noninvasive hemodynamic bio-impedance recording, during free and controlled breathing, lying at (a) 0°; (b) −45°, tilting up at 45°, and tilting up at 90°. Heart rate variability power spectral analysis was obtained throughout some ECG intervals: P-P (P), P-Q (PQ), PeQ (from the end of P to Q wave), Q-R peak (QR intervals), Q-R-S (QRS), Q-T peak (QTp), Q-T end (QTe), STp, STe, T peak-T end (Te), and, eventually, the TeP segments (from the end of T to the next P waves). Results: In all study conditions, the Low Frequency/High FrequencyPP and LFPP normalized units (nu) were significantly lower than the LF/HFRR and LFRRnu, respectively. Conversely, the HFPP and HFPPnu were significantly higher in all study conditions. STe, QTp, and QTe were significantly related to the PP and RR intervals, whereas the T wave amplitude was inversely related to the standard deviations of all the myocardial repolarization variables and to the left ventricular end-systolic volume (LVEDV). The T wave amplitude diminished during head-up tilt and significantly correlated with the LVEDV.
1. Introduction
The autonomic nervous system (ANS) modulates the oscillations of the heart rate, intra-atrial, atrio-ventricular, and intra-ventricular conductions as well as myocardial repolarization. Although sinus node activity is not properly identifiable on a surface electrocardiogram (ECG) since it precedes the P wave, it is measured roughly in terms of R-R intervals [1,2]. It is noteworthy that each ECG segment (P-Q, P-R, S-T, and T-P), as well as ECG intervals (RR, PP, P wave, Q-R-S, Q-T), slightly oscillate due to the ANS control, which modulates sinus node activity, affecting the ECG’s spectral components and coherences. Accordingly, in a recent study [3] on healthy and chronic heart failure subjects, a significant relationship has been described between both P-Q and PP coherence at rest and between the left ventricular ejection fraction (LVEF) and atrial volume. Similarly, in an animal experimental model, an inverse relationship has been found between left stellate ganglion nerve activity and the temporal dispersion of the segments Pe-Q, i.e., from the end of P to the Q waves, whereas the same parameter was positively related to the vagal nerve activity [4]. Adding further support to the abovementioned close relationships, an increase in temporal dispersion of the P wave and P-Q segments during tilt test-induced asystole is clear [5]. Conversely, with respect to the link between the ANS and myocardial temporal dispersion, evidence in an animal experimental model has already been provided, specifically about the increase in Q-T/R-R coherence during high levels of left stellate ganglion activity [6] as well as about the direct relationship between the short-term variability of the T peak to T end interval (Te) and left stellate ganglion activity [7]. Furthermore, the close relationship between the circadian rhythm of the repolarization phase and the sympathovagal circadian cycle has been demonstrated [8]. Finally, passive orthostatism, as obtained by means of a tilt test, is equally able to elicit a sympathetic drive and to induce a myocardial temporal dispersion reduction, as well as high levels of sympathetic stress, as obtained by an exercise test, increasing the Q-T and Te standard deviation [9].
The aim of the present study, conducted in healthy subjects, was to accurately describe the physiological behavior of a number of ECG and noninvasive hemodynamic parameters in response to an ANS deactivation induced by different passive graded head-up/-down tests. Data acquired will be useful to program artificial intelligence and machine learning instruments in order to better stratify patients’ risk during stroke, myocardial infarction, acutely decompensated chronic heart failure, or atrial fibrillation.
2. Materials and Methods
2.1. Study Protocol
For the study purpose, only healthy volunteers were enrolled in the present analysis. All participants underwent a short-term (5 min) single-lead ECG and noninvasive hemodynamic recordings (PhysioFlow; Manatec Biomedical, Poissy, France) lying supine over the tilt-table during free breathing (rest) and during controlled breathing (15 breaths/minutes) lying with the following tilt angles: (a) lying supine at 0° (0° L-d); (b) lying down at −45° (−45° T), tilting up at 45° (45° T), and tilting up 90° (90° T). The order of the study phases was randomly chosen [10] and each one was always preceded and followed by a rest session of 5 min. Hemodynamic recordings have been double-checked by echocardiographic tests and twelve leads surface ECG. The PhysioFlow system provided a self-correction to minimize artifacts and noises.
Patients were randomly assigned to different study phases, as shown in Figure 1.
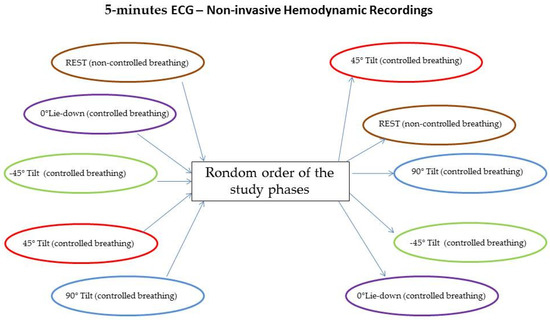
Figure 1.
Random assignment to different study phases.
ECG signals were acquired and digitalized with a custom-designed card (National Instruments, Austin, TX, USA) at a sampling frequency of 500 Hz. Measurements used for the ECG segments and interval analysis were detected automatically by a classic adaptive first derivative/threshold algorithm and a template method [5,11] (Figure 2).
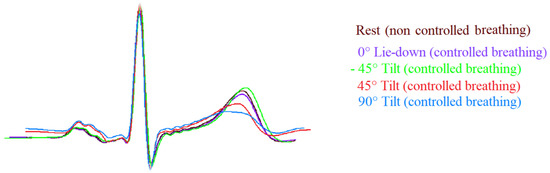
Figure 2.
Template of ECG signals (II lead) during the different study phases. Note the T wave amplitude was flatter during passive positive standing with 45° (45° T, red) and 90° (90° T, blue) tilt table angle and it was sharper during head-down (−45° T, green) and rest (brown) in comparison to lay-down (0° L-d, purple).
A specifically designed and produced system for data acquisition, storage, and analysis was developed with the LabView program (National Instruments, Austin, TX, USA). An expert cardiologist (GP) checked the different ECG intervals and segments, automatically marked by the software and, when needed, manually corrected the mistakes [3,4,5,11,12].
The mean and standard deviation (SD) values of the following ECG intervals and segments were calculated: R-R intervals (RR); P-P intervals (PP), from the beginning of two consecutive P waves; P wave intervals (P), from the start to the end of a single P wave; P-Q intervals (PQ), from the start of P to the Q waves; P-Q segments (PeQ), from the end of P to Q waves; Q-R intervals (QR), from Q to the peak of R waves; Q-R-S intervals (QRS), from Q to S waves; Q-T peak intervals (QTp), from Q to the peak of T waves; Q-T end (QTe), from Q to end of T waves; ST peak segments (STp), from S to the peak of T waves; ST end segments (STe), from S to the end of T waves; T peak T end intervals (Te), from peak to end of T waves; T end P interval (TeP), from the end of T to start of P waves (Figure 3).
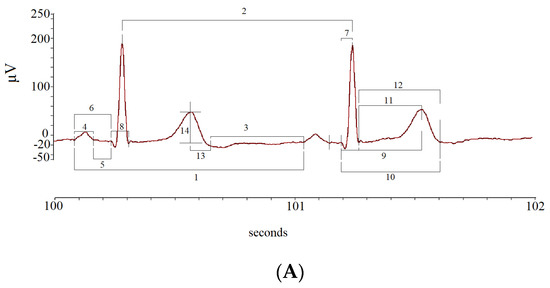
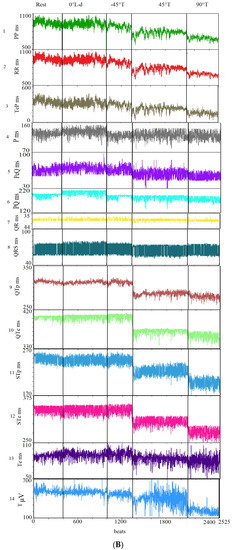
Figure 3.
Segments and intervals obtained during the different study phases (A): rest (lay-down), controlled breathing (lay-down), head-down −45° tilt angle (−45° T), head-up 45° tilt angle (45° T), and head-up 90° tilt angle (90° T) (B).
Power spectral analyses with an autoregressive algorithm for all study variables have been performed to obtain the main three spectral components from PP and RR variability [7,13,14,15,16] very low-frequency power (VLF), between 0 and 0.04 hertz equivalents (Hz); low-frequency power (LF), between 0.04 and 0.15 (Hz); and high-frequency power (HF). The ratios between LF and HF (LF/HF) and the total power (TP) were also calculated, the latter being the total area under the spectra (i.e., the variance of the examined variable). Eventually, the absolute power in the LF and HF normalized units (nu) [7,13,14,15,16] and the spectral coherence between different variables were obtained [6,11,17], the latter expressing the mutual influence between two variables (ranging from 0 to 1).
Bioimpedance cardiography was used to evaluate short-term non-invasive hemodynamic variations during different study phases. Specifically, we recorded the stroke volume (SV), cardiac output (CO), systemic peripheral resistances (SPR), left ventricular end-diastolic volume (LVEDV), left ventricular end-systolic volume (LVESV), and left ventricular ejection fraction (LVEF) [18,19,20,21,22,23,24].
2.2. Statistical Analysis
Data were reported as mean ± standard deviation or as median and interquartile range, respectively, for normal and skewed distribution data. We used the ANOVA for repeated measures to compare the studied variable (rest, 0° L-d, −45° T, 45° T, and 90° T) for the normally distributed variables and Friedmann and Wilcoxon’s tests for those non-normally distributed. Linear regression analysis was used to evaluate the influence between beat-to-beat PP or RR and all study variables (more than 40,000 points) and the influence of the amplitude of T on standard deviation repolarization of data. We also calculated the Pearson/Spearman correlation coefficients between noninvasive hemodynamic and ECG data, considering altogether the different study phases.
Statistical analysis was performed using SPSS-PC+ (SPSS-PC+ Inc., Chicago, IL, USA) packages. All tests were two-sided. A p value less than or equal to 0.05 was considered as statistically significant.
3. Results
A total of 20 healthy subjects (mean age: 35 ± 14 years, 75% male) concluded the protocol. Table 1 shows in detail data from PP power spectral analysis measured in each of the five study phases and possible differences with respect to the data from RR power spectral analysis (Table 1).

Table 1.
Power spectral analysis of P-P interval variability in different study phases.
In particular, the LF/HFPP and LFPPnu were significantly lower than LF/HFRR and LFRRnu, respectively, whereas the HFPP and HFPPnu were significantly higher than the same spectral components calculated on the RR (Table 1). All spectral components expressed in normalized power as well as the LF/HF ratio showed the most significant changes during the different study phases. It was noteworthy that all study phases, except for the “rest” one, were obtained during controlled breathing at 15 breaths per minute. This aspect explains why the central frequency at rest was significantly different from all other study phases. In all study conditions, the P-PP, PQ-PP, and TeP-PP coherences were significantly higher than the same coherences obtained with RR (numerical data not extensively reported), with the P-PP and PQ-PP coherences being significantly higher during the 90° T phase in comparison to the other study conditions.
Table 2 supplies a detailed list of all ECG intervals and segments data recorded during the five study phases. Obviously, the shortest RR and PP intervals were recorded during the 90° T phases, whereas the lowest were obtained at the −45° T phase.
Table 2.
ECG interval data in different study phases.
The P, PQ, and PeQ intervals were significantly shorter during the 90° T phase than in all other study conditions. Conversely, the QR and QRS intervals as well as PSD, PeQSD, PQSD, QRSD, and QRSSD did not change significantly among the different study conditions. The lowest T wave amplitude was observed during the 90° T phase, whereas the highest one has been found during the 0° L-d phase. The shortest values for QTp, QTe, STp, and STe were obtained during the 90° T phase, while most of the myocardial repolarization variables were longer at −45° than rest, 0° L-d, and 45° T. Interestingly Te remained substantially unchanged under all the study phases. During the 90° T phase, most of the myocardial temporal dispersion repolarization variables (i.e., the standard deviation for all QT and ST segments analyzed) were significantly higher than at rest. During the 90° T phase, the value of the TeP segment was the shortest.
Table 3 shows the results from the multiple linear regression analysis between the PP and RR intervals and all the other ECG data. Besides the expected impact of the heart rate changes, the strongest relationships have been found between all RR or PP intervals and STe (PP or RR, r: 0.62), QTp (PP, r: 0.64; RR, r: 0.65), QTe (PP, r: 0.74; RR, r: 0.75), and TeP (PP, r: 0.97; RR, r: 0.96), (Table 3) (Figure 4).
Table 3.
Multiple linear mixed regression analyses between beat-to-beat PP or RR intervals and other ECG Data.
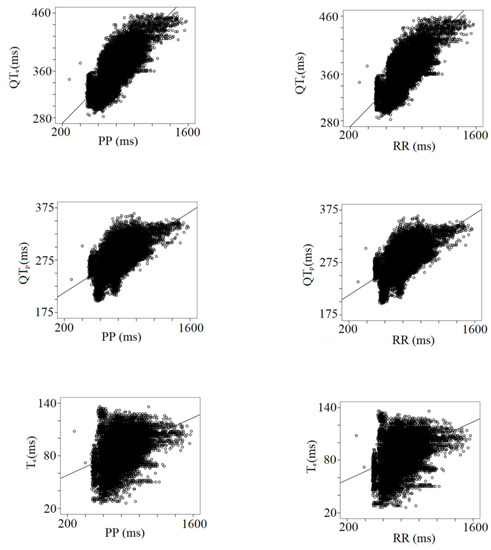
Figure 4.
Correlation between PP or RR intervals with repolarization data, QTe (from q to the end of T wave), QTP (from q to the peak of T wave), and Te (from the peak to the end of T wave).
The logarithm of the T wave amplitude was inversely related to the logarithm of standard deviations of all myocardial repolarization variables regardless of the study phase (logT wave amplitude-STpSD, r: 0.24, p < 0.001; logT wave amplitude-STeSD, r: 0.3, p < 0.001; logT wave amplitude-QTpSD, r: 0.37, p < 0.001; logT wave amplitude-QTeSD, r: 0.38, p < 0.001; logT wave amplitude-TeSD, r: 0.59, p < 0.001); (Figure 5).
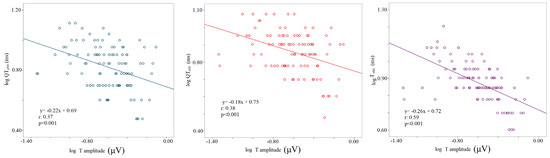
Figure 5.
Correlation between T wave amplitude and repolarization temporal dispersion data, the logarithm of voltage (mV), the logarithm of the standard deviation of QTp (QTpSD) (left panel), QTe (QTeSD) (middle panel), and Te (from the peak to the end of T wave) (right panel).
Regarding the noninvasive hemodynamic measurements, during the 90° T phase, the stroke volume significantly decreased compared to other study conditions (63 ± 22 mL versus rest: 84 ± 24 mL; 0° L-d: 82 ± 23 mL; −45° T: 81 ± 26 mL; 45° T: 73 ± 22 mL, p < 0.05 for all), with the cardiac output remaining almost unchanged (i.e., a physiological counterbalance between stroke volume and heart rate). Eventually, the left ventricular end-diastolic volume during the 90° T phase was significantly lower (114 ± 44 mL) than at rest (130 ± 35 mL, p < 0.05) and during 0° L-d (128 ± 34 mL, p < 0.05). A positive relationship was found between the left ventricular end-systolic volume and QR segments (r: −0.35, p < 0.001) and a negative one between the T wave amplitude and the left ventricular end-systolic volume considering all the study conditions together (r: −0.25, p < 0.05) (Figure 6).
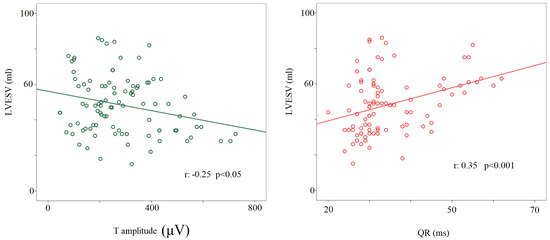
Figure 6.
Correlation between left ventricular end-systolic volume or T wave amplitude (μV) (left panel) and QR interval (from the q to the R-wave) (ms) (right panel).
4. Discussion
The present study aimed to describe in detail, in a physiological setting, the behavior of a large number of ECG parameters as well as of the main hemodynamic variables in response to a sympathovagal imbalance induced by different graded head-up/-down tests. Accordingly, the main findings might be summarized as follows: (a) PP or RR spectral components of variability do not completely overlap in their changes; (b) most of the short-period temporal dispersion variables are influenced by the sympathovagal imbalance induced by the head-up/down tilt maneuver; (c) heart rate changes do not impact identically on the different ECG variables; (d) passive standings induce a T wave amplitude flattening and an increase in the myocardial repolarization dispersion markers; and (e) the T wave amplitude is inversely related to the end-systolic volume obtained across all the different study phases.
4.1. PP and RR Variability and Coherences
Present data overlap with those obtained in previous studies dealing with HRV power spectral analysis during tilt. Specifically, during the maximal sympathetic drive (90° T phase), we demonstrated an increased LFPPnu, LFRRnu, LF/HFPP, and LF/HFRR with a concomitant reduction in HFPPnu, HFRRnu, as well as PP and RR intervals shortening. These data suggest a sympathetic prevalence. Indeed, the normalized LF and HF power are well-known markers of sympathetic and vagal modulation of the sinus node activity, respectively [15,16,17,18,19]. Thus, our findings support the passive standing as a maneuver able to induce a significant sympathetic stimulation and parasympathetic inhibition and, contextually, they confirm the PP and RR power spectral components as useful noninvasive ANS balance markers. The abovementioned phenomenon was observed both at 90° and 45° tilt angles. Being at 45° T somewhat mitigated than at 90° T. This behavior suggests a gradualness of sympathetic activation and vagal inhibition in response to the tilt-table angle [25]. Conversely, during the −45° T phase, we registered a significant increase in PP and RR intervals as well as in HFPPnu with a concomitant reduction in LF/HFPP and LF/HFRR, this behavior likely indicating a vagal sinus node activity increase [26]. Of note, albeit the PP and RR variability (i.e., standard deviation) were equal, their normalized power of the spectral components and the corresponding values of LF/HF and HF were different. Particularly, the HFPP was significantly higher than HFRR, and LF/HFPP and LFPPnu were significantly lower than the respective components obtained from RR spectral analysis.
4.2. P Wave and Atrioventricular Conduction Variability
We observed an intra-atrial conduction increase during the 90° T phase (i.e., maximal sympathetic stimulation) and an opposite behavior during the rest and 0° L-d phases. The same behavior was observed for the PQ and PeQ segments, which were shortened significantly during the 90° T phase. Particularly, the PeQ segment, closely depending on atrioventricular conduction system function (AV node, His bundle, bundle branch, Purkinje fibers), diminished by about 15–20% in comparison to the rest and 0° L-d phases. Thus, our data suggest that the maximum effect on PQ segments (PQ = P + PeQ) of the sympathetic stress is limited to the PeQ (i.e., the atrioventricular node and His-Purkinje system), with the result quite expected given the wide sympathetic innervation reported at this level [27]. Eventually, the P, PeQ, and PQ segments were weakly influenced by heart rate, the latter exerting its influence predominantly on the myocardial repolarization phase [28]. Indeed, the ANS activity does not impact the short period P, PeQ, and PQ temporal dispersion, as expressed in terms of standard deviation, in the healthy subject, whereas it is possible that it happens in some settings of high risk for atrial fibrillation or supraventricular brady/tachyarrhythmias [7,13,14,15,16,29]
4.3. Intrinsicoid Deflection, Intraventricular Conduction, and Repolarization Variability
According to the present findings, both QR and QRS intervals, also called “R-peak time” or “intrinsicoid deflection” and “intraventricular conduction”, and their variability (in terms of standard deviation) seem not to be modulated by the ANS activity due to the fact that they remained almost unchanged during all the five study phases. Notwithstanding, the intrinsicoid deflection obtained by unipolar leads (V5–V6) has been suggested as a possible non-invasive electrical marker of sudden cardiac death [30,31]. In the actual study, we calculated the R-peak time just on the II lead and in a healthy setting and analyzed this variable only in terms of its possible oscillatory behavior within the P-QRS-T complex. Of note, the R-peak time was found to relate to the left ventricular end-systolic volume, suggesting that this parameter might be influenced by the myocardial structure rather than by the ANS itself [30].
Conversely, the myocardial repolarization length and its variability are known to be strongly influenced by both the ANS [6,7,8,9,11] and the heart rate [32]. Accordingly, the heart rate correction is widely accepted for the QT segment corrections, albeit it still remains controversial for Te, which seems less influenced by the RR segment [33,34]. Particularly, the shortest QTp, QTe, STp, and STe were observed during the 90° T phase (i.e., maximal postural sympathetic stimulation) while they increased maximally during the −45° T phase (i.e., maximal postural vagal stimulation). It is noteworthy that just the Te remained unchanged in all study conditions, reinforcing the leading idea about its poor dependency on the ANS balance. On the other hand, the myocardial temporal dispersion, expressed in terms of standard deviation values, was always significantly higher during sympathetic drive with the highest QTpSD, QTeSD, STpSD, STeSD, and TeSD observed during the 90° T phase. Moreover, the TeSD was also influenced by the vagal stimulus, being significantly increased during the −45° T phase. Notably, the same behavior was observed for the QTeSD and STeSD but, given that QTpSD and JTpSD were not different, this finding seemed to be driven by the TeSD. Eventually, the TePSD, which is the square root of the variance (or Total Power) of this variable, was equal to PPSD and RRSD, suggesting a de facto overlap between the RR or PP variability and the TeP variability. Accordingly, the coherence between RR or PP and TeP was optimal in all study conditions.
4.4. T Wave Amplitude
Recent studies reported that T wave amplitude might influence the measures of repolarization variability [11,35]. Specifically, the variability was found to be inversely related to the T wave amplitude and, in order to clarify this controversial issue [36], we also investigated and confirmed an inverse relationship between T wave amplitude and QTpSD, QTeSD, and TeSD. Furthermore, we found that the T wave template was flatter during the 45° T and 90° T phases with a T wave amplitude lower with respect to the other study phases. In such a context, we want to emphasize that T amplitude and end-systolic volume were inversely related, thus allowing us to speculate that this behavior might depend on a redistribution of the myocardial blood flow during the systole.
4.5. Clinical Applications
The clinical application of these findings may be particularly interesting in the field of acute and chronic heart failure. Indeed, we know that during acutely decompensated chronic heart failure an important portion of the ANS is unbalanced with a hyper arousal of the sympathetic nervous system. The modulation of ANS activity and the influence that the patient’s position seems to have during recumbent or passive orthostatism on the ventricular filling pressures could guide the clinician in the diagnostic and therapeutic choices. Moreover, the use of these data in artificial intelligence and machine learning instruments will enhance the diagnostic power of ECG analysis, improving patients’ prognosis (sudden cardiac death, acutely decompensated chronic heart failure, etc.).
5. Conclusions
The present physiological study allows a better understanding of the close relationship between the surface ECG and the autonomic nervous system modulation. Indeed, adopting the short-term PP and RR variability power spectral analysis, it describes the ANS activity oscillations induced by postural deactivation of the cardiopulmonary reflexes during different passive graded head-up/-down tilt tests. Contextually, it supplied a detailed picture of the ECG intervals and hemodynamic parameter changes as well as their relationships in response to the abovementioned ANS oscillations.
6. Limitations
This study aims to evaluate the interactions between the autonomic nervous system, ventricular filling pressures, and electrocardiographic variations from a physiological point of view. This aspect obviously makes the clinical applicability limited. However, the study lays the foundations for a more in-depth understanding of the mechanisms that regulate the activity of the ANS, thus guaranteeing the possibility of future studies in pathological conditions (heart failure, acute myocardial infarction, acute pulmonary edema, etc.) to try new diagnostic and therapeutic approaches.
The small sample size requires future and larger studies in order to validate the data obtained.
Author Contributions
Conceptualization, G.P., F.M., P.R. and D.M.; methodology, G.P., F.M., S.S. (Sara Stefano), P.R. and D.M.; software, G.P. and P.R.; validation, G.P., F.M., S.S. (Susanna Sciomer), P.R. and D.M.; formal analysis, G.P., F.M. and I.L.; investigation, I.L., M.M., C.C., I.D.D., M.C., A.C., S.S. (Sara Stefano), C.S., M.G., E.F. and V.D.S.; resources, G.P., F.M., P.R. and D.M.; data curation, G.P. and F.M.; writing—original draft preparation, G.P., F.M. and D.M.; writing—review and editing, F.M. and D.M.; visualization, S.S. (Susanna Sciomer) and P.R.; supervision, G.P. and F.M.; project administration, G.P., F.M., S.S. (Susanna Sciomer), P.R., E.F. and D.M.; funding acquisition, n/a. All authors have read and agreed to the published version of the manuscript.
Funding
This research received no external funding.
Institutional Review Board Statement
The study was approved by the Ethical Committee of Azienda Ospedaliera Universitaria Policlinico Umberto I (protocol number 940/17). The research was carried out with the respect of Helsinki Declaration Principles.
Informed Consent Statement
All subjects gave written informed consent to participate in the study.
Data Availability Statement
The data underlying this article will be shared upon reasonable request to the corresponding author.
Conflicts of Interest
The authors declare no personal/industrial conflicts of interest concerning this paper.
References
- Plappert, F.; Wallman, M.; Abdollahpur, M.; Platonov, P.G.; Östenson, S.; Sandberg, F. An atrioventricular node model incorporating autonomic tone. Front. Physiol. 2022, 13, 976468. [Google Scholar] [CrossRef] [PubMed]
- Koskela, J.K.; Tahvanainen, A.; Tikkakoski, A.J.; Kangas, P.; Uitto, M.; Viik, J.; Kähönen, M.; Mustonen, J.; Pörsti, I. Resting heart rate predicts cardiac autonomic modulation during passive head-up tilt in subjects without cardiovascular diseases. Scand. Cardiovasc. J. 2022, 56, 138–147. [Google Scholar] [CrossRef] [PubMed]
- Piccirillo, G.; Moscucci, F.; Fiorucci, C.; D’Alessandro, G.; Pascucci, M.; Magrì, D. P wave analysis and left ventricular systolic function in chronic heart failure. Possible insights form the P wave—PP interval spectral coherence. Minerva Cardioangiol. 2016, 64, 525–533. [Google Scholar] [PubMed]
- Piccirillo, G.; Magrì, D.; D’Alessandro, G.; Fiorucci, C.; Moscucci, F.; Di Iorio, C.; Mastropietri, F.; Parrotta, I.; Ogawa, M.; Lin, S.F.; et al. Oscillatory behavior of P wave duration and PR interval in experimental congestive heart failure: A preliminary study. Physiol. Meas. 2018, 39, 035010. [Google Scholar] [CrossRef] [PubMed]
- Piccirillo, G.; Moscucci, F.; Fiorucci, C.; Di Iorio, C.; Mastropietri, F.; Magrì, D. Time- and frequency-domain analysis of beat to beat P-wave duration, PR interval and RR interval can predict asystole as form of syncope during head-up tilt. Physiol. Meas. 2016, 37, 1910–1924. [Google Scholar] [CrossRef]
- Piccirillo, G.; Magrì, D.; Ogawa, M.; Song, J.; Chong, V.J.; Han, S.; Joung, B.; Choi, E.-K.; Hwang, S.; Chen, L.-S.; et al. Autonomic nervous system activity measured directly and QT interval variability in normal and pacing-induced tachycardia heart failure dogs. J. Am. Coll. Cardiol. 2009, 54, 840–850. [Google Scholar] [CrossRef]
- Piccirillo, G.; Magrì, D.; Pappadà, M.A.; Maruotti, A.; Ogawa, M.; Han, S.; Joung, B.; Rossi, P.; Nguyen, B.L.; Lin, S.-F.; et al. Autonomic nerve activity and the short-term variability of the Tpeak-Tend interval in dogs with pacing-induced heart failure. Heart Rhythm 2012, 9, 2044–2050. [Google Scholar] [CrossRef]
- Piccirillo, G.; Moscucci, F.; D’Alessandro, G.; Pascucci, M.; Rossi, P.; Han, S.; Chen, L.S.; Lin, S.-F.; Chen, P.-S.; Magrì, D. Myocardial repolarization dispersion and autonomic nerve activity in a canine experimental acute myocardial infarction model. Heart Rhythm 2014, 11, 110–118. [Google Scholar] [CrossRef]
- Piccirillo, G.; Moscucci, F.; Di Iorio, C.; Fabietti, M.; Mastropietri, F.; Crapanzano, D.; Bertani, G.; Sabatino, T.; Zaccagnini, G.; Crapanzano, D.; et al. Time- and frequency-domain analysis of repolarization phase during recovery from exercise in healthy subjects. Pacing Clin. Electrophysiol. 2020, 43, 1096–1103. [Google Scholar] [CrossRef]
- Porta, A.; Tobaldini, E.; Gnecchi-Ruscone, T.; Montano, N. RT variability unrelated to heart period and respiration progressively increases during graded head-up tilt. Am. J. Physiology. Heart Circ. Physiol. 2010, 298, H1406–H1414. [Google Scholar] [CrossRef]
- Baumert, M.; Porta, A.; Vos, M.A.; Malik, M.; Couderc, J.P.; Laguna, P.; Piccirillo, G.; Smith, G.L.; Tereshchenko, L.G.; Volders, P.G. QT interval variability in body surface ECG: Measurement, physiological basis, and clinical value: Position statement and consensus guidance endorsed by the European Heart Rhythm Association jointly with the ESC Working Group on Cardiac Cellular Electrophysiology. EP Eur. 2016, 18, 925–944. [Google Scholar]
- Piccirillo, G.; Moscucci, F.; Magrì, D. Air Pollution Role as Risk Factor of Cardioinhibitory Carotid Hypersensitivity. Atmosphere 2022, 13, 123. [Google Scholar] [CrossRef]
- Anonymous. Heart rate variability: Standards of measurement, physiological interpretation, and clinical use. Task Force of the European Society of Cardiology and the North American Society of Pacing and Electrophysiology. Eur. Heart J. 1996, 17, 354–381. [Google Scholar] [CrossRef]
- Piccirillo, G.; Moscucci, F.; Pascucci, M.; Pappadà, M.A.; D’Alessandro, G.; Rossi, P.; Quaglione, R.; Di Barba, D.; Barillà, F.; Magrì, D.; et al. Influence of aging and chronic heart failure on temporal dispersion of myocardial repolarization. Clin. Interv. Aging 2013, 8, 293–300. [Google Scholar] [CrossRef]
- Piccirillo, G.; Ogawa, M.; Song, J.; Chong, V.J.; Joung, B.; Han, S.; Magrì, D.; Chen, L.S.; Lin, S.F.; Chen, P.-S. Power spectral analysis of heart rate variability and autonomic nervous system activity measured directly in healthy dogs and dogs with tachycardia-induced heart failure. Heart Rhythm 2009, 6, 546–552. [Google Scholar] [CrossRef]
- Piccirillo, G.; Rossi, P.; Mitra, M.; Quaglione, R.; Dell’Armi, A.; Di Barba, D.; Maisto, D.; Lizio, A.; Barillà, F.; Magrì, D. Indexes of temporal myocardial repolarization dispersion and sudden cardiac death in heart failure: Any difference? Ann. Noninvasive Electrocardiol. 2013, 18, 130–139. [Google Scholar] [CrossRef]
- Berger, R.D.; Kasper, E.K.; Baughman, K.L.; Marban, E.; Calkins, H.; Tomaselli, G.F. Beat-to-beat QT interval variability: Novel evidence for repolarization lability in ischemic and nonischemic dilated cardiomyopathy. Circulation 1997, 96, 1557–1565. [Google Scholar] [CrossRef]
- Charloux, A.; Lonsdorfer-Wolf, E.; Richard, R.; Lampert, E.; Oswald-Mammosser, M.; Mettauer, B.; Geny, B.; Lonsdorfer, J. A new impedance cardiograph device for the non-invasive evaluation of cardiac output at rest and during exercise: Comparison with the “direct” Fick method. Eur. J. Appl. Physiol. 2000, 82, 313–320. [Google Scholar] [CrossRef]
- Hsu, A.R.; Barnholt, K.E.; Grundmann, N.K.; Lin, J.H.; McCallum, S.W.; Friedlander, A.L. Sildenafil improves cardiac output and exercise performance during acute hypoxia, but not normoxia. J. Appl. Physiol. 2006, 100, 2031–2040. [Google Scholar] [CrossRef]
- Lepretre, P.M.; Koralsztein, J.P.; Billat, V.L. Effect of exercise intensity on relationship between VO2max and cardiac output. Med. Sci. Sport. Exerc. 2004, 36, 1357–1363. [Google Scholar] [CrossRef]
- Tonelli, A.R.; Alnuaimat, H.; Li, N.; Carrie, R.; Mubarak, K.K. Value of impedance cardiography in patients studied for pulmonary hypertension. Lung 2011, 189, 369–375. [Google Scholar] [CrossRef] [PubMed]
- Gordon, N.; Abbiss, C.R.; Maiorana, A.J.; Marston, K.J.; Peiffer, J.J. Intrarater reliability and agreement of the physioflow bioimpendance cardiography device during rest, moderate and High-intensity exercise. Kinesiology 2018, 50 (Suppl. 1), 140–149. [Google Scholar]
- Leão, R.N.; Silva, P.M.D. Impedance Cardiography in the Evaluation of Patients with Arterial Hypertension. Int. J. Cardiovasc. Sci. 2019, 32, 61–69. [Google Scholar] [CrossRef]
- Anand, G.; Yu, Y.; Lowe, A.; Kalra, A. Bioimpedance analysis as a tool for hemodynamic monitoring: Overview, methods and challenges. Physiol. Meas. 2021, 42, 03TR01. [Google Scholar] [CrossRef]
- Montano, N.; Ruscone, T.G.; Porta, A.; Lombardi, F.; Pagani, M.; Malliani, A. Power spectrum analysis of heart rate variability to assess the changes in sympathovagal balance during graded orthostatic tilt. Circulation 1994, 90, 1826–1831. [Google Scholar] [CrossRef]
- Naylor, J.M.; Chow, C.M.; McLean, A.S.; Heard, R.C.; Avolio, A. Cardiovascular responses to short-term head-down positioning in healthy young and older adults. Physiother. Res. Int. 2005, 10, 32–47. [Google Scholar] [CrossRef]
- Shen, M.J.; Zipes, D.P. Role of the autonomic nervous system in modulating cardiac arrhythmias. Circ. Res. 2014, 114, 1004–1021. [Google Scholar] [CrossRef]
- Toman, O.; Hnatkova, K.; Smetana, P.; Huster, K.M.; Šišáková, M.; Barthel, P.; Novotný, T.; Schmidt, G.; Malik, M. Physiologic heart rate dependency of the PQ interval and its sex differences. Sci. Rep. 2020, 10, 2551. [Google Scholar] [CrossRef]
- Rossi, P.; Cauti, F.M.; Limite, L.R.; Iaia, L.; Allegretti, G.; Di Renzi, P.; Longa, G.D.; Quaglione, R.; Piccirillo, G.; Bianchi, S. Interatrial conduction times in paroxysmal atrial fibrillation patients with normal atrial volume and their correlation with areas of local prolonged bipolar electrograms. J. Electrocardiol. 2020, 58, 19–26. [Google Scholar] [CrossRef]
- Aiken, A.V.; Goldhaber, J.I.; Chugh, S.S. Delayed intrinsicoid deflection: Electrocardiographic harbinger of heart disease. Ann. Noninvasive Electrocardiol. 2022, 27, e12940. [Google Scholar] [CrossRef]
- O’Neal, W.T.; Qureshi, W.T.; Nazarian, S.; Kawel-Boehm, N.; Bluemke, D.A.; Lima, J.A.; Soliman, E.Z. Electrocardiographic Time to Intrinsicoid Deflection and Heart Failure: The Multi-Ethnic Study of Atherosclerosis. Clin. Cardiol. 2016, 39, 531–536. [Google Scholar] [CrossRef]
- Shattock, M.J.; Park, K.C.; Yang, H.Y.; Lee, A.W.C.; Niederer, S.; MacLeod, K.T.; Winter, J. Restitution slope is principally determined by steady-state action potential duration. Cardiovasc. Res. 2017, 113, 817–828. [Google Scholar] [CrossRef]
- Smetana, P.; Batchvarov, V.; Hnatkova, K.; John Camm, A.; Malik, M. Sex differences in the rate dependence of the T wave descending limb. Cardiovasc. Res. 2003, 58, 549–554. [Google Scholar] [CrossRef]
- Andersen, M.P.; Xue, J.Q.; Graff, C.; Kanters, J.K.; Toft, E.; Struijk, J.J. New descriptors of T wave morphology are independent of heart rate. J. Electrocardiol. 2008, 41, 557–561. [Google Scholar] [CrossRef]
- Hasan, M.A.; Abbott, D.; Baumert, M. Relation between beat-to-beat QT interval variability and T wave amplitude in healthy subjects. Ann. Noninvasive Electrocardiol. 2012, 17, 195–203. [Google Scholar] [CrossRef]
- Vrtovec, B.; Starc, V.; Starc, R. Beat-to-beat QT interval variability in coronary patients. J. Electrocardiol. 2000, 33, 119–125. [Google Scholar] [CrossRef]


Disclaimer/Publisher’s Note: The statements, opinions and data contained in all publications are solely those of the individual author(s) and contributor(s) and not of MDPI and/or the editor(s). MDPI and/or the editor(s) disclaim responsibility for any injury to people or property resulting from any ideas, methods, instructions or products referred to in the content. |
© 2023 by the authors. Licensee MDPI, Basel, Switzerland. This article is an open access article distributed under the terms and conditions of the Creative Commons Attribution (CC BY) license (https://creativecommons.org/licenses/by/4.0/).