
Evaluation of Linear Programming and Optimal Contribution Selection Approaches for Long-Term Selection on Beef Cattle Breeding

Abstract
:Simple Summary
Abstract
1. Introduction
2. Materials and Methods
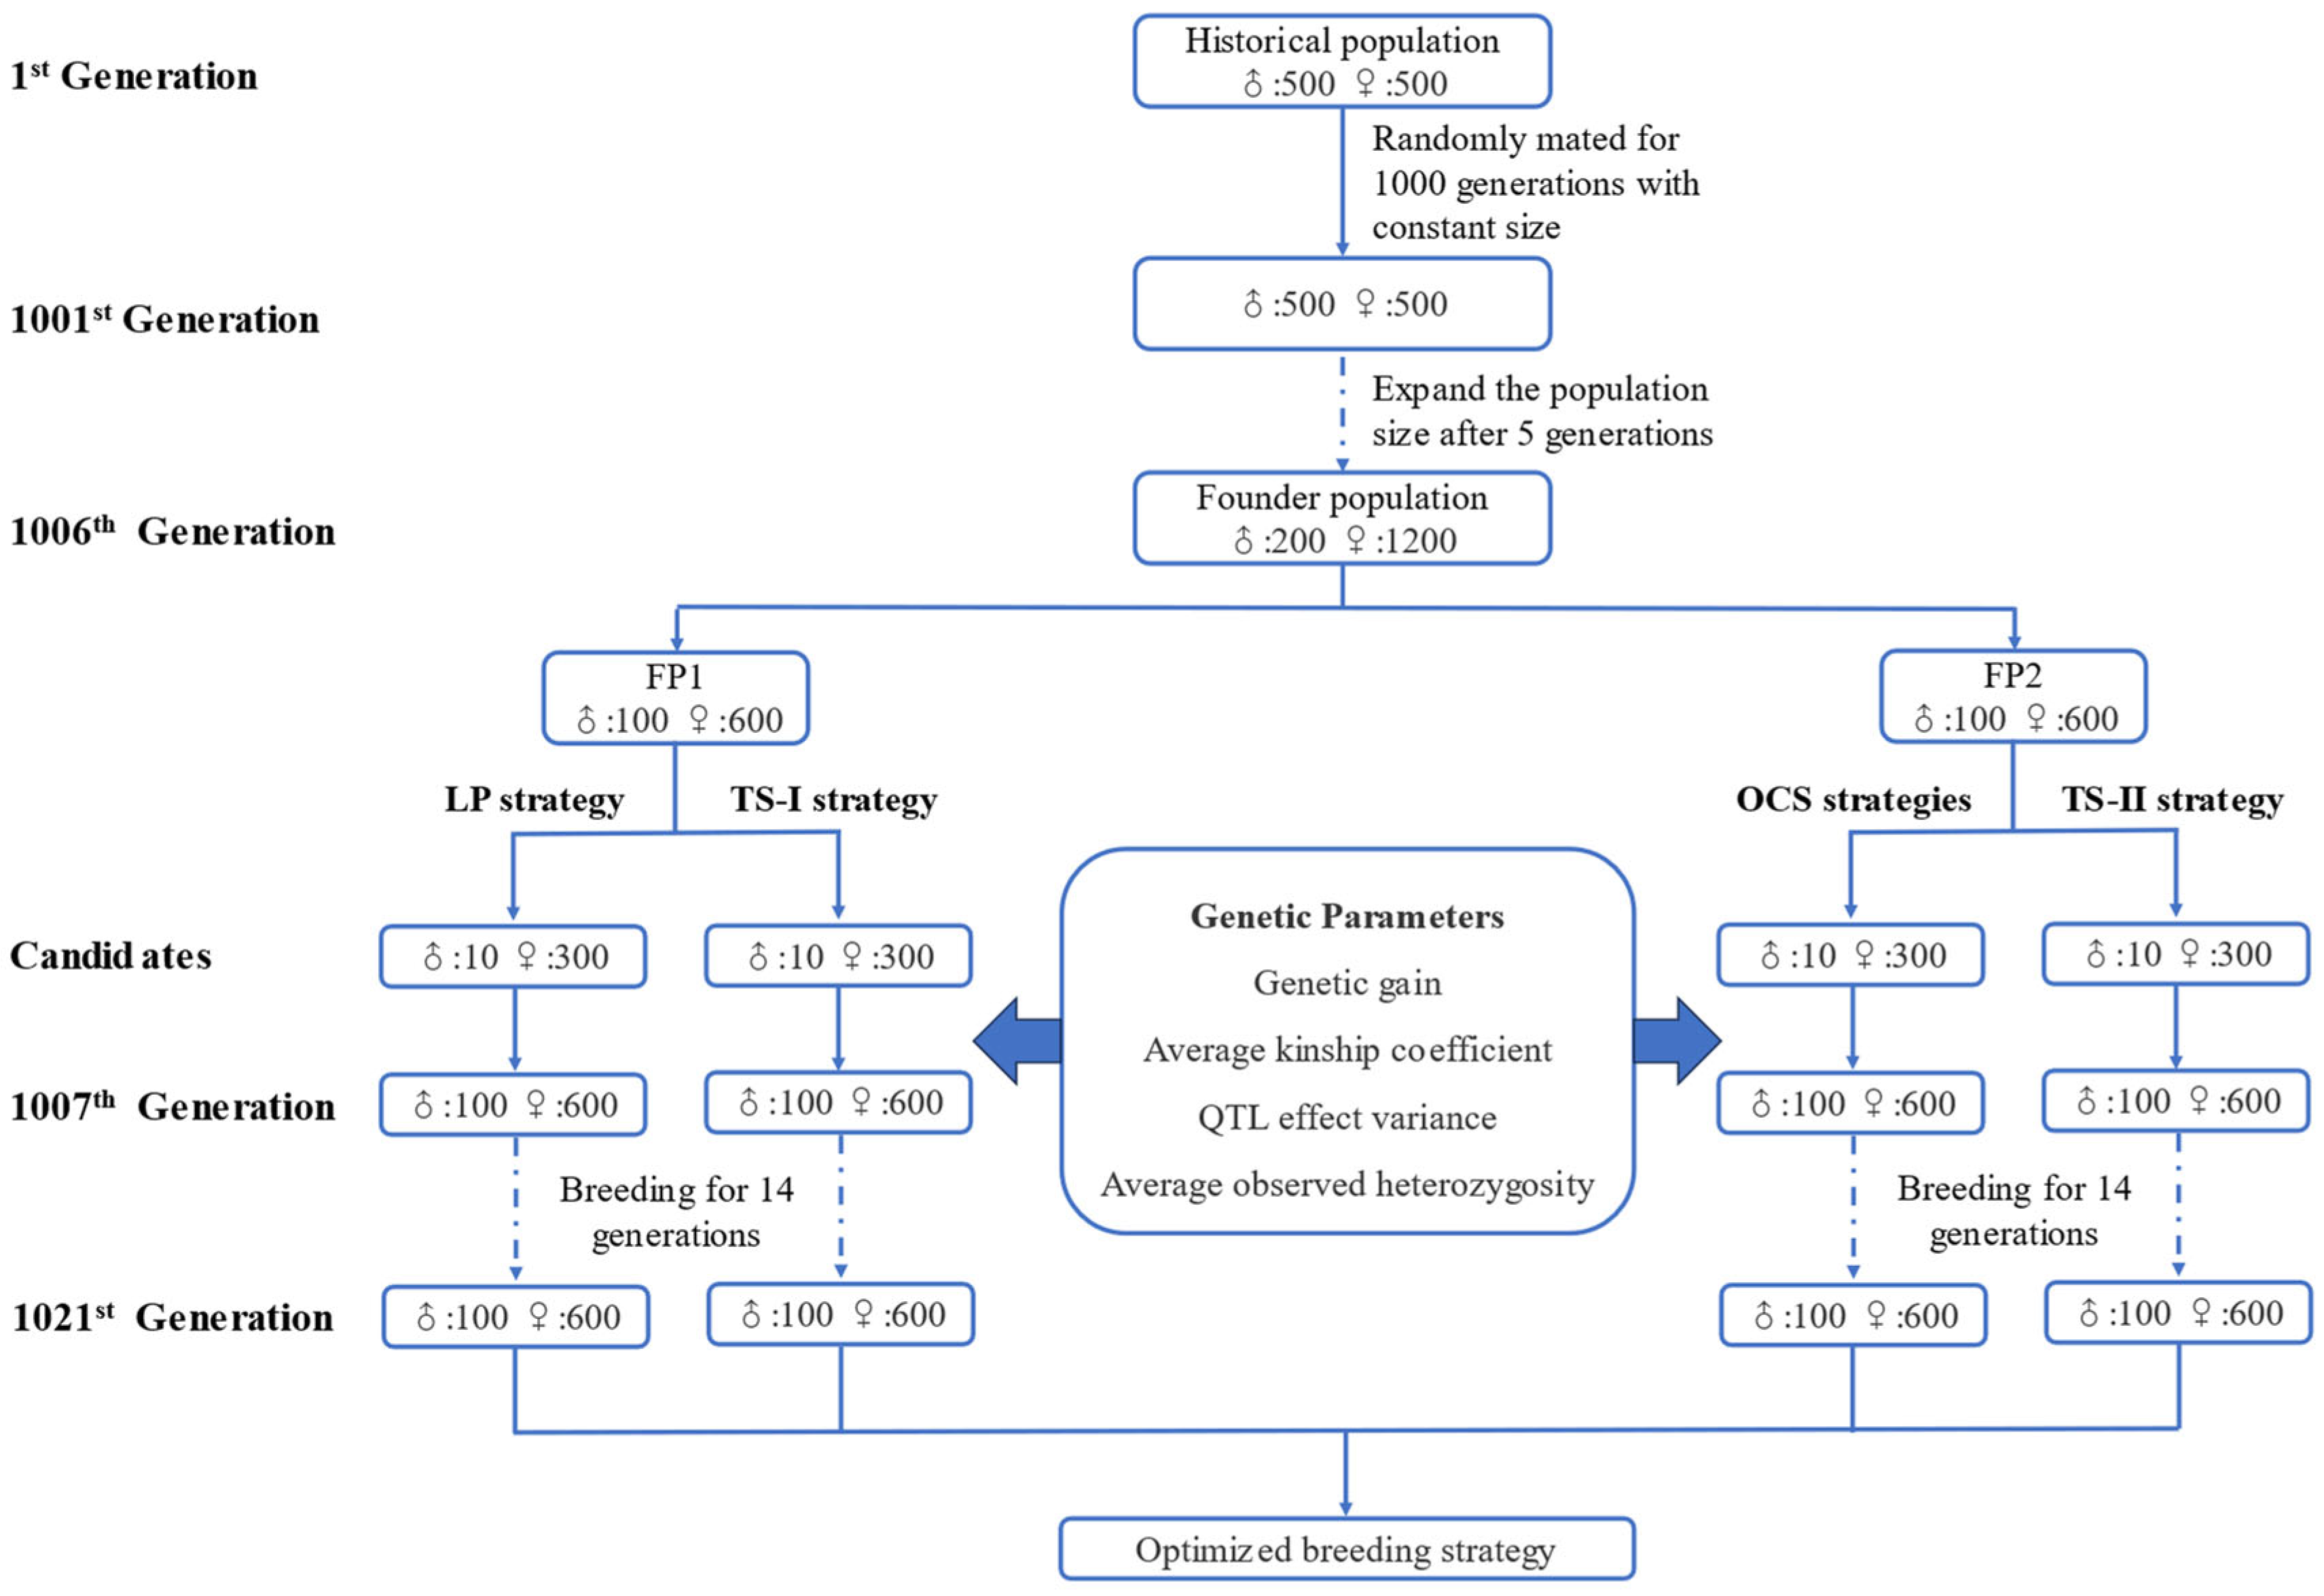
2.1. Generation of Simulated Population
2.2. Simulation of Different Breeding Strategies
2.2.1. LP Strategy
2.2.2. TS−I Strategy
2.2.3. OCS Strategies
2.2.4. TS−II Strategy
2.3. Calculation of Genetic Parameters
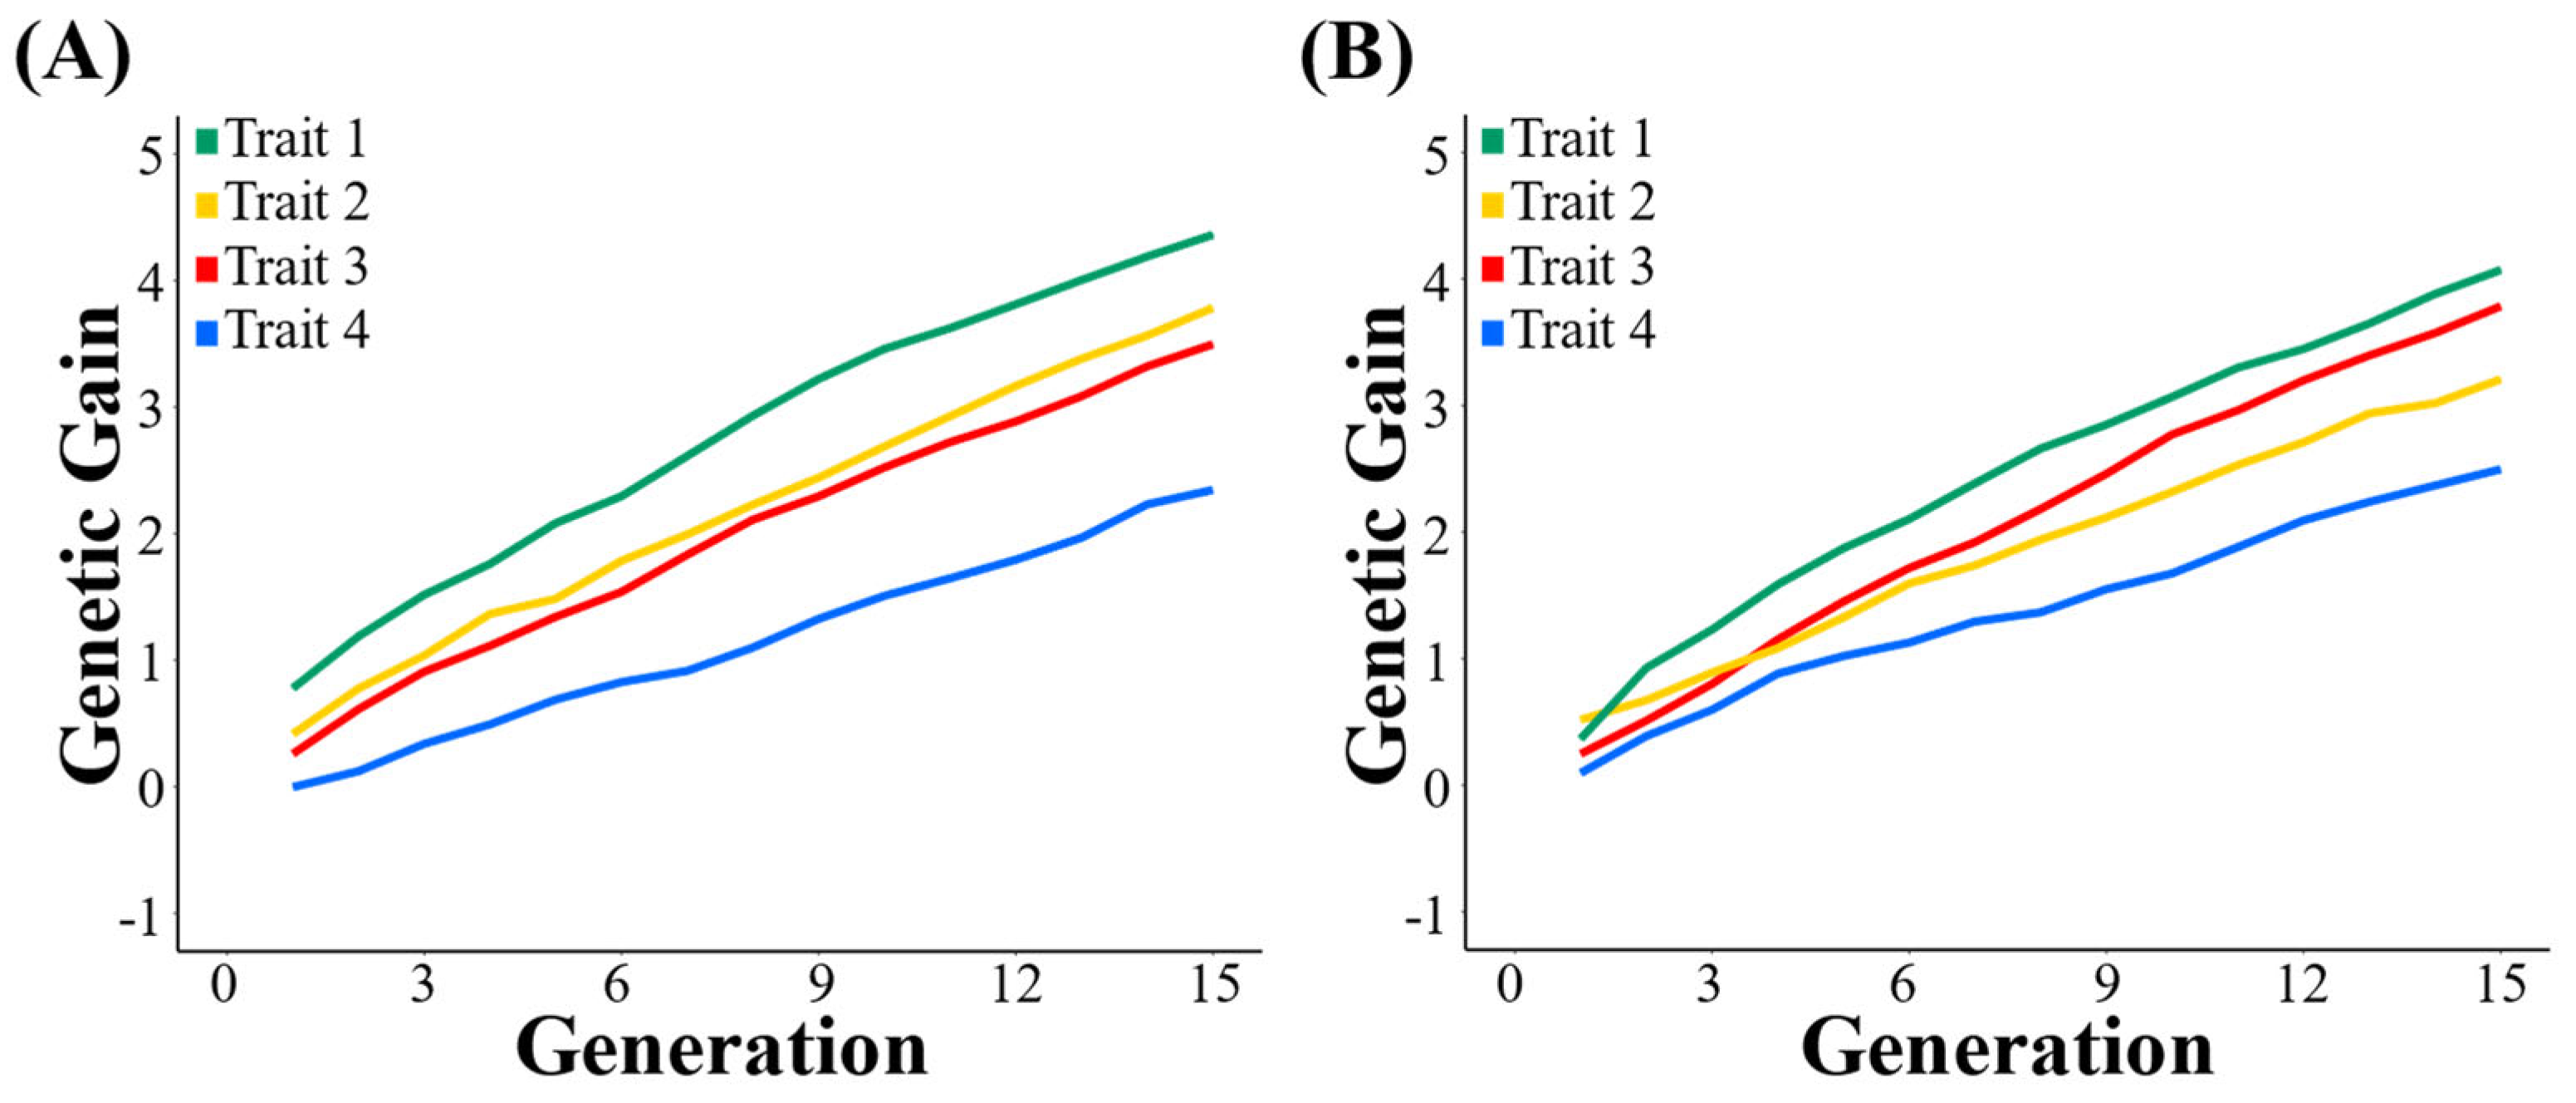
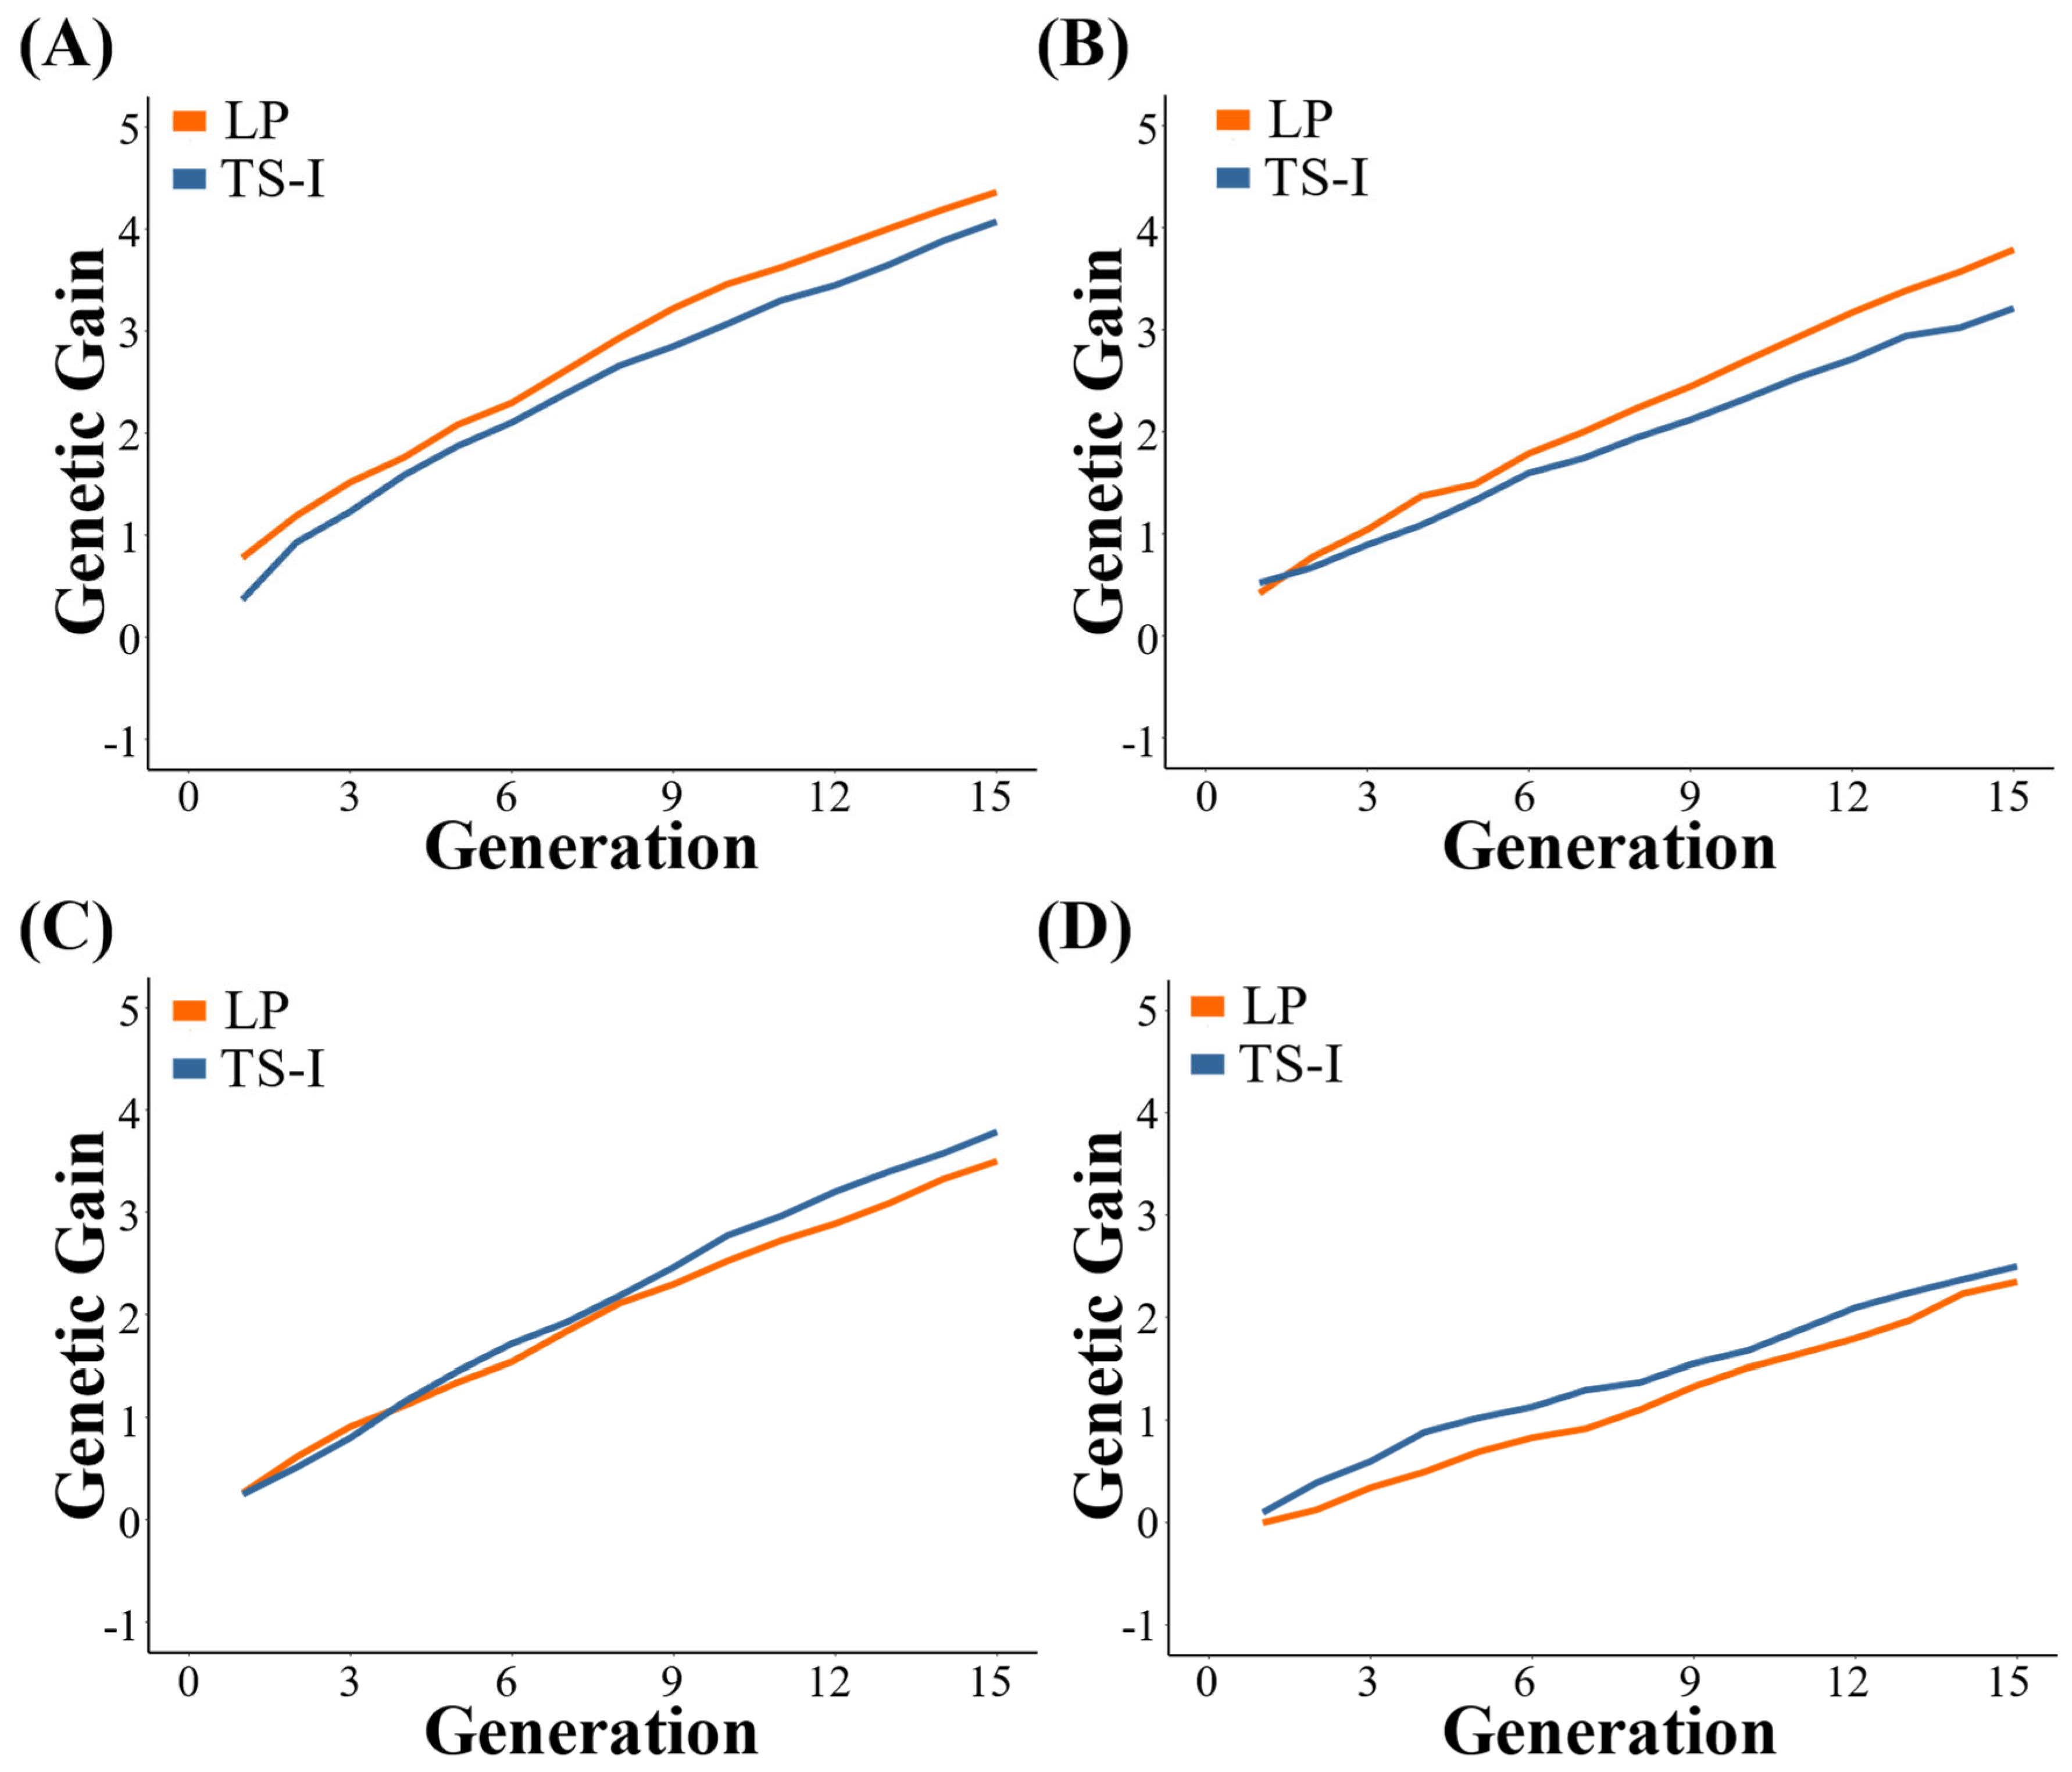
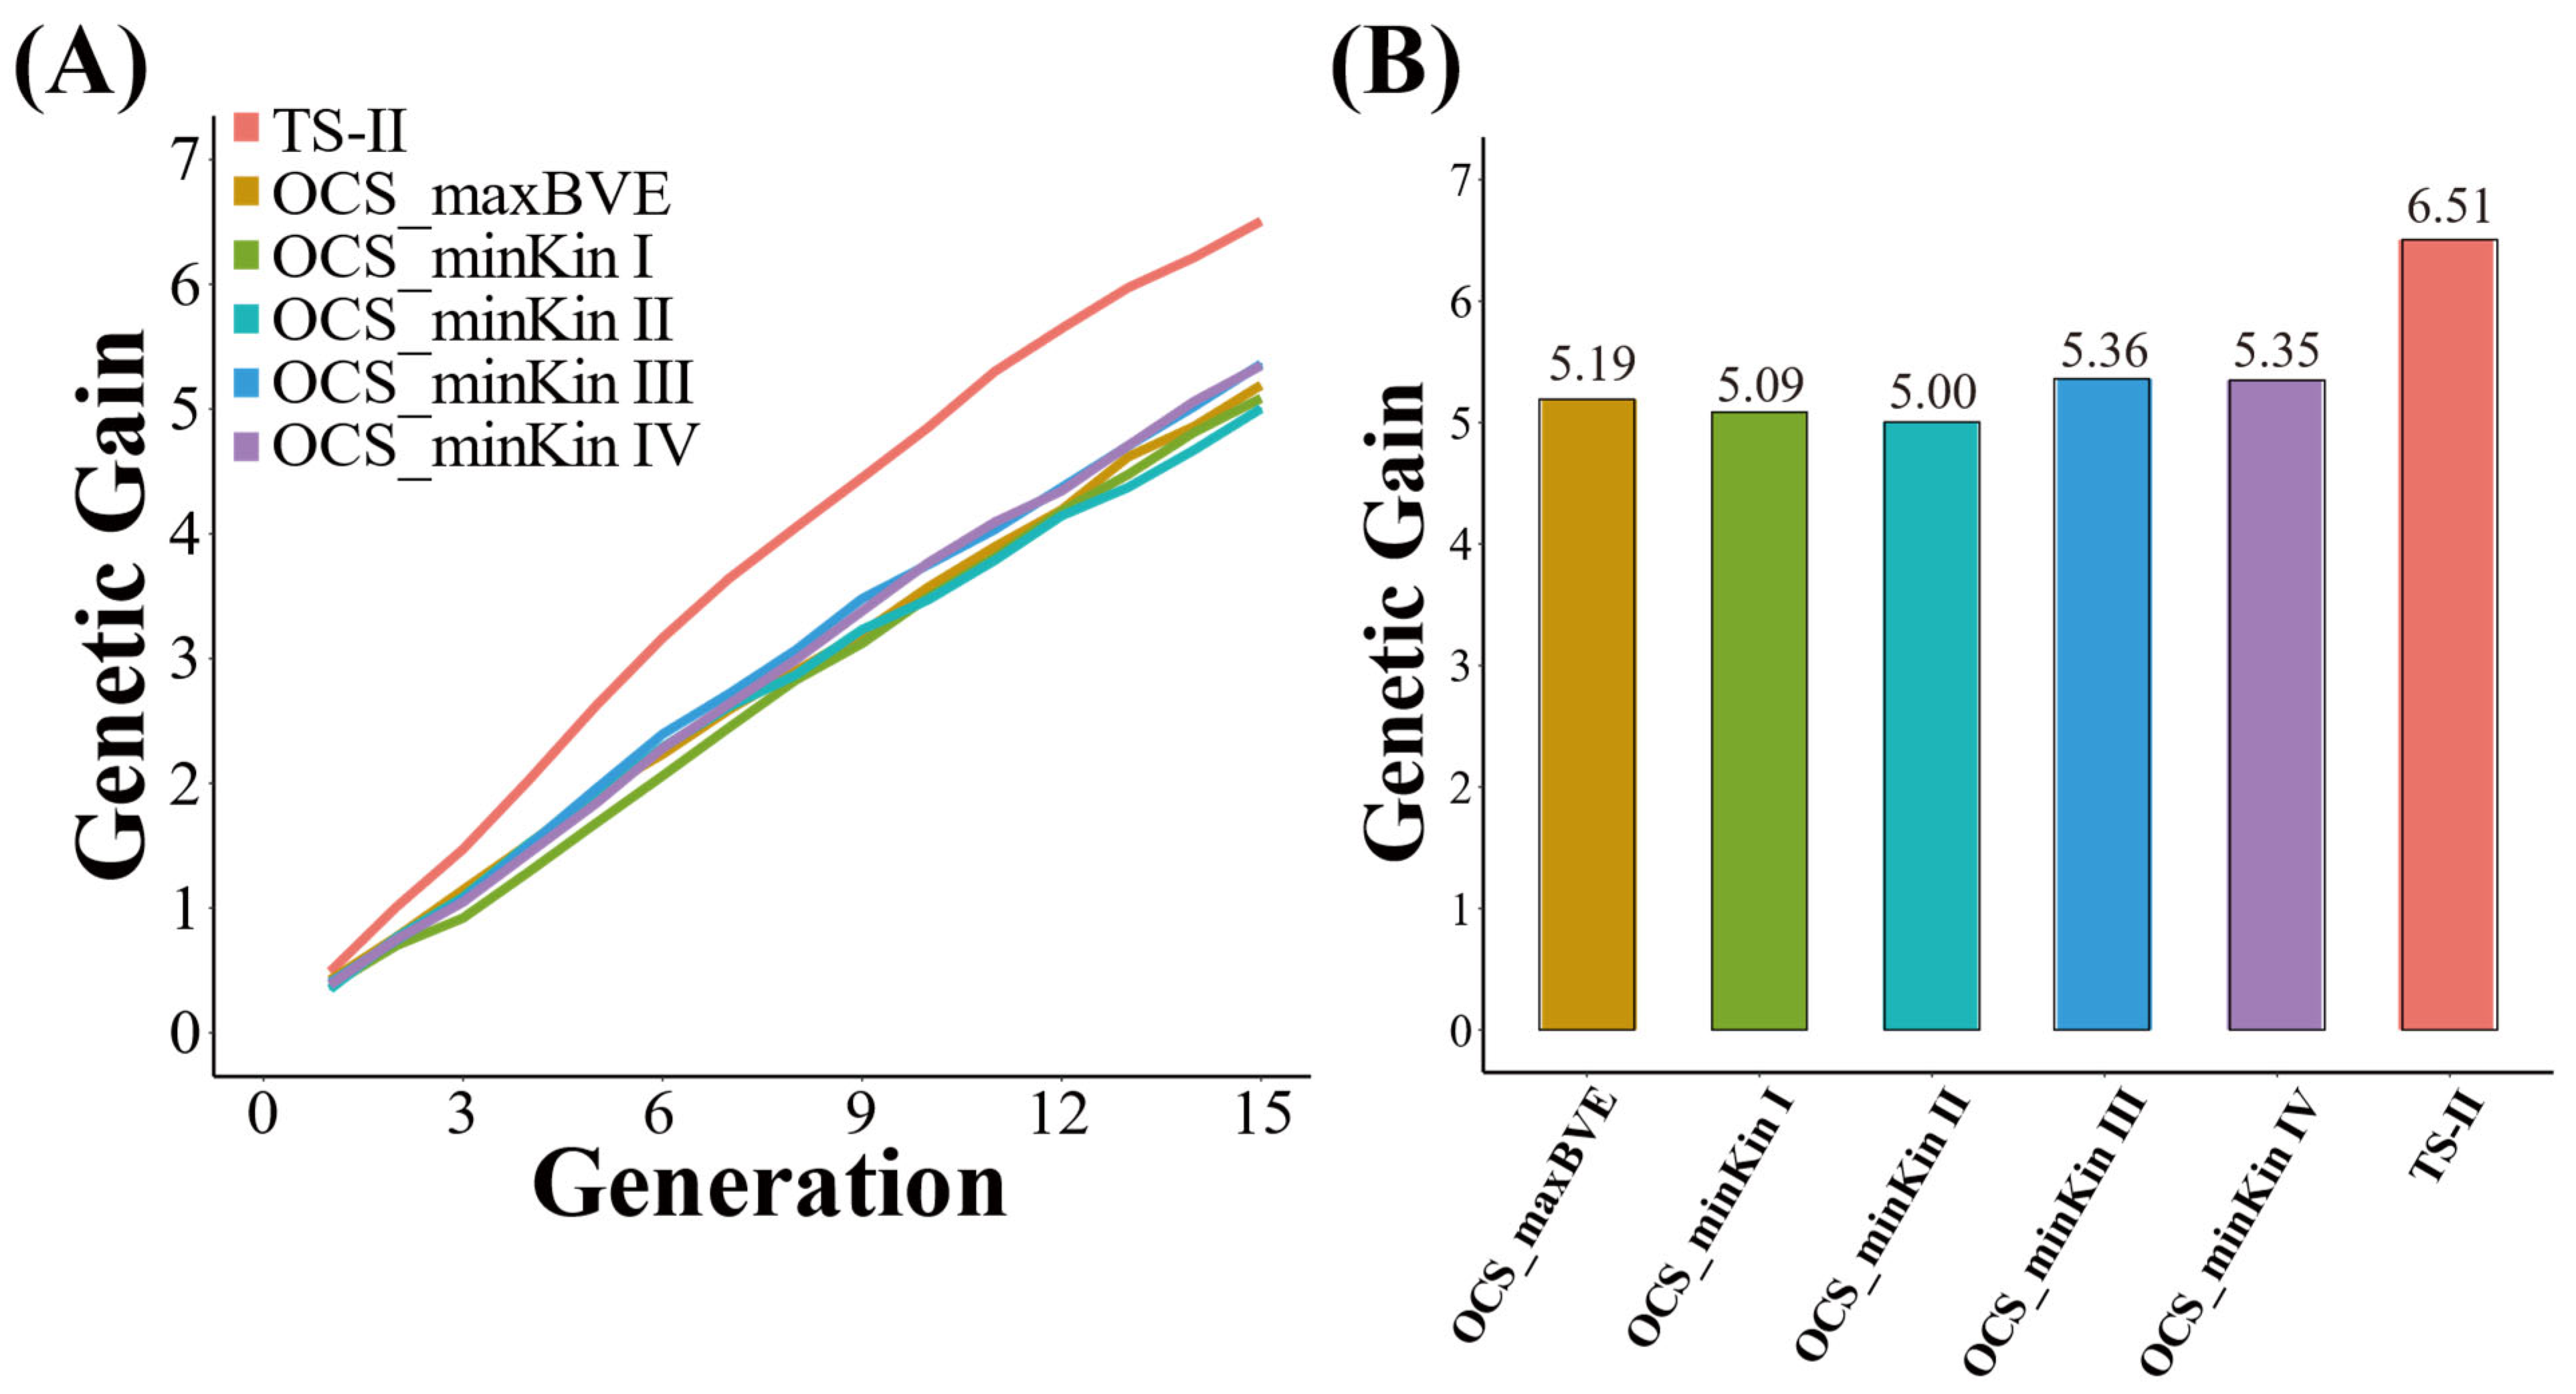
2.3.1. Genetic Gain
2.3.2. Average Kinship Coefficient
2.3.3. QTL Effect Variance and Average Observed Heterozygosity
2.4. Software
3. Results
3.1. Genetic Gain
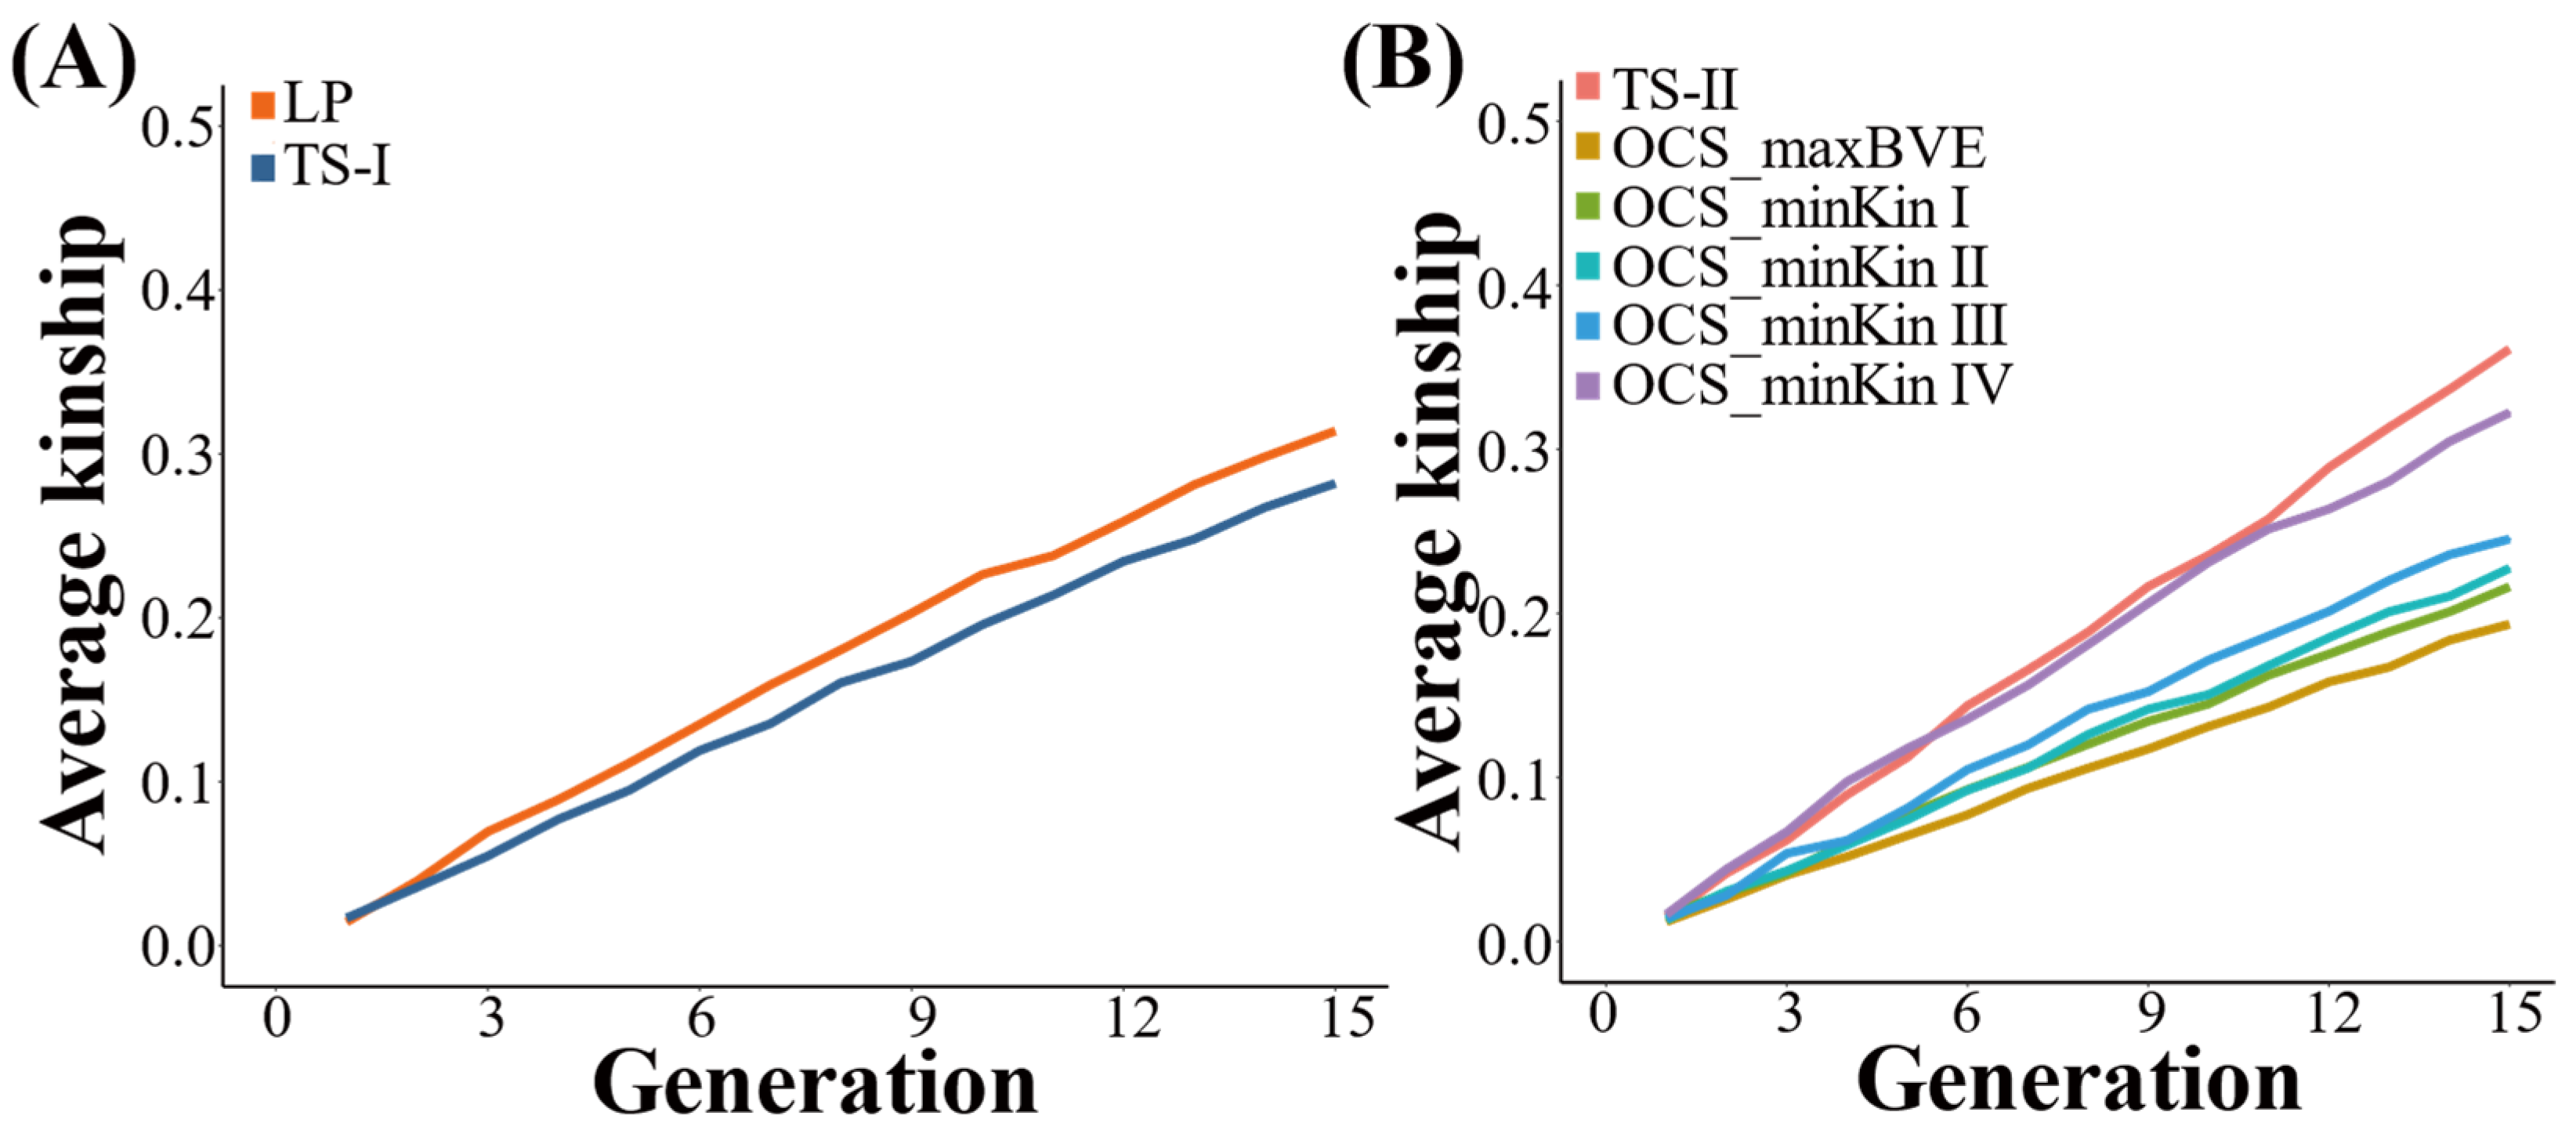
3.2. Average Kinship Coefficient
3.3. QTL Effect Variance and Average Observed Heterozygosity
4. Discussion
5. Conclusions
Author Contributions
Funding
Institutional Review Board Statement
Informed Consent Statement
Data Availability Statement
Conflicts of Interest
References
- Garcia-Ruiz, A.; Cole, J.B.; VanRaden, P.M.; Wiggans, G.R.; Ruiz-Lopez, F.J.; Van Tassell, C.P. Changes in genetic selection differentials and generation intervals in US Holstein dairy cattle as a result of genomic selection. Proc. Natl. Acad. Sci. USA 2016, 113, E4928. [Google Scholar] [CrossRef]
- Samore, A.B.; Fontanesi, L. Genomic selection in pigs: State of the art and perspectives. Ital. J. Anim. Sci. 2016, 15, 211–232. [Google Scholar] [CrossRef]
- Weller, J.I.; Ezra, E.; Ron, M. Invited review: A perspective on the future of genomic selection in dairy cattle. J. Dairy Sci. 2017, 100, 8633–8644. [Google Scholar] [CrossRef] [PubMed]
- VanRaden, P.M.; Van Tassell, C.P.; Wiggans, G.R.; Sonstegard, T.S.; Schnabel, R.D.; Taylor, J.F.; Schenkel, F.S. Invited review: Reliability of genomic predictions for North American Holstein bulls. J. Dairy Sci. 2009, 92, 16–24. [Google Scholar] [CrossRef]
- Daetwyler, H.D.; Hickey, J.M.; Henshall, J.M.; Dominik, S.; Gredler, B.; van der Werf, J.H.J.; Hayes, B.J. Accuracy of estimated genomic breeding values for wool and meat traits in a multi-breed sheep population. Anim. Prod. Sci. 2010, 50, 1004–1010. [Google Scholar] [CrossRef]
- Schierenbeck, S.; Pimentel, E.C.G.; Tietze, M.; Korte, J.; Reents, R.; Reinhardt, F.; Simianer, H.; Konig, S. Controlling inbreeding and maximizing genetic gain using semi-definite programming with pedigree-based and genomic relationships. J. Dairy Sci. 2011, 94, 6143–6152. [Google Scholar] [CrossRef]
- VanRaden, P.M. Symposium review: How to implement genomic selection. J. Dairy Sci. 2020, 103, 5291–5301. [Google Scholar] [CrossRef]
- Schaeffer, L.R. Strategy for applying genome-wide selection in dairy cattle. J. Anim. Breed. Genet. 2006, 123, 218–223. [Google Scholar] [CrossRef]
- Howard, J.T.; Pryce, J.E.; Baes, C.; Maltecca, C. Invited review: Inbreeding in the genomics era: Inbreeding, inbreeding depression, and management of genomic variability. J. Dairy Sci. 2017, 100, 6009–6024. [Google Scholar] [CrossRef]
- Forutan, M.; Mahyari, S.A.; Baes, C.; Melzer, N.; Schenkel, F.S.; Sargolzaei, M. Inbreeding and runs of homozygosity before and after genomic selection in North American Holstein cattle. BMC Genom. 2018, 19, 98. [Google Scholar] [CrossRef]
- Makanjuola, B.O.; Miglior, F.; Abdalla, E.A.; Maltecca, C.; Schenkel, F.S.; Baes, C.F. Effect of genomic selection on rate of inbreeding and coancestry and effective population size of Holstein and Jersey cattle populations. J. Dairy Sci. 2020, 103, 5183–5199. [Google Scholar] [CrossRef]
- Lozada-Soto, E.A.; Tiezzi, F.; Jiang, J.C.; Cole, J.B.; VanRaden, P.M.; Maltecca, C. Genomic characterization of autozygosity and recent inbreeding trends in all major breeds of US dairy cattle. J. Dairy Sci. 2022, 105, 8956–8971. [Google Scholar] [CrossRef]
- Eynard, S.E.; Windig, J.J.; Leroy, G.; van Binsbergen, R.; Calus, M.P.L. The effect of rare alleles on estimated genomic relationships from whole genome sequence data. BMC Genet. 2015, 16, 24. [Google Scholar] [CrossRef] [PubMed]
- De Beukelaer, H.; Badke, Y.; Fack, V.; De Meyer, G. Moving Beyond Managing Realized Genomic Relationship in Long-Term Genomic Selection. Genetics 2017, 206, 1127–1138. [Google Scholar] [CrossRef] [PubMed]
- Akdemir, D.; Beavis, W.; Fritsche-Neto, R.; Singh, A.K.; Isidro-Sanchez, J. Multi-objective optimized genomic breeding strategies for sustainable food improvement. Heredity 2019, 122, 672–683. [Google Scholar] [CrossRef]
- Fang, S.-C.; Puthenpura, S. Linear Optimization and Extensions: Theory and Algorithms; Prentice-Hall, Inc.: Hoboken, NJ, USA, 1993. [Google Scholar]
- Jansen, G.B.; Wilton, J.W. Selecting mating pairs with linear programming techniques. J. Dairy Sci. 1985, 68, 1302–1305. [Google Scholar] [CrossRef]
- Meuwissen, T.H.E. Maximizing the response of selection with a predefined rate of inbreeding. J. Anim. Sci. 1997, 75, 934–940. [Google Scholar] [CrossRef] [PubMed]
- Woolliams, J.; Thomson, R. A theory of genetic contributions. In Proceedings of the 5th World Congress on Genetics Applied to Livestock Production, Guelph, Ontario, Canada, 7–12 August 1994; pp. 127–134. [Google Scholar]
- Grundy, B.; Villanueva, B.; Woolliams, J.A. Dynamic selection procedures for constrained inbreeding and their consequences for pedigree development. Genet. Res. 1998, 72, 159–168. [Google Scholar] [CrossRef]
- He, J.; Wu, X.L.; Zeng, Q.H.; Li, H.; Ma, H.M.; Jiang, J.; Rosa, G.J.M.; Gianola, D.; Tait, R.G.; Bauck, S. Genomic mating as sustainable breeding for Chinese indigenous Ningxiang pigs. PLoS ONE 2020, 15, e0236629. [Google Scholar] [CrossRef]
- Pryce, J.E.; Hayes, B.J.; Goddard, M.E. Novel strategies to minimize progeny inbreeding while maximizing genetic gain using genomic information. J. Dairy Sci. 2012, 95, 377–388. [Google Scholar] [CrossRef]
- Clark, S.A.; Kinghorn, B.P.; Hickey, J.M.; van der Werf, J.H.J. The effect of genomic information on optimal contribution selection in livestock breeding programs. Genet. Sel. Evol. 2013, 45, 44. [Google Scholar] [CrossRef] [PubMed]
- Hjorto, L.; Henryon, M.; Liu, H.M.; Berg, P.; Thomasen, J.R.; Sorensen, A.C. Pre-selection against a lethal recessive allele in breeding schemes with optimum-contribution selection or truncation selection. Genet. Sel. Evol. 2021, 53, 75. [Google Scholar] [CrossRef] [PubMed]
- Kohl, S.; Wellmann, R.; Herold, P. Implementation of advanced Optimum Contribution Selection in small-scale breeding schemes: Prospects and challenges in Vorderwald cattle. Animal 2020, 14, 452–463. [Google Scholar] [CrossRef]
- Jannink, J.L. Dynamics of long-term genomic selection. Genet. Sel. Evol. 2010, 42, 35. [Google Scholar] [CrossRef] [PubMed]
- Zhu, B.; Guo, P.; Wang, Z.; Zhang, W.; Chen, Y.; Zhang, L.; Gao, H.; Gao, X.; Xu, L.; Li, J. Accuracies of genomic prediction for twenty economically important traits in Chinese Simmental beef cattle. Anim. Genet. 2019, 50, 634–643. [Google Scholar] [CrossRef]
- Carthy, T.R.; McCarthy, J.; Berry, D.P. A mating advice system in dairy cattle incorporating genomic information. J. Dairy Sci. 2019, 102, 8210–8220. [Google Scholar] [CrossRef]
- Doekes, H.P.; Bijma, P.; Windig, J.J. How Depressing Is Inbreeding? A Meta-Analysis of 30 Years of Research on the Effects of Inbreeding in Livestock. Genes 2021, 12, 926. [Google Scholar] [CrossRef]
- Zheng, X.; Zhang, T.; Wang, T.; Niu, Q.; Wu, J.; Wang, Z.; Gao, H.; Li, J.; Xu, L. Long-Term Impact of Genomic Selection on Genetic Gain Using Different SNP Density. Agriculture 2022, 12, 1463. [Google Scholar] [CrossRef]
- Wang, Y.; Segelke, D.; Emmerling, R.; Bennewitz, J.; Wellmann, R. Long-Term Impact of Optimum Contribution Selection Strategies on Local Livestock Breeds with Historical Introgression Using the Example of German Angler Cattle. G3 Genes Genom. Genet. 2017, 7, 4009–4018. [Google Scholar] [CrossRef]
- Gregorius, H.-R. The concept of genetic diversity and its formal relationship to heterozygosity and genetic distance. Math. Biosci. 1978, 41, 253–271. [Google Scholar] [CrossRef]
- Jansen, G.B.; Wilton, J.W. Linear programming in selection of livestock. J. Dairy Sci. 1984, 67, 897–901. [Google Scholar] [CrossRef]
- Galligan, D.T.; Ferguson, J.D. Application of Linear-Programming in Bull Selection for a Dairy-Herd. J. Am. Vet. Med. Assoc. 1995, 206, 173–176. [Google Scholar] [PubMed]
- McGilliard, M.L.; Clay, J.S. Selecting Groups of Sires by Computer to Maximize Herd Breeding Goals. J. Dairy Sci. 1983, 66, 647–653. [Google Scholar] [CrossRef] [PubMed]
- Galligan, D.T.; Ramberg, C.R.; Chalupa, W.; Johnstone, C.; Smith, G. An application of multi-objective linear programming for the achievement of breeding goals in herd health programs. Acta. Vet. Scand. Suppl. 1988, 84, 449–452. [Google Scholar]
- Berodier, M.; Berg, P.; Meuwissen, T.; Boichard, D.; Brochard, M.; Ducrocq, V. Improved dairy cattle mating plans at herd level using genomic information. Animal 2021, 15, 100016. [Google Scholar] [CrossRef]
- Bengtsson, C.; Stalhammar, H.; Thomasen, J.R.; Eriksson, S.; Fikse, W.F.; Strandberg, E. Mating allocations in Nordic Red Dairy Cattle using genomic information. J. Dairy Sci. 2022, 105, 1281–1297. [Google Scholar] [CrossRef]
- Meuwissen, T.H.E.; Sonesson, A.K. Maximizing the response of selection with a predefined rate of inbreeding: Overlapping generations. J. Anim. Sci. 1998, 76, 2575–2583. [Google Scholar] [CrossRef]
- Gourdine, J.L.; Sorensen, A.C.; Rydhmer, L. There is room for selection in a small local pig breed when using optimum contribution selection: A simulation study. J. Anim. Sci. 2012, 90, 76–84. [Google Scholar] [CrossRef]
- Zhao, Q.B.; Liu, H.M.; Qadri, Q.R.; Wang, Q.S.; Pan, Y.C.; Su, G.S. Long-term impact of conventional and optimal contribution conservation methods on genetic diversity and genetic gain in local pig breeds. Heredity 2021, 127, 546–553. [Google Scholar] [CrossRef]
- Seno, L.O.; Guidolin, D.G.F.; Aspilcueta-Borquis, R.R.; Nascimento, G.B.D.; Silva, T.; Oliveira, H.N.; Munari, D.P. Genomic selection in dairy cattle simulated populations. J. Dairy Res. 2018, 85, 125–132. [Google Scholar] [CrossRef]
- Forcada, J.; Hoffman, J.I. Climate change selects for heterozygosity in a declining fur seal population. Nature 2014, 511, 462–465. [Google Scholar] [CrossRef] [PubMed]
- Hake, S.; Ross-Ibarra, J. Genetic, evolutionary and plant breeding insights from the domestication of maize. Elife 2015, 4, e05861. [Google Scholar] [CrossRef] [PubMed]
- Charlesworth, D.; Willis, J.H. Fundamental concepts in genetics The genetics of inbreeding depression. Nat. Rev. Genet. 2009, 10, 783–796. [Google Scholar] [CrossRef]
- Rafter, P.; McHugh, N.; Pabiou, T.; Berry, D.P. Inbreeding trends and genetic diversity in purebred sheep populations. Animal 2022, 16, 100604. [Google Scholar] [CrossRef] [PubMed]

| Breeding Strategy | HO | |||
|---|---|---|---|---|
| FP | G1021 | FP | G1021 | |
| TS−I | 0.00486 | 0.00324 | 0.21042 | 0.15191 |
| LP | 0.00493 | 0.00344 | 0.21042 | 0.14664 |
| TS−II | 0.00486 | 0.00145 | 0.21042 | 0.13712 |
| OCS_maxBVE | 0.00493 | 0.00278 | 0.21042 | 0.17097 |
| OCS_minKin I | 0.00493 | 0.00274 | 0.21042 | 0.16668 |
| OCS_minKin II | 0.00493 | 0.00260 | 0.21042 | 0.16418 |
| OCS_minKin III | 0.00493 | 0.00248 | 0.21042 | 0.15949 |
| OCS_minKin IV | 0.00493 | 0.00215 | 0.21042 | 0.14429 |
Disclaimer/Publisher’s Note: The statements, opinions and data contained in all publications are solely those of the individual author(s) and contributor(s) and not of MDPI and/or the editor(s). MDPI and/or the editor(s) disclaim responsibility for any injury to people or property resulting from any ideas, methods, instructions or products referred to in the content. |
© 2023 by the authors. Licensee MDPI, Basel, Switzerland. This article is an open access article distributed under the terms and conditions of the Creative Commons Attribution (CC BY) license (https://creativecommons.org/licenses/by/4.0/).
Share and Cite
Zheng, X.; Wang, T.; Niu, Q.; Wu, J.; Zhao, Z.; Gao, H.; Li, J.; Xu, L. Evaluation of Linear Programming and Optimal Contribution Selection Approaches for Long-Term Selection on Beef Cattle Breeding. Biology 2023, 12, 1157. https://doi.org/10.3390/biology12091157
Zheng X, Wang T, Niu Q, Wu J, Zhao Z, Gao H, Li J, Xu L. Evaluation of Linear Programming and Optimal Contribution Selection Approaches for Long-Term Selection on Beef Cattle Breeding. Biology. 2023; 12(9):1157. https://doi.org/10.3390/biology12091157
Chicago/Turabian StyleZheng, Xu, Tianzhen Wang, Qunhao Niu, Jiayuan Wu, Zhida Zhao, Huijiang Gao, Junya Li, and Lingyang Xu. 2023. "Evaluation of Linear Programming and Optimal Contribution Selection Approaches for Long-Term Selection on Beef Cattle Breeding" Biology 12, no. 9: 1157. https://doi.org/10.3390/biology12091157