Author Contributions
Conceptualization, Q.Z. and W.L.; methodology, Q.Z. and W.L.; software, Q.Z.; validation, Q.Z., W.L. and L.Q.; formal analysis, Q.Z., M.L., C.G., G.F. and W.L.; resources, T.Z.; data curation, Q.Z. and W.L.; writing—original draft preparation, Q.Z., W.L., J.L., T.Z. and G.F.; writing—review and editing, W.L., T.Z., J.L. and C.G.; visualization, Q.Z.; supervision, W.L., T.Z. and J.L. All authors have read and agreed to the published version of the manuscript.
Figure 1.
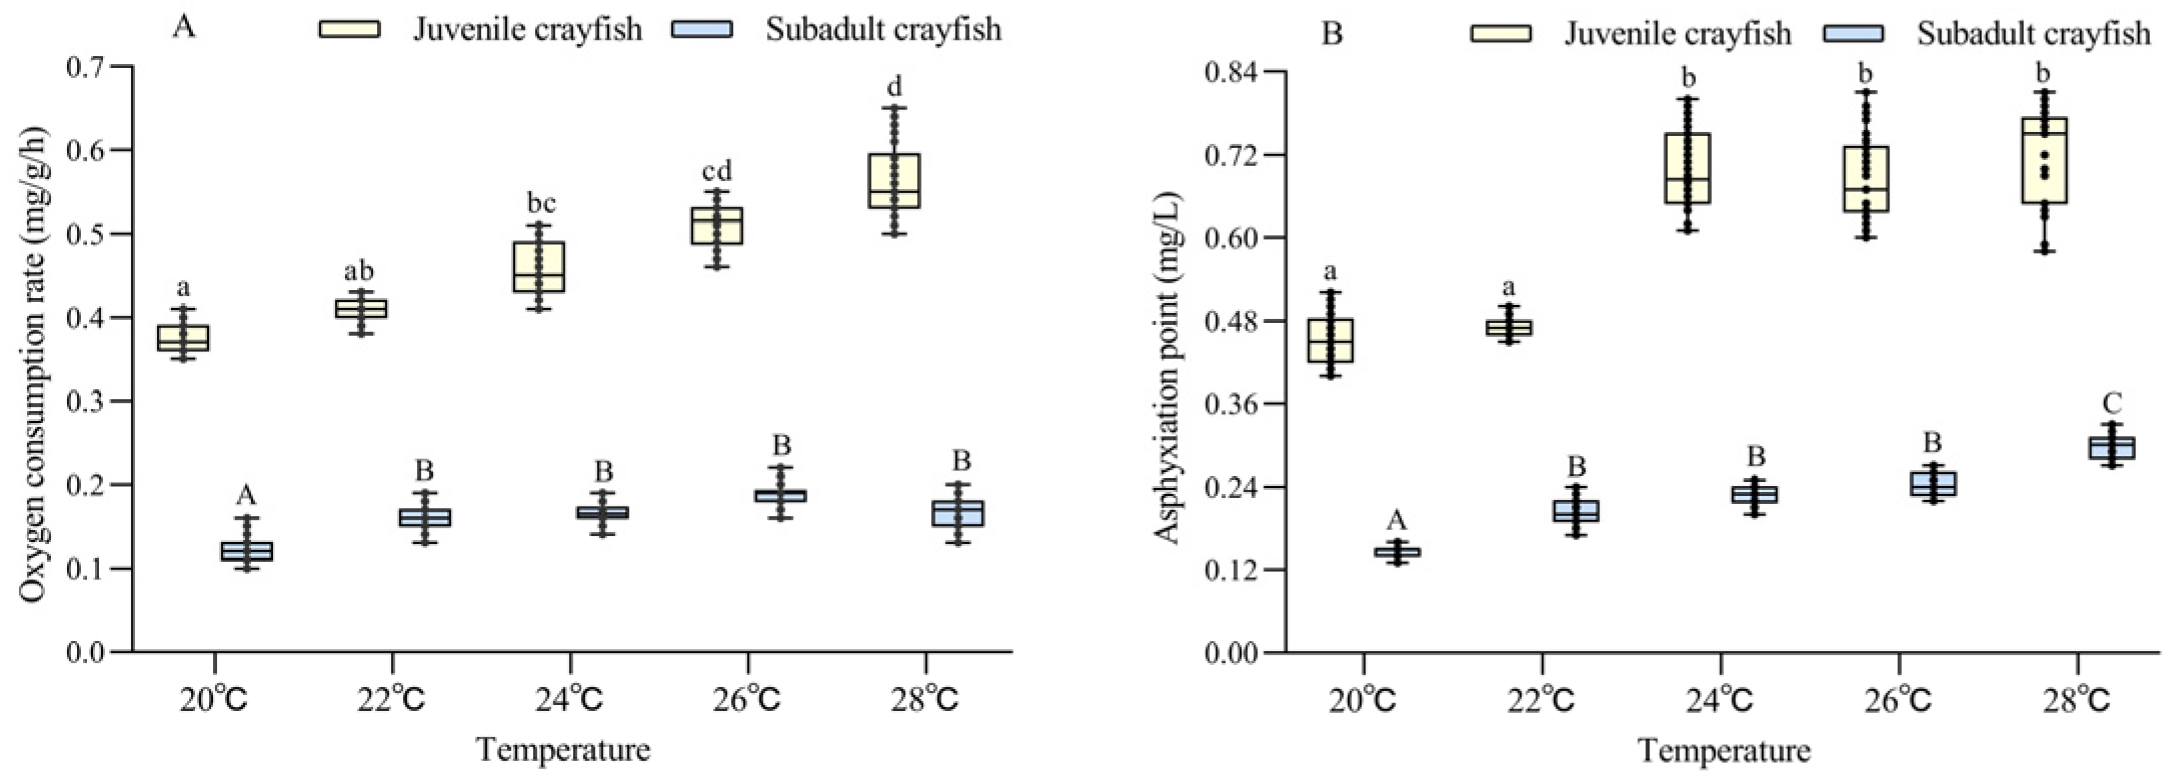
Analysis of the difference in oxygen consumption rate (A) and asphyxiation point (B) between juvenile and subadult Procambarus clarkii at different temperature levels. There were 30 shrimp per temperature level, and each point showed the individual’s oxygen consumption rate and asphyxiation point. In the figure, there were no significant differences in oxygen consumption rate and asphyxiation point between the treatment groups with the same letters, but there were significant differences between the treatment groups with different letters (p < 0.05).
Figure 1.
Analysis of the difference in oxygen consumption rate (A) and asphyxiation point (B) between juvenile and subadult Procambarus clarkii at different temperature levels. There were 30 shrimp per temperature level, and each point showed the individual’s oxygen consumption rate and asphyxiation point. In the figure, there were no significant differences in oxygen consumption rate and asphyxiation point between the treatment groups with the same letters, but there were significant differences between the treatment groups with different letters (p < 0.05).
Figure 2.
Changes in antioxidant enzyme and respiratory enzyme activities of juvenile Procambarus clarkii under different dissolved oxygen levels and different sampling times. Superoxide dismutase (A), Catalase (B), Lactate content (C), Lactate dehydrogenase (D). There were three repeat groups for each dissolved oxygen level, replicate groups of 12 shrimp, with water temperatures of 24.0 °C, and each point showed the average enzyme activity of the three shrimp under the current conditions. In the figure, there were no significant differences in enzyme activity between the groups with the same letters, but there were significant differences between the groups with different letters (p < 0.05).
Figure 3.
Changes in antioxidant enzyme and respiratory enzyme activities of subadult Procambarus clarkii under different dissolved oxygen levels and different sampling times. Superoxide dismutase (A), Catalase (B), Lactate content (C), Lactate dehydrogenase (D). There were three repeat groups for each dissolved oxygen level, replicate groups of 12 shrimp, with water temperatures of 24.0 °C, and each point showed the average enzyme activity of the three shrimp under the current conditions. In the figure, there were no significant differences in enzyme activity between the groups with the same letters, but there were significant differences between the groups with different letters (p < 0.05).
Figure 4.
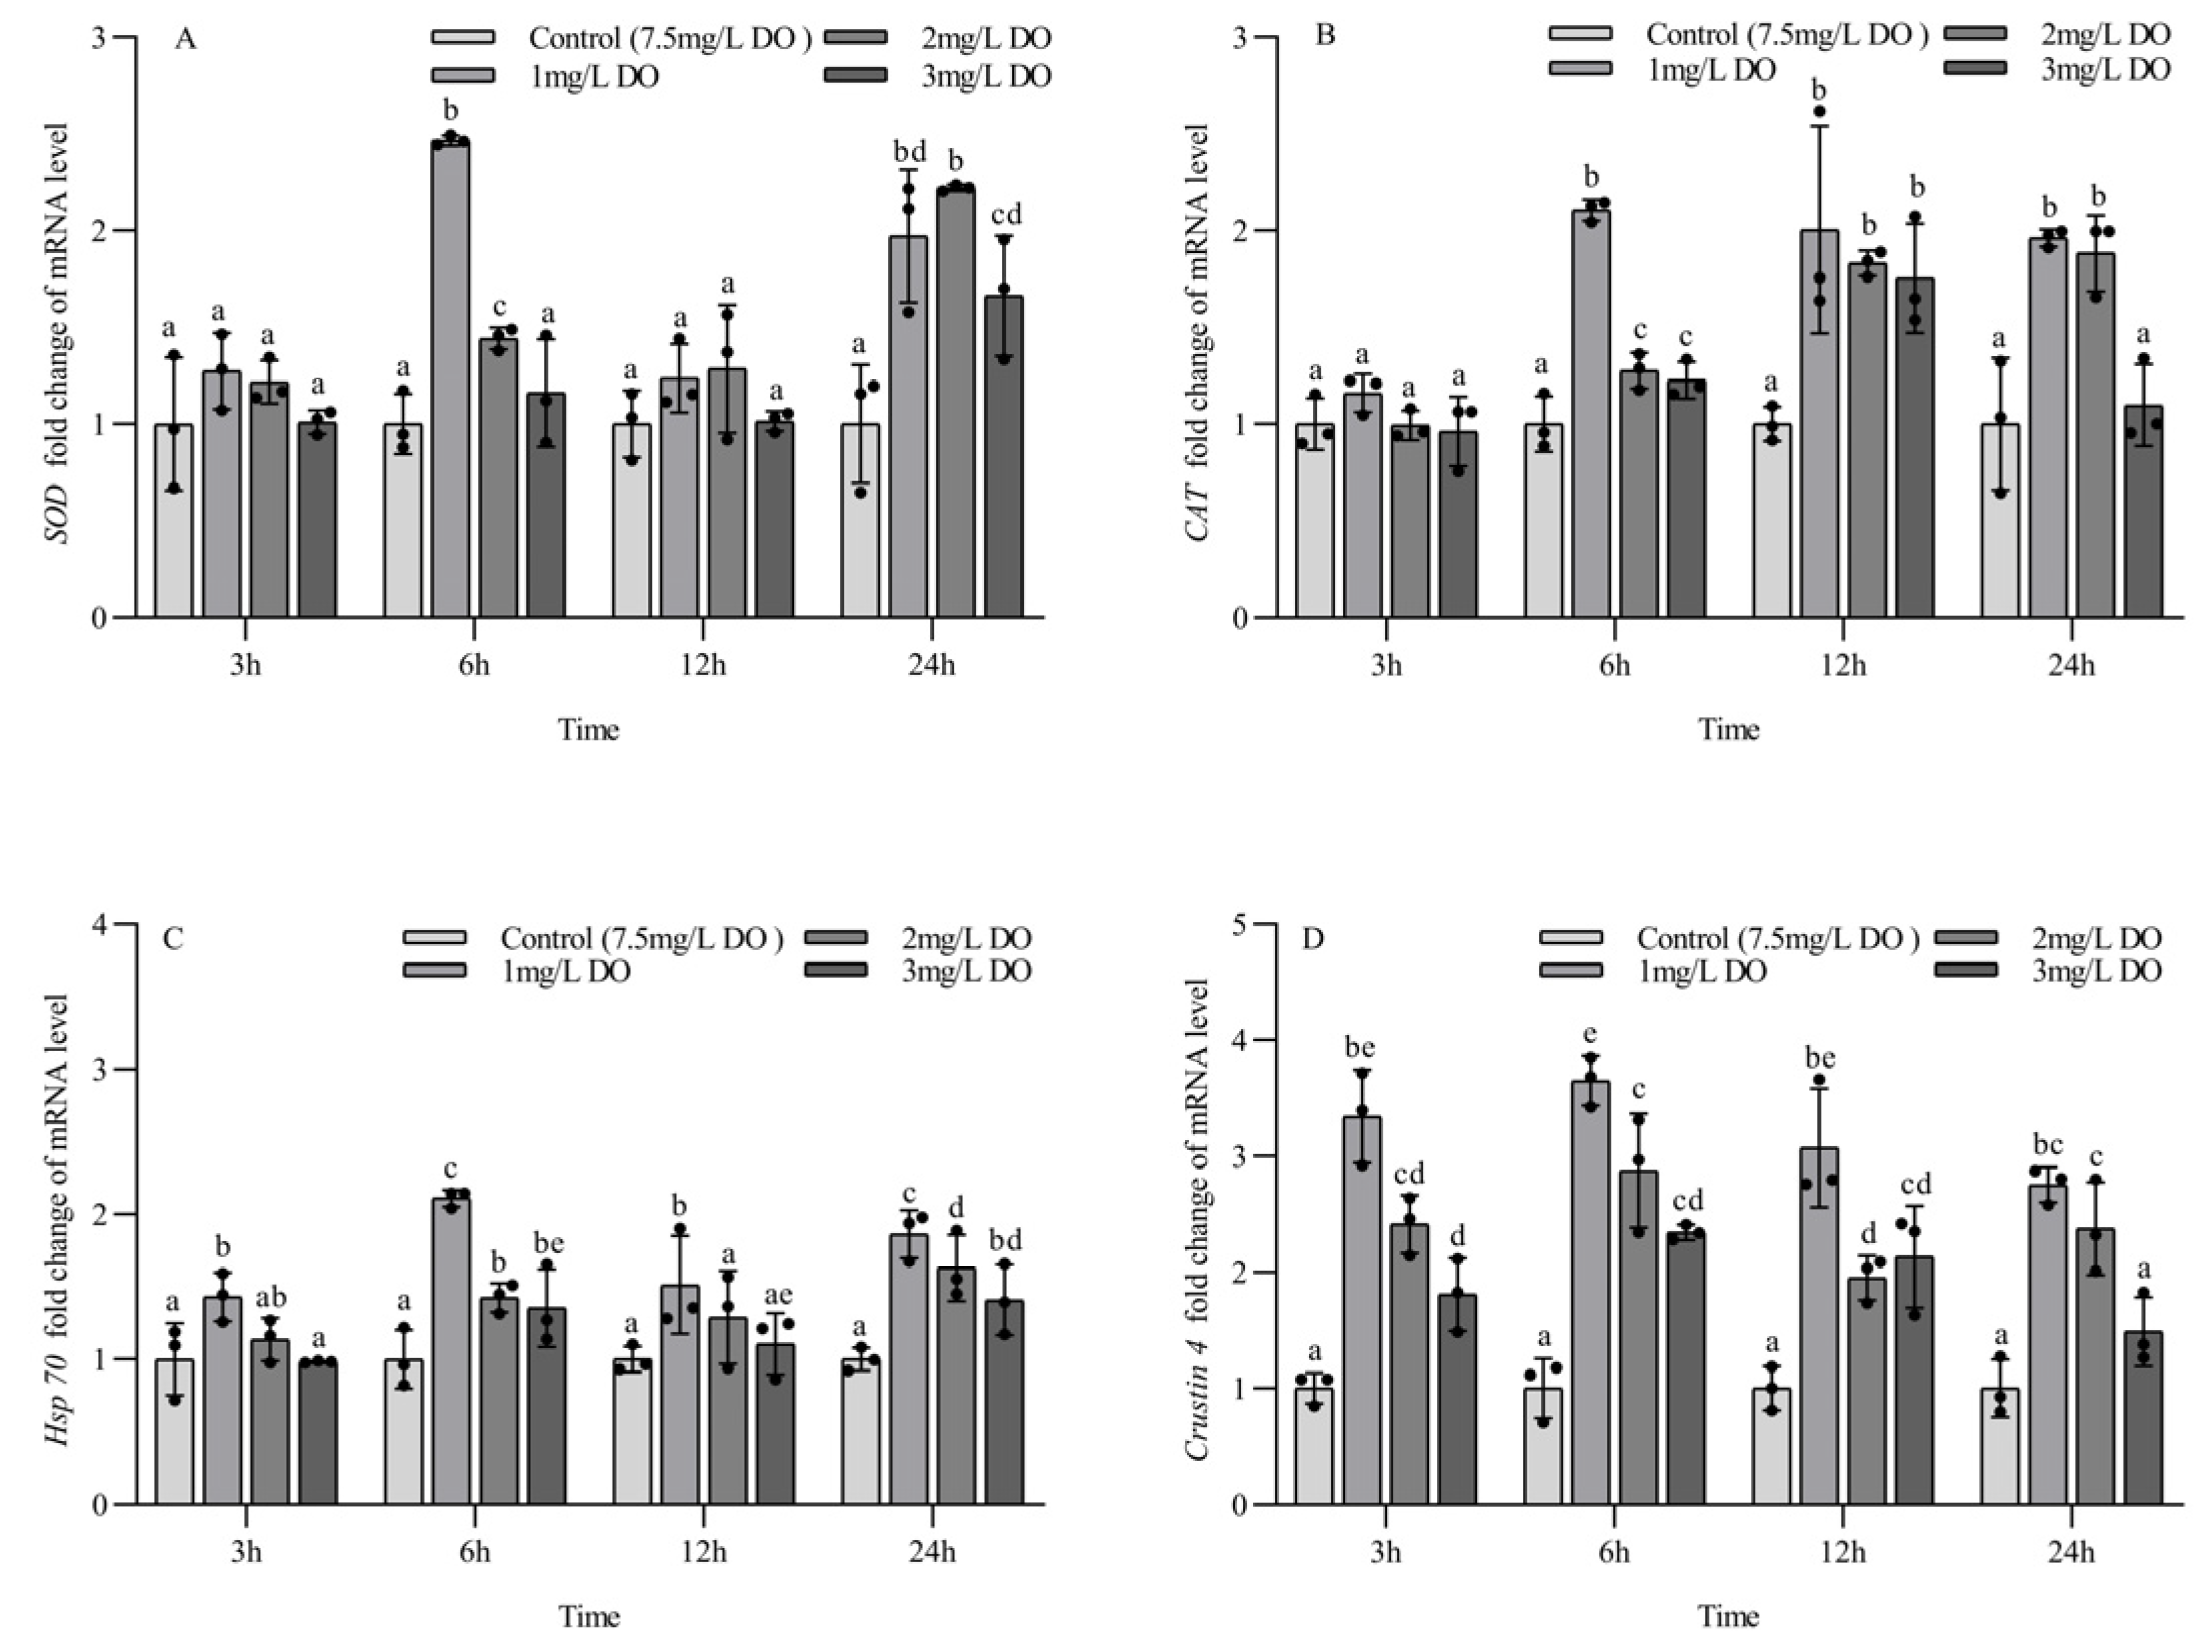
Changes in antioxidant and stress genes in juvenile Procambarus clarkii under different dissolved oxygen levels and different sampling times. Superoxide dismutase mRNA (A), Catalase mRNA (B), Heat shock protein 70 mRNA (C), Crustin 4 mRNA (D). There were three repeat groups for each dissolved oxygen level, replicate groups of 12 shrimp, with water temperatures of 24.0 °C, and each point showed the average of the gene expression levels of the three shrimp under the current conditions. In the figure, there were no significant differences in gene expression between the treatment groups with the same letters, but there were significant differences between the treatment groups with different letters (p < 0.05).
Figure 4.
Changes in antioxidant and stress genes in juvenile Procambarus clarkii under different dissolved oxygen levels and different sampling times. Superoxide dismutase mRNA (A), Catalase mRNA (B), Heat shock protein 70 mRNA (C), Crustin 4 mRNA (D). There were three repeat groups for each dissolved oxygen level, replicate groups of 12 shrimp, with water temperatures of 24.0 °C, and each point showed the average of the gene expression levels of the three shrimp under the current conditions. In the figure, there were no significant differences in gene expression between the treatment groups with the same letters, but there were significant differences between the treatment groups with different letters (p < 0.05).
Figure 5.
Changes in antioxidant and stress genes in subadult Procambarus clarkii under different dissolved oxygen levels and different sampling times. Superoxide dismutase mRNA (A), Catalase mRNA (B), Heat shock protein 70 mRNA (C), Crustin 4 mRNA (D). There were three repeat groups for each dissolved oxygen level, replicate groups of 12 shrimp, with water temperatures of 24.0 °C, and each point showed the average of the gene expression levels of the three shrimp under the current conditions. In the figure, there were no significant differences in gene expression between the treatment groups with the same letters, but there were significant differences between the treatment groups with different letters (p < 0.05).
Table 1.
Reference sources for qPCR primers.
Table 1.
Reference sources for qPCR primers.
| Gene | Sequence(5′-3′) | GenBank Accession No. |
|---|
| 18S-F | GTCAGGTCATCACCATCGGCA | HQ-414542.1 |
| 18S-R | CGGTCTCGTGAACACCAGCA |
| SOD-F | CGCCGATGTAAGACTGGGACG | TRINITY-DN63424-c1-g1 |
| SOD-R | CTCCAGGTAAACACGGCTTCCAT |
| CAT-F | TCCTGTGAACTGTCCCTATCGTG | TRINITY-DN27834-c0-g1 |
| CAT-R | AACCCAGTCTTCTTACAATCAACG |
| Crustin-F | CTCTGACTGCCAGGTGTTT | NW-020872843.1 |
| Crustin-R | TGCGAGCTGTGATGGTTAG |
| Hsp70-F | GTTGACCAAGATGAAGGAGAC | DQ-301506.1 |
| Hsp70-R | CTGACGCTGAGAGTCGTTG |
Table 2.
Two-way ANOVA for oxygen consumption rate and asphyxiation point of juvenile and subadult Procambarus clarkii at five temperature (20, 22, 24, 26, 28 °C) levels.
Table 2.
Two-way ANOVA for oxygen consumption rate and asphyxiation point of juvenile and subadult Procambarus clarkii at five temperature (20, 22, 24, 26, 28 °C) levels.
| Variable of Treatment | F Value | df | p Value |
|---|
| | Oxygen consumption rate | | |
| Temperature | 13.26 | 4 | <0.001 |
| Size | 656.42 | 1 | <0.001 |
| Temperature × Size | 5.17 | 4 | 0.005 |
| | Asphyxiation point | | |
| Temperature | 11.93 | 4 | <0.001 |
| Size | 260.70 | 1 | <0.001 |
| Temperature × Size | 2.71 | 4 | 0.059 |
Table 3.
Two-way ANOVA for the SOD, CAT, LD, and LDH of juvenile Procambarus clarkii among four dissolved oxygen treatments (1, 2, 3, 7.5 mg/L) at four sampling times (3, 6, 12, 24 h).
Table 3.
Two-way ANOVA for the SOD, CAT, LD, and LDH of juvenile Procambarus clarkii among four dissolved oxygen treatments (1, 2, 3, 7.5 mg/L) at four sampling times (3, 6, 12, 24 h).
| Variable of Treatment | F Value | df | p Value |
|---|
| | SOD | | |
| Dissolved oxygen | 36.62 | 3 | <0.001 |
| Sampling time | 28.13 | 3 | <0.001 |
| Dissolved oxygen × Sampling time | 7.61 | 9 | <0.001 |
| | CAT | | |
| Dissolved oxygen | 43.53 | 3 | <0.001 |
| Sampling time | 1.85 | 3 | 0.157 |
| Dissolved oxygen × Sampling time | 6.54 | 9 | <0.001 |
| | LD | | |
| Dissolved oxygen | 27.41 | 3 | <0.001 |
| Sampling time | 139.05 | 3 | <0.001 |
| Dissolved oxygen × Sampling time | 12.52 | 9 | <0.001 |
| | LDH | | |
| Dissolved oxygen | 88.67 | 3 | <0.001 |
| Sampling time | 36.69 | 3 | <0.001 |
| Dissolved oxygen × Sampling time | 12.78 | 9 | <0.001 |
Table 4.
Two-way ANOVA for the SOD, CAT, LD, and LDH of subadult Procambarus clarkii among four dissolved oxygen treatments (1, 2, 3, 7.5 mg/L) at four sampling times (3, 6, 12, 24 h).
Table 4.
Two-way ANOVA for the SOD, CAT, LD, and LDH of subadult Procambarus clarkii among four dissolved oxygen treatments (1, 2, 3, 7.5 mg/L) at four sampling times (3, 6, 12, 24 h).
| Variable of Treatment | F Value | df | p Value |
|---|
| | SOD | | |
| Dissolved oxygen | 24.08 | 3 | <0.001 |
| Sampling time | 6.30 | 3 | 0.002 |
| Dissolved oxygen × Sampling time | 10.19 | 9 | <0.001 |
| | CAT | | |
| Dissolved oxygen | 109.87 | 3 | <0.001 |
| Sampling time | 13.51 | 3 | <0.001 |
| Dissolved oxygen × Sampling time | 15.15 | 9 | <0.001 |
| | LD | | |
| Dissolved oxygen | 55.17 | 3 | <0.001 |
| Sampling time | 7.46 | 3 | 0.001 |
| Dissolved oxygen × Sampling time | 8.49 | 9 | <0.001 |
| | LDH | | |
| Dissolved oxygen | 109.85 | 3 | <0.001 |
| Sampling time | 12.91 | 3 | <0.001 |
| Dissolved oxygen × Sampling time | 10.41 | 9 | <0.001 |
Table 5.
Two-way ANOVA for the SOD mRNA, CAT mRNA, Hsp70 mRNA, and crustin 4 mRNA of juvenile Procambarus clarkii among four dissolved oxygen treatments (1, 2, 3, 7.5 mg/L) at four sampling times (3, 6, 12, 24 h).
Table 5.
Two-way ANOVA for the SOD mRNA, CAT mRNA, Hsp70 mRNA, and crustin 4 mRNA of juvenile Procambarus clarkii among four dissolved oxygen treatments (1, 2, 3, 7.5 mg/L) at four sampling times (3, 6, 12, 24 h).
| Variable of Treatment | F Value | df | p Value |
|---|
| | SOD mRNA | | |
| Dissolved oxygen | 10.08 | 3 | <0.001 |
| Sampling time | 3.75 | 3 | 0.020 |
| Dissolved oxygen × Sampling time | 4.35 | 9 | 0.001 |
| | CAT mRNA | | |
| Dissolved oxygen | 30.10 | 3 | <0.001 |
| Sampling time | 2.63 | 3 | 0.066 |
| Dissolved oxygen × Sampling time | 0.47 | 9 | 0.883 |
| | Hsp70 mRNA | | |
| Dissolved oxygen | 46.64 | 3 | <0.001 |
| Sampling time | 7.70 | 3 | 0.001 |
| Dissolved oxygen × Sampling time | 7.13 | 9 | <0.001 |
| | Crustin 4 mRNA | | |
| Dissolved oxygen | 130.75 | 3 | <0.001 |
| Sampling time | 8.33 | 3 | <0.001 |
| Dissolved oxygen × Sampling time | 8.17 | 9 | <0.001 |
Table 6.
Two-way ANOVA for the SOD mRNA, CAT mRNA, Hsp70 mRNA, and crustin 4 mRNA of subadult Procambarus clarkii among four dissolved oxygen treatments (1, 2, 3, 7.5 mg/L) at four sampling times (3, 6, 12, 24 h).
Table 6.
Two-way ANOVA for the SOD mRNA, CAT mRNA, Hsp70 mRNA, and crustin 4 mRNA of subadult Procambarus clarkii among four dissolved oxygen treatments (1, 2, 3, 7.5 mg/L) at four sampling times (3, 6, 12, 24 h).
| Variable of Treatment | F Value | df | p Value |
|---|
| | SOD Mrna | | |
| Dissolved oxygen | 27.30 | 3 | <0.001 |
| Sampling time | 21.46 | 3 | <0.001 |
| Dissolved oxygen × Sampling time | 6.70 | 9 | <0.001 |
| | CAT Mrna | | |
| Dissolved oxygen | 33.05 | 3 | <0.001 |
| Sampling time | 19.24 | 3 | <0.001 |
| Dissolved oxygen × Sampling time | 5.20 | 9 | <0.001 |
| | Hsp70 Mrna | | |
| Dissolved oxygen | 27.74 | 3 | <0.001 |
| Sampling time | 8.73 | 3 | <0.001 |
| Dissolved oxygen × Sampling time | 1.61 | 9 | 0.154 |
| | Crustin 4 Mrna | | |
| Dissolved oxygen | 78.54 | 3 | <0.001 |
| Sampling time | 5.32 | 3 | 0.004 |
| Dissolved oxygen × Sampling time | 1.53 | 9 | 0.178 |


