Simple Summary
Humans exhibit varied responses to natural disasters, including pandemics. Some increase their health behavior, while others decrease it. These differences are studied within the framework of the life history theory, where reactions to environmental challenges depend on age, sex, and socioeconomic status. We investigated diet, physical activity, and BMI in a Swiss population during and after the COVID-19 pandemic. We found no changes in health behaviors or BMI at this time. However, we found constant sex differences in several outcomes. While physical activity was associated with a lower BMI in both sexes, women showed an increase in BMI with increasing age, while men showed a lower BMI with a healthier diet and if living in cities. As our study population consisted of mostly highly educated persons, our results could indicate that better-educated persons might be more resilient to environmental challenges. Furthermore, our results might inform sex-specific efforts to prevent becoming overweight at the population level.
Abstract
Humans adapt their life history strategy and lifestyle behavior to the environment. The social restrictions during the COVID-19 pandemic in the years 2020–2021 led to changes in diet and physical activity habits in large parts of populations worldwide. Additionally, many people reported an increase in body weight during the pandemic. We investigated how diet quality, physical activity, and BMI changed since the end of the COVID-19 restrictions in Switzerland (2019–2023). We assessed diet and physical activity using a standardized questionnaire. We measured anthropometry and BMI using a stadiometer and a balance of a medical bioimpedance analyzer. Our results show a stable BMI in men and women during the pandemic. In both sexes, diet quality and physical activity levels did not change significantly during this time. Among women, physical activity and age were associated with BMI, while in men, apart from physical activity, high diet quality and living in the agglomeration were associated with BMI. Overall, we did not find evidence for a transient “unhealthier” lifestyle immediately after the COVID-19 pandemic. However, we found constituent sex differences in BMI determinants. Our results could indicate a higher resilience in highly educated persons and might contribute to more personalized approaches to prevent obesity.
1. Introduction
The life history theory is a concept that is widely applied in biology. In this concept, risk-taking behaviors are linked with life history traits such as age at first reproduction or birth intervals in many species in predictable ways. Within this framework, “fast” and “slow” life history strategies were defined, where “fast” strategies tend to favor immediate rewards over later advantages, an earlier reproduction, and less attention to the own health. The “slow” strategy defines the opposite [1]. Several studies showed health behavioral adaptations to challenging environments in humans, such as climate change [2].
A line of evidence within this concept focuses on the development of life history strategies during childhood and adolescence, linking life history theory with the developmental origins of adult health [3,4]. In fact, the literature reviews on this topic indicated that children and adolescents growing up in an unpredictable (but not in a stable harsh) environment show a negative impact on life history phenotype developments [5,6]. However, the existence of general life history strategies in humans is still disputed, as it seems that there is little theoretical or empirical evidence in adults that links human behavioral traits with specific life history strategies [7].
The COVID-19 pandemic, with its lockdowns and social restrictions, can be seen as a global increase in environmental uncertainty, potentially leading to negative health implications. In fact, the beginning of the COVID-19 pandemic was characterized by lockdowns and restrictions on everyday life for many populations worldwide. These restrictions had a major impact on people’s behavior and health [8]. The worldwide literature suggested an increase in BMI in children [9,10] and adults [11,12] during the pandemic, aggravating important risk factors for obesity-related diseases [13,14,15].
Furthermore, it was shown that the COVID-19 pandemic led to a shift in human decision-making, favoring a preference for immediate gains over future benefits. For instance, an experiment comparing a group of people strongly affected by COVID-19 to a group less affected showed that participants in the risk group tended to ask for more money in order to accept a 30-day waiting period to receive an award than the control group [16].
Reports from Europe and Switzerland show differentiated outcomes in different subgroups of the population, with some people increasing healthy lifestyles such as diet and physical activity and others increasing unhealthy behaviors. It seems that factors such as age, sex, urbanization, and socioeconomic position modulated the impact of the COVID-19 restrictions on health outcomes [17,18,19,20,21]. This phenomenon can be discussed within the life history theory where an unpredictable environment should lead to an “unhealthier” lifestyle, especially in socioeconomically underprivileged people [22,23].
A better understanding of these behavioral changes and the underlying factors is essential to better understand the overall rules of human reaction norms, especially as a consequence of local or global disasters. Such knowledge can lead to an increase in populations’ resilience to such events and to more efficient preventive strategies to mitigate negative health outcomes. The present study aims to investigate factors influencing diet, physical activity, and BMI during and after the end of the COVID-19 restrictions in Switzerland in an ongoing cohort study. Our results shall contribute to the development of more personalized and better risk-group targeted overweight preventive strategies, especially if following major environmental challenges.
2. Materials and Methods
2.1. Study Design and Participants
The data presented in this paper derive from an ongoing cohort study that started in 2019 at the Institute of Evolutionary Medicine at the University of Zurich, in collaboration with ETH Zurich. Participants from the Swiss Food Panel Study 2.0 from the ETH Zurich [24,25] were invited in 2019 to participate in a cohort study, where apart from diet and physical activity, anthropometry (stadiometer, balance, 3D body scanner) and body composition (bioimpedance analysis, BIA) were measured in annual intervals. The inclusion criteria were the adult general population, able to complete a questionnaire in German, both sexes, and all ages over 18 years. The exclusion criteria were pregnancy, implanted electronic devices, and severe consuming diseases, as these conditions alter body composition and electronic devices might be influenced by BIA. In 2020, there were no measurements due to the COVID-19 pandemic. As only part of the 2019 cohort returned after the pandemic (130 out of 240), from 2021 onward, the cohort was expanded by email invitation of people working at the University of Zurich. In the present paper, only participants who started in 2019 and have at least one follow-up measurement 2021–2023 are included. All study participants were informed orally and in writing about the study procedure. Informed consent was obtained from all subjects involved in the study.
2.2. Questionnaire
The study participants completed a questionnaire on their average dietary intake of several food groups during the past year. The questionnaire was designed to allow the calculation of a Diet Quality Index [26], which is based on the Swiss national dietary recommendations [27]. This questionnaire was adapted from a previously published version by ETH [24,26] and was based on the validated food frequency questionnaire of the Nurses’ Health Study [28]. The questionnaire also asked questions about physical activity at work and during leisure time [29], as well as sociodemographic variables such as sex, age, place of residence, and education level.
2.3. Outcomes and Variables
The main outcome body mass index (BMI) was calculated from measured weight and height as kg/m2. The participants’ height was measured with a standard stadiometer (Seca 274). Weight was measured with a balance incorporated in the segmental medical 8-point body composition analyzer (BIA) (Seca mBCA 515, Seca AG, Reinach, Switzerland) [30]. As BMI was not normally distributed, we applied a natural logarithm transformation to the BMI values for statistical analyses.
Using five food categories of the food frequency questionnaire, we calculated a diet quality index [26]: fruits, vegetables, whole grain products, meat, and sweet/salty snacks. Following the official Swiss diet recommendations, we divided all food intake amounts in each food category into two groups, depending if recommendations were met or not. For each participant and each of the five categories, one point was assigned if the diet recommendation was met or zero points if the recommendation was not met. In this way, a score from 0 to 5 could be formed, which correlated with the overall healthiness of the individual diet [26]. For sample size reasons, the score was further summarized into three categories: unhealthy diet quality (0–1 points), medium diet quality (2–3 points), and healthy diet quality (4–5 points).
Physical activity during leisure time was assessed using a published questionnaire and giving examples [29]. Categories included 1. very light (almost no physical activity), 2. light (e.g., walking, slow biking), 3. moderate (e.g., running, biking), 4. heavy (e.g., intensive running, intensive biking), and 5. very heavy (exhaustive activity several times per week). For sample size reasons, data were summarized into three categories: light physical activity (categories 1–2), moderate physical activity (category 3), and heavy physical activity (categories 4–5).
Education was assessed using Swiss educational categories: 1. mandatory education, 2. basic education, 3. professional training, 4. high school, 5. higher professional studies, 6. higher education, and 7. university. For sample size reasons, the data were summarized into primary/secondary education (categories 1–4) and tertiary education (categories 5–7).
Age was calculated from the year of birth for each of the measurement years and categorized into four quartiles, as age was not normally distributed. The place of residence was categorized as 1. urban, 2. suburban, and 3. rural.
2.4. Statistics
Data were analyzed graphically, descriptively, and analytically. We used t-tests to compare continuous variables and chi-squared tests to compare categorical variables between the sexes for the baseline years 2019 and 2021. To assess changes in categorical variables between the study years, we used repeated-measures ANOVA, separated by sex. We used multilevel mixed-effects linear regression models to assess changes in BMI over the measurement years, separately for each sex, and corrected for diet, physical activity, age, education, and place of residence. This model allows us to assess repeated measurements of individuals, considering fixed effects as well as random effects of the study year.
3. Results
Descriptive Results
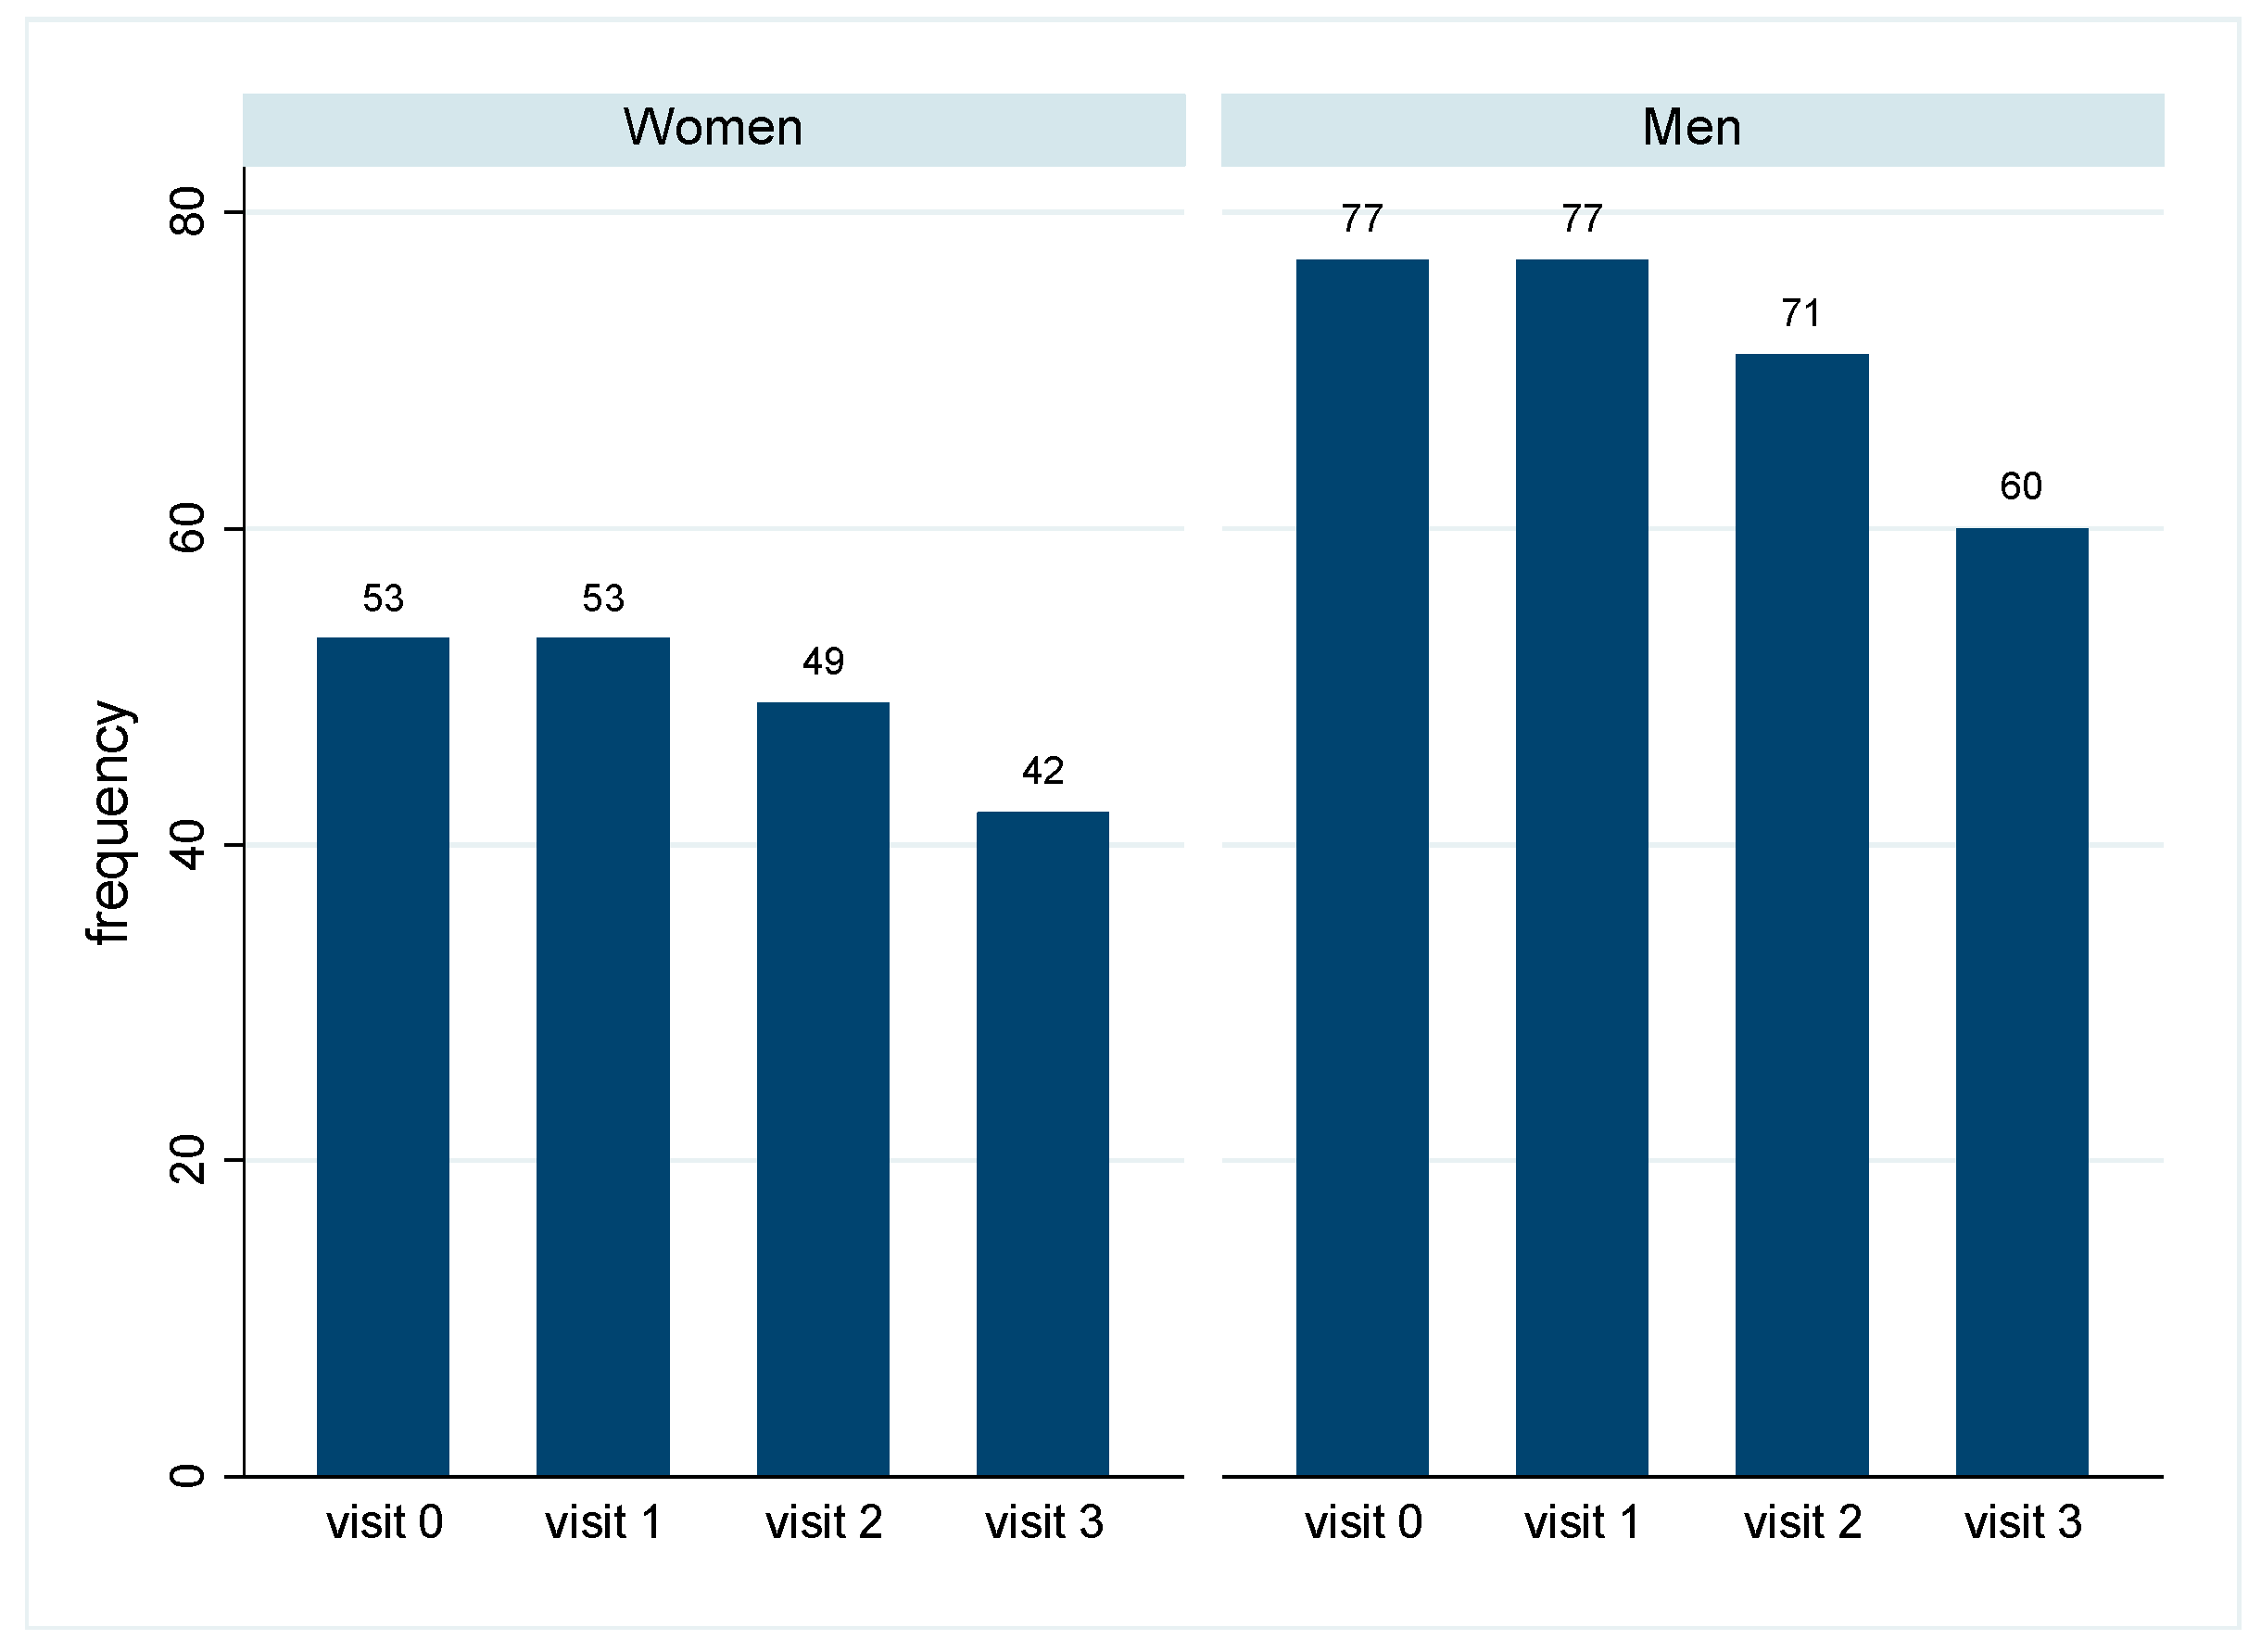
In total, 53 women and 77 men started the cohort study in 2019 and showed at least one follow-up measurement in the post pandemic years 2021–2023. Some participants dropped out over time, and in 2023, 42 women and 66 men were still participating in the study (Figure 1). The reasons for dropping out were known in a few cases only and included explanations such as advanced age, not wanting to travel, not wanting to spend money, or travel abroad.
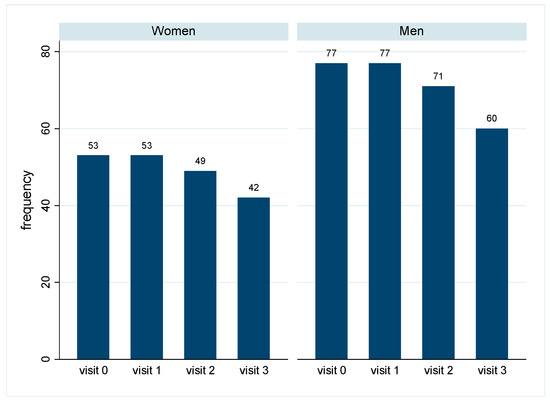
Figure 1.
Number of participating women and men in the years 2019–2023: Number of participants for each study year, separately by sex. Visit 0: 2019 (baseline), visit 1: 2021, visit 2: 2022, visit 3: 2023.
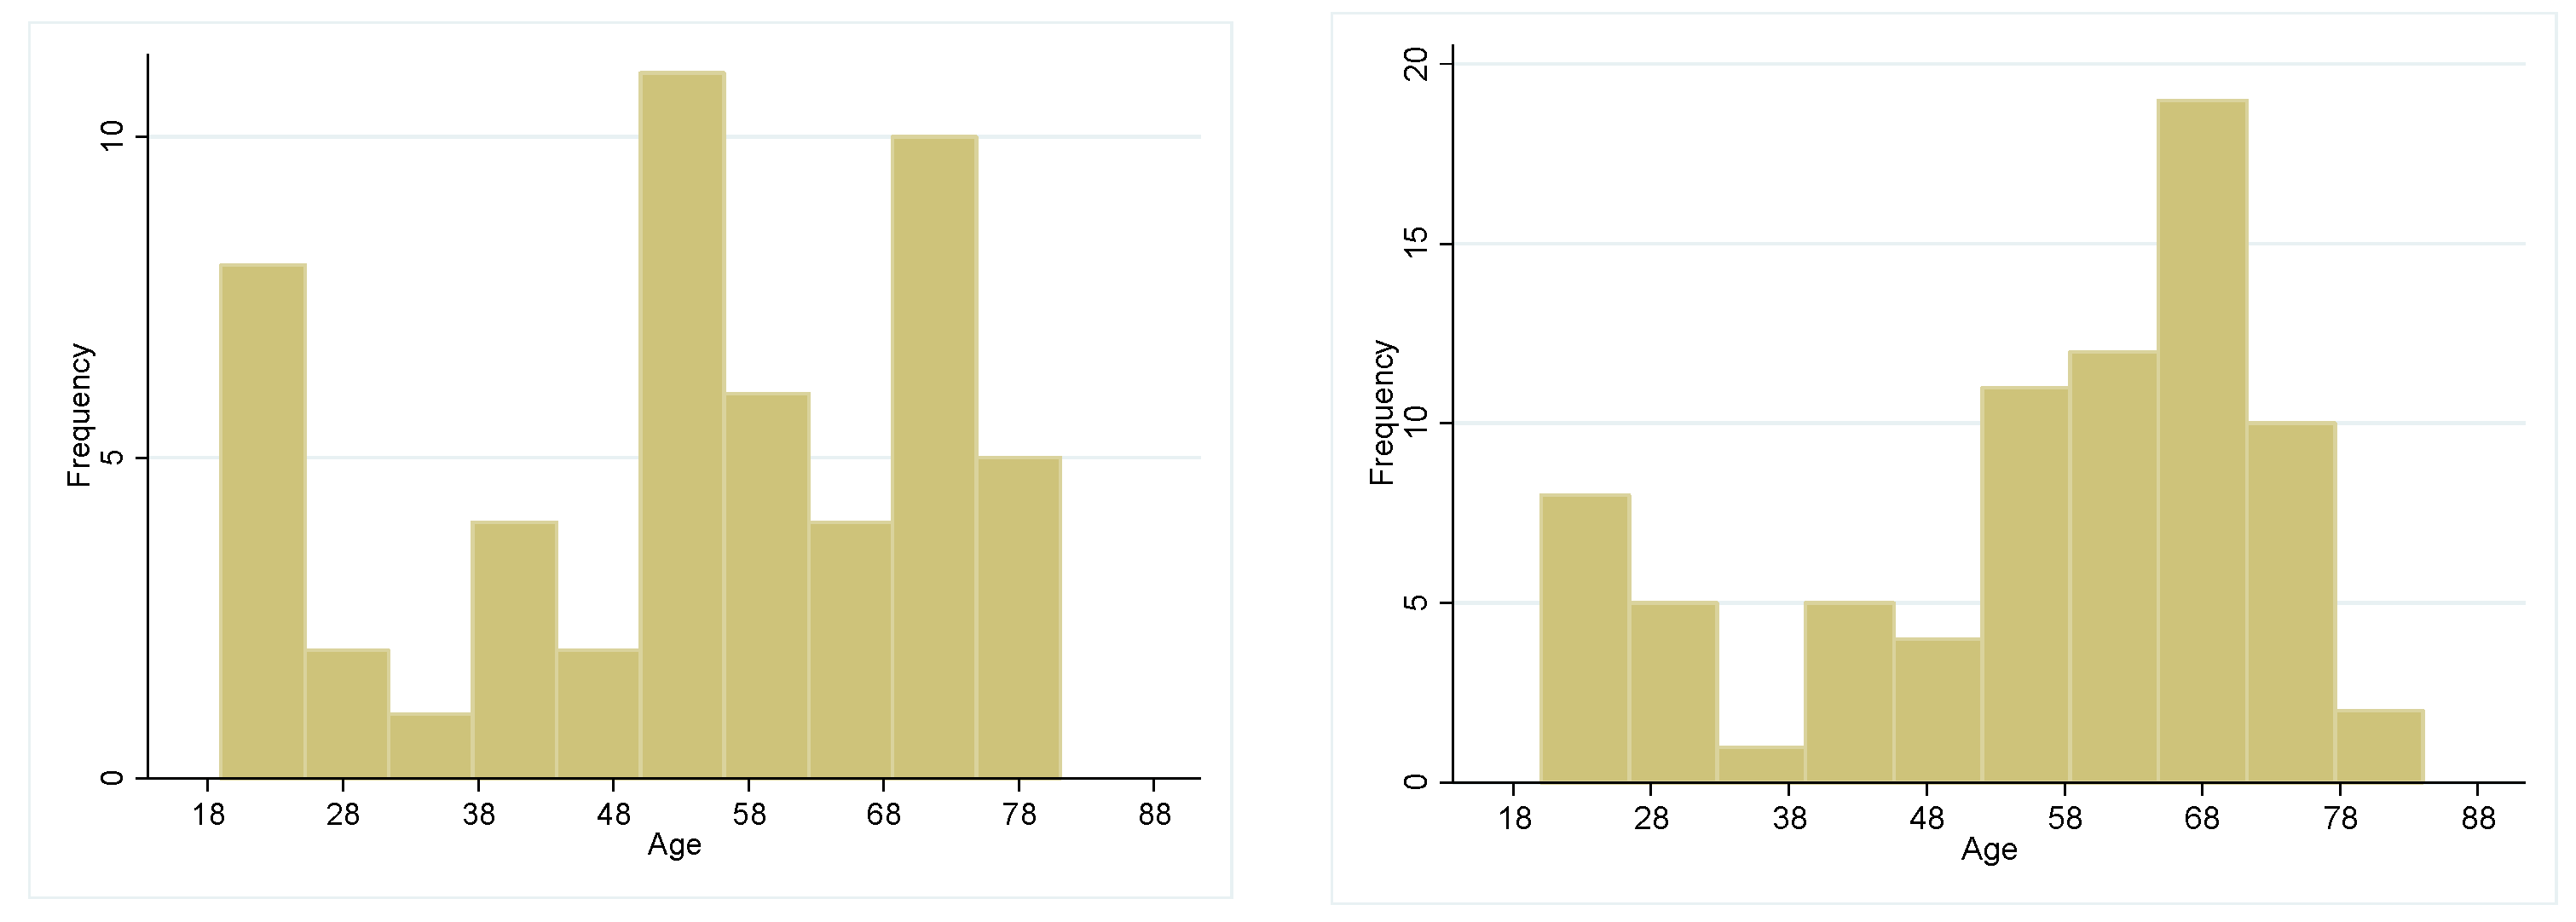
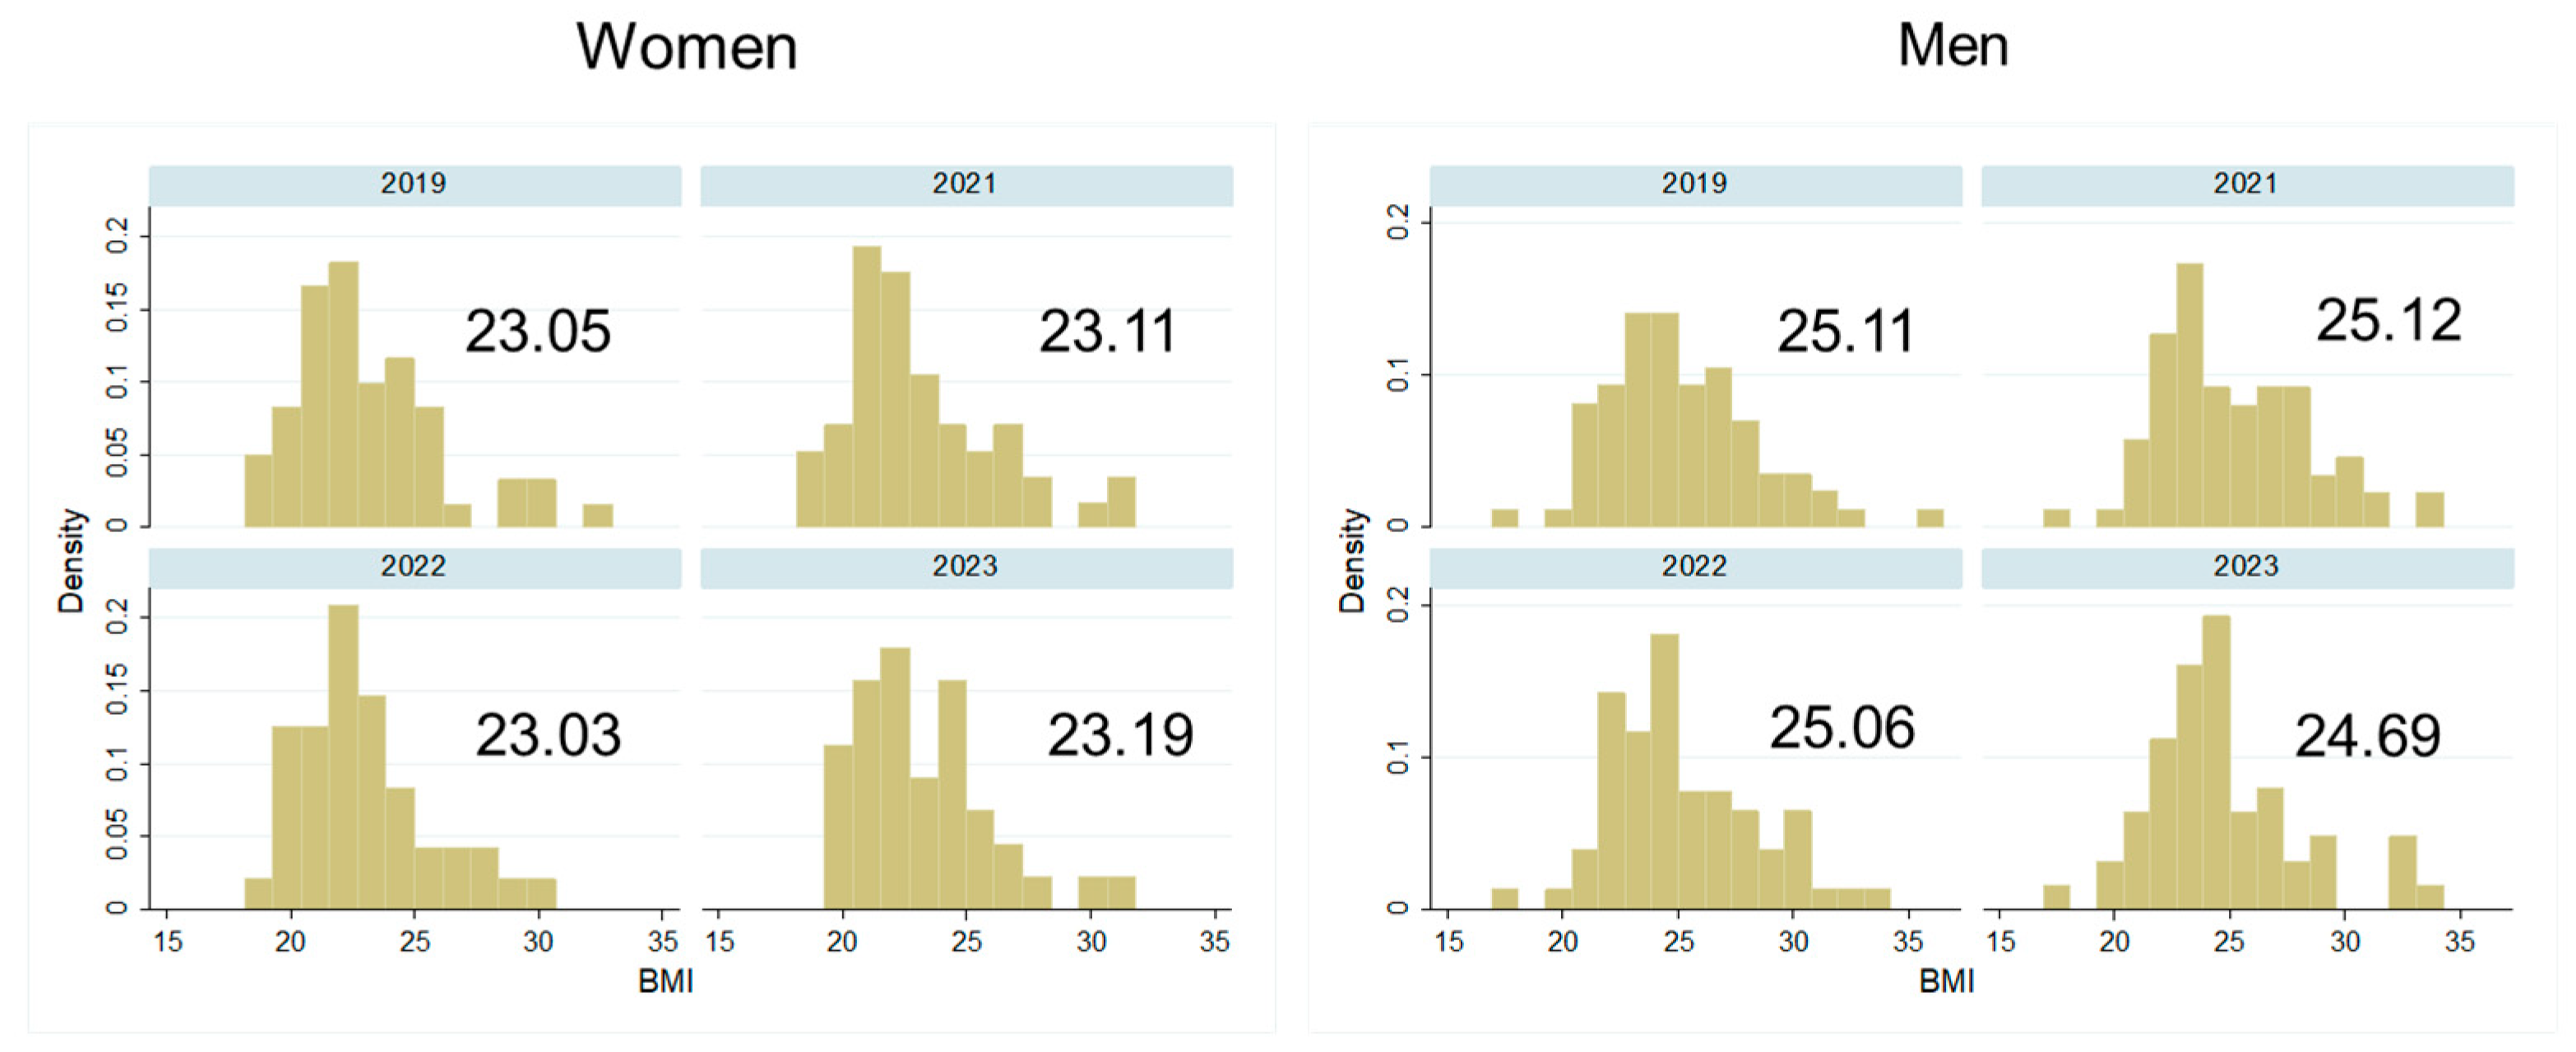
At the baseline in 2019, the mean age in women was 53.43 years (SD 18.5) and in men it was 56.03 years (SD 17.1) (p > 0.05). For age distribution in both sexes, see Figure 2. Women had a lower BMI (mean 23.05, SD 3.05) than men (mean 25.11, SD 3.21) (p < 0.001). Most women reported a medium-quality diet while most men showed a low-quality diet (p < 0.01). This sex difference persisted after the pandemic in 2021 (p < 0.01).
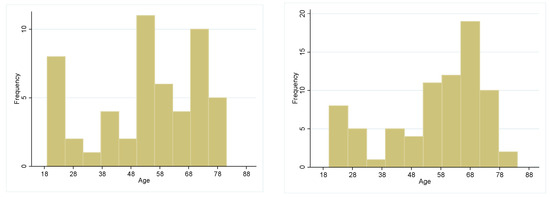
Figure 2.
Age frequencies distribution in men and women at baseline.
Women reported a medium-level physical activity in 2019, while men reported a high-level physical activity (p = 0.001). Again, this sex difference persisted after the pandemic in 2021 (p < 0.01). In both sexes, most participants showed a tertiary education (65.3% in women, 72.4% in men, p < 0.05). While most women lived in agglomerations, most men lived in cities (p > 0.05). For detailed results, see Table 1.

Table 1.
Baseline descriptive data of the study participants in 2019.
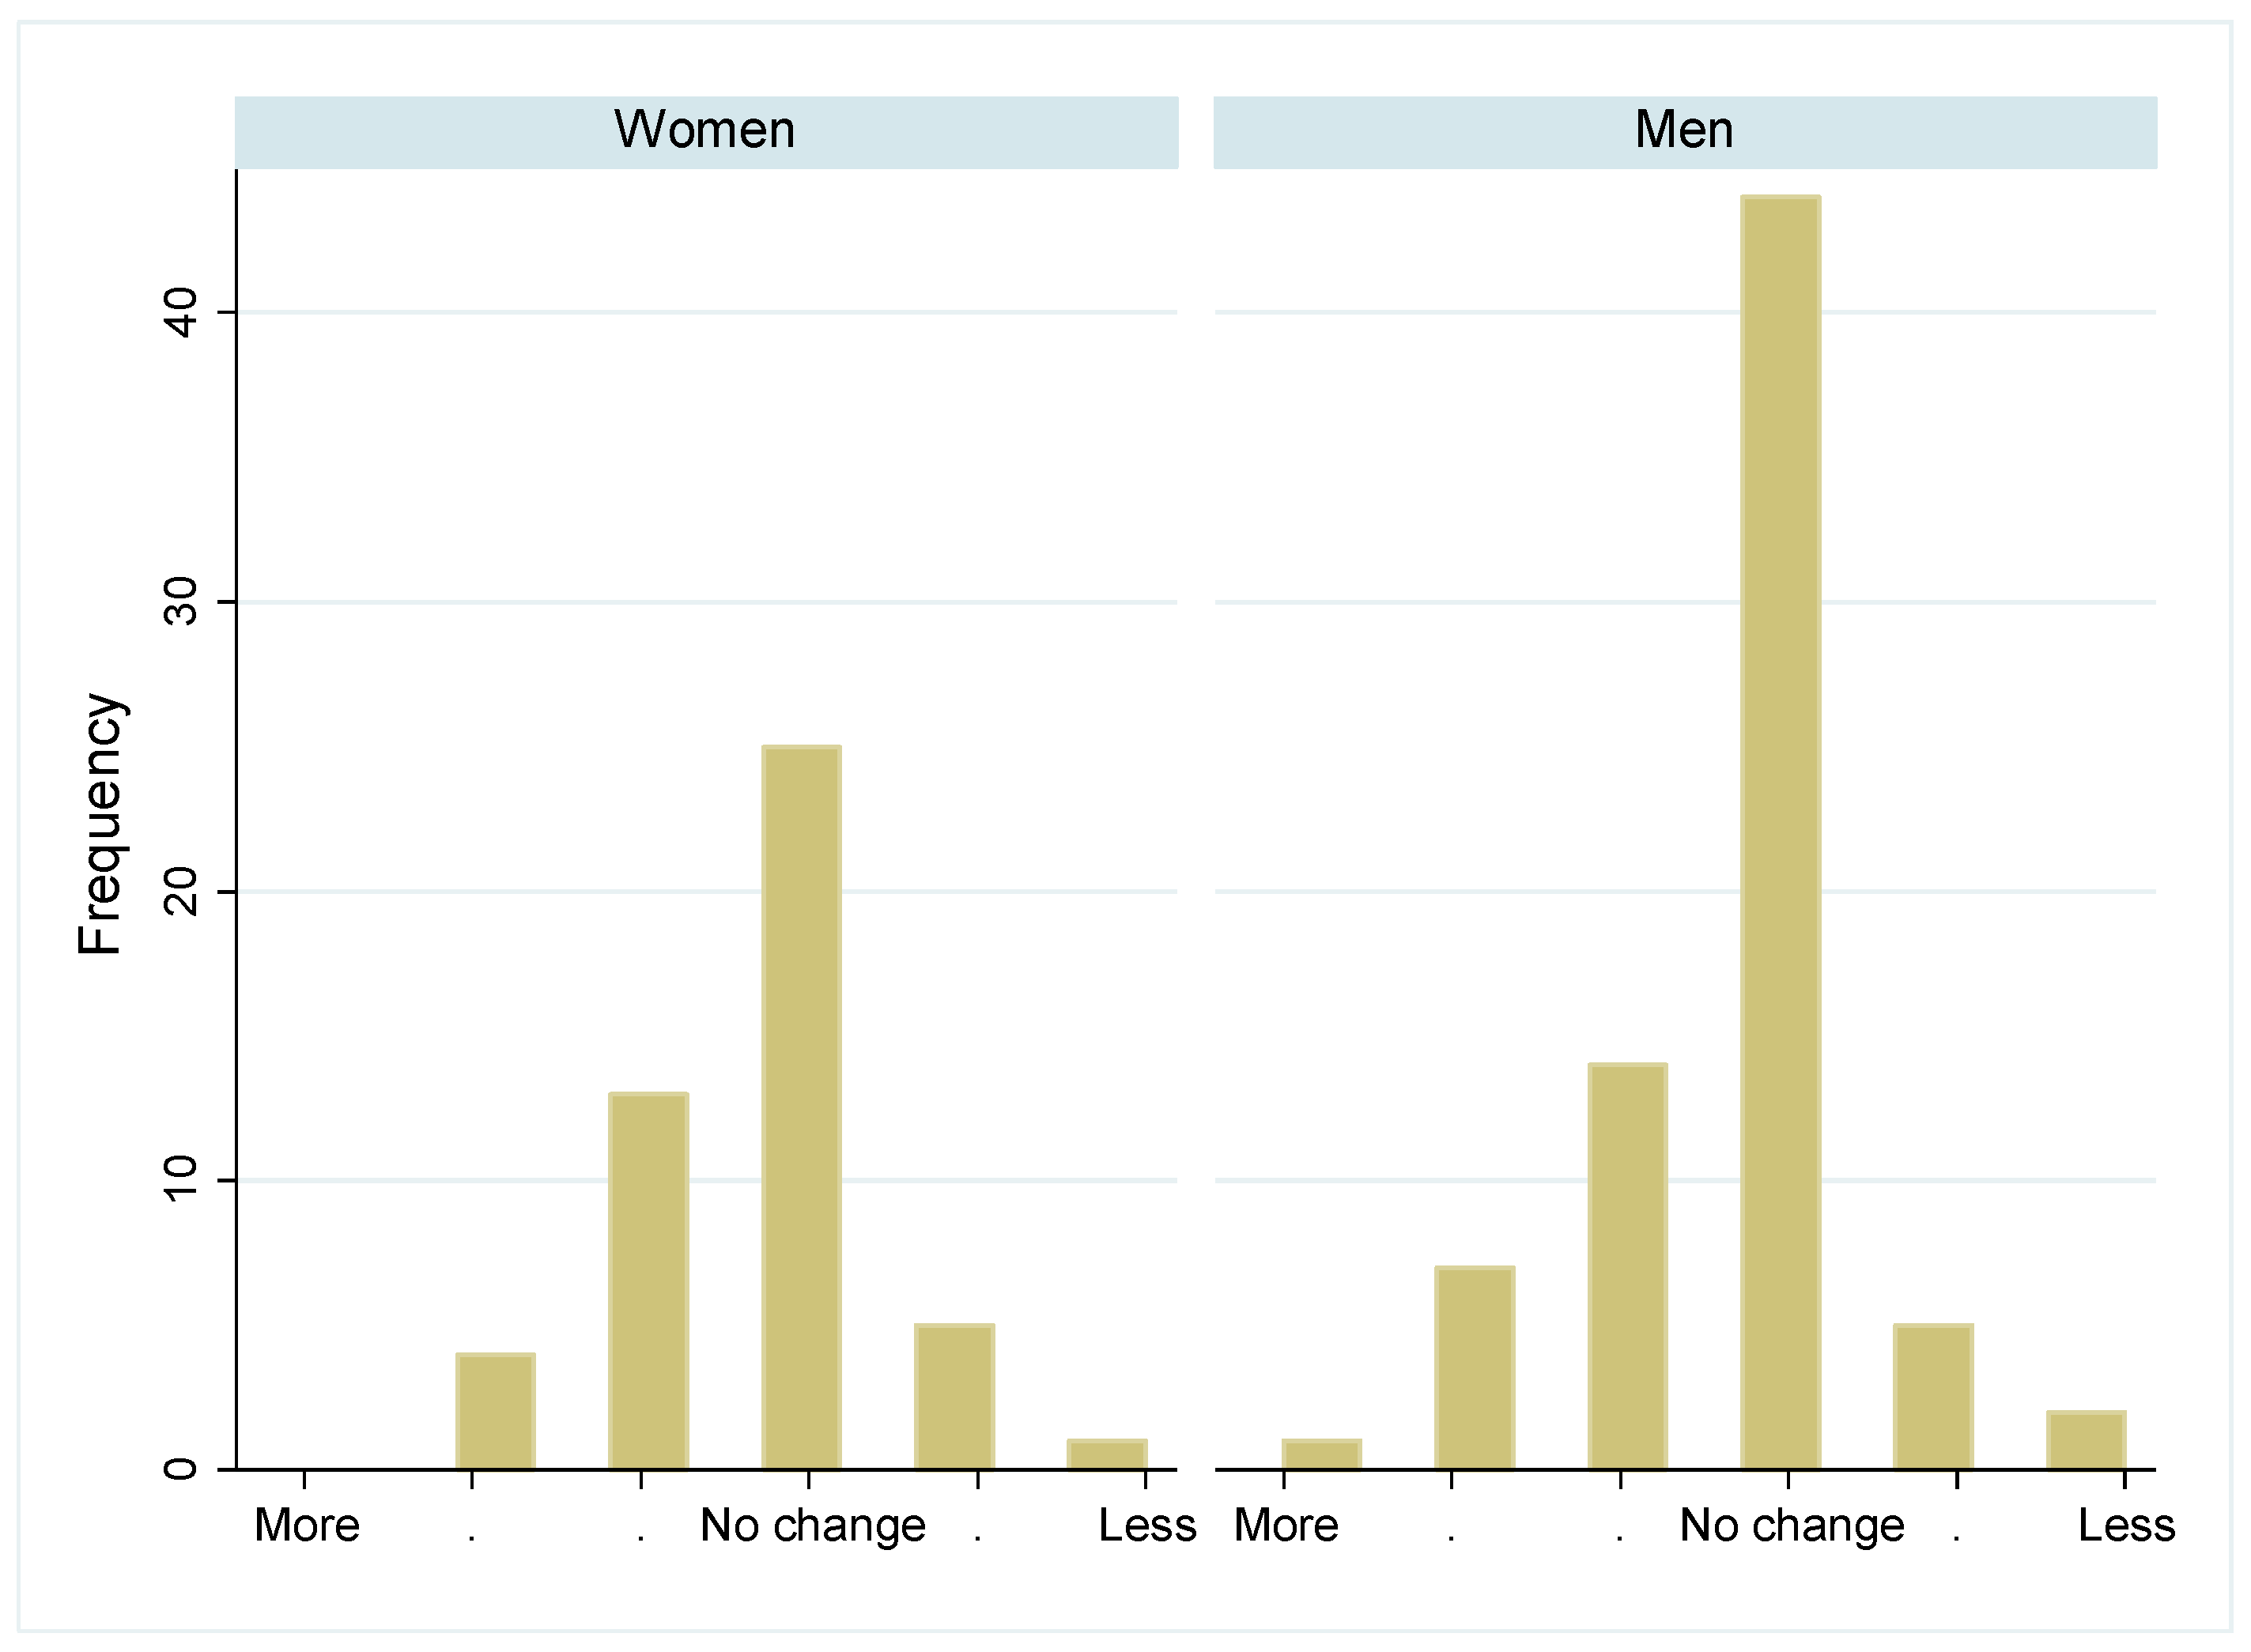
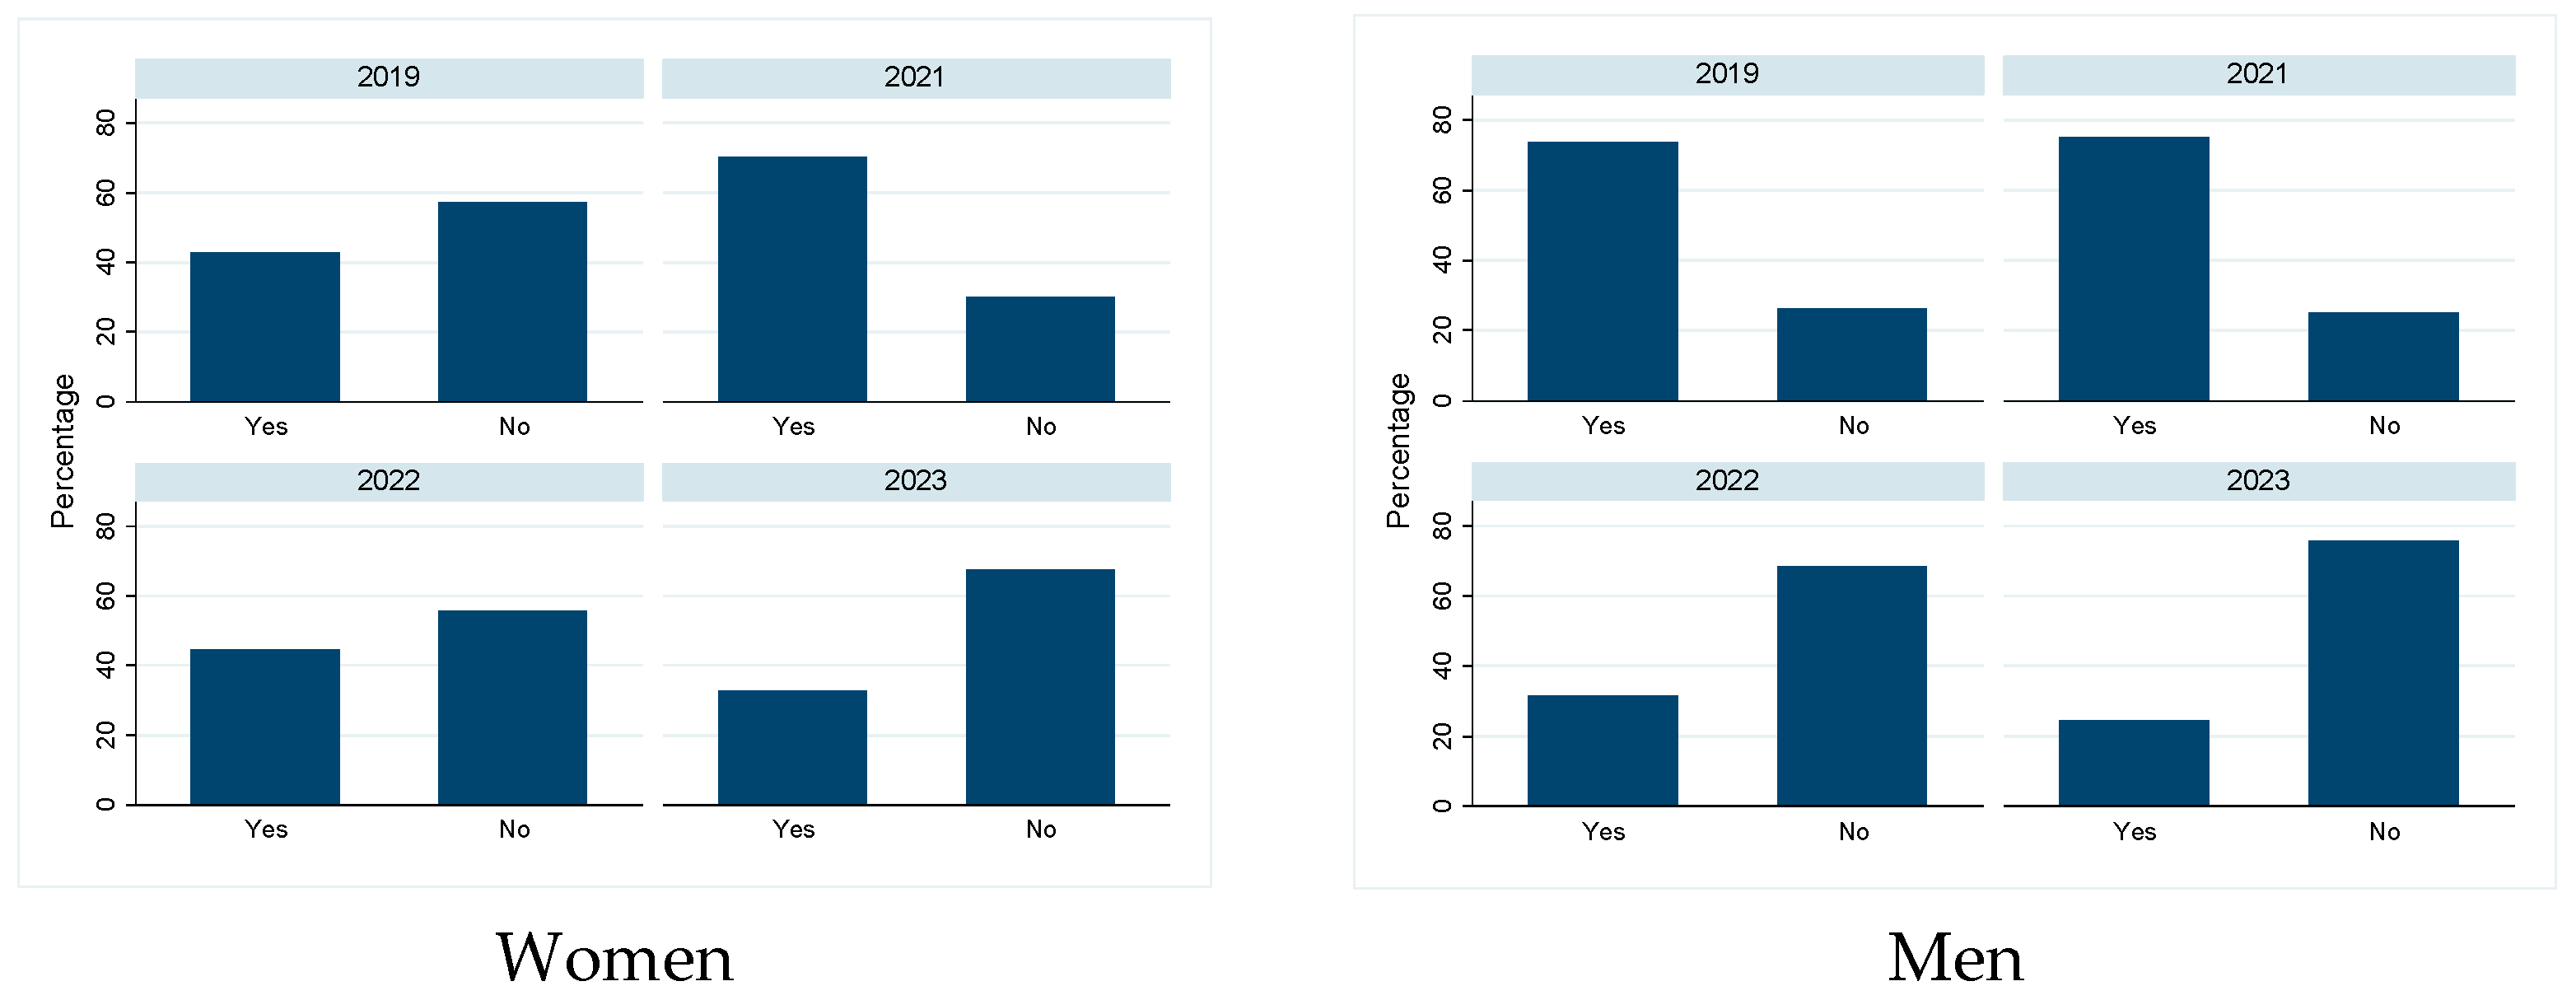
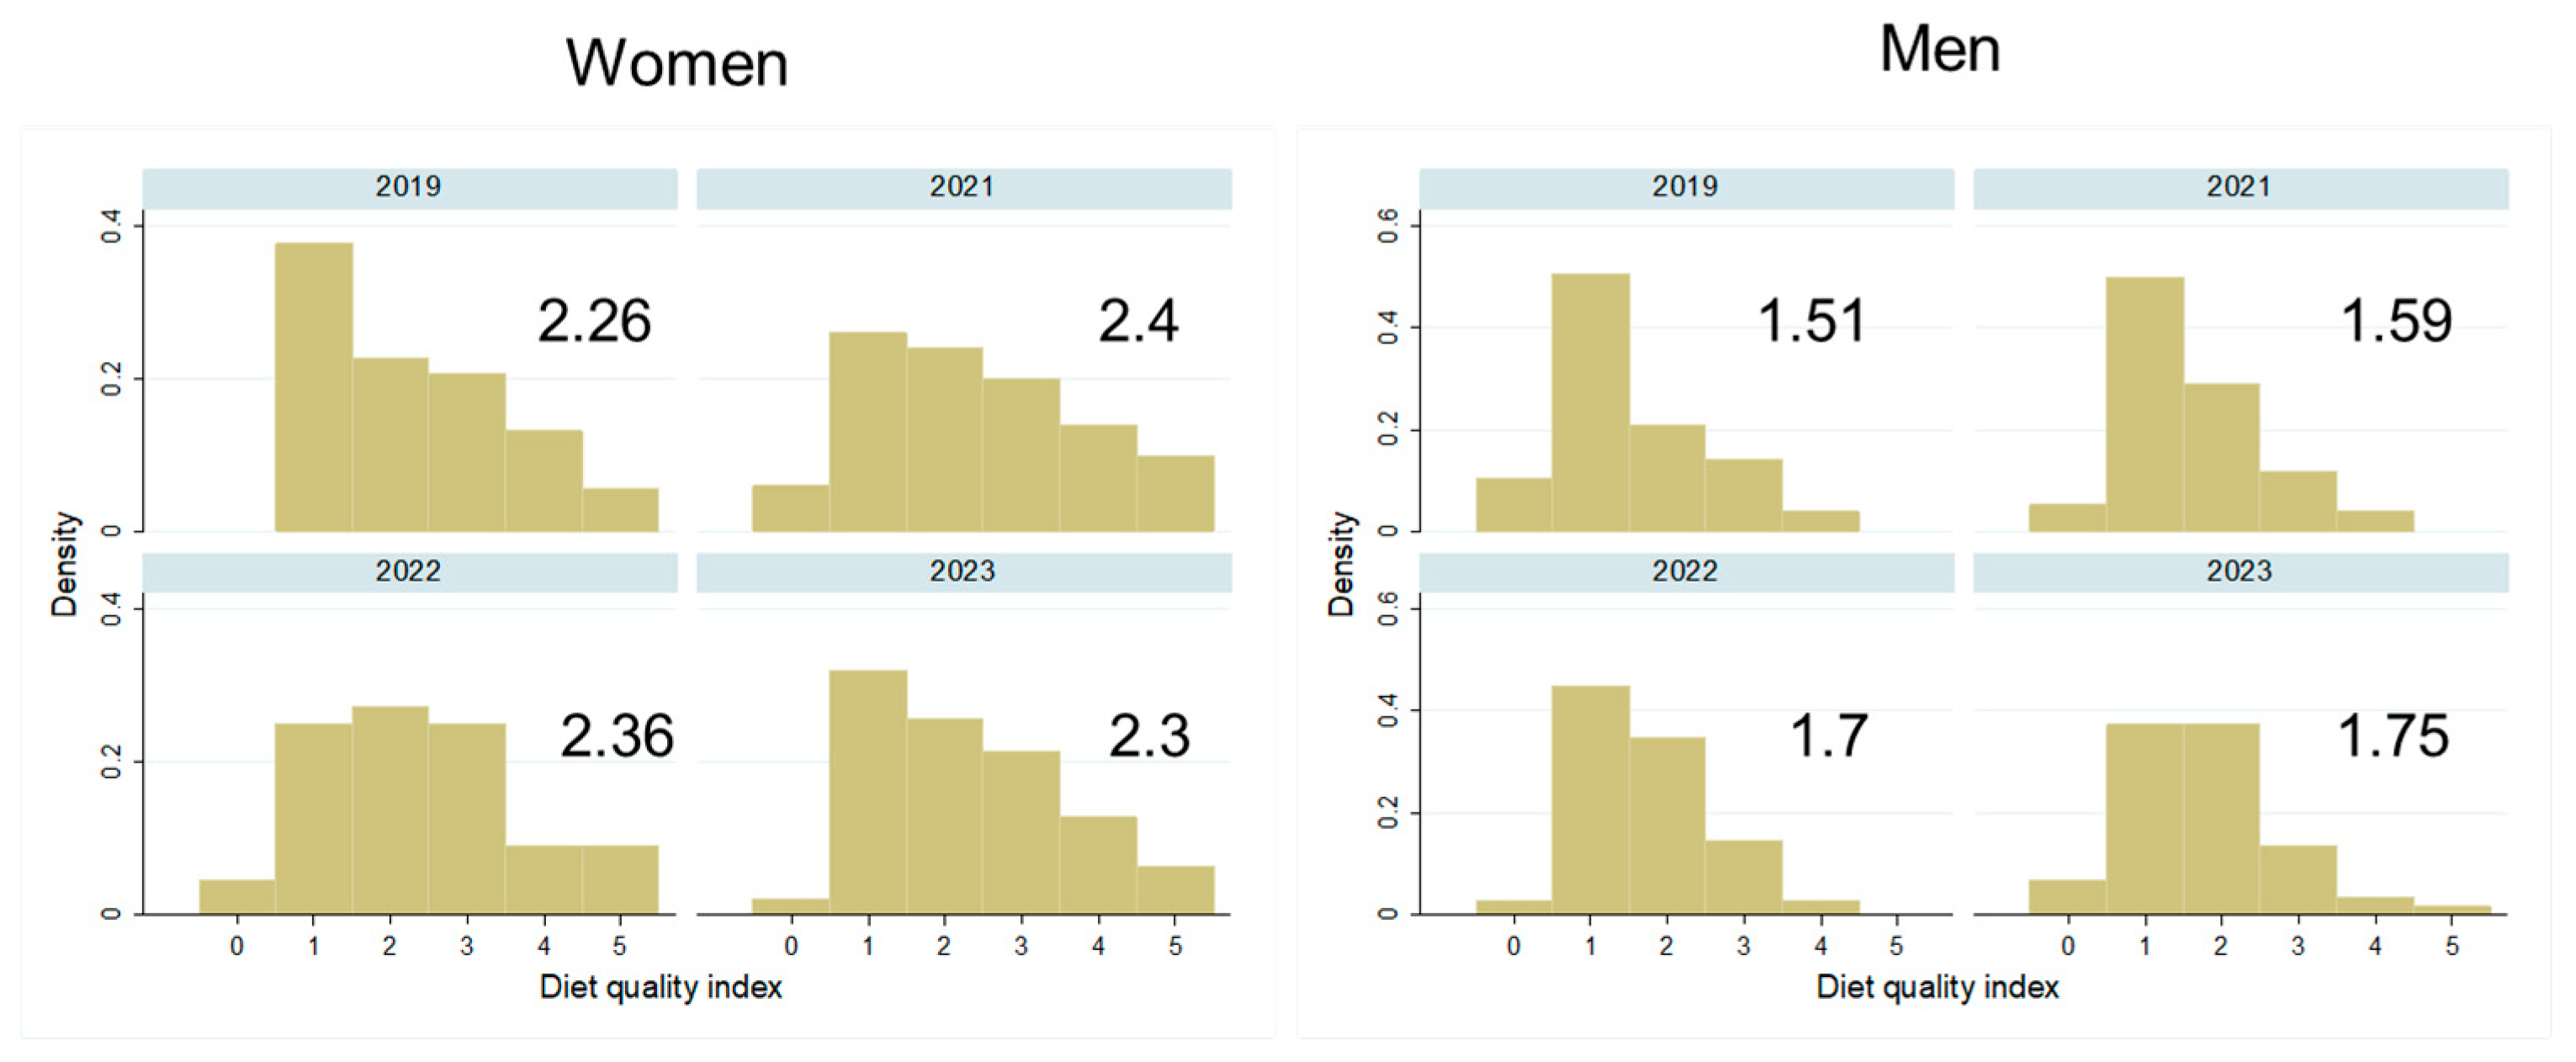
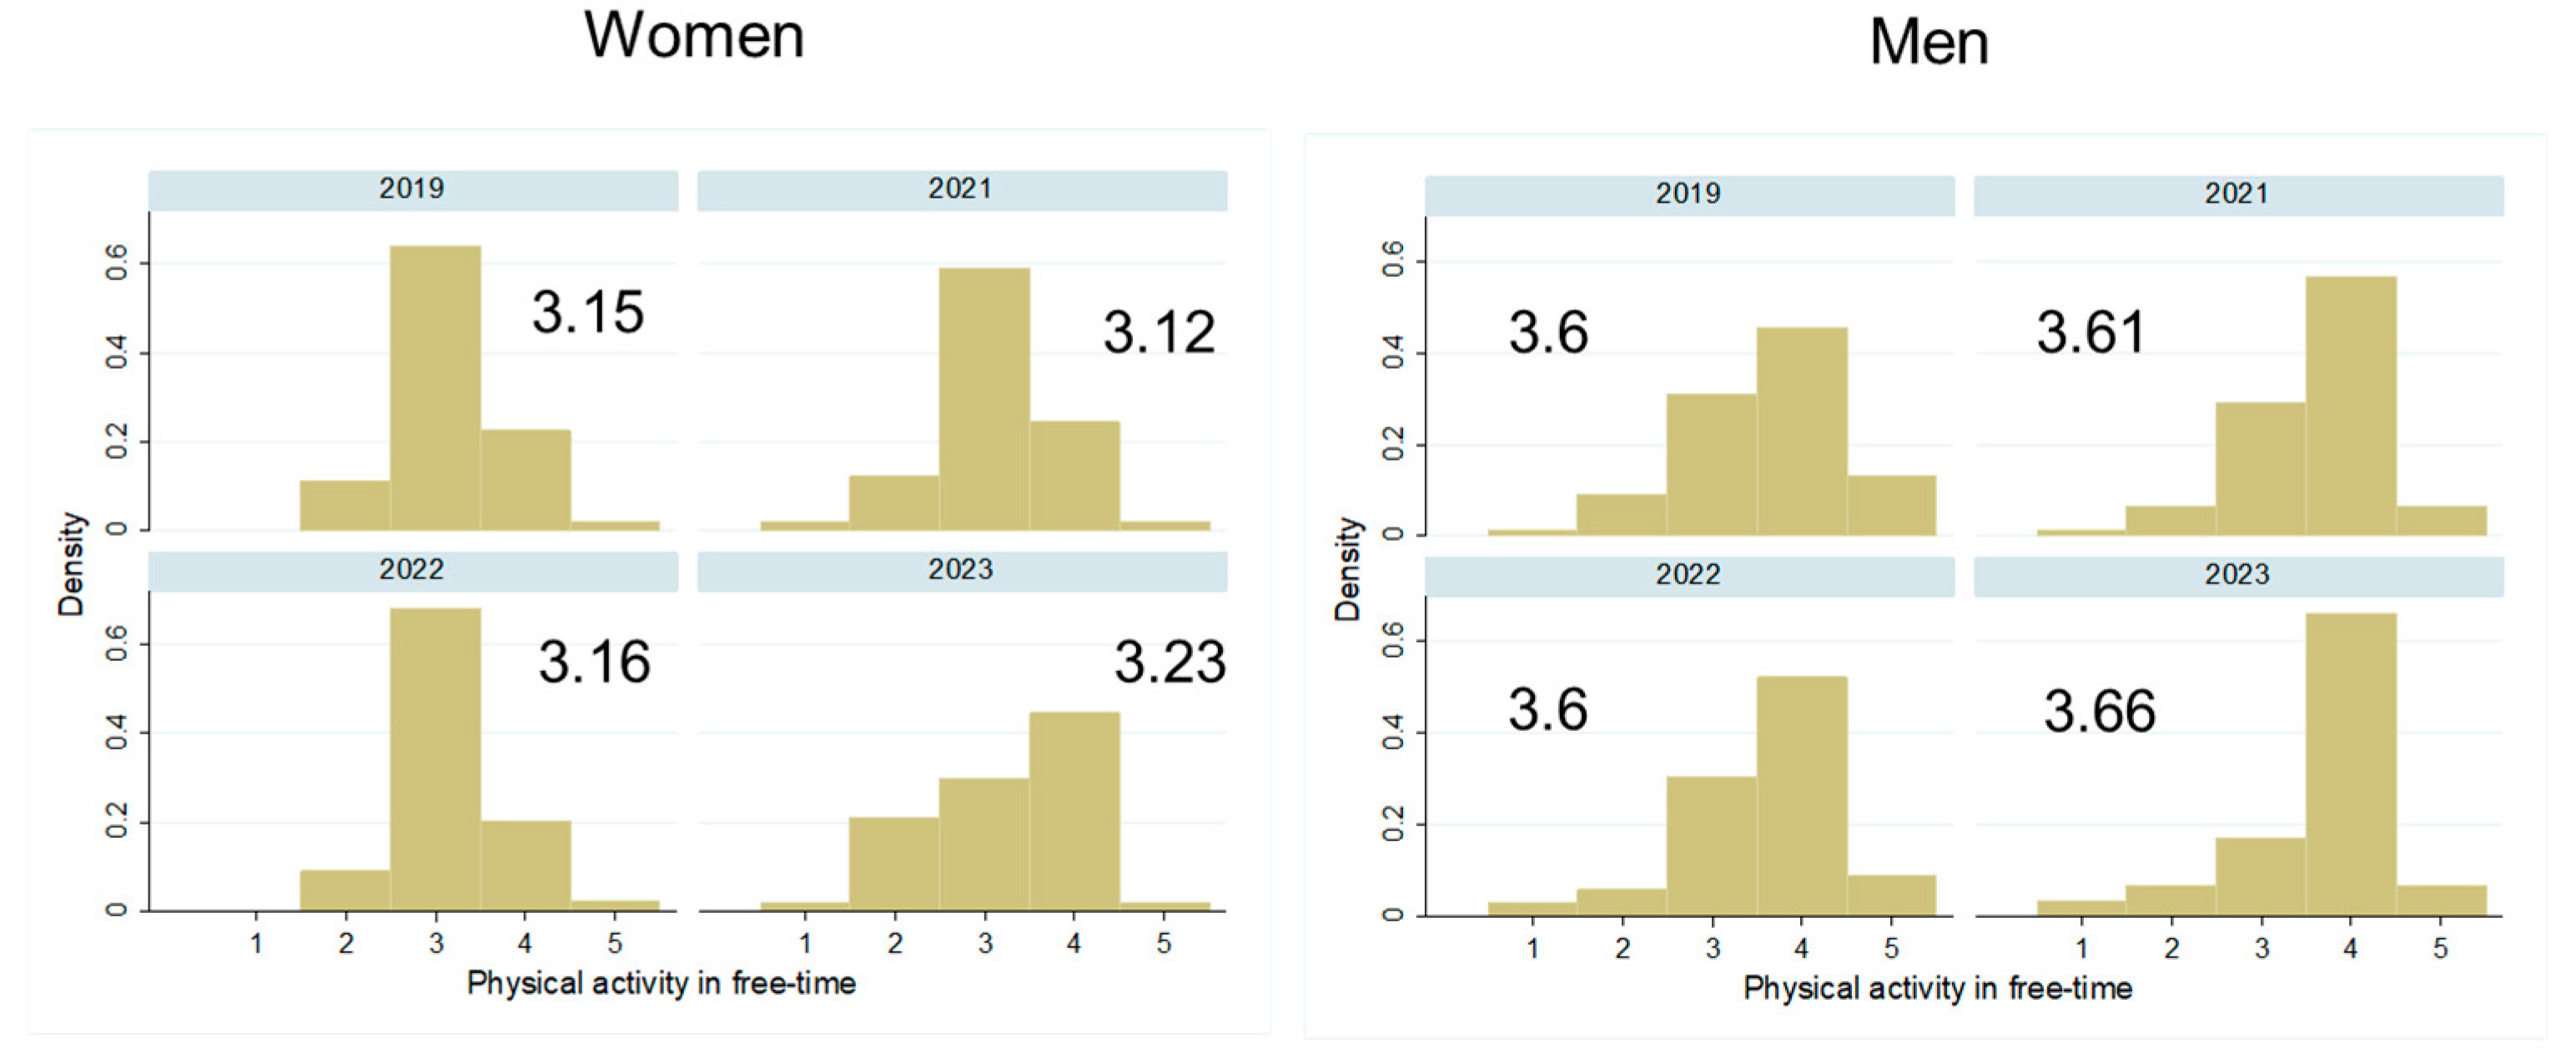
Most participants reported not to have changed the quantity of their food intake during the pandemic, and there was no difference between the sexes in this self-evaluation (Figure 3, p > 0.05). While some more women followed a weight-loss diet shortly after the pandemic (Figure 4 left, p > 0.05), significantly fewer men followed a weight-loss diet since 2022 (Figure 4 right, p < 0.001). Diet quality did not change significantly between 2019 and the post pandemic years, in both sexes (Figure 5, p > 0.05). Similarly, the physical activity level did not change significantly over time in both sexes (Figure 6, p > 0.05).
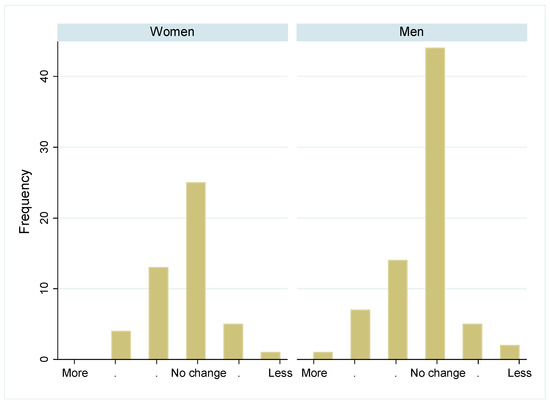
Figure 3.
Change in daily food quantity intake in women and men during the pandemic: Number of participants who changed their daily food quantity intake during the pandemic. Categories include “much more”, “more”, “slightly more”, “no change”, “slightly less”, “less”, and “much less”. Numbers are given separately by sex.
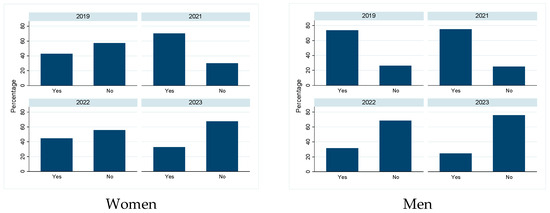
Figure 4.
Percentage of participants following a weight loss diet: Number of persons per study year who followed a weight loss diet (yes) or not (no), separated by sex.
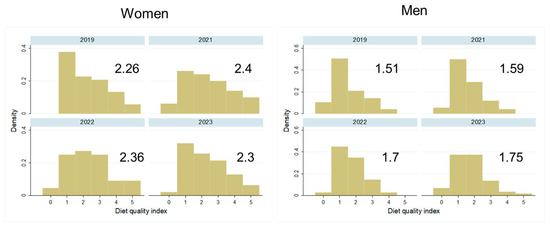
Figure 5.
Distribution and mean diet quality index in women and men over the years 2019–2023: Distribution of participants in the five categories of diet quality, from low to high quality, by study year and separately by sex. The mean value for diet quality is given for each study year.
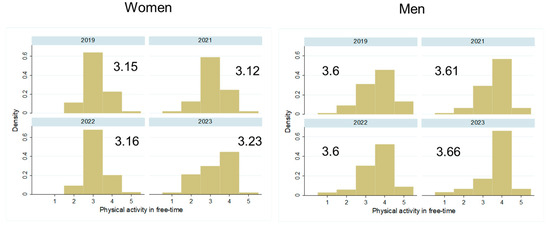
Figure 6.
Distribution and mean physical activity level in women and men over the years 2019–2023: Distribution of participants in the five categories of physical activity, from low to high intensity, by study year and separately by sex. The mean value for physical activity is given for each study year.
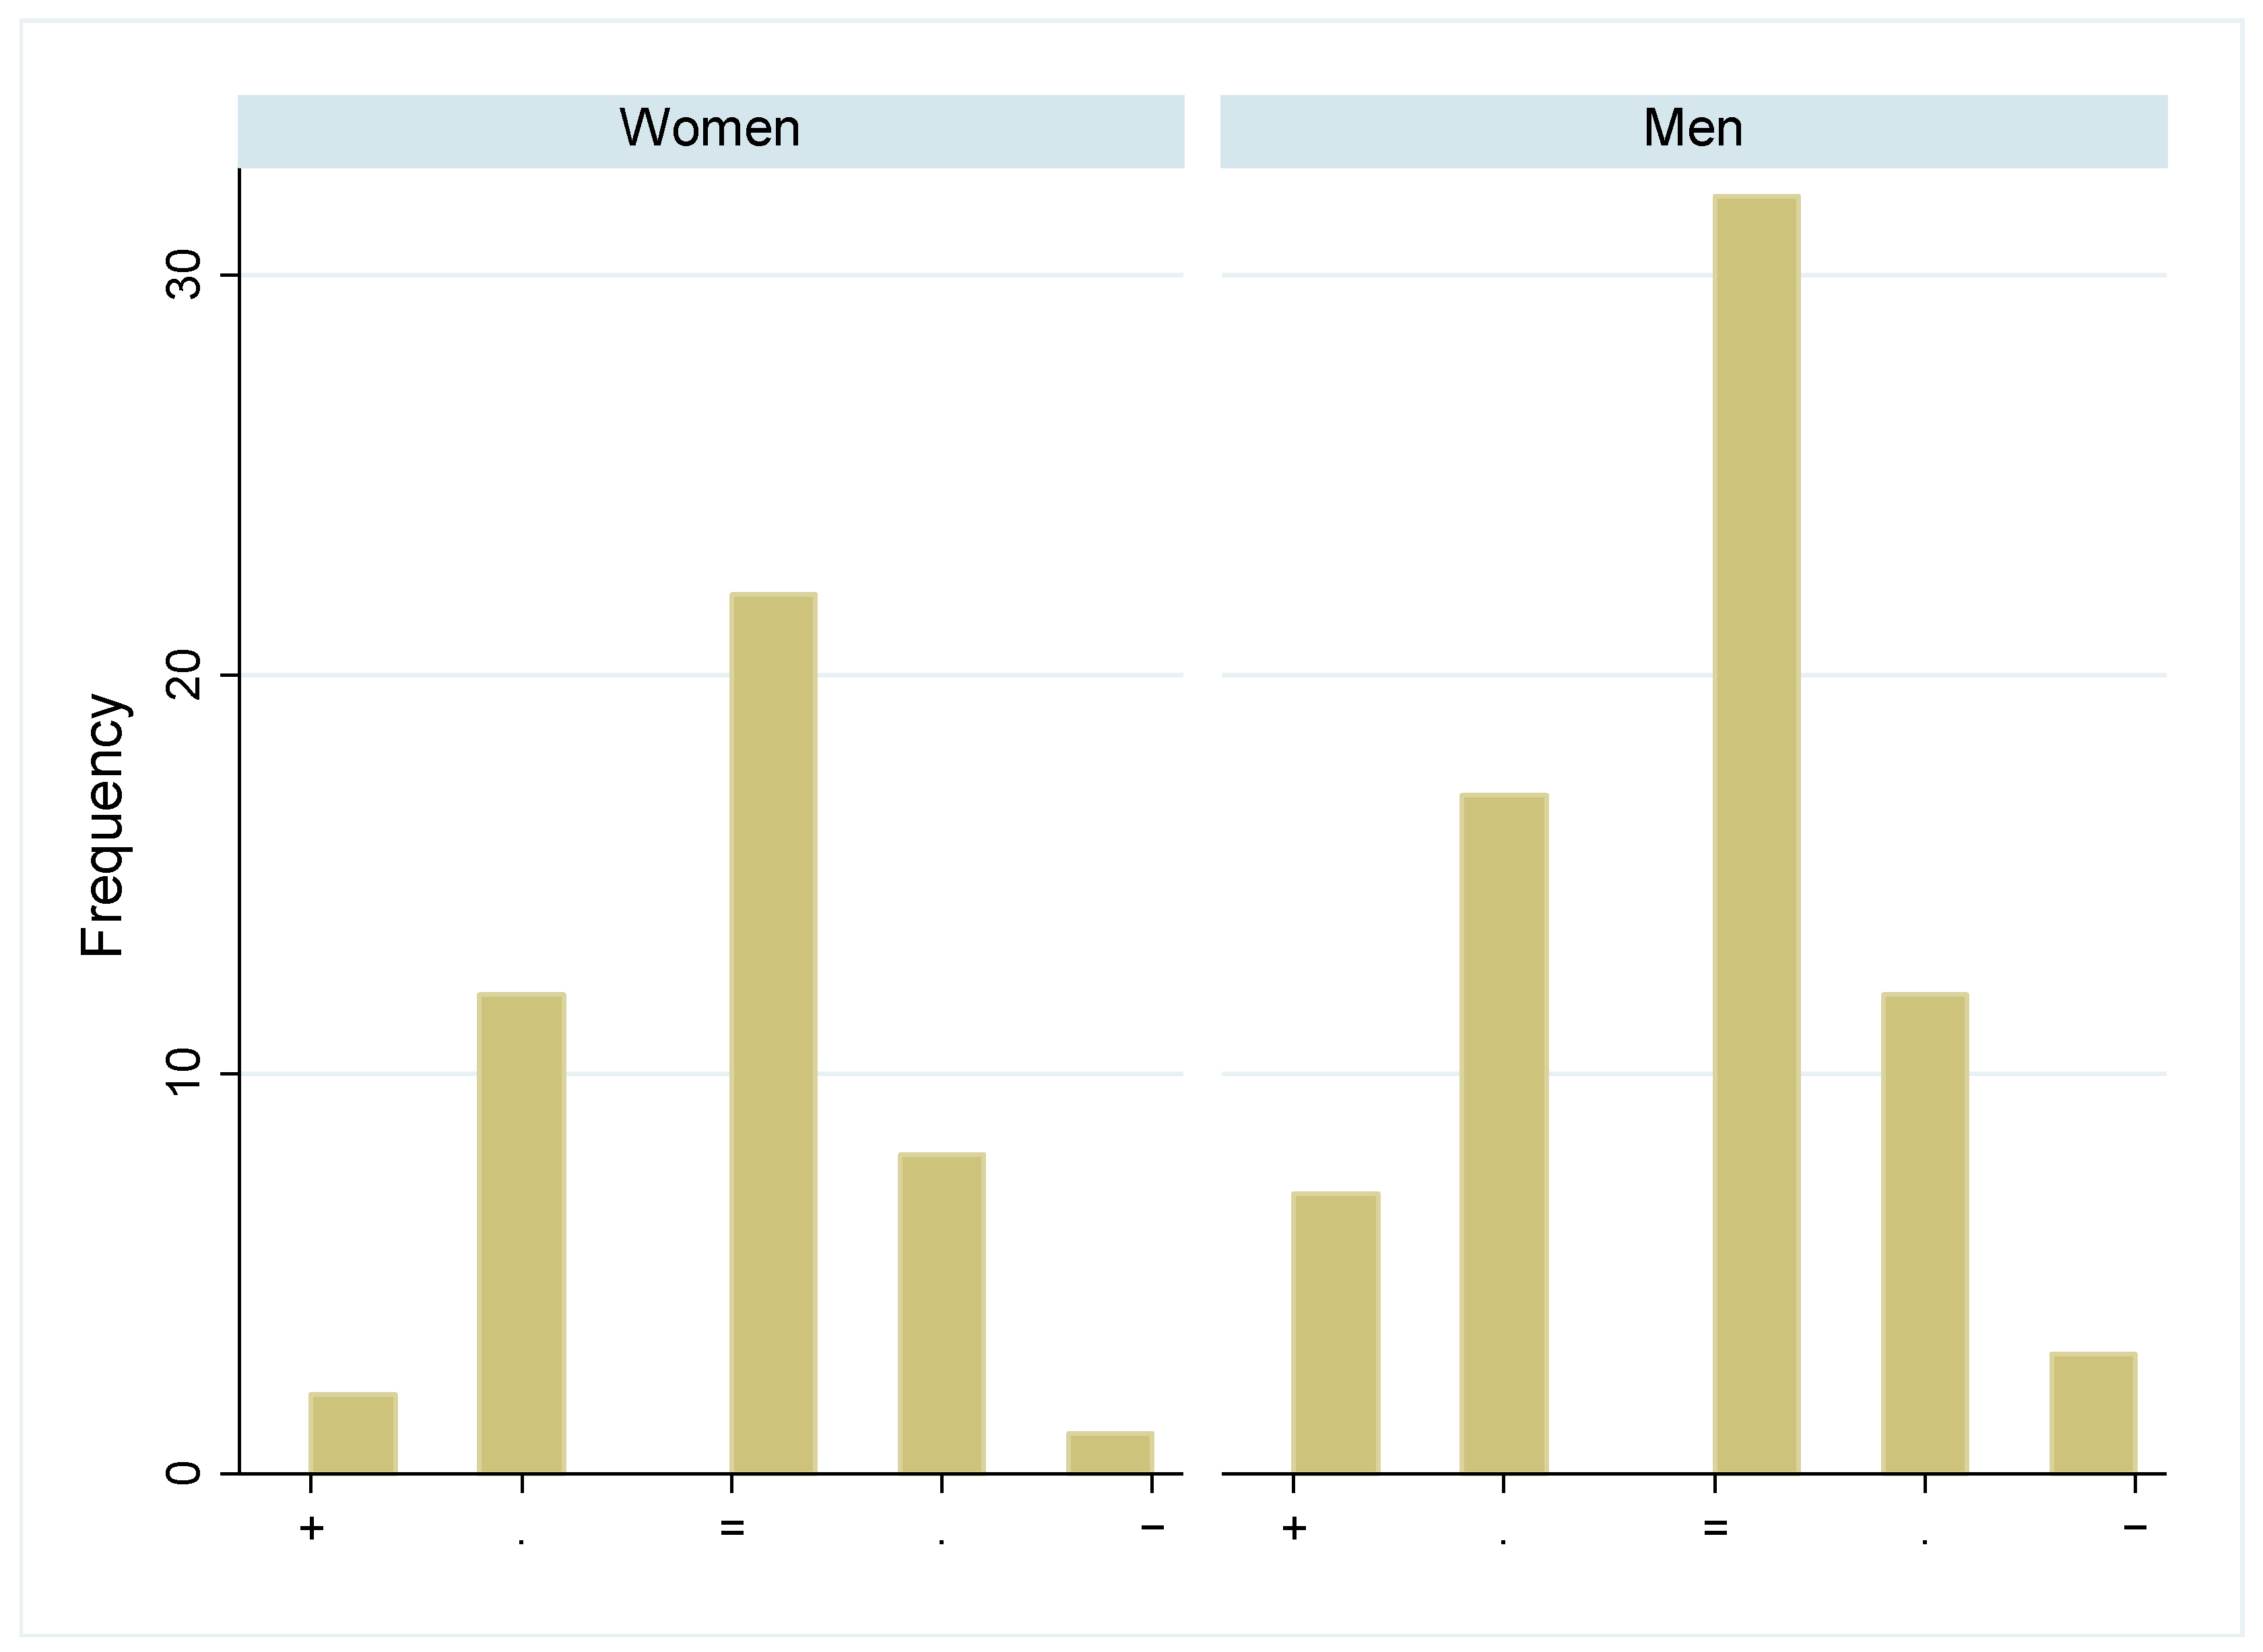
Most participants in both sexes reported no significant changes in body weight during the pandemic (Figure 7, p > 0.05 for sex difference). Indeed, if measured BMIs were compared over the years 2019–2023, there was no significant change over time in either sex (Figure 8, p > 0.05). In the analytical models, in women, physical activity and age were associated with BMI (all p < 0.05), while in men, apart from physical activity, diet quality and living place were associated with BMI. While high physical activity levels and a high diet quality (for men) were associated with a lower BMI, higher age and living in the agglomeration (for men) were associated with a higher BMI.
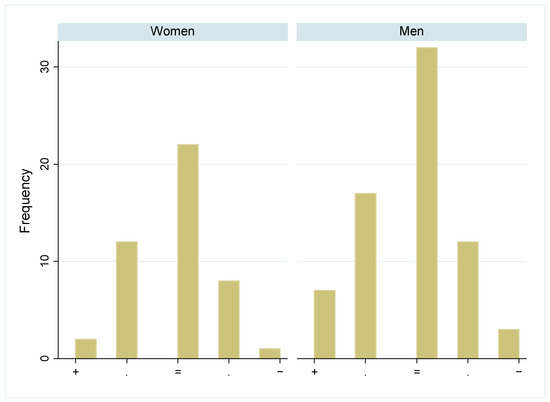
Figure 7.
Change in perceived weight in women and men during the pandemic: Number of participants who were believed to have changed their weight during the pandemic, in five categories from weight gain (+) to weight loss (−), separated by sex.
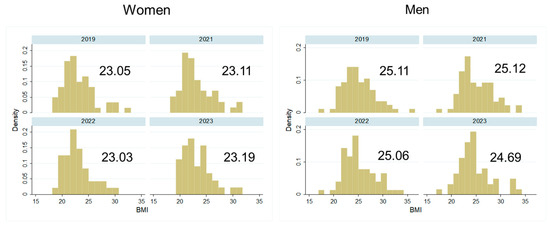
Figure 8.
Measured BMI distribution and mean BMI values in women and men over the years 2019–2023.
4. Discussion
In this study, we assessed whether there were changes in BMI as well as in eating and physical activity patterns during and shortly after the COVID-19 pandemic in a general population in Switzerland. The worldwide literature suggested an increase in BMI in children [9,10] and in adults [11,12] during the pandemic, aggravating important risk factors for obesity-related diseases [13,14,15]. Interestingly, we did not find any significant changes in BMI or lifestyle factors over this time in our study sample, except for less dieting behavior in men. One reason might be the small sample size of our study. However, a constant BMI during and after the pandemic was also found in an analysis of Swiss conscription data, where over 370,000 young men in Switzerland were included [31]. In a cohort of Swiss children, an increase in BMI during the pandemic was recorded for obese children, but much less so for normal-weight children [32].
A population-wide survey on the impact of the COVID-19 lockdown in Switzerland showed that most people did not change their eating or physical activity habits much, with 7% of people moving more than before, and 22% less. These changes rapidly disappeared again after the lockdown [17]. Another Swiss survey showed that this was especially true for people under the age of 45 years who changed their lifestyle habits during the pandemic, while elderly people did so much less. Some people increased their intake of healthy food, while others increased their intake of unhealthy food [18]. Similarly, a study on adults showed that people working in home-offices during the 2020 lockdown in Switzerland reacted partially with an increase in healthy food choices and partially with a decrease [19]. People living in cities and showing a lower socioeconomic level changed more often toward an unhealthy lifestyle than people living in rural areas of Switzerland [18]. Similar results were found in Italian adults, showing different reaction types among humans exposed to the COVID-19 lockdown situation [20]. Likewise, a study in Australia reported a partial increase and a partial decrease in physical activity during the COVID-19 pandemic [21]. In summary, it seems that people of higher socioeconomic status, living in cities, who were normal weight and showed a healthy lifestyle before the pandemic tended to keep their weight, increase the healthiness of their diet, and increase their level of physical activity during the pandemic, while people of lower socioeconomic status, living in rural areas, with overweight and unhealthy lifestyle habits tended to deteriorate. As our study consisted of mostly highly educated and elderly people living in cities or city agglomerations, our results align with previous findings. These findings are also in line with life history strategies that predict a stronger reaction toward unhealthy behaviors in younger people and in people with a lower socio-economic status [22,23].
Several studies outside of the realm of the COVID-19 pandemic showed that humans adapt their health behavior (e.g., diet, physical activity) according to changes in the environment, especially when facing harsh environmental conditions during childhood [2,5].
In Switzerland, only a few persons experienced harsh or unpredictable environmental conditions in childhood (if immigrants are excluded). The absence of major wars or natural disasters since the mid-20th century in large parts of Europe led to what was described in the literature as the “disaster gap”. This term describes the loss of functional disaster memory after a long period with few or no disasters in a country or region [33]. This effect was especially pronounced in affluent post-WWII Switzerland [34] and could additionally contribute to the fact that our highly educated Swiss study population did not react with an “unhealthier” life history strategy during the COVID-19 pandemic.
Another interesting aspect of our study concerns physiological and behavioral sex differences. In Europe, approximately 60% of the population is overweight or obese, with men showing higher levels than women [35]. In Switzerland, overweight levels are generally lower than in Europe [36]. We can confirm sex differences in BMI in our study sample with women showing lower levels, before and after the pandemic. Concerning lifestyle behaviors, women reported higher diet quality, but less physical activity than men, before and after the pandemic. After the correction for sociodemographic factors, in women, physical activity and age were associated with BMI, while in men, apart from physical activity, diet quality and place of residence were associated with BMI. While high physical activity levels and a high diet quality were associated with a lower BMI, higher age and living in a city agglomeration were associated with a higher BMI. In women, the role of age for BMI could be linked to menopausal status [37]. Apart from the general effect of an increase in BMI with increasing age, our sample, which includes many post-menopausal women, could also show an effect of hormonal changes impacting female body composition. Interestingly, a systematic review of weight management studies did not show clear sex differences concerning weight influencing factors. However, this study noted a widespread underreporting of sex-specific results in weight loss studies [38].
From a life history perspective, a sex difference in health behaviors can be expected, with men tending to an “unhealthier” life strategy (e.g., higher risk-taking, more aggression), while women generally show a “healthier” life strategy [39,40]. Our finding that men were more physically active but had unhealthier diets compared to women aligns with this perspective. The role of place of residence for BMI in men is probably more linked to education levels, as in Switzerland, tertiary-educated people more often live in cities. Our hypothesis is that lower-educated men more often live in agglomerations and at the same time more often follow an “unhealthy” life strategy and consequently show a higher BMI. These associations should be confirmed in a larger population with different levels of education. If this hypothesis holds true, this would have an impact on better risk-group-targeted overweight preventive strategies.
This study shows strengths and weaknesses. Strengths include the comprehensive behavioral questionnaire and the measurement of anthropometry with medical devices. Many studies rely on body weight and height data sampled with questionnaires, but self-reported data are prone to recall bias and social desirability bias, and studies showed that women tend to underreport their weight, while men tend to overreport their height [41]. A weakness of the present study is the small sample size and the sample composition, which is not representative of the Swiss general population. In fact, our study sample consists of mostly highly educated persons with a healthier BMI and lifestyle than the Swiss general population [36,42]. To generalize our findings, more research in a larger and more representative sample is needed.
5. Conclusions
Our study did not show major changes in BMI or health behavior during or after the COVID-19 pandemic in a sample of highly educated adults in Switzerland. Our results could indicate a higher resilience in highly educated persons toward environmental challenges, which confirms predictions from the life history theory. A better understanding of modulating factors such as sociodemographic or behavioral differences is essential to better understand the overall rules of human reaction norms, especially following local or global disasters. Such knowledge can lead to an increase in the population’s resilience to such events, and to more efficient preventive strategies to mitigate negative health outcomes.
Furthermore, we noted sex differences in anthropometry and health behaviors that are in line with life history strategies. As many studies do not report their results separately by sex, a comparison between studies is difficult. We therefore encourage the reporting of sex-specific results in studies on human physiology and behavior. Our results shall contribute to the development of more personalized and better risk-group-targeted overweight preventive strategies.
Author Contributions
Conceptualization, F.R. and N.B.; methodology, N.B.; data collection, B.K. and M.V.; data analysis, N.B.; writing—original draft preparation, N.B.; writing—review and editing, N.B., B.K., M.V. and F.R.; project administration, N.B.; funding acquisition, F.R. All authors have read and agreed to the published version of the manuscript.
Funding
This research was funded by ETH internal funds and by the Mäxi Foundation Zurich.
Institutional Review Board Statement
The study was conducted in accordance with the Declaration of Helsinki and approved by the Ethics Committee of ETH Zurich (EK 2019-N-08) and by the Ethics Committee of the Kanton of Zurich (BASEC 2020-00654).
Informed Consent Statement
Informed consent was obtained from all subjects involved in the study.
Data Availability Statement
The datasets presented in this article are not readily available because the data are part of an ongoing study. Requests to access the datasets should be directed to N.B.
Acknowledgments
We would like to thank Kaspar Staub, Luana Giacone, Cynthia Sob, Bahri Bektashi, Anouk Manzanell, and Giulia Jakober for help in data collection and Katarina Matthes for help in data collection and statistical analysis counseling.
Conflicts of Interest
The authors declare no conflicts of interest.
References
- Stearns, S. The Evolution of Life Histories; Oxford University Press: Oxford, UK, 1992. [Google Scholar]
- Chevance, G.; Fresan, U.; Hekler, E.; Edmondson, D.; Lloyd, S.J.; Ballester, J.; Litt, J.; Cvijanovic, I.; Araujo-Soares, V.; Bernard, P. Thinking Health-related Behaviors in a Climate Change Context: A Narrative Review. Ann. Behav. Med. 2023, 57, 193–204. [Google Scholar] [CrossRef] [PubMed]
- Hoffman, D.J.; Reynolds, R.M.; Hardy, D.B. Developmental origins of health and disease: Current knowledge and potential mechanisms. Nutr. Rev. 2017, 75, 951–970. [Google Scholar] [CrossRef] [PubMed]
- Bath, K.G. Synthesizing Views to Understand Sex Differences in Response to Early Life Adversity. Trends Neurosci. 2020, 43, 300–310. [Google Scholar] [CrossRef] [PubMed]
- Brumbach, B.H.; Figueredo, A.J.; Ellis, B.J. Effects of Harsh and Unpredictable Environments in Adolescence on Development of Life History Strategies: A Longitudinal Test of an Evolutionary Model. Hum. Nat. 2009, 20, 25–51. [Google Scholar] [CrossRef]
- Boyce, W.T.; Ellis, B.J. Biological sensitivity to context: I. An evolutionary-developmental theory of the origins and functions of stress reactivity. Dev. Psychopathol. 2005, 17, 271–301. [Google Scholar] [CrossRef]
- Sear, R. Do human ‘life history strategies’ exist? Evol. Hum. Behav. 2020, 41, 513–526. [Google Scholar] [CrossRef]
- Zhao, Z.; Li, L.; Sang, Y. The COVID-19 pandemic increased poor lifestyles and worsen mental health: A systematic review. Am. J. Transl. Res. 2023, 15, 3060–3066. [Google Scholar]
- Knapp, E.A.; Dong, Y.; Dunlop, A.L.; Aschner, J.L.; Stanford, J.B.; Hartert, T.; Teitelbaum, S.L.; Hudak, M.L.; Carroll, K.; O’Connor, T.G.; et al. Changes in BMI During the COVID-19 Pandemic. Pediatrics 2022, 150, e2022056552. [Google Scholar] [CrossRef]
- Pierce, S.L.; Kompaniyets, L.; Freedman, D.S.; Goodman, A.B.; Blanck, H.M. Children’s rates of BMI change during pre-pandemic and two COVID-19 pandemic periods, IQVIA Ambulatory Electronic Medical Record, January 2018 through November 2021. Obesity 2023, 31, 693–698. [Google Scholar] [CrossRef]
- Dicken, S.J.; Mitchell, J.J.; Le Vay, J.N.; Beard, E.; Kale, D.; Herbec, A.; Shahab, L. Impact of COVID-19 Pandemic on Weight and BMI among UK Adults: A Longitudinal Analysis of Data from the HEBECO Study. Nutrients 2021, 13, 2911. [Google Scholar] [CrossRef]
- Zaccardi, F.; Byrne, K.; Khunti, K.; Kloecker, D.; Reynoso, R.; Shabnam, S.; Vaz, L.; Yates, T.; Gillies, C. The impact of COVID-19 lockdowns on the body mass index of people living with obesity: A UK retrospective cohort study using the UK Clinical Practice Research Datalink. Obes. Res. Clin. Pract. 2023, 17, 468–476. [Google Scholar] [CrossRef] [PubMed]
- Corbett, S.; Courtiol, A.; Lummaa, V.; Moorad, J.; Stearns, S. The transition to modernity and chronic disease: Mismatch and natural selection. Nat. Rev. Genet. 2018, 19, 419–430. [Google Scholar] [CrossRef] [PubMed]
- Diggs, G.M. Evolutionary Mismatch: Implications Far Beyond Diet and Exercise. J. Evol. Health 2017, 2, 3. [Google Scholar] [CrossRef]
- Lucock, M.D.; Martin, C.E.; Yates, Z.R.; Veysey, M. Diet and our genetic legacy in the recent anthropocene: A Darwinian perspective to nutritional health. J. Evid. Based Complement. Altern. Med. 2014, 19, 68–83. [Google Scholar] [CrossRef]
- Xiao, B.; Xin, Z.; Wang, L. COVID-19′s influence on life history strategy: Insights from cross-temporal meta-analysis and experimental research. Personal. Individ. Differ. 2024, 219, 112505. [Google Scholar] [CrossRef]
- Kessler, C.; Guggenbühl, L. Auswirkungen der Corona-Pandemie auf Gesundheitsbezogene Belastungen und Ressourcen der Bevölkerung. Ausgewählte Forschungsergebnisse 2020 für die Schweiz. Arbeitspapier 52; Gesundheitsförderung Schweiz: Bern, Switzerland; Lausanne, Switzerland, 2021. [Google Scholar]
- M.I.S. Etude sur les Habitudes Alimentaires et L’activité Physique de la Population en Suisse Pendant la Période des Mesures du Conseil Fédéral Visant à Freiner la Propagation du COVID-19. Réalisée Pour l’Office Fédéral de la Sécurité Alimentaire et des Affaires Vétérinaires (OSAV), en Collaboration Avec l’Office Fédéral de la Santé Publique (OFSP) et l’Office Fédéral pour L’approvisionnement Économique du Pays (OFAE); M.I.S. TREND: Lausanne, Switzerland, 2020. [Google Scholar]
- Ammann, J.; Ritzel, C.; El Benni, N. How did the COVID-19 pandemic influence health-related behaviour? An online survey on food choice, physical activity and changes in body weight among Swiss adults. Food Qual. Prefer. 2022, 100, 104625. [Google Scholar] [CrossRef]
- Pellegrini, M.; Ponzo, V.; Rosato, R.; Scumaci, E.; Goitre, I.; Benso, A.; Belcastro, S.; Crespi, C.; De Michieli, F.; Ghigo, E.; et al. Changes in Weight and Nutritional Habits in Adults with Obesity during the “Lockdown” Period Caused by the COVID-19 Virus Emergency. Nutrients 2020, 12, 2016. [Google Scholar] [CrossRef]
- Phillipou, A.; Meyer, D.; Neill, E.; Tan, E.J.; Toh, W.L.; Van Rheenen, T.E.; Rossell, S.L. Eating and exercise behaviors in eating disorders and the general population during the COVID-19 pandemic in Australia: Initial results from the COLLATE project. Int. J. Eat. Disord. 2020, 53, 1158–1165. [Google Scholar] [CrossRef]
- Griskevicius, V.; Tybur, J.M.; Delton, A.W.; Robertson, T.E. The influence of mortality and socioeconomic status on risk and delayed rewards: A life history theory approach. J. Personal. Soc. Psychol. 2011, 100, 1015–1026. [Google Scholar] [CrossRef]
- Ellis, B.J.; Figueredo, A.J.; Brumbach, B.H.; Schlomer, G.L. Fundamental Dimensions of Environmental Risk: The Impact of Harsh versus Unpredictable Environments on the Evolution and Development of Life History Strategies. Hum. Nat. 2009, 20, 204–268. [Google Scholar] [CrossRef]
- Horwath, C.; Hagmann, D.; Hartmann, C. Intuitive eating and food intake in men and women: Results from the Swiss food panel study. Appetite 2019, 135, 61–71. [Google Scholar] [CrossRef] [PubMed]
- Siegrist, M.; Hartmann, C. Impact of sustainability perception on consumption of organic meat and meat substitutes. Appetite 2019, 132, 196–202. [Google Scholar] [CrossRef] [PubMed]
- Hagmann, D.; Siegrist, M.; Hartmann, C. Meat avoidance: Motives, alternative proteins and diet quality in a sample of Swiss consumers. Public Health Nutr. 2019, 22, 2448–2459. [Google Scholar] [CrossRef] [PubMed]
- BLV. Geniessen und Gesund Bleiben. Schweizer Ernährungsstrategie 2017–2024; BLV: Bern, Switzerland, 2017. [Google Scholar]
- Hu, F.B.; Satija, A.; Rimm, E.B.; Spiegelman, D.; Sampson, L.; Rosner, B.; Camargo, C.A., Jr.; Stampfer, M.; Willett, W.C. Diet Assessment Methods in the Nurses’ Health Studies and Contribution to Evidence-Based Nutritional Policies and Guidelines. Am. J. Public Health 2016, 106, 1567–1572. [Google Scholar] [CrossRef]
- Johansson, G.; Westerterp, K.R. Assessment of the physical activity level with two questions: Validation with doubly labeled water. Int. J. Obes. 2008, 32, 1031–1033. [Google Scholar] [CrossRef]
- Peine, S.; Knabe, S.; Carrero, I.; Brundert, M.; Wilhelm, J.; Ewert, A.; Denzer, U.; Jensen, B.; Lilburn, P. Generation of normal ranges for measures of body composition in adults based on bioelectrical impedance analysis using the seca mBCA. Int. J. Body Compos. Res. 2013, 11, 67–76. [Google Scholar]
- Meili, S.; Brabec, M.; Ruhli, F.; Buehrer, T.W.; Gultekin, N.; Stanga, Z.; Bender, N.; Staub, K.; Reber, E. Body mass index in young men in Switzerland after the national shutdowns during the COVID-19 pandemic: Results from a cross-sectional monitoring study at the population level since 2010. Eur J Public Health 2022, 32, 955–961. [Google Scholar] [CrossRef]
- Maggio, A.B.R.; Gal-Dudding, C.; Martin, X.; Chamay-Weber, C. Evaluation of the impact of the COVID-19 lockdown on BMI in children and adolescents with or without obesity. BMC Pediatr. 2022, 22, 509. [Google Scholar] [CrossRef]
- Pfister, C. The Monster Swallows You. Disaster Memory and Risk Culture in Western Europe, 1500–2000. RCC Perspect. 2011, 1, 1–23. [Google Scholar] [CrossRef]
- Staub, K.; Ruehli, F.; Floris, J. The “Pandemic Gap” in Switzerland across the 20th century and the necessity of increased science communication of past pandemic experiences. Swiss Med. Wkly. 2020. [Google Scholar] [CrossRef]
- WHO. The Challenge of Obesity; WHO: Geneva, Switzerland, 2024; Available online: https://www.who.int/europe/news-room/fact-sheets/item/the-challenge-of-obesity#:~:text=Almost%2060%25%20of%20adults%20live,with%20overweight%20(including%20obesity) (accessed on 1 May 2024).
- BfS. Übergewicht; Federal Office of Statistics: Neuchatel, Switzerland, 2022; Available online: https://www.bfs.admin.ch/bfs/de/home/statistiken/gesundheit/determinanten/uebergewicht.html#:~:text=%C3%9Cbergewicht%20und%20Adipositas%20im%20Jahr,nur%20die%20Adipositas%20betrachtet%20wird (accessed on 15 May 2024).
- Fenton, A. Weight, Shape, and Body Composition Changes at Menopause. J. Midlife Health 2021, 12, 187–192. [Google Scholar] [CrossRef] [PubMed]
- Kantowski, T.; Wiesch, C.S.Z.; Aberle, J.; Lautenbach, A. Obesity management: Sex-specific considerations. Arch. Gynecol. Obstet. 2024, 309, 1745–1752. [Google Scholar] [CrossRef] [PubMed]
- Salas-Rodriguez, J.; Gomez-Jacinto, L.; Hombrados-Mendieta, M.I. Life History Theory: Evolutionary mechanisms and gender role on risk-taking behaviors in young adults. Personal. Individ. Differ. 2021, 175, 110752. [Google Scholar] [CrossRef]
- Kruger, D.J.; Nesse, R.M. An evolutionary life-history framework for understanding sex differences in human mortality rates. Hum. Nat. Int. Bios 2006, 17, 74–97. [Google Scholar] [CrossRef]
- Fayyaz, K.; Bataineh, M.F.; Ali, H.I.; Al-Nawaiseh, A.M.; Al-Rifai, R.H.; Shahbaz, H.M. Validity of Measured vs. Self-Reported Weight and Height and Practical Considerations for Enhancing Reliability in Clinical and Epidemiological Studies: A Systematic Review. Nutrients 2024, 16, 1704. [Google Scholar] [CrossRef]
- BAG. Übergewicht und Adipositas; BAG: Bern, Switzerland, 2022; Available online: https://www.bag.admin.ch/bag/de/home/gesund-leben/gesundheitsfoerderung-und-praevention/koerpergewicht/uebergewicht-und-adipositas.html (accessed on 5 May 2024).
Disclaimer/Publisher’s Note: The statements, opinions and data contained in all publications are solely those of the individual author(s) and contributor(s) and not of MDPI and/or the editor(s). MDPI and/or the editor(s) disclaim responsibility for any injury to people or property resulting from any ideas, methods, instructions or products referred to in the content. |
© 2024 by the authors. Licensee MDPI, Basel, Switzerland. This article is an open access article distributed under the terms and conditions of the Creative Commons Attribution (CC BY) license (https://creativecommons.org/licenses/by/4.0/).

