
Omega-3 Fatty Acid and Vitamin D Supplementations Partially Reversed Metabolic Disorders and Restored Gut Microbiota in Obese Wistar Rats

 , , , , , and
Simple Summary
Abstract
1. Introduction
2. Materials and Methods
2.1. Animal Housing
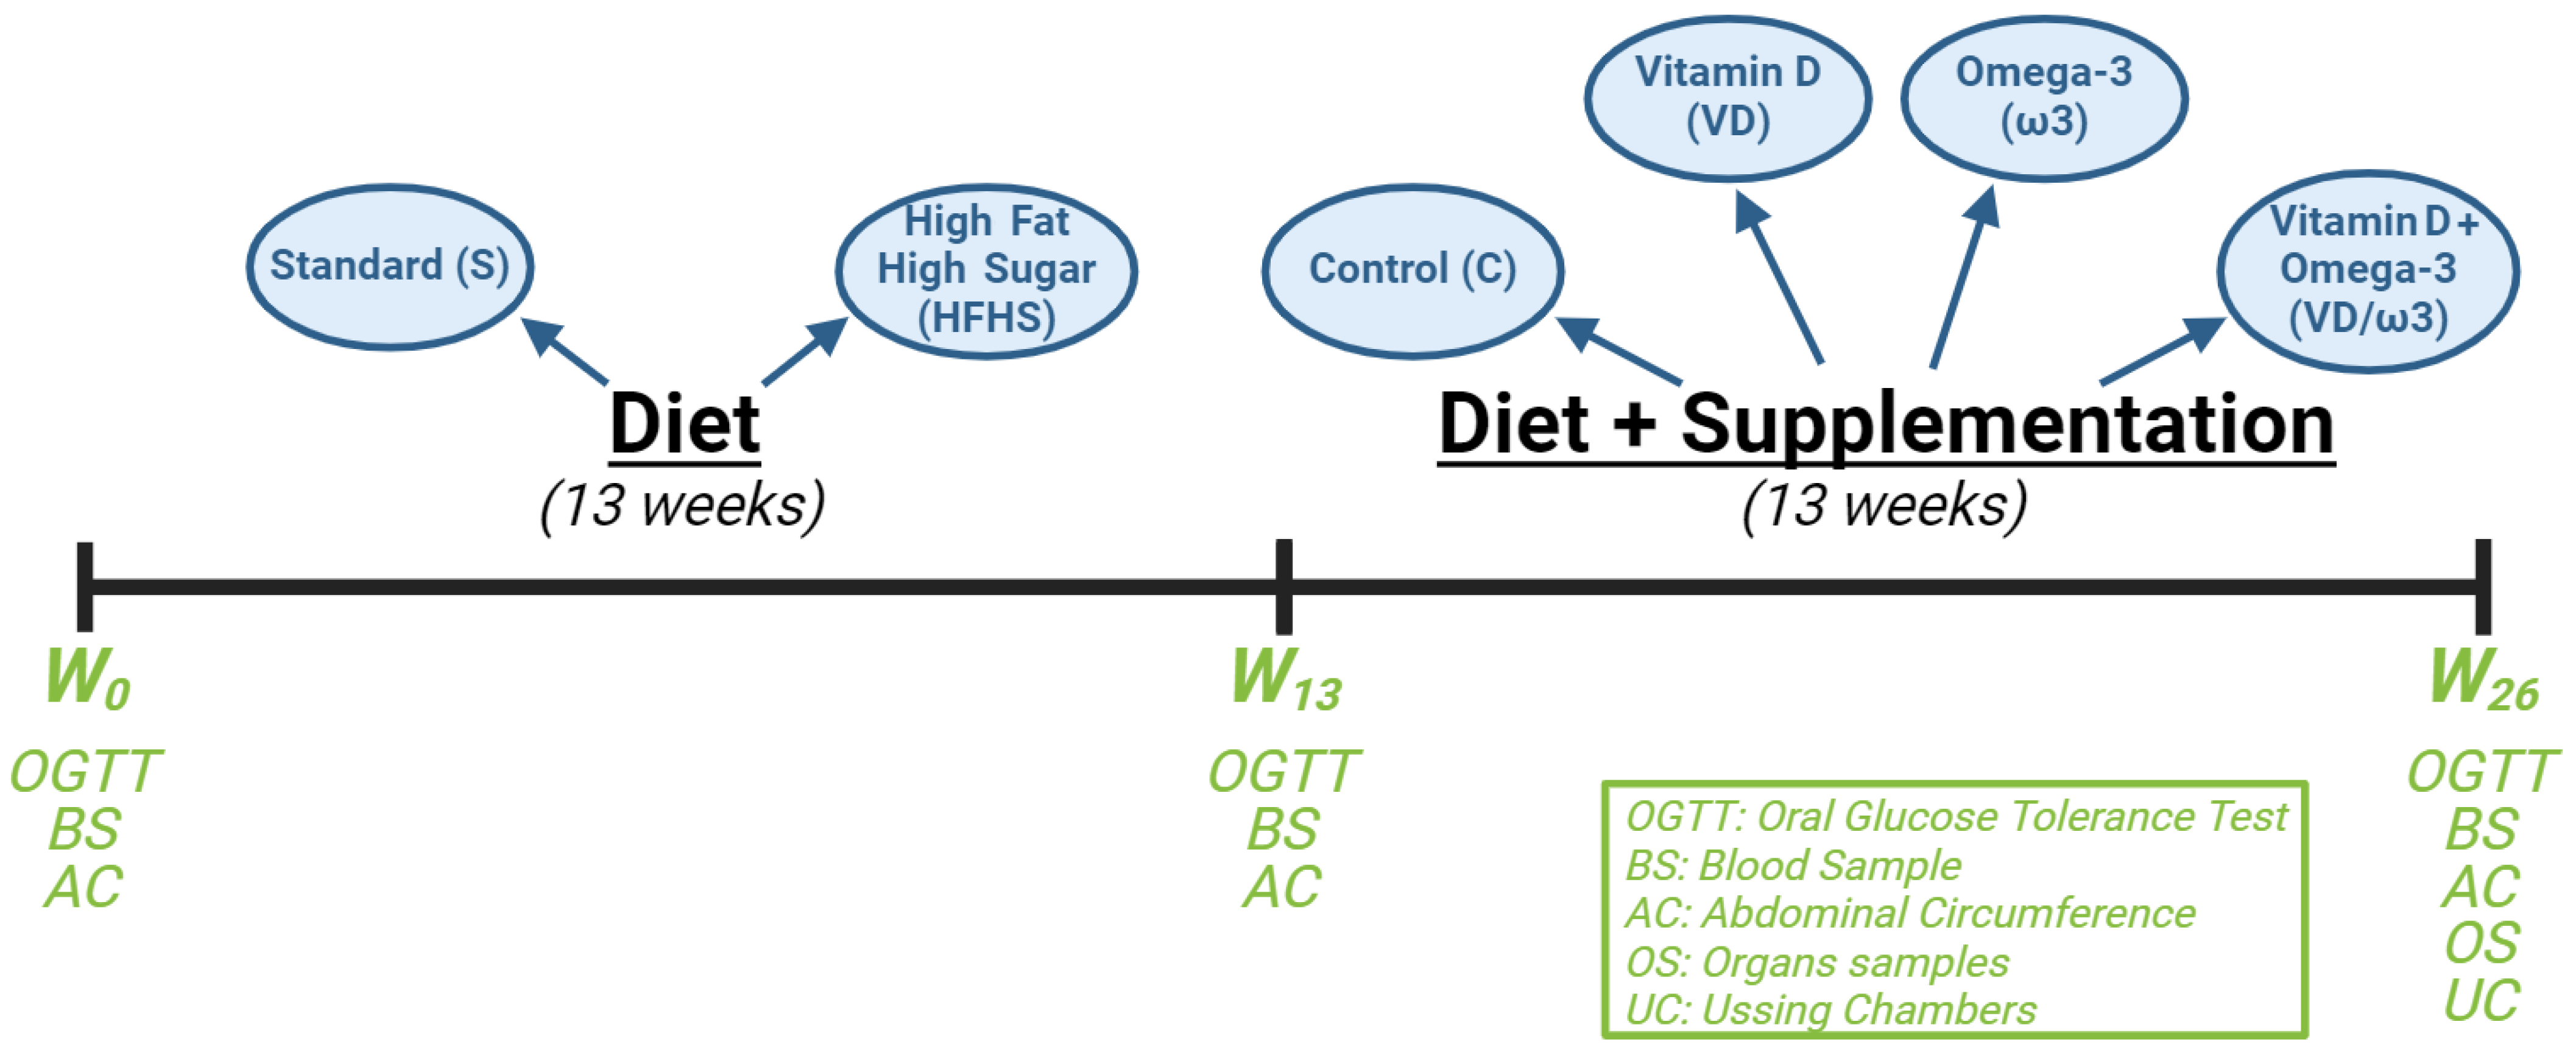
2.2. Study Design
2.3. Weight and Morphometric Measurements
2.4. The Oral Glucose Tolerance Test
2.5. Blood Sampling
2.6. Microbiota
- DNA extraction:
- 16S metabarcoding analysis—library preparation and sequencing:
- 16S metabarcoding analysis—data processing:
2.7. Paracellular and Transcellular Intestinal Permeability Assessments
2.8. Liver Histology
2.9. Caecum and Adipose Tissue Analysis
2.10. Statistical Analyses
3. Results
3.1. Effects on Morphometric Parameters
3.2. Effects on Glucose Homeostasis
3.3. Effects on Lipid Profiles
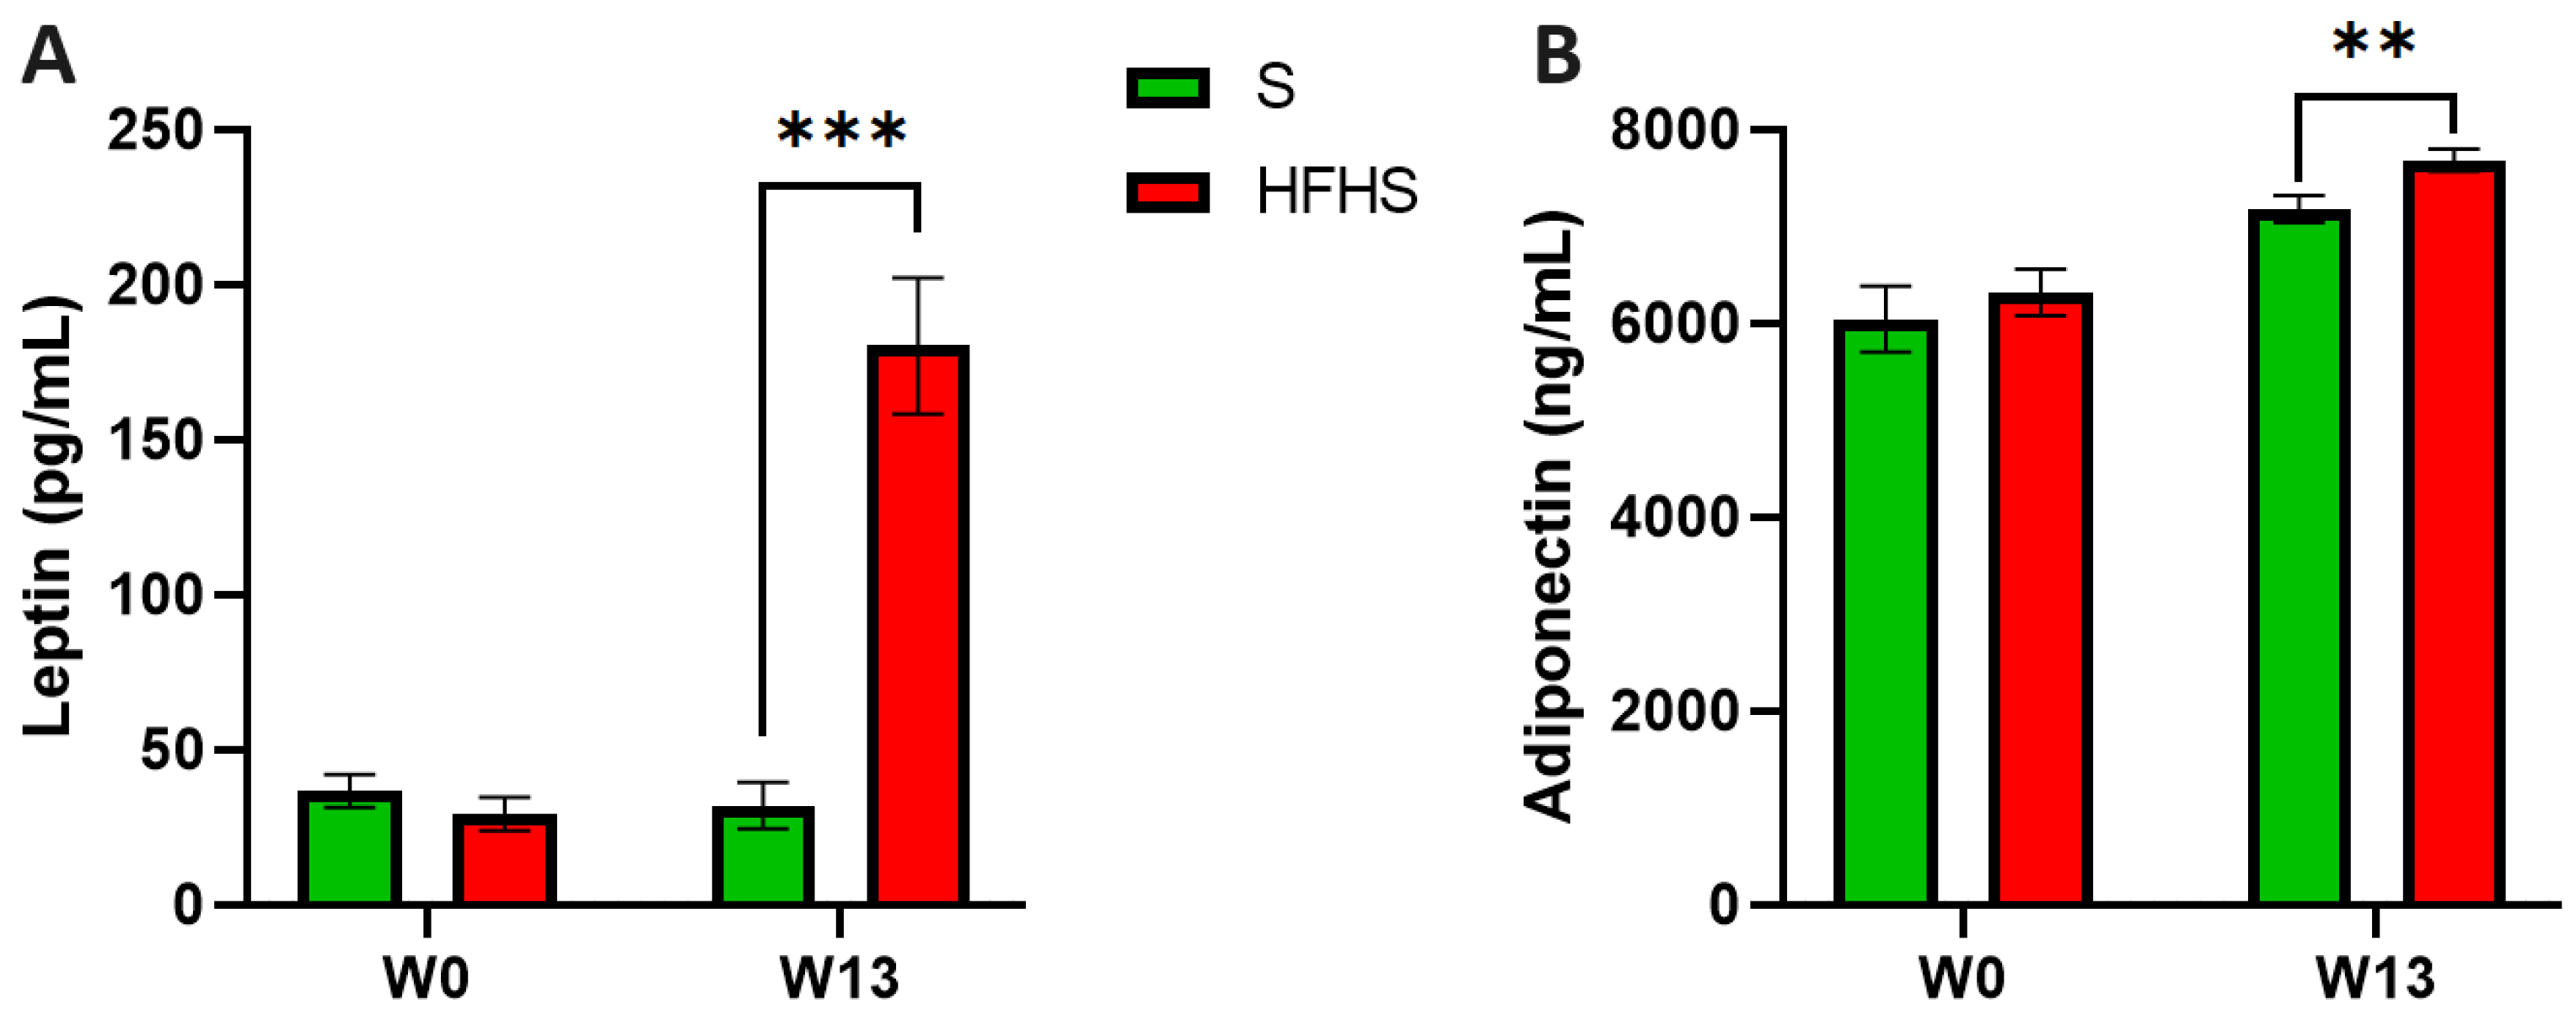
3.4. Effects on Inflammation
3.5. Plasma Calcidiol Levels
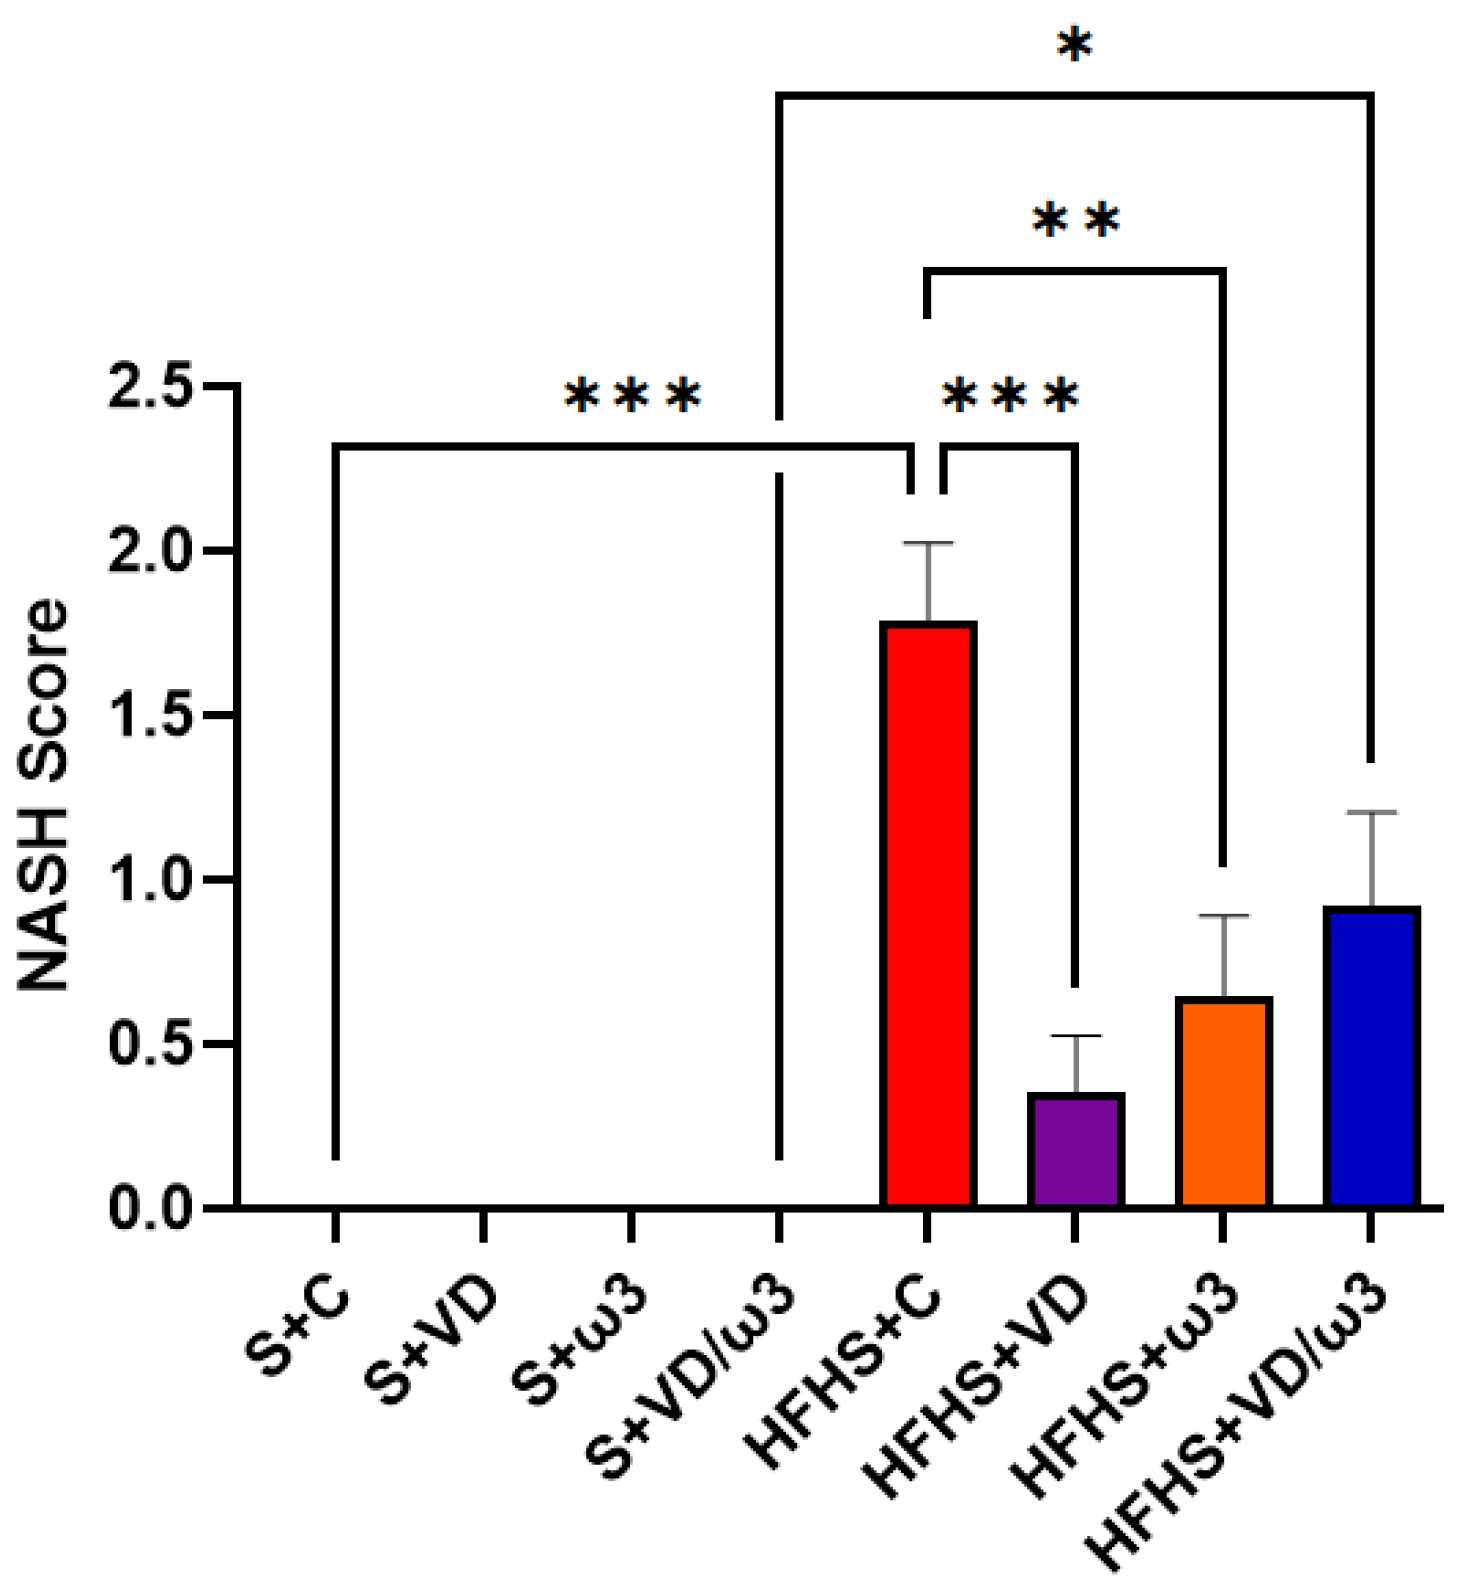
3.6. Hepatic Steatosis Assessment
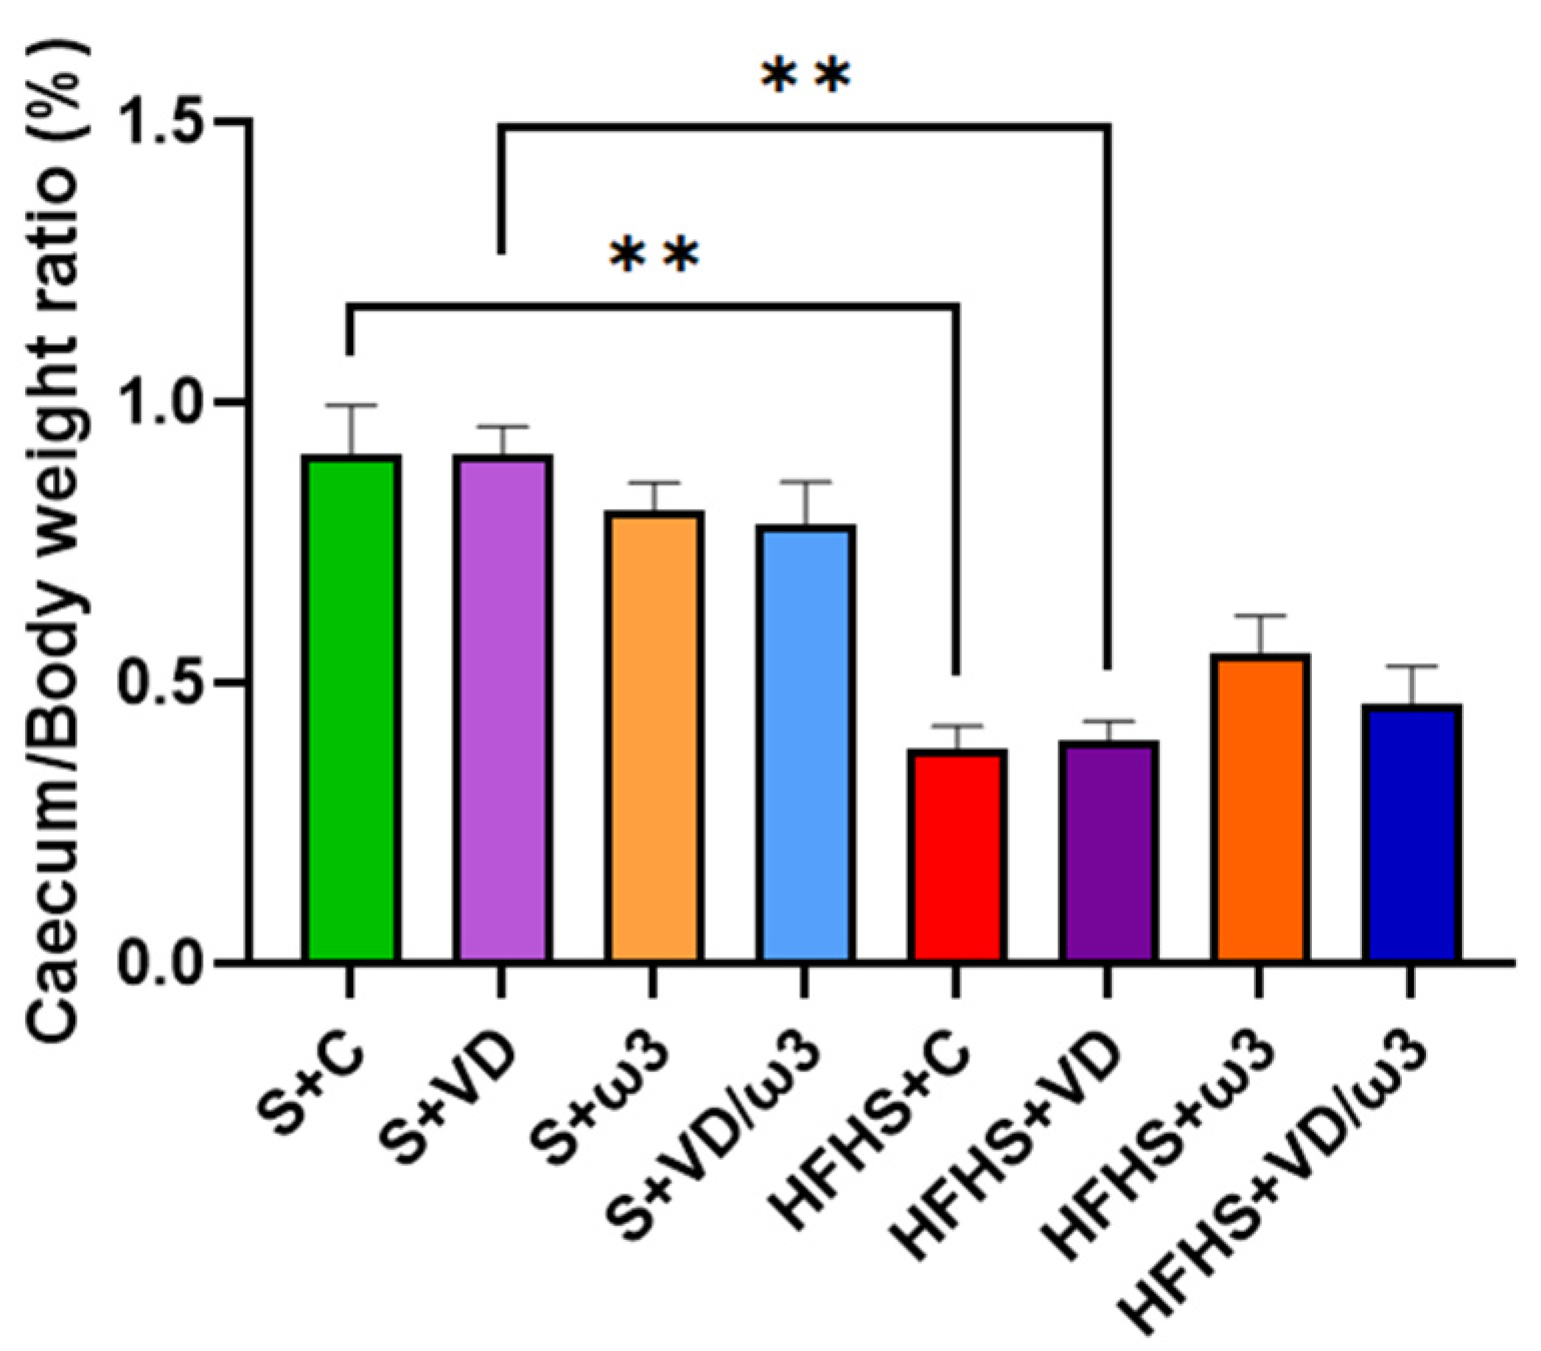
3.7. Caecum Morphology
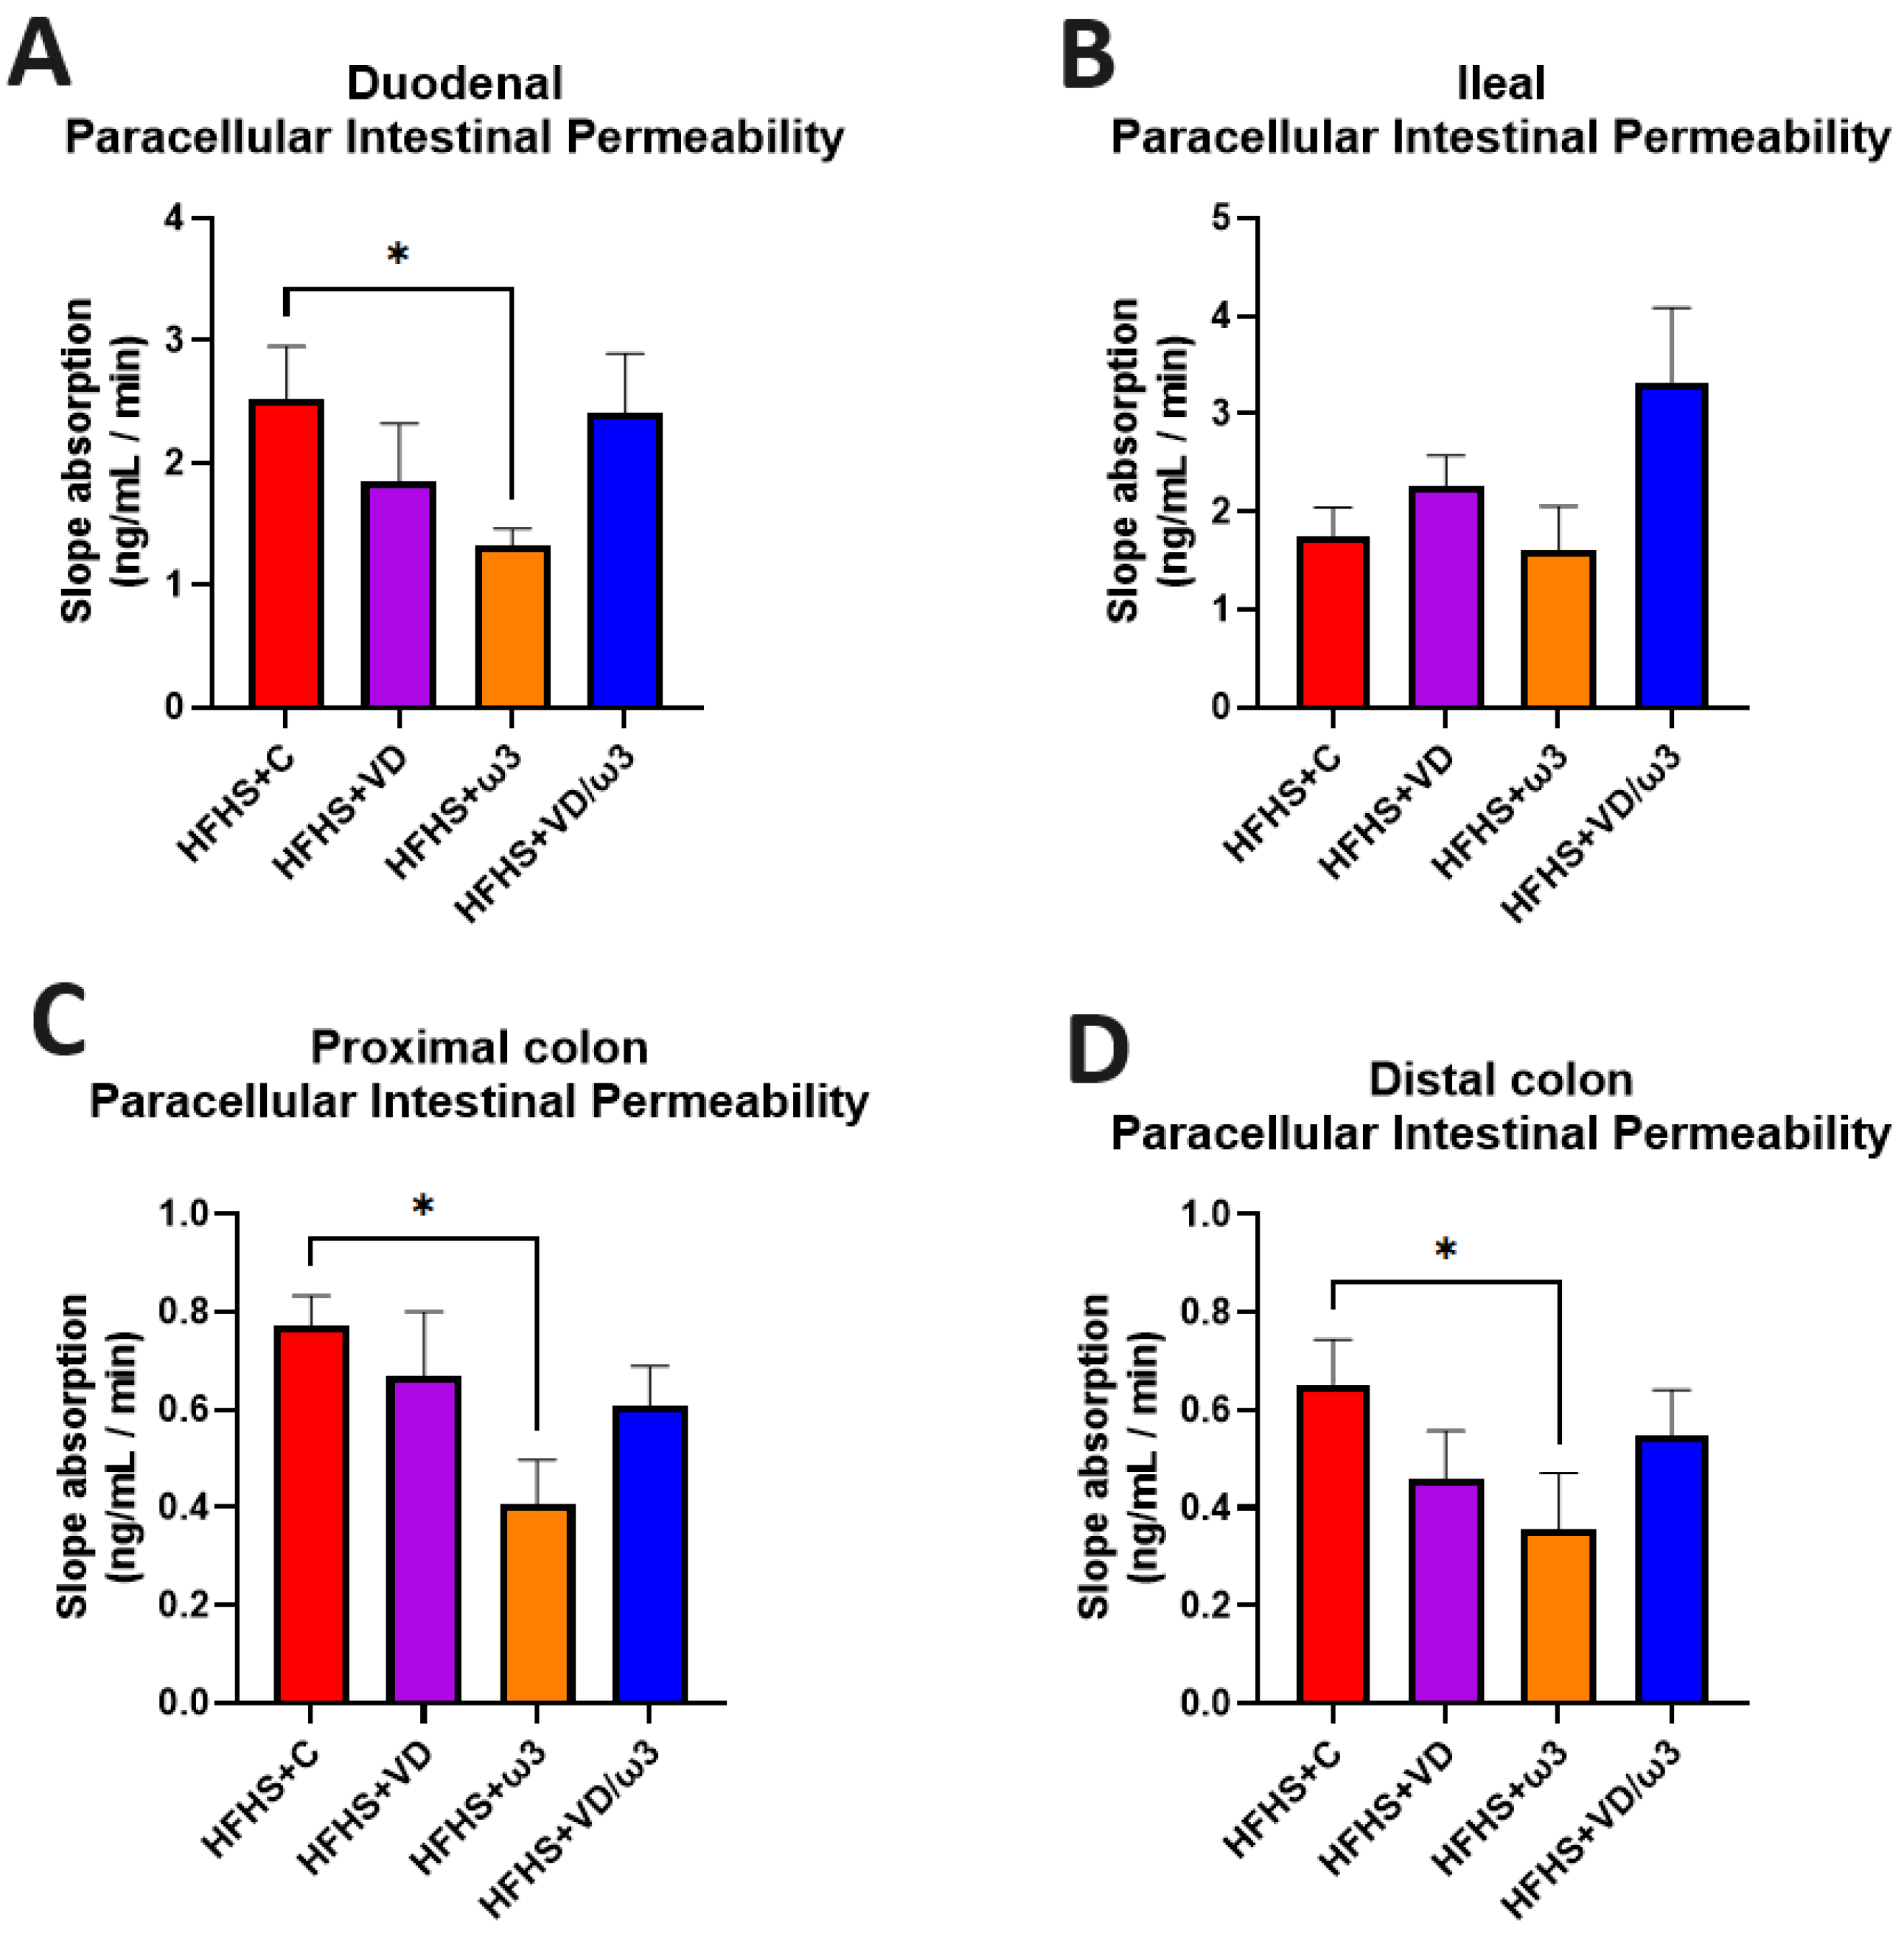
3.8. Intestinal Permeability Assessments
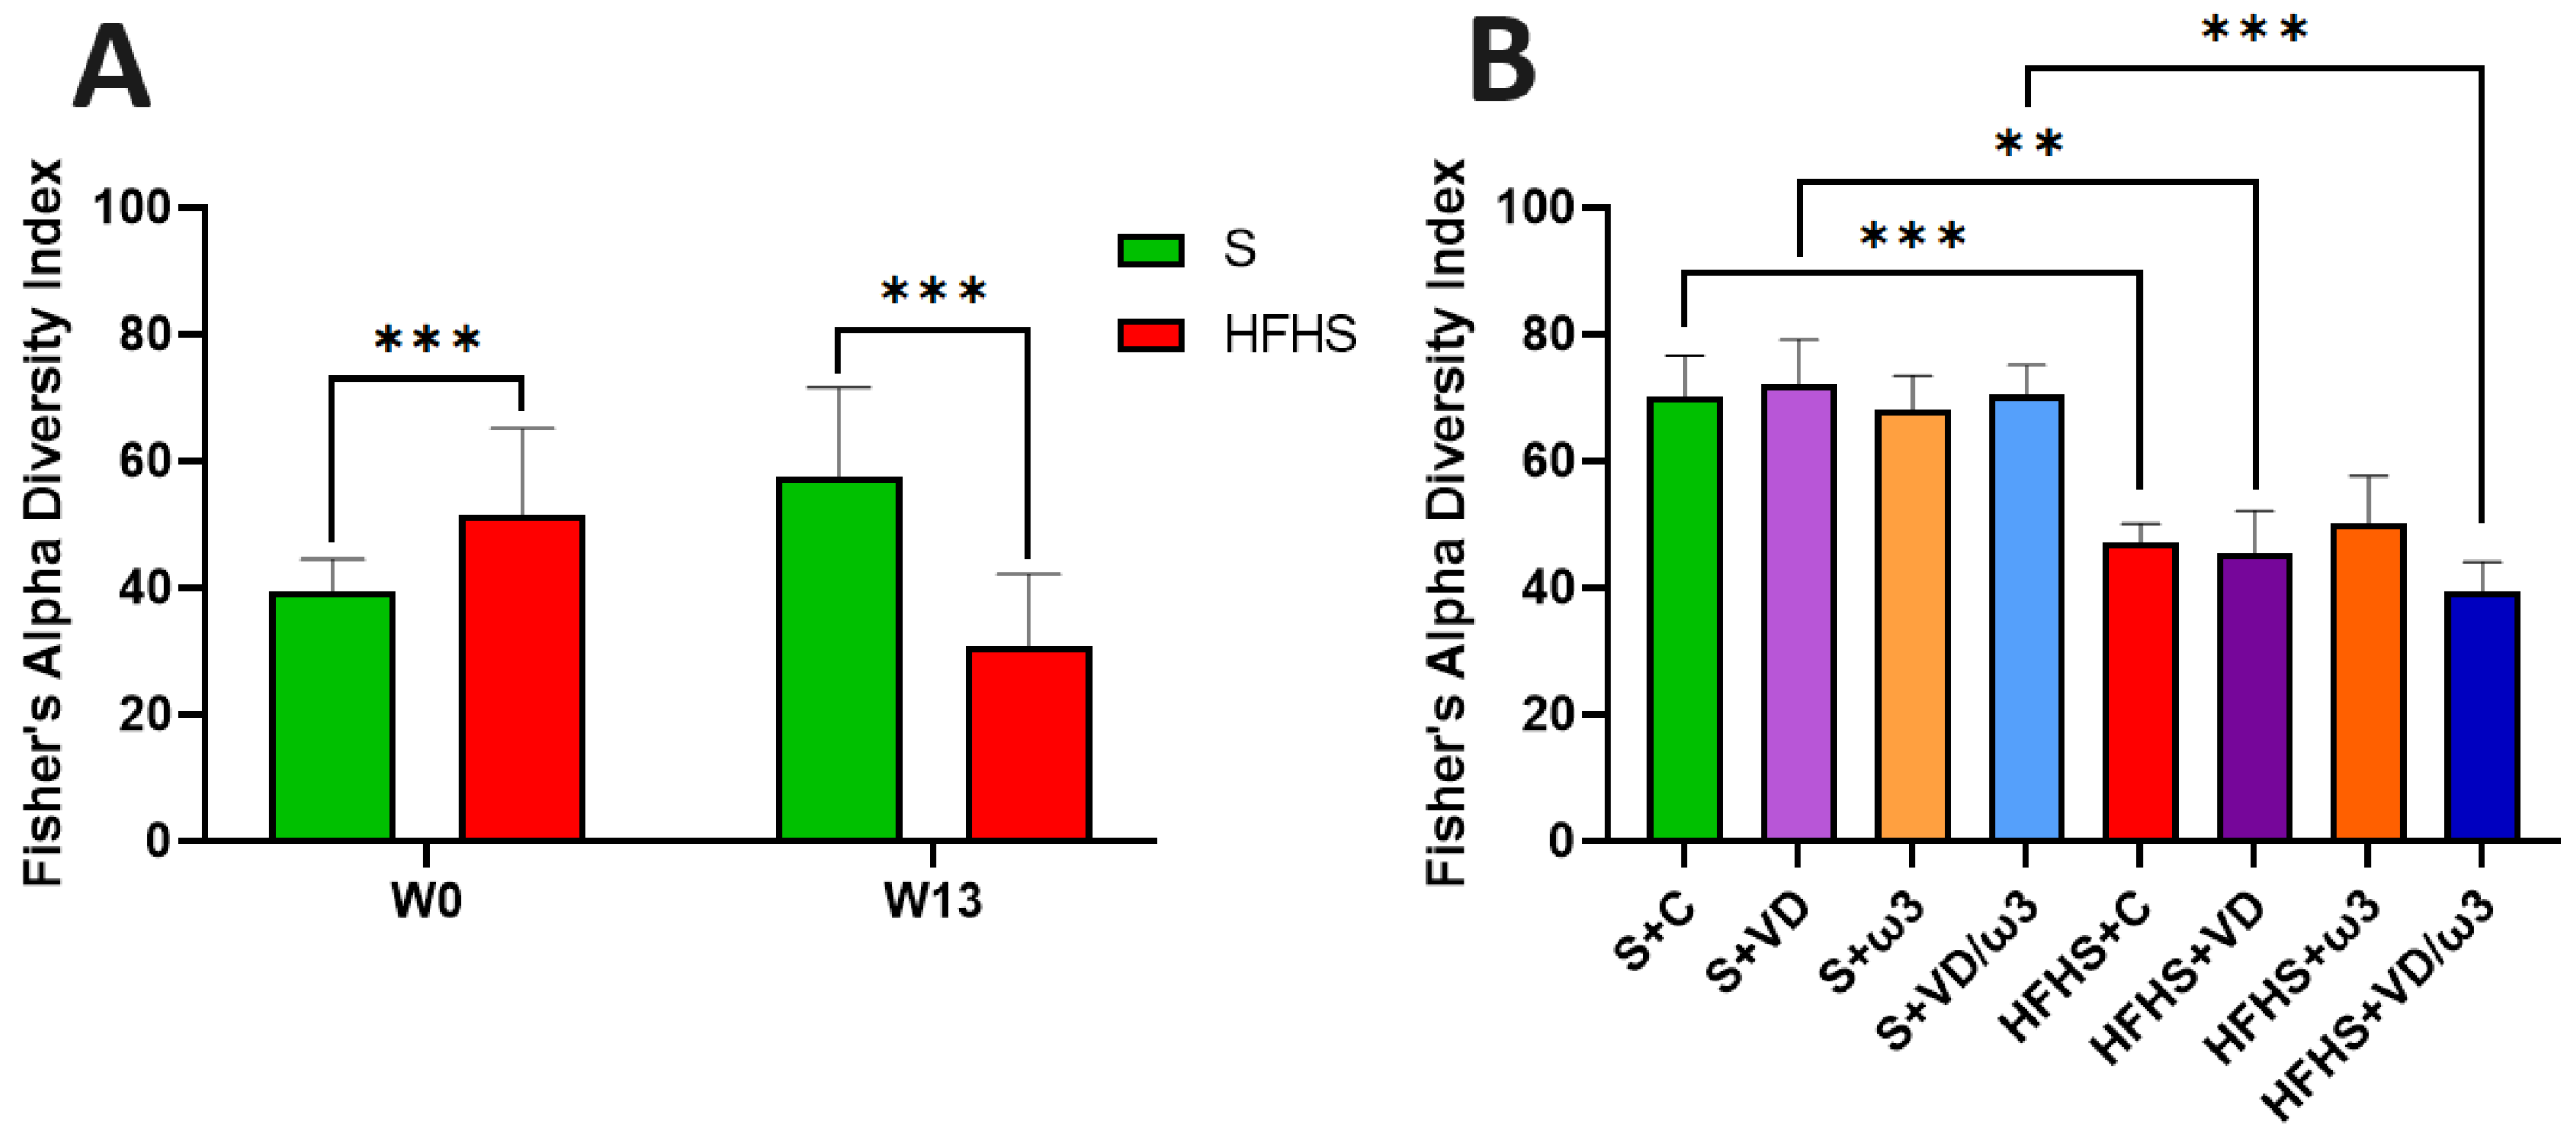
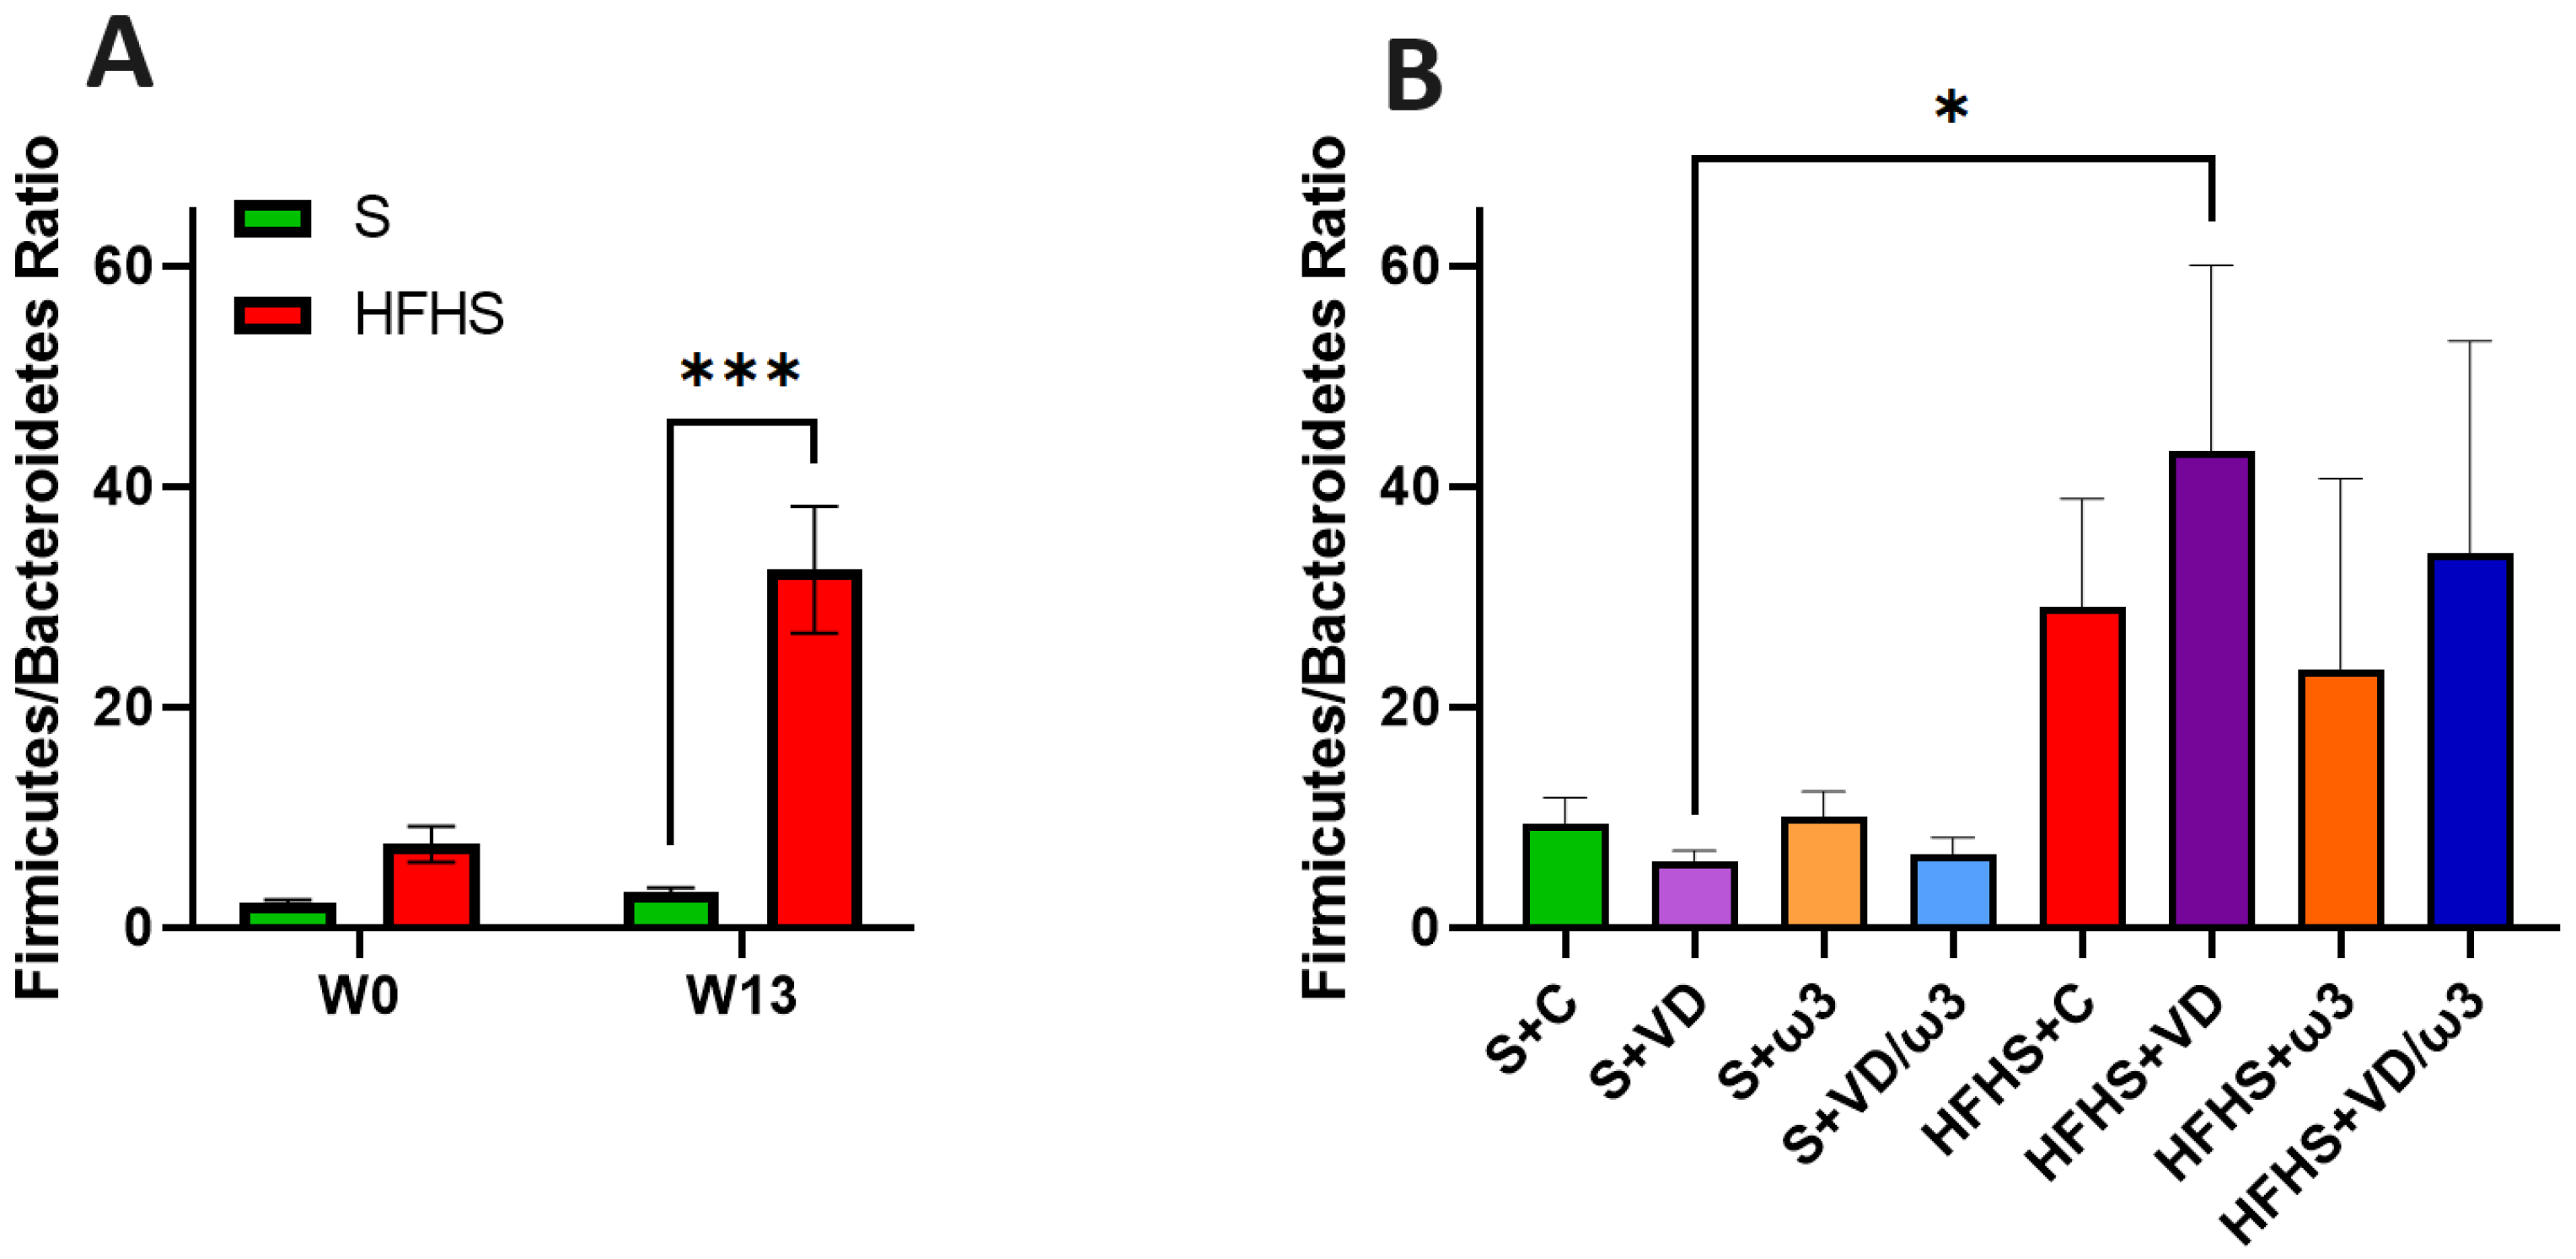
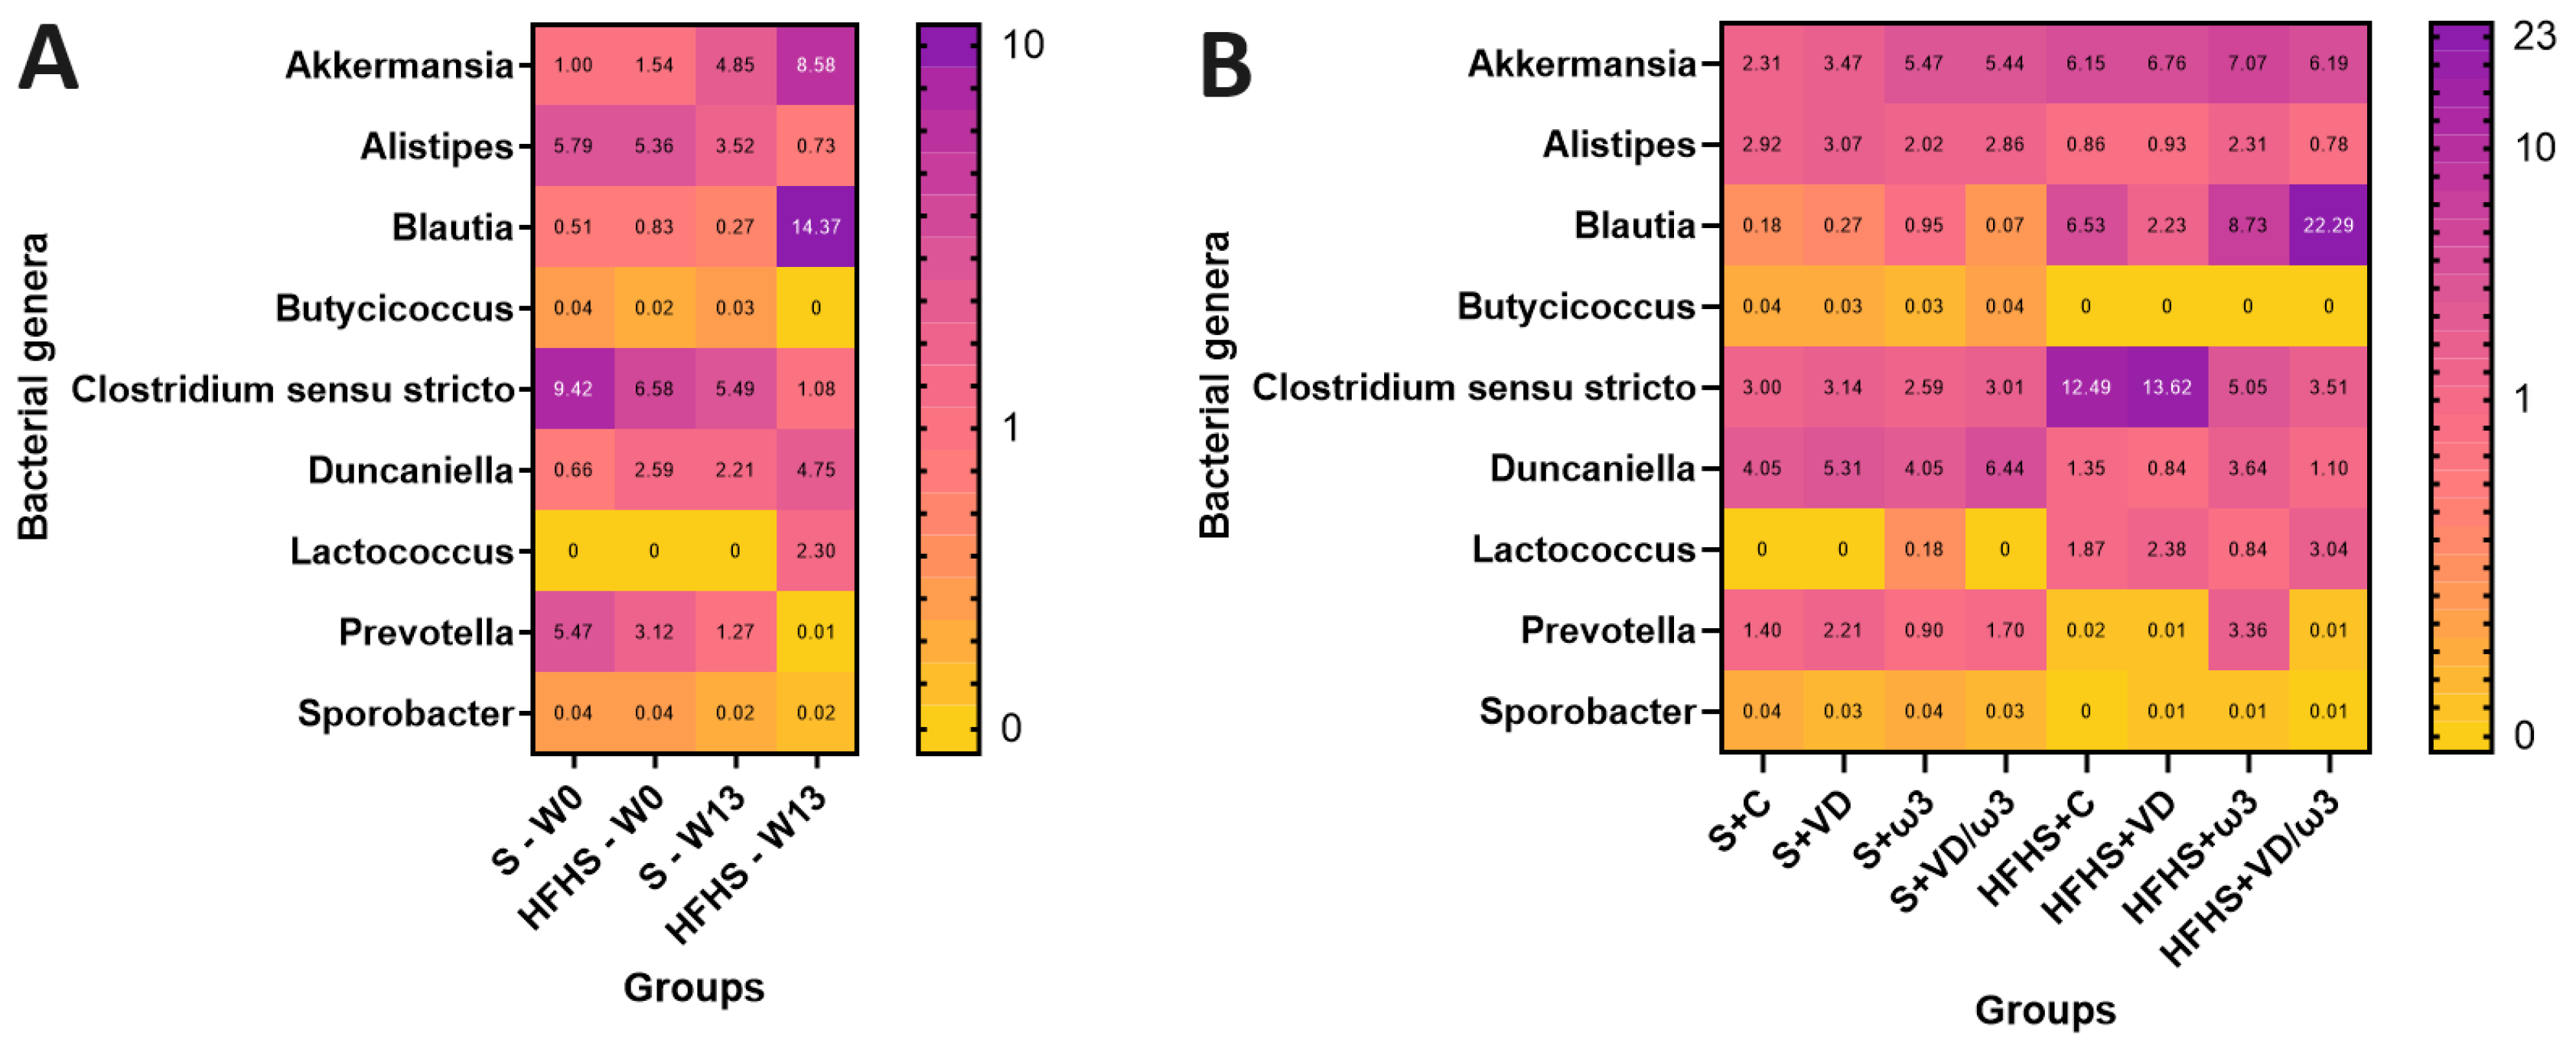
3.9. Intestinal Microbiota
4. Discussion
5. Conclusions
Author Contributions
Funding
Institutional Review Board Statement
Informed Consent Statement
Data Availability Statement
Acknowledgments
Conflicts of Interest
Abbreviations
References
- Phelps, N.H.; Singleton, R.K.; Zhou, B.; Heap, R.A.; Mishra, A.; Bennett, J.E.; Paciorek, C.J.; Lhoste, V.P.; Carrillo-Larco, R.M.; Stevens, G.A.; et al. Worldwide trends in underweight and obesity from 1990 to 2022: A pooled analysis of 3663 population-representative studies with 222 million children, adolescents, and adults. Lancet 2024, 403, 1027–1050. [Google Scholar] [CrossRef] [PubMed]
- Chandler, M.; Cunningham, S.; Lund, E.M.; Khanna, C.; Naramore, R.; Patel, A.; Day, M.J. Obesity and Associated Comorbidities in People and Companion Animals: A One Health Perspective. J. Comp. Pathol. 2017, 156, 296–309. [Google Scholar] [CrossRef] [PubMed]
- Longo, M.; Zatterale, F.; Naderi, J.; Parrillo, L.; Formisano, P.; Raciti, G.A.; Beguinot, F.; Miele, C. Adipose Tissue Dysfunction as Determinant of Obesity-Associated Metabolic Complications. Int. J. Mol. Sci. 2019, 20, 2358. [Google Scholar] [CrossRef] [PubMed]
- Rand, J.S. Diabetes Mellitus in Dogs and Cats. In Clinical Small Animal Internal Medicine; John Wiley & Sons: Hoboken, NJ, USA, 2020; Volume 1, pp. 93–102. [Google Scholar]
- Zheng, H.; Chen, C. Body Mass Index and Risk of Knee Osteoarthritis: Systematic Review and Meta-Analysis of Prospective Studies. BMJ Open 2015, 5, e007568. [Google Scholar] [CrossRef] [PubMed]
- Johnson, K.A.; Lee, A.H.; Swanson, K.S. Nutrition and Nutraceuticals in the Changing Management of Osteoarthritis for Dogs and Cats. J. Am. Vet. Med. Assoc. 2020, 256, 1335–1341. [Google Scholar] [CrossRef]
- Bastien, M.; Poirier, P.; Lemieux, I.; Després, J.P. Overview of Epidemiology and Contribution of Obesity to Cardiovascular Disease. Prog. Cardiovasc. Dis. 2014, 56, 369–381. [Google Scholar] [CrossRef]
- Wadden, T.A.; Tronieri, J.S.; Butryn, M.L. Lifestyle Modification Approaches for the Treatment of Obesity in Adults. Am. Psychol. 2020, 75, 235–251. [Google Scholar] [CrossRef]
- Krentz, A.J.; Fujioka, K.; Hompesch, M. Evolution of Pharmacological Obesity Treatments: Focus on Adverse Side-Effect Profiles. Diabetes Obes. Metab. 2016, 18, 558–570. [Google Scholar] [CrossRef]
- Yun, J.W. Possible Anti-Obesity Therapeutics from Nature—A Review. Phytochemistry 2010, 71, 1625–1641. [Google Scholar] [CrossRef] [PubMed]
- Santamarina, A.B.; Mennitti, L.V.; de Souza, E.A.; de Souza Mesquita, L.M.; Noronha, I.H.; Vasconcelos, J.R.C.; Prado, C.M.; Pisani, L.P. A Low-Carbohydrate Diet with Different Fatty Acids’ Sources in the Treatment of Obesity: Impact on Insulin Resistance and Adipogenesis. Clin. Nutr. 2023, 42, 2381–2394. [Google Scholar] [CrossRef]
- Peng, R. Effects of Low-Carbohydrate Diet on Body Weight and Glycolipid Metabolism in Normal Rats and Obese Rats. J. Shanghai Jiaotong Univ. Sci. 2020, 40, 44–50. [Google Scholar] [CrossRef]
- Kelly, T.; Unwin, D.; Finucane, F. Low-Carbohydrate Diets in the Management of Obesity and Type 2 Diabetes: A Review from Clinicians Using the Approach in Practice. Int. J. Env. Res. Public Health 2020, 17, 2557. [Google Scholar] [CrossRef]
- Lapik, I.A.; Galchenko, A.V.; Gapparova, K.M. Micronutrient Status in Obese Patients: A Narrative Review. Obes. Med. 2020, 18, 100224. [Google Scholar] [CrossRef]
- Haussler, M.R.; Whitfield, G.K.; Kaneko, I.; Haussler, C.A.; Hsieh, D.; Hsieh, J.C.; Jurutka, P.W. Molecular Mechanisms of Vitamin D Action. Calcif. Tissue Int. 2013, 92, 77–98. [Google Scholar] [CrossRef]
- Rad, E.Y.; Saboori, S.; Falahi, E.; Djalali, M. Vitamin D Supplementation Decreased Body Weight and Body Mass Index of Iranian Type-2 Diabetic Patients: A Randomised Clinical Trial Study. Mal. J. Nutr. 2018, 24, 1–9. [Google Scholar]
- Perna, S. Is Vitamin D Supplementation Useful for Weight Loss Programs? A Systematic Review and Meta-Analysis of Randomized Controlled Trials. Medicina 2019, 55, 368. [Google Scholar] [CrossRef]
- Chou, S.H.; Murata, E.M.; Yu, C.; Danik, J.; Kotler, G.; Cook, N.R.; Bubes, V.; Mora, S.; Chandler, P.D.; Tobias, D.K.; et al. Effects of Vitamin D3 Supplementation on Body Composition in the VITamin D and OmegA-3 TriaL (VITAL). J. Clin. Endocrinol. Metab. 2021, 106, 1377–1388. [Google Scholar] [CrossRef] [PubMed]
- Pathak, K.; Soares, M.J.; Calton, E.K.; Zhao, Y.; Hallett, J. Vitamin D Supplementation and Body Weight Status: A Systematic Review and Meta-Analysis of Randomized Controlled Trials. Obes. Rev. 2014, 15, 528–537. [Google Scholar] [CrossRef]
- Cannell, J.J.; Grant, W.B.; Holick, M.F. Vitamin D and Inflammation. Derm. Endocrinol. 2014, 6, e983401. [Google Scholar] [CrossRef]
- Li, X.; Liu, Y.; Zheng, Y.; Wang, P.; Zhang, Y. The Effect of Vitamin D Supplementation on Glycemic Control in Type 2 Diabetes Patients: A Systematic Review and Meta-Analysis. Nutrients 2018, 10, 375. [Google Scholar] [CrossRef] [PubMed]
- Blumberg, J.M.; Tzameli, I.; Astapova, I.; Lam, F.S.; Flier, J.S.; Hollenberg, A.N. Complex Role of the Vitamin D Receptor and Its Ligand in Adipogenesis in 3T3-L1 Cells. J. Biol. Chem. 2006, 281, 11205–11213. [Google Scholar] [CrossRef] [PubMed]
- Marcotorchino, J.; Tourniaire, F.; Astier, J.; Karkeni, E.; Canault, M.; Amiot, M.J.; Bendahan, D.; Bernard, M.; Martin, J.C.; Giannesini, B.; et al. Vitamin D Protects Against Diet-Induced Obesity by Enhancing Fatty Acid Oxidation. J. Nutr. Biochem. 2014, 25, 1077–1083. [Google Scholar] [CrossRef]
- Farhangi, M.A.; Mesgari-Abbasi, M.; Hajiluian, G.; Nameni, G.; Shahabi, P. Adipose Tissue Inflammation and Oxidative Stress: The Ameliorative Effects of Vitamin D. Inflammation 2017, 40, 1688–1697. [Google Scholar] [CrossRef] [PubMed]
- Chang, E. Effects of Vitamin D Supplementation on Adipose Tissue Inflammation and NF-κB/AMPK Activation in Obese Mice Fed a High-Fat Diet. Int. J. Mol. Sci. 2022, 23, 10915. [Google Scholar] [CrossRef] [PubMed]
- Imga, N.N.; Karci, A.C.; Oztas, D.; Berker, D.; Guler, S. Effects of Vitamin D Supplementation on Insulin Resistance and Dyslipidemia in Overweight and Obese Premenopausal Women. Arch. Med. Sci. 2019, 15, 598–606. [Google Scholar] [CrossRef]
- Sukik, A.; Alalwani, J.; Ganji, V. Vitamin D, Gut Microbiota, and Cardiometabolic Diseases—A Possible Three-Way Axis. Int. J. Mol. Sci. 2023, 24, 940. [Google Scholar] [CrossRef]
- Tangestani, H.; Boroujeni, H.K.; Djafarian, K.; Emamat, H.; Shab-Bidar, S. Vitamin D and The Gut Microbiota: A Narrative Literature Review. Clin. Nutr. Res. 2021, 10, 181–191. [Google Scholar] [CrossRef] [PubMed]
- de Andrade, A.M.; Fernandes, M.D.C.; de Fraga, L.S.; Porawski, M.; Giovenardi, M.; Guedes, R.P. Omega-3 Fatty Acids Revert High-Fat Diet-Induced Neuroinflammation but Not Recognition Memory Impairment in Rats. Metab. Brain Dis. 2017, 32, 1871–1881. [Google Scholar] [CrossRef]
- Wang, Y.X.; Lee, C.H.; Tiep, S.; Ruth, T.Y.; Ham, J.; Kang, H.; Evans, R.M. Peroxisome-Proliferator-Activated Receptor δ Activates Fat Metabolism to Prevent Obesity. Cell 2003, 113, 159–170. [Google Scholar] [CrossRef]
- Chen, C.; Yu, X.; Shao, S. Effects of Omega-3 Fatty Acid Supplementation on Glucose Control and Lipid Levels in Type 2 Diabetes: A Meta-Analysis. PLoS ONE 2015, 10, e0139565. [Google Scholar] [CrossRef] [PubMed]
- Grygiel-Górniak, B. Peroxisome Proliferator-Activated Receptors and Their Ligands: Nutritional and Clinical Implications—A Review. Nutr. J. 2014, 13, 17. [Google Scholar] [CrossRef] [PubMed]
- Juárez-López, C.; Klünder-Klünder, M.; Madrigal-Azcárate, A.; Flores-Huerta, S. Omega-3 Polyunsaturated Fatty Acids Reduce Insulin Resistance and Triglycerides in Obese Children and Adolescents. Pediatr. Diabetes 2013, 14, 377–383. [Google Scholar] [CrossRef]
- Oh, D.Y.; Walenta, E. Omega-3 Fatty Acids and FFAR4. Front. Endocrinol. 2014, 5, 115. [Google Scholar] [CrossRef]
- Sokoła-Wysoczańska, E.; Czyż, K.; Wyrostek, A. Different Sources of Omega-3 Fatty Acid Supplementation vs. Blood Lipid Profiles—A Study on a Rat Model. Foods 2024, 13, 385. [Google Scholar] [CrossRef] [PubMed]
- Zhao, Y.; Joshi-Barve, S.; Barve, S.; Chen, L.H. Eicosapentaenoic Acid Prevents LPS-Induced TNF-α Expression by Preventing NF-κB Activation. J. Am. Coll. Nutr. 2004, 23, 71–78. [Google Scholar] [CrossRef]
- Albracht-Schulte, K.; Kalupahana, N.S.; Ramalingam, L.; Wang, S.; Rahman, S.M.; Robert-McComb, J.; Moustaid-Moussa, N. Omega-3 fatty acids in obesity and metabolic syndrome: A mechanistic update. J. Nutr. Biochem. 2018, 1, 1–16. [Google Scholar] [CrossRef] [PubMed]
- Costantini, L.; Molinari, R.; Farinon, B.; Merendino, N. Impact of Omega-3 Fatty Acids on the Gut Microbiota. Int. J. Mol. Sci. 2017, 18, 2645. [Google Scholar] [CrossRef] [PubMed]
- Farsi, P.F.; Djazayery, A.; Eshraghian, M.R.; Koohdani, F.; Saboor-Yaraghi, A.A.; Derakhshanian, H.; Zarei, M.; Javanbakht, M.H.; Djalali, M. Effects of Supplementation with Omega-3 on Insulin Sensitivity and Non-Esterified Free Fatty Acid (NEFA) in Type 2 Diabetic Patients. Arq. Bras. Endocrinol. Metabol. 2014, 58, 335–340. [Google Scholar] [CrossRef]
- Siroma, T.K.; Machate, D.J.; Zorgetto-Pinheiro, V.A.; Figueiredo, P.S.; Marcelino, G.; Hiane, P.A.; Bogo, D.; Pott, A.; Cury, E.R.J.; Guimarães, R.D.C.A.; et al. Polyphenols and ω-3 PUFAs: Beneficial Outcomes to Obesity and Its Related Metabolic Diseases. Front. Nutr. 2022, 8, 781622. [Google Scholar] [CrossRef] [PubMed]
- Matias, A.M.; Estevam, W.M.; Coelho, P.M.; Haese, D.; Kobi, J.B.B.S.; Lima-Leopoldo, A.P.; Leopoldo, A.S. Differential Effects of High Sugar, High Lard or a Combination of Both on Nutritional, Hormonal and Cardiovascular Metabolic Profiles of Rodents. Nutrients 2018, 10, 1071. [Google Scholar] [CrossRef] [PubMed]
- Jensen, T.L.; Kiersgaard, M.K.; Sørensen, D.B.; Mikkelsen, L.F. Fasting of mice: A review. Lab. Anim. 2013, 47, 225–240. [Google Scholar] [CrossRef] [PubMed]
- Benedé-Ubieto, R.; Estévez-Vázquez, O.; Ramadori, P.; Cubero, F.J.; Nevzorova, J.A. Guidelines and Considerations for Metabolic Tolerance Tests in Mice. Diabetes Metab. Syndr. Obes. 2020, 13, 439–450. [Google Scholar] [CrossRef]
- Carper, D.; Coué, M.; Laurens, C.; Langin, D.; Moro, C. Reappraisal of the optimal fasting time for insulin tolerance tests in mice. Mol. Metab. 2020, 42, 101058. [Google Scholar] [CrossRef]
- Gu, L.; Ding, X.; Wang, Y.; Gu, M.; Zhang, J.; Yan, S.; Li, N.; Song, Z.; Yin, J.; Lu, L.; et al. Spexin Alleviates Insulin Resistance and Inhibits Hepatic Gluconeogenesis via the FoxO1/PGC-1α Pathway in High-Fat-Diet-Induced Rats and Insulin Resistant Cells. Int. J. Biol. Sci. 2019, 15, 2815–2829. [Google Scholar] [CrossRef] [PubMed]
- Nandhini, S. Association of Triglyceride–Glucose Index (TyG Index) with HbA1c and Insulin Resistance in Type 2 Diabetes Mellitus. Maedica 2021, 16, 375. [Google Scholar]
- Klindworth, A.; Pruesse, E.; Schweer, T.; Peplies, J.; Quast, C.; Horn, M.; Glöckner, F.O. Evaluation of General 16S Ribosomal RNA Gene PCR Primers for Classical and Next-Generation Sequencing-Based Diversity Studies. Nucleic Acids Res. 2013, 41, e1. [Google Scholar] [CrossRef]
- Ansorge, R.; Birolo, G.; James, S.A.; Telatin, A. Dadaist2: A Toolkit to Automate and Simplify Statistical Analysis and Plotting of Metabarcoding Experiments. Int. J. Mol. Sci. 2021, 22, 5309. [Google Scholar] [CrossRef]
- Kleiner, D.E.; Brunt, E.M.; Van Natta, M.; Behling, C.; Contos, M.J.; Cummings, O.W.; Ferrell, L.D.; Liu, Y.C.; Torbenson, M.S.; Unalp—Arida, A.; et al. Design and Validation of a Histological Scoring System for Nonalcoholic Fatty Liver Disease. Hepatology 2005, 41, 1313–1321. [Google Scholar] [CrossRef]
- Brunt, E.M.; Janney, C.G.; Di Bisceglie, A.M.; Neuschwander-Tetri, B.A.; Bacon, B.R. Nonalcoholic Steatohepatitis: A Proposal for Grading and Staging the Histological Lesions. Am. J. Coll. Gastroenterol. 1999, 94, 2467. [Google Scholar] [CrossRef]
- Pinheiro, J.; Bates, D. Mixed-Effects Models in S and S-PLUS; Springer Science & Business Media: Berlin/Heidelberg, Germany, 2006; 538p. [Google Scholar]
- Bretz, F.; Hothorn, T.; Westfall, P. Multiple Comparisons Using R; Chapman and Hall/CRC: Boca Raton, FL, USA, 2010; 205p. [Google Scholar]
- Hariri, N.; Thibault, L. High-Fat Diet-Induced Obesity in Animal Models. Nutr. Res. Rev. 2010, 23, 270–299. [Google Scholar] [CrossRef]
- Suzuki, T. Regulation of the Intestinal Barrier by Nutrients: The Role of Tight Junctions. Anim. Sci. J. 2020, 91, e13357. [Google Scholar] [CrossRef] [PubMed]
- Gomes Natal, D.I.; de Castro Moreira, M.E.; Soares Milião, M.; dos Anjos Benjamin, L.; de Souza Dantas, M.I.; Machado Rocha Ribeiro, S.; Duarte Martino, H.S. Ubá Mango Juices Intake Decreases Adiposity and Inflammation in High-Fat Diet-Induced Obese Wistar Rats. Nutrition 2016, 32, 1011–1018. [Google Scholar] [CrossRef]
- Woods, S.C.; Seeley, R.J.; Rushing, P.A.; D’Alessio, D.; Tso, P. A Controlled High-Fat Diet Induces an Obese Syndrome in Rats. J. Nutr. 2003, 133, 1081–1087. [Google Scholar] [CrossRef]
- Wu, Z.; Ma, Q.; Cai, S.; Sun, Y.; Zhang, Y.; Yi, J. Rhus chinensis Mill. Fruits Ameliorate Hepatic Glycolipid Metabolism Disorder in Rats Induced by High Fat/High Sugar Diet. Nutrients 2021, 13, 4480. [Google Scholar] [CrossRef]
- Ding, Q.; Zhang, B.; Zheng, W.; Chen, X.; Zhang, J.; Yan, R.; Zhang, T.; Yu, L.; Dong, Y.; Ma, B. Liupao Tea Extract Alleviates Diabetes Mellitus and Modulates Gut Microbiota in Rats Induced by Streptozotocin and High-Fat, High-Sugar Diet. Biomed. Pharmacother. 2019, 118, 109262. [Google Scholar] [CrossRef]
- Alipour, R.; Aryaeian, N.; Hajiluian, G.; Soleimani, M.; Barati, M. The Effect of the Saffron Intervention on NAFLD Status and Related Gene Expression in a Rat Model. Med. J. Islam. Repub. Iran 2023, 37, 28. [Google Scholar] [CrossRef]
- Roberts, J.S.; Perets, R.A.; Sarfert, K.S.; Bowman, J.J.; Ozark, P.A.; Whitworth, G.B.; Blythe, S.N.; Toporikova, N. High-Fat High-Sugar Diet Induces Polycystic Ovary Syndrome in a Rodent Model. Biol. Reprod. 2017, 96, 551–562. [Google Scholar] [CrossRef]
- Strable, M.S.; Ntambi, J.M. Genetic Control of de Novo Lipogenesis: Role in Diet-Induced Obesity. Crit. Rev. Biochem. Mol. Biol. 2010, 45, 199–214. [Google Scholar] [CrossRef]
- Haczeyni, F.; Bell-Anderson, K.S.; Farrell, G.C. Causes and Mechanisms of Adipocyte Enlargement and Adipose Expansion. Obes. Rev. 2018, 19, 406–420. [Google Scholar] [CrossRef] [PubMed]
- Frayn, K.N. Insulin Resistance and Lipid Metabolism. Curr. Opin. Lipidol. 1993, 4, 197–204. [Google Scholar] [CrossRef]
- Ali, A.T.; Hochfeld, W.E.; Myburgh, R.; Pepper, M.S. Adipocyte and Adipogenesis. Eur. J. Cell Biol. 2013, 92, 229–236. [Google Scholar] [CrossRef]
- Mitev, K.; Taleski, V. Association Between the Gut Microbiota and Obesity. Open Access Maced. J. Med. Sci. 2019, 7, 2050–2056. [Google Scholar] [CrossRef]
- Zhang, C.; Zhang, M.; Pang, X.; Zhao, Y.; Wang, L.; Zhao, L. Structural Resilience of the Gut Microbiota in Adult Mice Under High-Fat Dietary Perturbations. ISME J. 2012, 6, 1848–1857. [Google Scholar] [CrossRef] [PubMed]
- López-Cepero, A.A.; Palacios, C. Association of the Intestinal Microbiota and Obesity. Puerto Rico Health Sci. J. 2015, 34, 60–64. [Google Scholar]
- Turnbaugh, P.J.; Hamady, M.; Yatsunenko, T.; Cantarel, B.L.; Duncan, A.; Ley, R.E.; Sogin, M.L.; Jones, W.J.; Roe, B.A.; Affourtit, J.P.; et al. A Core Gut Microbiome in Obese and Lean Twins. Nature 2009, 457, 480–484. [Google Scholar] [CrossRef] [PubMed]
- Ley, R.E.; Bäckhed, F.; Turnbaugh, P.; Lozupone, C.A.; Knight, R.D.; Gordon, J.I. Obesity Alters Gut Microbial Ecology. Proc. Natl. Acad. Sci. USA 2005, 102, 11070–11075. [Google Scholar] [CrossRef]
- Weiss, G.A.; Hennet, T. Mechanisms and consequences of intestinal dysbiosis. Cell. Mol. Life Sci. 2017, 74, 2959–2977. [Google Scholar] [CrossRef]
- Cani, P.D.; Amar, J.; Iglesias, M.A.; Poggi, M.; Knauf, C.; Bastelica, D.; Neyrinck, A.M.; Fava, F.; Tuohy, K.M.; Chabo, C.; et al. Metabolic Endotoxemia Initiates Obesity and Insulin Resistance. Diabetes 2007, 56, 1761–1772. [Google Scholar] [CrossRef]
- Cani, P.D.; Delzenne, N.M.; Amar, J.; Burcelin, R. Role of Gut Microflora in the Development of Obesity and Insulin Resistance Following High-Fat Diet Feeding. Pathol. Biol. 2008, 56, 305–309. [Google Scholar] [CrossRef] [PubMed]
- Xiao, L.; Sonne, S.B.; Feng, Q.; Chen, N.; Xia, Z.; Li, X.; Fang, Z.; Zhang, D.; Fjære, E.; Midtbø, L.K.; et al. High-Fat Feeding Rather Than Obesity Drives Taxonomical and Functional Changes in the Gut Microbiota in Mice. Microbiome 2017, 5, 43. [Google Scholar] [CrossRef] [PubMed]
- Bailén, M.; Bressa, C.; Martínez-López, S.; González-Soltero, R.; Montalvo Lominchar, M.G.; San Juan, C.; Larrosa, M. Microbiota Features Associated with a High-Fat/Low-Fiber Diet in Healthy Adults. Front. Nutr. 2020, 7, 583608. [Google Scholar] [CrossRef] [PubMed]
- Becker, S.L.; Chiang, E.; Plantinga, A.; Carey, H.V.; Suen, G.; Swoap, S.J. Effect of Stevia on the Gut Microbiota and Glucose Tolerance in a Murine Model of Diet-Induced Obesity. FEMS Microbiol. Ecol. 2020, 96, fiaa079. [Google Scholar] [CrossRef] [PubMed]
- Hamilton, M.K.; Boudry, G.; Lemay, D.G.; Raybould, H.E. Changes in Intestinal Barrier Function and Gut Microbiota in High-Fat Diet-Fed Rats Are Dynamic and Region Dependent. Am. J. Physiol. Gastrointest. Liver Physiol. 2015, 308, 840–851. [Google Scholar] [CrossRef] [PubMed]
- Shibata, M.; Ozato, N.; Tsuda, H.; Mori, K.; Kinoshita, K.; Katashima, M.; Katsuragi, Y.; Nakaji, S.; Maeda, H. Mouse Model of Anti-Obesity Effects of Blautia hansenii on Diet-Induced Obesity. Curr. Issues Mol. Biol. 2023, 45, 7147–7160. [Google Scholar] [CrossRef]
- Shin, N.R.; Lee, J.C.; Lee, H.Y.; Kim, M.S.; Whon, T.W.; Lee, M.S.; Bae, J.W. An Increase in the Akkermansia spp. Population Induced by Metformin Treatment Improves Glucose Homeostasis in Diet-Induced Obese Mice. Gut 2014, 63, 727–735. [Google Scholar] [CrossRef]
- Burakova, I.; Smirnova, Y.; Gryaznova, M.; Syromyatnikov, M.; Chizhkov, P.; Popov, E.; Popov, V. The Effect of Short-Term Consumption of Lactic Acid Bacteria on the Gut Microbiota in Obese People. Nutrients 2022, 14, 3384. [Google Scholar] [CrossRef]
- Zeng, Q.; Li, D.; He, Y.; Li, Y.; Yang, Z.; Zhao, X.; Liu, Y.; Wang, Y.; Sun, J.; Feng, X.; et al. Discrepant Gut Microbiota Markers for the Classification of Obesity-Related Metabolic Abnormalities. Sci. Rep. 2019, 9, 13424. [Google Scholar] [CrossRef]
- Thingholm, L.B.; Rühlemann, M.C.; Koch, M.; Fuqua, B.; Laucke, G.; Boehm, R.; Bang, C.; Franzosa, E.A.; Hübenthal, M.; Rahnavard, A.; et al. Obese Individuals with and without Type 2 Diabetes Show Different Gut Microbial Functional Capacity and Composition. Cell Host Microbe 2019, 26, 252–264. [Google Scholar] [CrossRef] [PubMed]
- Takada, T.; Watanabe, K.; Makino, H.; Kushiro, A. Reclassification of Eubacterium desmolans as Butyricicoccus desmolans comb. nov., and description of Butyricicoccus faecihominis sp. nov., a butyrate-producing bacterium from human faeces. Int. J. Syst. Evol. Microbiol. 2016, 66, 4125–4131. [Google Scholar] [CrossRef] [PubMed]
- Duan, M.; Wang, Y.; Zhang, Q.; Zou, R.; Guo, M.; Zheng, H. Characteristics of gut microbiota in people with obesity. PLoS ONE 2021, 16, e0255446. [Google Scholar] [CrossRef]
- Wang, H.; Wang, Q.; Liang, C.; Su, M.; Wang, X.; Li, H.; Hu, H.; Fang, H. Acupuncture Regulating Gut Microbiota in Abdominal Obese Rats Induced by High-Fat Diet. Evid. Based Complement. Alternat. Med. 2019, 2019, e4958294. [Google Scholar] [CrossRef]
- Ley, R.E. Prevotella in the gut: Choose carefully. Nat. Rev. Gastroenterol. Hepatol. 2016, 13, 69–70. [Google Scholar] [CrossRef] [PubMed]
- Ibrahim, M.M. Subcutaneous and Visceral Adipose Tissue: Structural and Functional Differences. Obes. Rev. 2010, 11, 11–18. [Google Scholar] [CrossRef] [PubMed]
- Park, J.M.; Park, C.Y.; Han, S.N. High Fat Diet-Induced Obesity Alters Vitamin D Metabolizing Enzyme Expression in Mice. Biofactors 2015, 41, 175–182. [Google Scholar] [CrossRef] [PubMed]
- Park, C.Y.; Shin, Y.; Kim, J.H.; Zhu, S.; Jung, Y.S.; Han, S.N. Effects of High Fat Diet-Induced Obesity on Vitamin D Metabolism and Tissue Distribution in Vitamin D Deficient or Supplemented Mice. Nutr. Metab. 2020, 17, 44. [Google Scholar] [CrossRef]
- Holick, M.F. Vitamin D Deficiency. N. Engl. J. Med. 2007, 357, 266–281. [Google Scholar] [CrossRef] [PubMed]
- Chang, E.; Kim, Y. Vitamin D Insufficiency Exacerbates Adipose Tissue Macrophage Infiltration and Decreases AMPK/SIRT1 Activity in Obese Rats. Nutrients 2017, 9, 338. [Google Scholar] [CrossRef]
- Duque, G.; Macoritto, M.; Kremer, R. 1,25(OH)2D3 Inhibits Bone Marrow Adipogenesis in Senescence Accelerated Mice (SAM-P/6) by Decreasing the Expression of Peroxisome Proliferator-Activated Receptor Gamma 2 (PPARγ2). Exp. Gerontol. 2004, 39, 333–338. [Google Scholar] [CrossRef] [PubMed]
- Zhang, Y.G.; Lu, R.; Xia, Y.; Zhou, D.; Petrof, E.; Claud, E.C.; Sun, J. Lack of Vitamin D Receptor Leads to Hyperfunction of Claudin-2 in Intestinal Inflammatory Responses. Inflamm. Bowel. Dis. 2019, 25, 97–110. [Google Scholar] [CrossRef] [PubMed]
- Kolieb, E.; Maher, S.A.; Shalaby, M.N.; Alsuhaibani, A.M.; Alharthi, A.; Hassan, W.A.; El-Sayed, K. Vitamin D and Swimming Exercise Prevent Obesity in Rats under a High-Fat Diet via Targeting FATP4 and TLR4 in the Liver and Adipose Tissue. Int. J. Environ. Res. Public Health 2022, 19, 13740. [Google Scholar] [CrossRef] [PubMed]
- Dadrass, A.; Mohamadzadeh Salamat, K.; Hamidi, K.; Azizbeigi, K. Anti-inflammatory effects of vitamin D and resistance training in men with type 2 diabetes mellitus and vitamin D deficiency: A randomized, double-blinded, placebo-controlled clinical trial. J. Diabetes Metab. Disord. 2019, 18, 323–331. [Google Scholar] [CrossRef]
- Kono, K.; Fujii, H.; Nakai, K.; Goto, S.; Kitazawa, R.; Kitazawa, S.; Shinohara, M.; Hirata, M.; Fukagawa, M.; Nishi, S. Anti-Oxidative Effect of Vitamin D Analog on Incipient Vascular Lesion in Non-Obese Type 2 Diabetic Rats. Am. J. Nephrol. 2013, 37, 167–174. [Google Scholar] [CrossRef] [PubMed]
- Labudzynskyi, D.O.; Zaitseva, O.V.; Latyshko, N.V.; Gudkova, O.O.; Veliky, M.M. Vitamin D(3) contribution to the regulation of oxidative metabolism in the liver of diabetic mice. Ukr. Biochem. J. 2015, 87, 75–90. [Google Scholar] [CrossRef] [PubMed]
- Du, T.; Xiang, L.; Zhang, J.; Yang, C.; Zhao, W.; Li, J.; Zhou, Y.; Ma, L. Vitamin D Improves Hepatic Steatosis in NAFLD via Regulation of Fatty Acid Uptake and β-Oxidation. Front. Endocrinol. 2023, 14, 1138078. [Google Scholar] [CrossRef]
- Chang, E.; Kim, Y. Vitamin D Decreases Adipocyte Lipid Storage and Increases NAD-SIRT1 Pathway in 3T3-L1 Adipocytes. Nutrition 2016, 32, 702–708. [Google Scholar] [CrossRef] [PubMed]
- Botta, M.; Audano, M.; Sahebkar, A.; Sirtori, C.R.; Mitro, N.; Ruscica, M. PPAR Agonists and Metabolic Syndrome: An Established Role? Int. J. Mol. Sci. 2018, 19, 1197. [Google Scholar] [CrossRef]
- Jump, D.B.; Depner, C.M.; Tripathy, S. Omega-3 Fatty Acid Supplementation and Cardiovascular Disease: Thematic Review Series: New Lipid and Lipoprotein Targets for the Treatment of Cardiometabolic Diseases. J. Lipid Res. 2012, 53, 2525–2545. [Google Scholar] [CrossRef]
- Nandipati, K.C.; Subramanian, S.; Agrawal, D.K. Protein Kinases: Mechanisms and Downstream Targets in Inflammation-Mediated Obesity and Insulin Resistance. Mol. Cell Biochem. 2017, 426, 27–45. [Google Scholar] [CrossRef] [PubMed]
- Antraco, V.J.; Hirata, B.K.S.; de Jesus Simao, J.; Cruz, M.M.; da Silva, V.S.; da Cunha de Sa, R.D.C.; Abdala, F.M.; Armelin-Correa, L.; Alonso-Vale, M.I.C. Omega-3 Polyunsaturated Fatty Acids Prevent Nonalcoholic Steatohepatitis (NASH) and Stimulate Adipogenesis. Nutrients 2021, 13, 622. [Google Scholar] [CrossRef]
- Sahoo, D.K.; Heilmann, R.M.; Paital, B.; Patel, A.; Yadav, V.K.; Wong, D.; Jergens, A.E. Oxidative stress, hormones, and effects of natural antioxidants on intestinal inflammation in inflammatory bowel disease. Front. Endocrinol. 2023, 14, 1217165. [Google Scholar] [CrossRef] [PubMed]
- Valle, M.; Mitchell, P.L.; Pilon, G.; St-Pierre, P.; Varin, T.; Richard, D.; Vohl, M.C.; Jacques, H.; Delvin, E.; Levy, E.; et al. Cholecalciferol Supplementation Does Not Prevent the Development of Metabolic Syndrome or Enhance the Beneficial Effects of Omega-3 Fatty Acids in Obese Mice. J. Nutr. 2021, 151, 1175–1189. [Google Scholar] [CrossRef] [PubMed]
- Niramitmahapanya, S.; Harris, S.S.; Dawson-Hughes, B. Type of Dietary Fat Is Associated with the 25-Hydroxyvitamin D3 Increment in Response to Vitamin D Supplementation. J. Clin. Endocrinol. Metab. 2011, 96, 3170–3174. [Google Scholar] [CrossRef] [PubMed]
- Goncalves, A.; Gleize, B.; Roi, S.; Nowicki, M.; Dhaussy, A.; Huertas, A.; Amiot, M.J.; Reboul, E. Fatty Acids Affect Micellar Properties and Modulate Vitamin D Uptake and Basolateral Efflux in Caco-2 Cells. J. Nutr. Biochem. 2013, 24, 1751–1757. [Google Scholar] [CrossRef]


| S (n = 31) | HFHS (n = 32) | |
|---|---|---|
| BW W0 (g) | 314.21 ± 3.55 | 300.47 ± 2.91 ** |
| BW W13 (g) | 547.45 ± 7.76 | 628.77 ± 10.77 *** |
| BW Gain W0–W13 (%) | 74.31 ± 3.61 | 109.03 ± 4.70 *** |
| BMI W0 (g/cm2) | 0.595 ± 0.008 | 0.551 ± 0.004 *** |
| BMI W13 (g/cm2) | 0.724 ± 0.009 | 0.751 ± 0.008 * |
| BMI Evolution W0–W13 (%) | 22.17 ± 3.87 | 36.46 ± 2.81 *** |
| AC W0 (cm) | 14.25 ± 0.12 | 13.75 ± 0.12 ** |
| AC W13 (cm) | 17.40 ± 0.11 | 18.49 ± 0.22 *** |
| AC Evolution W0–W13 (%) | 22.29 ± 2.30 | 34.57 ± 2.82 *** |
| FE (%) W0–W13 | 2.36 ± 0.11 | 3.44 ± 0.14 *** |
| S+C (n = 7) | S+VD (n = 8) | S+ω3 (n = 8) | S+VD/ω3 (n = 8) | HFHS+C (n = 8) | HFHS+VD (n = 7) | HFHS+ω3 (n = 7) | HFHS+VD/ω3 (n = 6) | |
|---|---|---|---|---|---|---|---|---|
| BW W13 (g) | 547.00 ± 10.33 | 535.55 ± 22.02 b | 568.78 ± 13.62 | 538.44 ± 11.91 d | 605.85 ± 15.81 | 655.49 ± 27.25 b | 621.14 ± 16.93 | 632.61 ± 24.22 d |
| BW W26 (g) | 637.03 ± 11.72 a | 610.41 ± 28.39 b | 633.76 ± 18.85 | 627.49 ± 17.42 d | 699.24 ± 25.22 a | 722.03 ± 30.76 b | 698.44 ± 25.03 | 693.63 ± 24.47 d |
| BW Gain W13–W26 (%) | 12.28 ± 1.04 | 11.94 ± 1.47 | 13.09 ± 0.89 | 15.28 ± 1.76 d | 14.14 ± 1.90 | 10.76 ± 0.57 | 11.95 ± 2.23 | 8.90 ± 1.13 d |
| BMI W13 (g/cm2) | 0.733 ± 0.021 | 0.697 ± 0.016 | 0.742 ± 0.017 | 0.725 ± 0.016 | 0.726 ± 0.017 | 0.762 ± 0.020 | 0.758 ± 0.012 | 0.760 ± 0.016 |
| BMI W26 (g/cm2) | 0.754 ± 0.012 a | 0.729 ± 0.021 b | 0.757 ± 0.017 | 0.748 ± 0.021 d | 0.837 ± 0.014 a | 0.812 ± 0.027 b | 0.781 ± 0.021 | 0.824 ± 0.020 d |
| BMI Evolution W13-W26 (%) | 5.71 ± 2.26 a | 4.56 ± 1.95 | 3.27 ± 2.63 | 3.40 ± 2.92 | 15.58 ± 2.00 a,e,f | 7.23 ± 1.18 e | 1.85 ± 3.11 f | 9.57 ± 1.14 |
| AC W13 (cm) | 17.56 ± 0.19 | 17.05 ± 0.26 | 17.76 ± 0.16 | 17.25 ± 0.22 d | 17.75 ± 0.42 | 18.56 ± 0.51 | 18.85 ± 0.45 | 18.79 ± 0.35 d |
| AC W26 (cm) | 17.99 ± 0.24 a | 17.43 ± 0.46 b | 17.99 ± 0.27 | 17.91 ± 0.31 d | 20.00 ± 0.37 a | 19.17 ± 0.48 b | 18.46 ± 0.25 | 19.10 ± 0.28 d |
| AC Evolution W13-W26 (%) | 0.82 ± 1.43 a | 1.63 ± 1.77 | 2.02 ± 2.07 | 3.89 ± 1.76 | 12.91 ± 2.23 a,f,g | 4.77 ± 1.94 | −2.37 ± 2.36 f | 2.74 ± 1.73 g |
| FE (%) W13-W26 | 0.77 ± 0.06 | 0.78 ± 0.10 | 0.87 ± 0.06 | 0.97 ± 0.09 | 1.11 ± 0.16 | 0.79 ± 0.04 | 0.88 ± 0.18 | 0.84 ± 0.08 |
| AI (%) | 4.16 ± 0.18 a | 3.96 ± 0.19 b | 4.18 ± 0.24 c | 4.40 ± 0.30 d | 6.07 ± 0.25 a | 5.01 ± 0.20 b | 5.51 ± 0.30 c | 5.64 ± 0.36 d |
| S (n = 31) | HFHS (n = 32) | |
|---|---|---|
| AUC in the OGTT W0 | 16,791 ± 238 | 15,880 ± 140 ** |
| AUC in the OGTT W13 | 15,222 ± 186 | 18,635 ± 218 *** |
| FBG W0 (mg/dL) | 102.6 ± 1.7 | 103.5 ± 1.6 |
| FBG W13 (mg/dL) | 95.2 ± 1.2 | 107.6 ± 1.2 *** |
| FBI W0 (µg/L) | 0.955 ± 0.068 | 0.964 ± 0.082 |
| FBI W13 (µg/L) | 1.242 ± 0.115 | 1.856 ± 0.221 * |
| HOMA-IR W0 | 6.01 ± 0.46 | 6.01 ± 0.53 |
| HOMA-IR W13 | 7.33 ± 0.73 | 12.26 ± 1.47 ** |
| S+C (n = 7) | S+VD (n = 8) | S+ω3 (n = 8) | S+VD/ω3 (n = 8) | HFHS+C (n = 8) | HFHS+VD (n = 7) | HFHS+ω3 (n = 7) | HFHS+VD/ω3 (n = 6) | |
|---|---|---|---|---|---|---|---|---|
| AUC in the OGTT W13 | 15,244 ± 446 a | 15,344 ± 357 b | 15,144 ± 317 c | 15,160 ± 417 d | 18,877 ± 310 a | 17,903 ± 306 b | 18,770 ± 399 c | 18,902 ± 605 d |
| AUC in the OGTT W26 | 14,637 ± 500 a | 15,275 ± 332 | 15,236 ± 350 | 15,234 ± 334 | 20,183 ± 515 a,e,f,g | 16,615 ± 427 e | 16,495 ± 408 f | 16,345 ± 338 g |
| FBG W13 (mg/dL) | 97.9 ± 3.2 a | 95.0 ± 1.4 b | 95.1 ± 2.4 c | 93.1 ± 2.5 d | 110.0 ± 2.8 a | 107.8 ± 2.5 b | 105.9 ± 2.0 c | 106.6 ± 2.7 d |
| FBG W26 (mg/dL) | 95.7 ± 3.5 a | 93.2 ± 3.4 | 97.1 ± 2.7 | 94.6 ± 2.5 | 112.4 ± 1.8 a,e | 98.8 ± 4.0 e | 104.6 ± 1.8 | 101.0 ± 3.2 |
| FBI W13 (µg/L) | 1.070 ± 0.185 | 1.344 ± 0.243 | 1.479 ± 0.248 | 1.052 ± 0.230 | 1.571 ± 0.199 | 2.379 ± 0.773 | 1.706 ± 0.194 | 1.768 ± 0.364 |
| FBI W26 (µg/L) | 3.949 ± 0.446 | 4.171 ± 0.744 | 4.598 ± 0.547 | 4.211 ± 0.612 d | 4.969 ± 0.685 | 5.949 ± 0.644 | 4.434 ± 0.545 | 6.982 ± 0.901 d |
| HOMA-IR W13 | 6.44 ± 1.16 | 7.77 ± 1.34 | 8.78 ± 1.67 | 6.21 ± 1.56 | 10.58 ± 1.30 | 15.72 ± 5.13 | 11.13 ± 1.28 | 11.63 ± 2.51 |
| HOMA-IR W26 | 23.26 ± 2.82 | 23.07 ± 3.79 | 27.47 ± 3.36 | 24.10 ± 3.37 d | 34.28 ± 4.82 | 33.92 ± 4.14 | 28.12 ± 3.17 | 43.24 ± 5.91 d |
| S (n = 31) | HFHS (n = 32) | |
|---|---|---|
| TC W0 (mmol/L) | 2.07 ± 0.06 | 2.04 ± 0.05 |
| TC W13 (mmol/L) | 2.28 ± 0.09 | 2.10 ± 0.07 |
| TGs W0 (mmol/L) | 1.54 ± 0.09 | 1.34 ± 0.10 |
| TGs W13 (mmol/L) | 1.56 ± 0.09 | 2.03 ± 0.17 * |
| HDL W0 (mmol/L) | 1.38 ± 0.04 | 1.40 ± 0.04 |
| HDL W13 (mmol/L) | 1.44 ± 0.06 | 1.23 ± 0.05 * |
| TyG Index W0 | 8.80 ± 0.06 | 8.64 ± 0.07 |
| TyG Index W13 | 8.74 ± 0.06 | 9.06 ± 0.09 ** |
| S+C (n = 7) | S+VD (n = 7) | S+ω3 (n = 8) | S+VD/ω3 (n = 8) | HFHS+C (n = 8) | HFHS+VD (n = 7) | HFHS+ω3 (n = 7) | HFHS+VD/ω3 (n = 6) | |
|---|---|---|---|---|---|---|---|---|
| TC W13 (mmol/L) | 2.33 ± 0.17 | 2.37 ± 0.24 | 2.17 ± 0.12 | 2.27 ± 0.16 | 1.89 ± 0.08 | 2.21 ± 0.21 | 2.06 ± 0.13 | 2.24 ± 0.11 |
| TC W26 (mmol/L) | 2.44 ± 0.17 | 2.41 ± 0.19 | 1.73 ± 0.14 | 2.00 ± 0.18 | 2.08 ± 0.17 | 2.44 ± 0.22 | 2.07 ± 0.20 | 1.83 ± 0.12 |
| TGs W13 (mmol/L) | 1.37 ± 0.18 | 1.58 ± 0.23 | 1.54 ± 0.13 | 1.75 ± 0.16 | 1.54 ± 0.24 | 2.25 ± 0.40 | 2.34 ± 0.42 | 1.99 ± 0.30 |
| TGs W26 (mmol/L) | 1.15 ± 0.12 | 0.97 ± 0.10 | 0.83 ± 0.14 | 0.92 ± 0.11 | 1.72 ± 0.14 g | 0.93 ± 0.15 | 0.88 ± 0.15 | 0.69 ± 0.04 g |
| HDL W13 (mmol/L) | 1.48 ± 0.10 | 1.48 ± 0.15 | 1.37 ± 0.08 | 1.43 ± 0.12 | 1.15 ± 0.07 | 1.23 ± 0.17 | 1.20 ± 0.11 | 1.35 ± 0.07 |
| HDL W26 (mmol/L) | 1.47 ± 0.12 | 1.42 ± 0.12 | 1.13 ± 0.09 | 1.27 ± 0.12 | 1.32 ± 0.11 | 1.53 ± 0.13 | 1.39 ± 0.14 | 1.27 ± 0.07 |
| TyG Index W13 | 8.61 ± 0.17 | 8.73 ± 0.14 | 8.76 ± 0.08 | 8.85 ± 0.11 | 8.83 ± 0.18 | 9.15 ± 0.22 | 9.20 ± 0.17 | 9.07 ± 0.16 |
| TyG Index W26 | 8.46 ± 0.13 | 8.25 ± 0.11 | 8.10 ± 0.13 | 8.19 ± 0.15 | 9.03 ± 0.10 f,g | 8.25 ± 0.16 | 8.24 ± 0.14 f | 8.01 ± 0.07 g |
| S+C (n = 7) | S+VD (n = 7) | S+ω3 (n = 8) | S+VD/ω3 (n = 8) | HFHS+C (n = 8) | HFHS+VD (n = 7) | HFHS+ω3 (n = 7) | HFHS+VD/ω3 (n = 6) | |
|---|---|---|---|---|---|---|---|---|
| Leptin W13 (pg/mL) | 19.48 ± 8.67 a | 42.31 ± 16.68 b | 19.21 ± 7.45 c | 45.46 ± 21.03 d | 118.62 ± 28.83 a | 217.57 ± 52.08 b | 169.53 ± 32.53 c | 215.15 ± 55.11 d |
| Leptin W26 (pg/mL) | 85.37 ± 17.10 a | 99.41 ± 9.88 b | 115.86 ± 15.25 c | 130.28 ± 37.67 d | 377.71 ± 32.24 a | 297.00 ± 48.32 b | 297.72 ± 29.24 c | 357.49 ± 52.96 d |
| Leptin Evolution W13–W26 (pg/mL) | 62.20 ± 13.45 a | 51.05 ± 15.05 | 89.82 ± 13.45 | 84.82 ± 25.16 | 259.08 ± 44.06 a,e | 86.86 ± 25.64 e | 127.73 ± 27.20 | 134.34 ± 67.19 |
| Adiponectin W13 (ng/mL) | 7383 ± 331 | 6861 ± 270 | 7140 ± 287 | 7352 ± 239 | 7217 ± 190 | 7454 ± 204 | 7970 ± 197 | 8088 ± 187 |
| Adiponectin W26 (ng/mL) | 6522 ± 257 | 6588 ± 287 | 6970 ± 267 | 7178 ± 172 d | 7353 ± 319 | 6827 ± 589 | 7497 ± 352 | 8062 ± 298 d |
| Adiponectin Evolution W13-W26 (ng/mL) | −427 ± 290 | −391 ± 203 | −113 ± 390 | −175 ± 206 | 136 ± 198 | −574 ± 579 | −373 ± 340 | −95 ± 137 |
| S+C (n = 7) | S+VD (n = 7) | S+ω3 (n = 8) | S+VD/ω3 (n = 8) | HFHS+C (n = 8) | HFHS+VD (n = 7) | HFHS+ω3 (n = 7) | HFHS+VD/ω3 (n = 6) | |
|---|---|---|---|---|---|---|---|---|
| Calcidiol W13 (ng/mL) | 92.93 ± 3.01 | 85.22 ± 8.26 | 64.92 ± 8.50 | 80.58 ± 7.33 | 86.33 ± 6.53 | 75.62 ± 8.90 | 71.21 ± 5.38 | 88.83 ± 4.17 |
| Calcidiol W26 (ng/mL) | 75.45 ± 6.62 h,i | 117.09 ± 1.81 h | 80.02 ± 7.64 | 117.88 ± 2.79 i | 77.63 ± 5.45 e,g | 120.02 ± 2.60 e | 70.84 ± 6.94 | 118.75 ± 4.26 g |
| Calcidiol Evolution W13-W26 (%) | −19.00 ± 6.40 | 55.47 ± 19.87 | 43.72 ± 15.18 | 57.84 ± 20.25 | −5.00 ± 11.14 e | 90.10 ± 34.96 e | 7.18 ± 19.57 | 35.13 ± 12.69 |
Disclaimer/Publisher’s Note: The statements, opinions and data contained in all publications are solely those of the individual author(s) and contributor(s) and not of MDPI and/or the editor(s). MDPI and/or the editor(s) disclaim responsibility for any injury to people or property resulting from any ideas, methods, instructions or products referred to in the content. |
© 2024 by the authors. Licensee MDPI, Basel, Switzerland. This article is an open access article distributed under the terms and conditions of the Creative Commons Attribution (CC BY) license (https://creativecommons.org/licenses/by/4.0/).
Share and Cite
Le Jan, D.; Siliman Misha, M.; Destrumelle, S.; Terceve, O.; Thorin, C.; Larcher, T.; Ledevin, M.; Desfontis, J.-C.; Betti, E.; Mallem, Y. Omega-3 Fatty Acid and Vitamin D Supplementations Partially Reversed Metabolic Disorders and Restored Gut Microbiota in Obese Wistar Rats. Biology 2024, 13, 1070. https://doi.org/10.3390/biology13121070
Le Jan D, Siliman Misha M, Destrumelle S, Terceve O, Thorin C, Larcher T, Ledevin M, Desfontis J-C, Betti E, Mallem Y. Omega-3 Fatty Acid and Vitamin D Supplementations Partially Reversed Metabolic Disorders and Restored Gut Microbiota in Obese Wistar Rats. Biology. 2024; 13(12):1070. https://doi.org/10.3390/biology13121070
Chicago/Turabian StyleLe Jan, Dylan, Mohamed Siliman Misha, Sandrine Destrumelle, Olivia Terceve, Chantal Thorin, Thibaut Larcher, Mireille Ledevin, Jean-Claude Desfontis, Eric Betti, and Yassine Mallem. 2024. "Omega-3 Fatty Acid and Vitamin D Supplementations Partially Reversed Metabolic Disorders and Restored Gut Microbiota in Obese Wistar Rats" Biology 13, no. 12: 1070. https://doi.org/10.3390/biology13121070
APA StyleLe Jan, D., Siliman Misha, M., Destrumelle, S., Terceve, O., Thorin, C., Larcher, T., Ledevin, M., Desfontis, J.-C., Betti, E., & Mallem, Y. (2024). Omega-3 Fatty Acid and Vitamin D Supplementations Partially Reversed Metabolic Disorders and Restored Gut Microbiota in Obese Wistar Rats. Biology, 13(12), 1070. https://doi.org/10.3390/biology13121070