Article

Risk Assessment and Sources Apportionment of Toxic Metals in Two Commonly Consumed Fishes from a Subtropical Estuarine Wetland System

1
Department of Fisheries and Marine Science, Noakhali Science and Technology University, Noakhali 3814, Bangladesh
2
Atmospheric and Environmental Chemistry Laboratory, Chemistry Division, Atomic Energy Centre, Dhaka 1000, Bangladesh
3
Department of Zoology, College of Science, King Saud University, P.O. Box 2455, Riyadh 11451, Saudi Arabia
4
Environmental and Life Sciences Programme, Faculty of Science, Universiti Brunei Darussalam, Jalan Tungku Link, Gadong BE1410, Brunei
5
School of Engineering and Built Environment, Griffith University, Brisbane, QLD 4111, Australia
*
Authors to whom correspondence should be addressed.
Biology 2024, 13(4), 260; https://doi.org/10.3390/biology13040260
Submission received: 25 February 2024 / Revised: 8 April 2024 / Accepted: 12 April 2024 / Published: 14 April 2024

Abstract

:

Simple Summary

This study analyzes muscle and gill samples from 36 samples of 2 popular edible fishes from a subtropical wetland ecosystem to determine the amounts of harmful heavy metals, such as Pb, Hg, Zn, Cu, and Cr. The metal concentrations in the muscle and gills fluctuate, with zinc having the greatest concentration. Pb and Hg levels are higher than those that are acceptable for human consumption, while Cu, Zn, and Cr levels are within safe bounds. High amounts of Zn, Cu, and Cr may pose health hazards, according to risk indices. The research also highlights sources of heavy metals that are caused by humans and the natural world, highlighting the necessity of continual control and monitoring to guarantee the safety of fish for human consumption.

Abstract

The widespread occurrence of heavy metals in aquatic environments, resulting in their bioaccumulation within aquatic organisms like fish, presents potential hazards to human health. This study investigates the concentrations of five toxic heavy metals (Pb, Hg, Zn, Cu, and Cr) and their potential health implications in two economically important fish species (Otolithoides pama and Labeo bata) from a subtropical estuarine wetland system (Feni estuary, Bangladesh). Muscle and gill samples from 36 individual fish were analyzed using energy dispersive X-ray fluorescence (EDXRF). The results revealed that the average quantities of heavy metals in both fishes’ muscle followed the declining order of Zn (109.41–119.93 mg/kg) > Cu (45.52–65.43 mg/kg) > Hg (1.25–1.39 mg/kg) > Pb (0.68–1.12 mg/kg) > Cr (0.31–5.82 mg/kg). Furthermore, Zn was found to be present in the highest concentration within the gills of both species. While the levels of Cu, Zn, and Cr in the fish muscle were deemed acceptable for human consumption, the concentrations of Pb and Hg exceeded the permissible limits (>0.5 mg/kg) for human consumption. Different risk indices, including estimated daily intake (EDI), target hazard quotient (THQ), hazard index (HI), and carcinogenic or target risk (TR), revealed mixed and varying degrees of potential threat to human health. According to the EDI values, individuals consuming these fish may face health risks as the levels of Zn, Cu, and Cr in the muscle are either very close to or exceed the maximum tolerable daily intake (MTDI) threshold. Nevertheless, the THQ and HI values suggested that both species remained suitable for human consumption, as indicated by THQ (<1) and HI (<1) values. Carcinogenic risk values for Pb, Cr, and Zn all remained within permissible limits, with TR values falling below the range of (10−6 to 10−4), except for Zn, which exceeded it (>10−4). The correlation matrix and multivariate principal component analysis (PCA) findings revealed that Pb and Cr primarily stemmed from natural geological backgrounds, whereas Zn, Cu, and Hg were attributed to human-induced sources such as agricultural chemicals, silver nanoparticles, antimicrobial substances, and metallic plating. Given the significance of fish as a crucial and nutritious element of a balanced diet, it is essential to maintain consistent monitoring and regulation of the levels and origins of heavy metals found within it.

1. Introduction

Long-lasting toxic metals, recognized for their enduring presence in the environment, are significant pollutants capable of inducing detrimental effects such as cytotoxicity, mutagenicity, and carcinogenicity in organisms [1,2,3,4]. These contaminants penetrate aquatic ecosystems through various pathways, encompassing surface runoff, untreated wastewater and sewage discharge, deposition of airborne dust and aerosols, agricultural fertilizer application, electronic waste, and industrial effluents [5,6,7,8,9,10]. Geogenic metals can originate from various geological processes, including volcanic activity, mineral formation, and weathering of rocks. Ultimately, these metals enter the food chain, accumulating in aquatic organisms and eventually in humans, leading to persistent adverse effects on human health [11,12].
Both humans and animals come into contact with toxic metals through various pathways of exposure, such as ingestion or dermal contact [11]. As an example, the toxicity of inorganic arsenic (As) can lead to issues such as abdominal pain, vomiting, and diarrhea. Lead (Pb), deemed a non-essential element, can have detrimental health impacts including liver and kidney damage, disruption of skeletal hematopoietic function, and ultimately, fatalities [12]. Chromium (Cr) plays a significant role in insulin function and lipid metabolism. Excessive intake of chromium may lead to pulmonary disorders along with liver and renal dysfunction [13]. Mercury (Hg) is deemed highly toxic, posing a lethal threat to both humans and other organisms. Ingesting high levels of zinc (Zn) can cause gastrointestinal symptoms such as nausea, vomiting, abdominal cramps, and diarrhea. Additionally, prolonged exposure to elevated levels of zinc can potentially damage the liver and kidneys, leading to impaired liver function and kidney failure [11,14].
Fish, serving as a valuable source of high-quality protein and essential micronutrients, holds significant importance in the human diet, particularly in developing nations such as Bangladesh. Moreover, fish serve as widely recognized bio-indicators for assessing heavy metal contamination in aquatic environments, attributed to their capacity for metal accumulation over time [14]. Consequently, the metal concentrations observed in fish tissues and organs are considered indicative of metal levels in water and their subsequent accumulation within the food chain [13]. Therefore, it is crucial to conduct investigations into the accumulation of potentially harmful heavy metals in key fish species and their various organs [14,15,16,17] to ensure that fish consumption does not become a pathway for the transfer of heavy metals to humans [18,19]. Otolithoides pama and Labeo bata are two widely distributed keystone species within estuarine habitats in Bangladesh, playing a vital role in ecosystem functioning and stability. They are omnivores and herbivores, respectively, and can tolerate a wide range of salinity. As commercially important fish species, these species support the livelihoods of many communities through fisheries and aquaculture activities, contributing to food security and economic development. Conservation efforts aimed at protecting these species are essential for maintaining the ecological balance of estuarine ecosystems and sustaining the socio-economic well-being of dependent neighboring communities.
Both nationally and internationally, regulatory bodies set guidelines and standards for acceptable levels of heavy metals in food, including fish [14]. In addition to these guideline values, various indices such as estimated daily intake (EDI), target hazard quotient (THQ), hazard index (HI), and cancer risk (CR) have been established and are widely employed in assessing ecological and human health risks associated with heavy metal contamination. Evaluating these values assists in determining compliance with regulatory standards [15]. The estimation of EDI provides insights into the quantity of heavy metals individuals are likely to consume daily through fish consumption. THQ, HI, and CR calculations further evaluate potential health risks associated with this exposure, taking into account factors like contaminant concentration in fish and consumption patterns [18]. Exceeding permissible limits may lead to regulatory actions and advisories aimed at safeguarding public health.
The Feni River estuary in Bangladesh plays an important role in meeting local and national protein demands by providing diversified fish and fishery products. However, the estuary is currently experiencing heavy metal contamination, with multiple contributing factors identified. These include population growth, agricultural practices, discharge of industrial and medical waste, haphazard population settlements, fish farming, washing activities, discharge of poultry waste, recreational pursuits, and improper disposal of untreated domestic effluents [20]. While numerous studies have investigated heavy metal contamination in fish globally [13,14,15,16,17,18,21], as well as in various estuaries in Bangladesh, such as the lower Meghna estuary, upper Meghna estuary, and Karnaphuli estuary [4,22,23,24,25,26,27], there is a lack of data on heavy metal contamination and associated human health risks in edible fishes from the Feni River estuarine system. Previous research by Islam et al. [20] indicated sediment contamination in the estuary by certain metals and suggested further investigation at the organismal level. Thus, this study marks the initial step in assessing the concentrations of selected heavy metals (Pb, Hg, Zn, Cu, and Cr) in the muscle and gill tissues of two commonly consumed fish species, Otolithoides pama (Hamilton, 1822) and Labeo bata (Hamilton, 1822), from the Feni River estuarine system. This study is important, as it allows for a comparison of the Feni River with other aquatic systems, estuaries in particular, and with other species with similar niches. This study aims to explore the following inquiries: (i) What are the concentrations of toxic metals in commonly consumed fish species in the Feni River estuary and what health risks may arise from the consumption of these fish due to their toxic metal content? And (ii) what are the main sources of toxic metal contamination affecting these fish species?

2. Materials and Methods
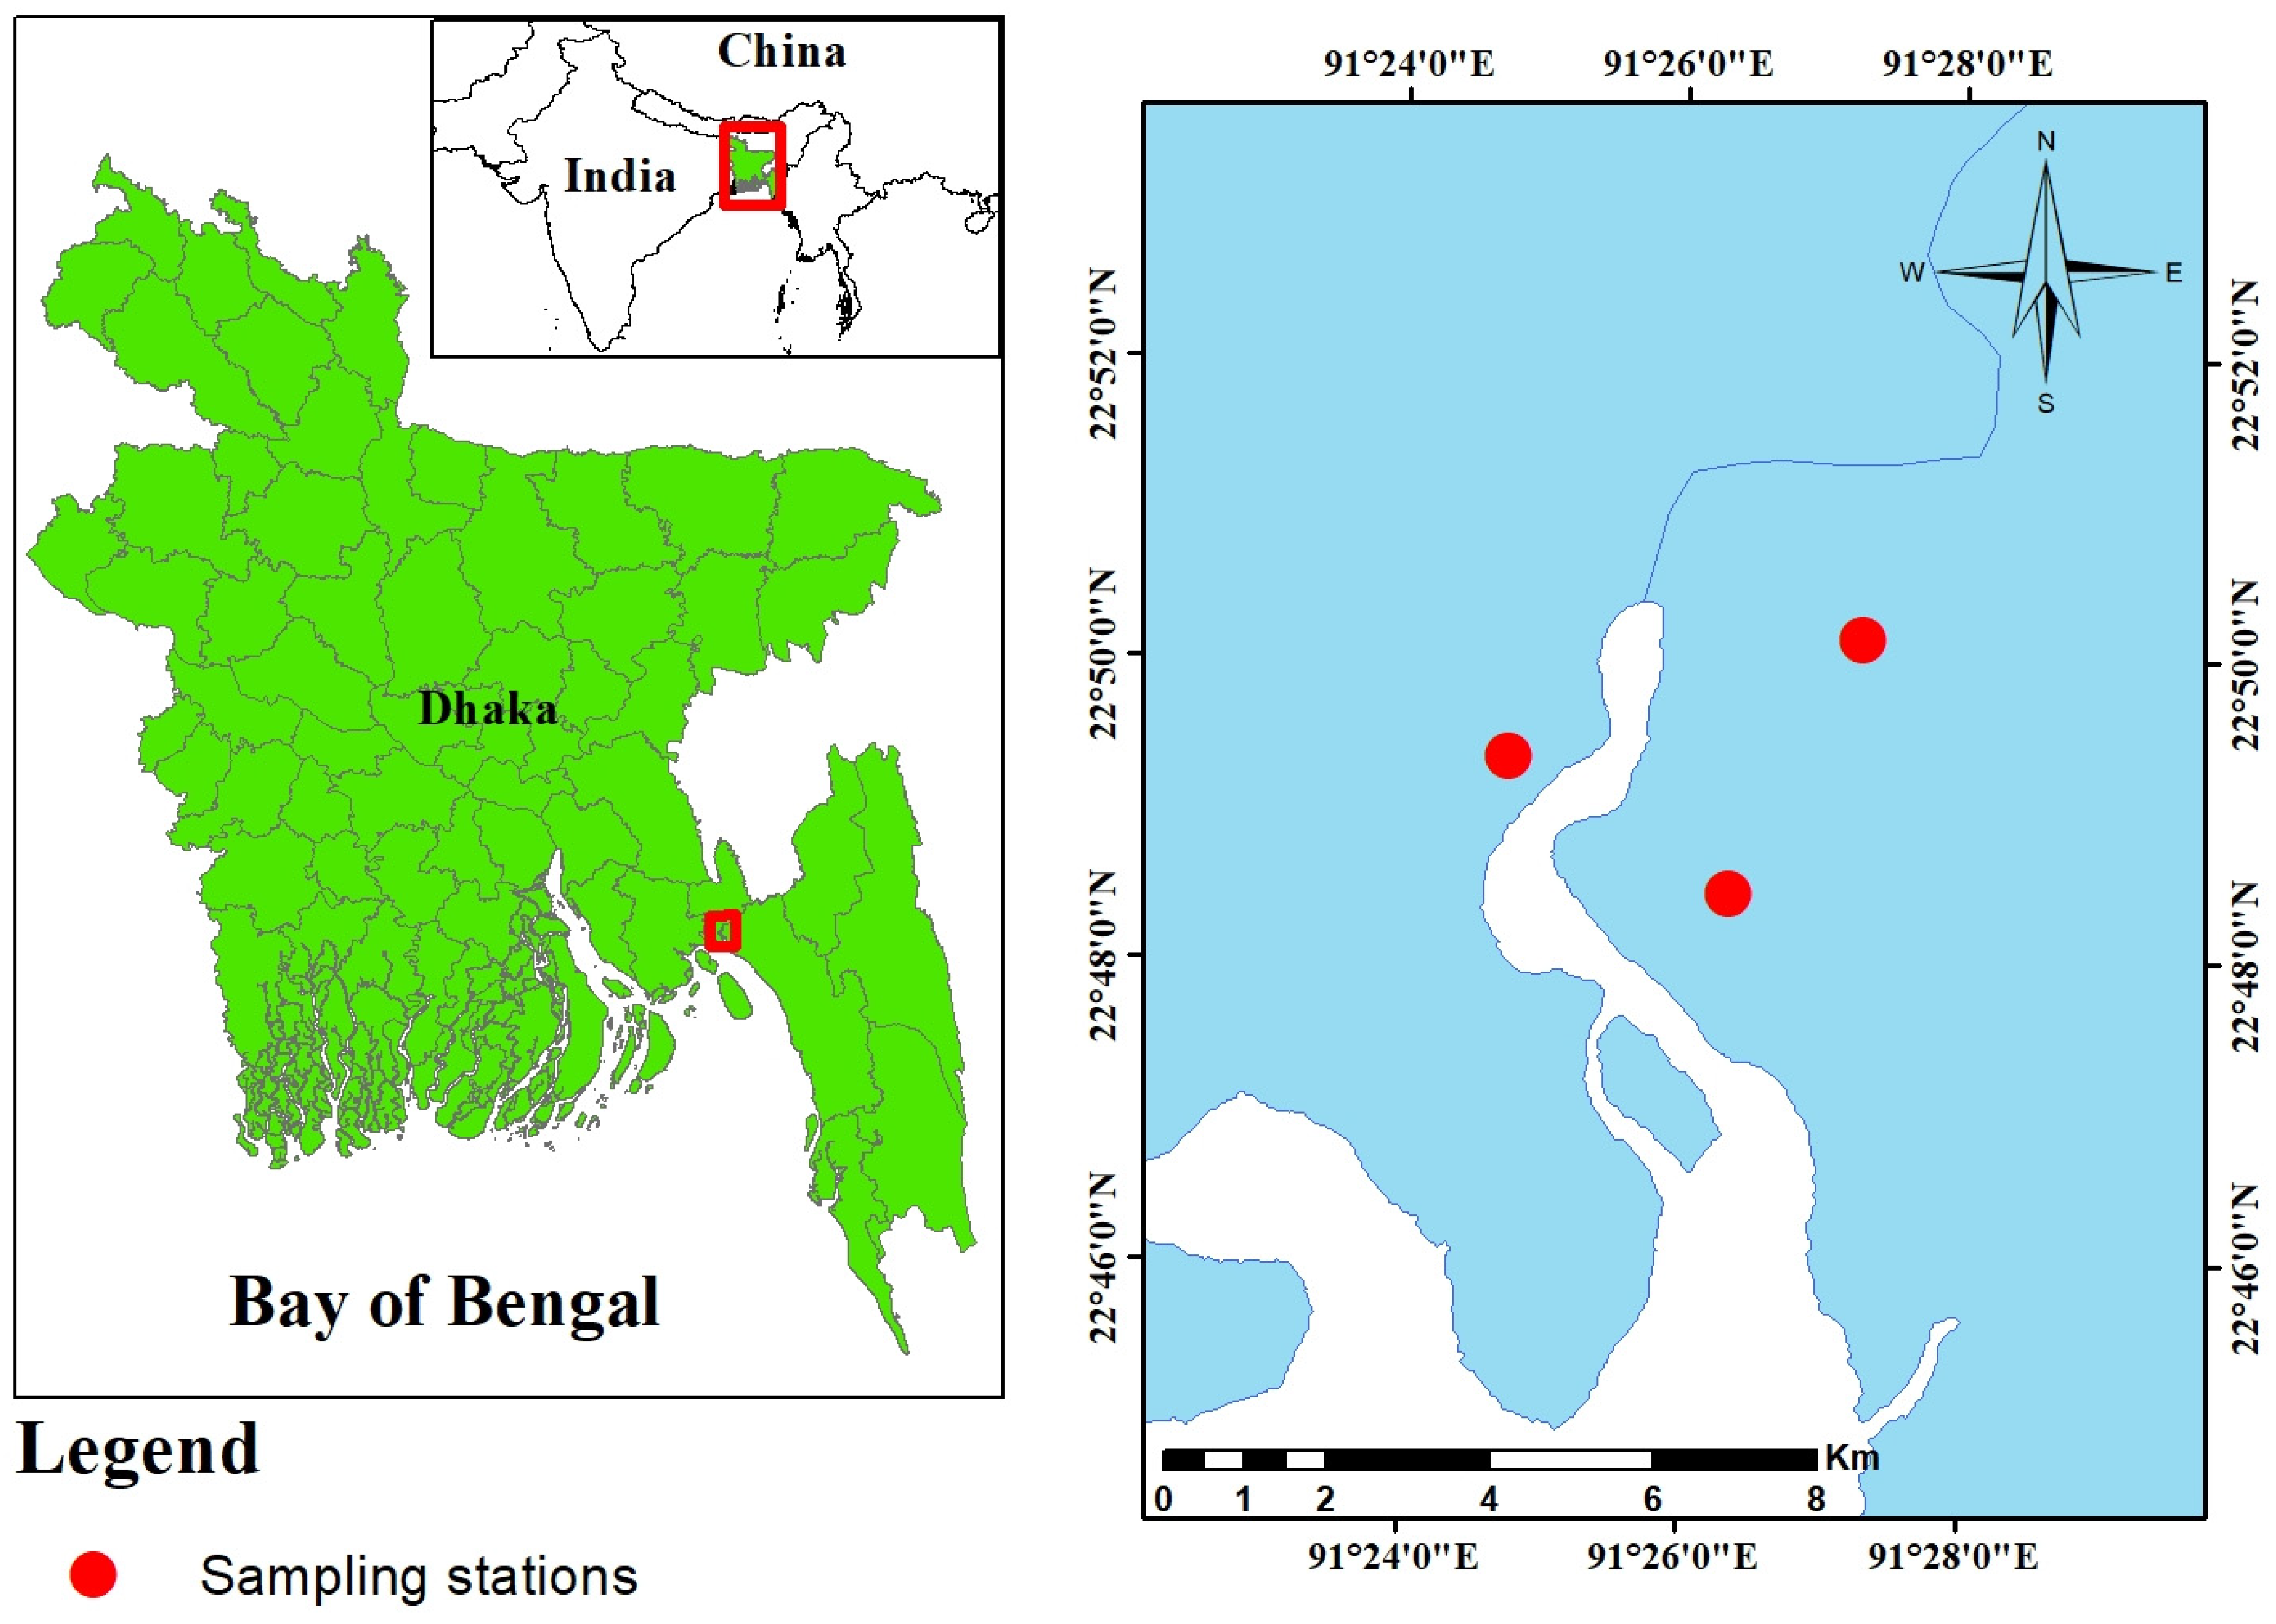
2.1. Study Area

The Feni River estuary is located in the southeastern part of Bangladesh, positioned between 22°46′44″ N latitude and 91°22′42″ E longitude (Figure 1) [20]. Originating from the hill ranges of Tripura district, India, this river travels 116 km, passing through several towns and cities in Bangladesh and India before arriving in the Bay of Bengal [20]. The estuary is utilized for harvesting fish, irrigation, the aquaculture sector, raising cattle, cleaning, relaxation, brick-building, releasing sewage, disposing of household trash, and water-based transportation. The area experiences a predominantly seasonal rainfall pattern, with rains occurring from June to November and a dry period spanning December to May. The average annual rainfall measures 3302 mm, and the annual temperature ranges from a maximum of 34.3 °C to a minimum of 14.4 °C [20]. Flowing into the Bay of Bengal, the estuary exhibits salinity levels ranging from 4.20 to 7.50 ppt, with a mean value of 5.78 ± 1.32 ppt [28]. The study area experiences heavy rainfall and annual flooding, shaping fertile alluvial plains along the Feni River. As a result, most catchment areas are conducive to cultivating both temporary and permanent crops, including rice, red pepper, potato, wheat, beans, bananas, tomato, sunflower, and sugarcane [20].

2.2. Fish Species Selection and Sample Collection

Fish species selection for this study involved a focus group discussion with fishermen, retailers, and local residents to ensure economic significance and year-round abundance. Ultimately, O. pama and L. bata were chosen for investigation due to their native freshwater habitat across Bangladesh, including rivers, streams, floodplains, estuarine, and coastal areas. A total of 36 fish samples (Table 1), 6 from each species at each of the 3 sampling sites (S1–S3), were collected along the coast using a mid-water trawl net in February 2021 (Figure 1). The distance between each sampling site was approximately 3 km. Following collection, the samples were promptly preserved in an ice box containing dry ice cubes and transported to the laboratory at the earliest convenience.

2.3. Laboratory Analysis

The weight and length of each collected fish were recorded, and subsequently, the edible portions and gills of each individual were stored separately (Table 1). Following this, the samples were transported to the Atmospheric and Environmental Chemistry Laboratory at the Atomic Energy Centre in Dhaka, Bangladesh. The laboratory analysis procedures were detailed by Hossain et al. [4]. In the laboratory, each fish sample underwent cleaning and rinsing with deionized water. Subsequently, the fish were diced using a stainless steel knife sanitized with acetone and hot distilled water prior to use. For metal analysis, both fish flesh and gills were placed in a beaker and subjected to ashing in a muffle furnace at 300 °C for 3 h. The resulting ash samples were then ground into a powder using a carbide mortar and pestle. The powdered sample was compressed into pellets measuring 2.5 cm in diameter using a hydraulic press pellet maker (Specac Ltd, Orpington, UK) with a pressure of 7 tons. Then, the pellet was placed in EDXRF ( energy-dispersive X-ray fluorescence) system for metal analysis. Irradiation of all samples was conducted according to a time-based program controlled by software provided by the EDXRF system. Standard materials underwent irradiation under identical experimental conditions to establish calibration curves for quantitative elemental determination in the respective samples. The concentrations of various elements in fish samples were determined using energy-dispersive X-ray fluorescence (EDXRF) spectrometry. To ensure quality assurance and control (QA/QC), standard reference materials were prepared and analyzed following the same procedure as employed for the experimental samples. The precision, as indicated by the relative standard deviation of the samples, consistently ranged between 3 and 5%. The analyzed accuracy, determined by the relative error for standard reference materials, was below 5%, and the recovery percentage for standard reference materials was between 94 and 106% (Table S1). During the analysis, analytical blanks and standard reference materials were run to validate data and confirm the accuracy and precision of the analytical method. The detection limits (DL) for the metals were as follows: Pb = 0.01, Hg = 0.005, Zn = 1.00, Cu = 0.03, and Cr = 0.3. Metal contents were expressed in mg/kg wet weight of fresh fish.

2.4. Health Risk Assessment

2.4.1. Target Hazard Quotient

The Target Hazard Quotient (THQ) serves as an indicator of the risk associated with exposure to pollutants [29]. The ratio values below suggest that there are no substantial chronic-toxic risks. The equation utilized to calculate THQ is as follows:
THQ = (EF × ED × FIR × CF × CM)/(WAB × ATn × RfD) × 10−3
Here, EF represents exposure frequency (365 days/year) [30], ED denotes exposure duration (70 years for non-cancer risk, following USEPA guidelines [29] and Yi et al. [31]. FIR stands for fish ingestion rate (7 g/person/day) [32], CF is the conversion factor (0.2) used to convert fresh weight (Fw) to dry weight (Dw) [33]. CM represents metal concentration in fish (mg/kg Dw), WAB denotes the average body weight (60 kg) [34], ATn represents the average exposure time for non-carcinogens (EF×ED) as utilized in characterizing non-cancer risk, and RfD is the reference dose of the metal (3.0 × 10⁻⁴ mg/kg/day for Hg, 1.0 × 10⁻³ mg/kg/day for Cd, 4.0 × 10⁻³ mg/kg/day for Pb, 3.0 × 10⁻⁴ mg/kg/day for As, and 4.0 × 10⁻² mg/kg/day for Cu) [29].

2.4.2. Hazard Index (HI)

Considering the assumption of cumulative effects arising from a combination of trace elements in fish, the hazard index (HI) was utilized to assess the risk associated with multiple contaminants, using the following approach:
HI = Σ THQs
where ‘s’ is the different trace elements [35].

2.4.3. Target Cancer Risk

In the context of carcinogens, the risks are assessed based on the additional probability of an individual developing cancer over their lifetime due to exposure to a potential carcinogen, termed the incremental or excess individual lifetime cancer risk [36]. Acceptable risk levels for carcinogens typically fall within the range of 104 to 106 [37]. The Target Cancer Risk model (TR) is determined by multiplying the oral carcinogenic potency slope of inorganic As by its exposure level, and it is employed to estimate the carcinogenic risk associated with inorganic As over a lifetime [35]. The following formula was used:
TR = (EF × ED × FIR × CPSo × CM)/(WAB × ATn) × 103
Here, CPSo stands for the oral carcinogenic potency slope. Among the examined trace metals, arsenic (As) is recognized for its carcinogenic properties [35].

2.4.4. Estimated Daily Intake (EDI)

The daily intake of metals is influenced by both the concentrations of metals in food and the daily food consumption [38]. The estimated daily intake (EDI) is determined through the following equation:
EDI = CM × [(DC fish)/BW]
Here, CM represents the concentration of heavy metals in fish muscles (mg/kg). DC denotes the daily fish consumption (g/day) per capita for the Bangladeshi population (7 g/day). Lastly, BW signifies the average body weight of an adult in Bangladesh (60 kg) [32].

2.4.5. Source Identification

In order to identify probable origins of pollution, principal component analysis (PCA) was applied to the heavy metals determined in the gill and muscle tissues of the studied fish species. The loading plot and the scores were used to explain the associations between the variables (heavy metals) and the samples (fish species) [4,20]. The most commonly used multivariate statistical tactic, the correlation matrix (Pearson’s correlation), was also utilized for searching the noteworthy correlations between the heavy metals in the studied samples.

3. Results and Discussion

3.1. Heavy Metals Concentration in Fish Species

The mean concentrations of Pb, Hg, Zn, Cu, and Cr in the muscle and gill of the studied species (O. pama and L. bata) from the Feni River estuary are presented in Table 2. The analyzed heavy metals in both fishes’ muscles followed the decreasing order of Zn > Cu > Hg > Pb > Cr. The maximum concentration of Zn, Pb, and Cr was observed in the muscle of L. bata, whereas O. pama had the highest load of Cu and Hg. In the case of gills, Zn and Cu were found abundantly in both species. In the gills, the highest concentration of Zn was recorded in L. bata, while Cu exhibited the highest concentration in O. pama (Table 2). The variation in metal concentration among fish could be attributed to their feeding habits, ecological needs, metabolism, and accumulation capacity of each species [39,40]. However, statistically, the average metallic concentrations per species did not vary significantly (p > 0.05).
Additionally, the average concentration of metals in the benthic fishes was found to be higher in the previous studies [4,41]. The O. pama species shows omnivorous behavior, where they consume a variety of food items including algae, aquatic plants, small invertebrates, and detritus found in their habitat. The fish species L. bata typically exhibits herbivorous feeding habits, primarily consuming algae, aquatic plants, and detritus present in its habitat.
Previous studies reported sediment as the primary pathway through which fish uptake heavy metals, as they ingest human substances and benthic invertebrates present in the sediment. [40,42]. Hence, benthopelagic fish may exhibit higher metal load than pelagic fish [41,43], which is also consistent with the present findings, indicating that the presence of metal in fish is not only influenced by the feeding habit but also the habitat they graze on [44,45,46,47].
The results of this study were compared to findings from various studies of tropical Asian regions (Table 3), revealing that the metals analyzed (Pb, Hg, Zn, Cu, and Cr) were also detected in fish muscle and gills from diverse geographic locations. While the concentrations of Zn and Cu in fish muscle were higher compared to the studied fish species from the Red Sea, Egypt [33], Mediterranean Sea, Turkey [48,49], and Gulf of Cambay, India [50], they remained within the standard values outlined by the FAO [51] indicating that despite higher levels in comparison to other regions, they did not exceed internationally recognized safety thresholds. However, the concentrations of Pb and Hg in fish muscle in this study exceeded the established standards (Table 3). In our study, the levels of Pb, Zn, and Cr observed in fish gills were notably lower than those reported in fish sampled from the contaminated Bangshi River [52]. This stark difference can be attributed to the pronounced contamination issues plaguing the Bangshi River, including unregulated discharge from the Dhaka Export Processing Zone (DEPZ) and the adjacency of pharmaceutical industries, poultry farms, and a tannery along its banks. In contrast, the Feni River estuary, while facing its environmental challenges, does not exhibit the same degree of heavy metal pollution as observed in the Bangshi River. Nevertheless, the presence of these metals in this study aligns with previous research on fish muscles [31,33]. Metals such as Pb and Hg are commonly associated with sediments and are vital sources of contamination for benthic fish [53]. Moreover, the probable sources of Hg in the Feni River estuary are linked to industrial discharges and the deposition of atmospheric pollutants from coal-fired brickfields along the river [54]. Conversely, Cu and Cr in the aquatic environment may originate from textiles, dyeing and tanning industries, photography, battery production, paint and ink manufacturing, and runoff from upstream agricultural fields [20,52,55].

3.2. Health Risk Assessment

Metal concentrations in fish muscle were utilized to evaluate the potential health risks posed to the local population through fish consumption. Risk indices were computed by comparing these concentrations with the maximum permissible limits for human consumption set by the Food and Agriculture Organization [51]. The results indicated that the levels of Pb and Hg detected in the muscle tissue of the analyzed fish surpassed the recommended threshold of 0.5 mg/kg. In contrast, Zn and Cu concentrations in all samples were below the FAO guidelines (Table 3).

3.2.1. Target Hazard Quotient (THQ) and Hazard Index (HI)

The target hazard quotient (THQ) was computed for each heavy metal present in the fish species under examination, with a recommended threshold of 1 [29]. THQ values below 1 suggest that the exposure level falls beneath the reference dose, indicating unlikely adverse effects over an individual’s lifetime [31]. In this investigation, THQ values ranked in descending order as follows: Hg > Cu > Cr > Zn > Pb, for both fish species (Table 4). Nevertheless, the THQ values for all examined metals at various stations and across all species remained within safe limits for human consumption.
Furthermore, the hazard index (HI) was determined for all metals. An HI exceeding 1 signifies the potential toxicity and health hazards posed by the metals [65,66,67]. The findings of this research revealed that O. pama exhibited a higher HI value compared to L. bata, yet both were deemed safe for consumption.

3.2.2. Target Lifetime Carcinogenic Risk (TR)

The Target Cancer Risk (TR) from consuming fish was assessed for Pb, Cr, and Zn. The TR for Pb, Zn, and Cr in fish is an important measure used to evaluate the potential health hazards of consuming fish contaminated with these heavy metals. The metric indicates the projected likelihood of an individual acquiring cancer throughout their lifespan due to exposure to these particular pollutants. In this study, the average TR values for Pb, Cr, and Zn from the consumption of O. pama were found to be 2.632 × 10⁻⁶, 8.542 × 10⁻⁴, and 1.438 × 10⁻³, respectively (Table 5). Conversely, in the case of L. bata, the TR values for Pb, Cr, and Zn were 3.422 × 10⁻⁶, 4.969 × 10⁻⁴, and 1.365 × 10⁻³, respectively (Table 5). These results indicate that the estimated carcinogenic risk associated with consuming L. bata is lower compared to O. pama for the heavy metals analyzed. Although the results show very low risks, they suggest that individuals consuming O. pama may have a slightly higher risk of developing cancer over their lifetime due to exposure to Cr, and Zn compared to those consuming L. bata. As per established guidelines, a TR value of 1 × 10⁻⁶ is commonly used as a benchmark for acceptable risk in environmental and public health risk assessments. TR values below this threshold are typically considered to pose an acceptable level of risk and above cause significant risk. For fish, these TR values are typically grouped into three categories: TR < 10−6 is considered negligible, 10−6 < TR < 10−4 falls within an acceptable range, and TR > 10−4 is deemed unacceptable [36,37,68]. In this study, carcinogenic risk values for Pb and Cr were found to be within acceptable limits (Table 5). However, for Zn, the risk exceeded the acceptable limit (Table 5). Despite the examined fish species being considered safe for human consumption in the present study, there is a potential risk of developing cancer with continuous consumption of over 70 years. Nevertheless, it is crucial to acknowledge that the definition of “safe” can differ based on the context and the unique conditions of the exposure. Moreover, there may be variations in regulatory norms across different countries or areas. Hence, it is necessary to refer to pertinent standards and laws that are specific to the particular location of concern to ascertain safe TR values for fish intake.

3.2.3. Estimated Daily Intake (EDI) of Heavy Metals

The estimated daily intake (EDI) of heavy metals provides valuable insight into the quantity of these contaminants that individuals are likely consuming basis. This method highlights the levels of nutrients, contaminants, and bioactive compounds ingested, offering valuable insights into potential dietary deficiencies or exposure to food element [69]. The intake data can then be utilized to analyze a specific element of interest. This study assessed the dietary exposure to five trace elements (Pb, Hg, Zn, Cu, and Cr) through the consumption of fish in a regular human diet and measures the dietary intake. Table 6 displays the estimated daily intake (EDI) of heavy metals for O. pama and L. bata. The findings suggest that the EDI values for all elements examined were greater in O. pama than in L. bata, except for Pb. On average, consumers of O. pama are projected to have a higher intake of metals such as Hg, Cr, and Zn compared to consumers of L. bata. Nevertheless, the consumption of Pb was greater for L. bata. The data indicate that there could be differences in the accumulation and distribution of metals between the two fish species. Specifically, O. pama may have higher amounts of some metals in their tissues compared to L. bata.
To evaluate the potential health risk to consumers, the findings were compared to the maximum tolerable daily intake (MTDI) for heavy metals (Table 6). The guideline value signifies the upper limit of a specific metal that an individual can ingest daily throughout their lifetime without encountering any negative health consequences [38]. It serves as a benchmark for evaluating the safety of consuming food and determining the acceptable quantities of heavy metals in food samples. Regulatory bodies normally determine MTDI values through scientific evaluations of the toxicity and health concerns linked to exposure to particular heavy metals. In this study, the EDI values for Hg and Zn in both fish species surpassed the maximum tolerable daily intake (MTDI) limit. These findings suggest that people who eat these types of fish may be at risk of absorbing levels of mercury and zinc beyond the recommended safe daily intake for a lifetime, which could lead to negative health consequences. The surpassing of the maximum tolerable daily intake levels for Hg and Pb raises concerns over the potential health hazards linked to the intake of fish, which may result in heavy metal exposure. Mercury (Hg) is specifically recognized for its ability to cause damage to the nervous system, while consuming too much Zn can result in digestive problems and other health complications [37]. Hence, these findings emphasize the significance of monitoring the levels of heavy metals in fish and implementing steps to reduce exposure, to guarantee food safety and safeguard public health. Nevertheless, these figures consider variables such as an individual’s body weight, the rate at which a substance is absorbed, and the possible cumulative consequences of prolonged exposure.

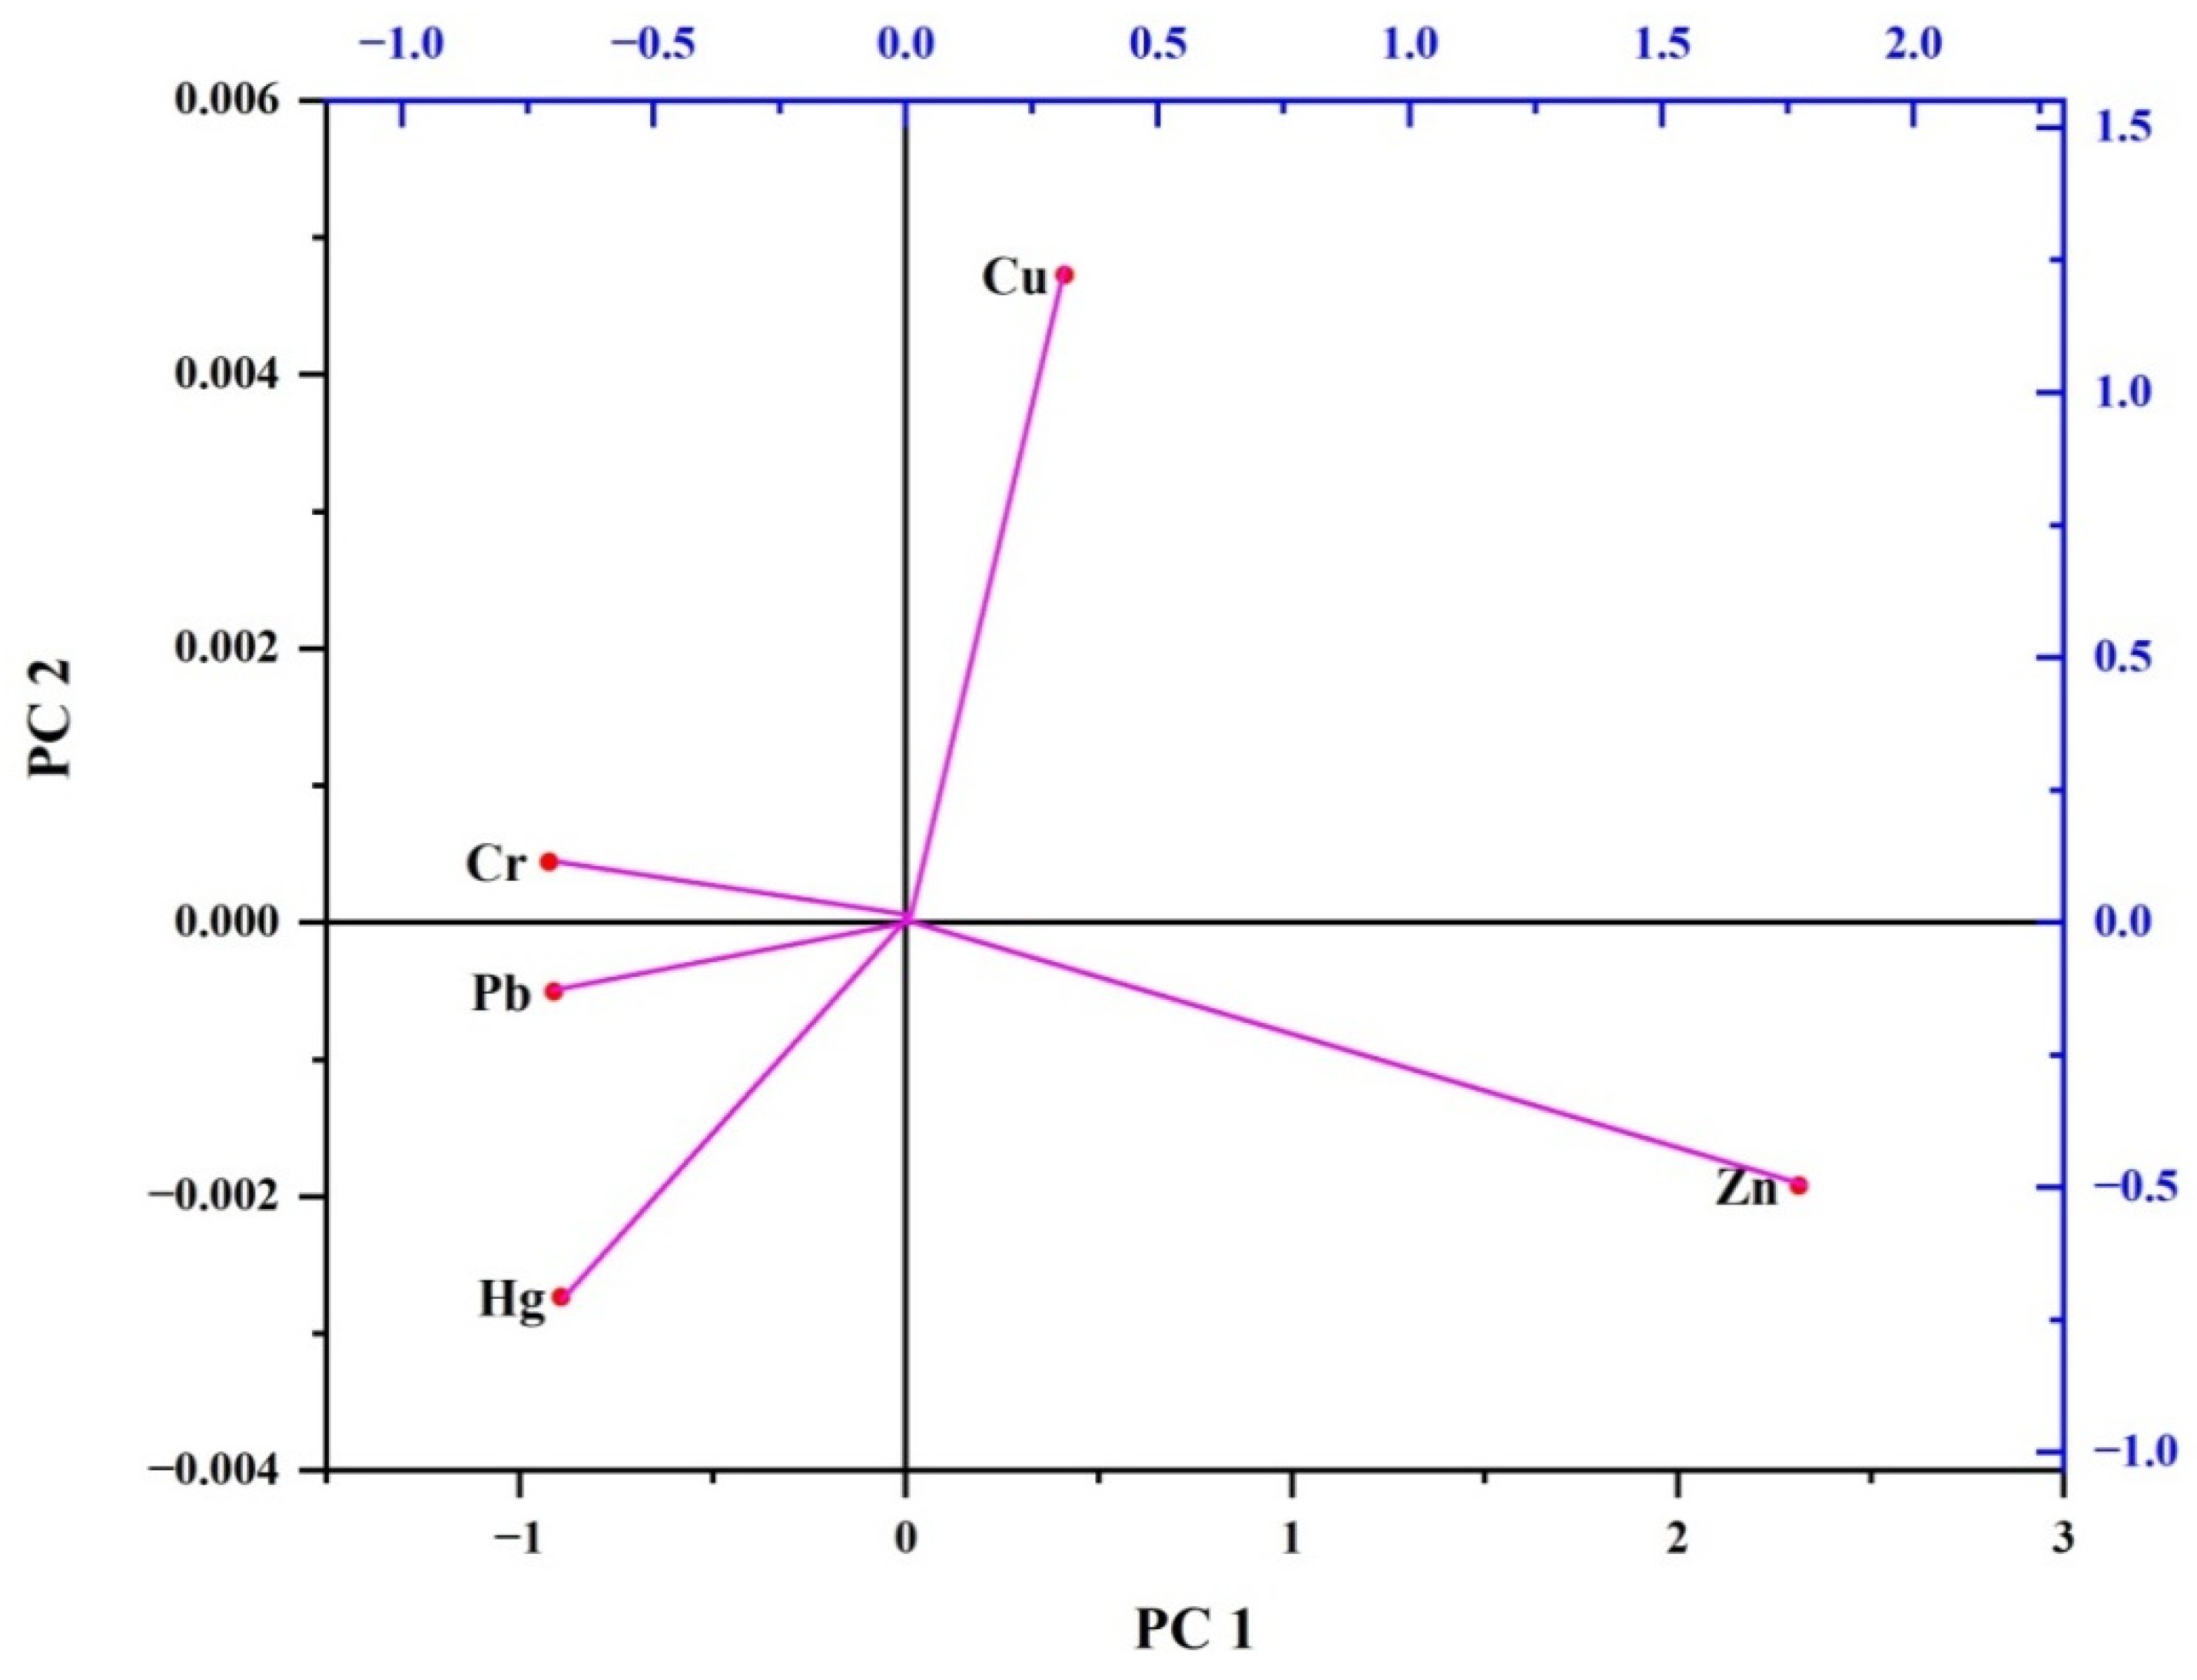
3.2.4. Principal Component Analysis (PCA) and Correlation Matrix

Principal component analysis (PCA) serves as a tool to discern patterns, similarities, or variations among different metals based on their characteristics, facilitating classification, clustering, or further examination [70]. In our investigation, two principal components were sufficient to explain the entirety of the variance (100%). The PCA results show that the first component explained 69.79% of the total variation in the dataset, while the second component accounted for an additional 30.21% of the variance (Figure 2). Components with higher percentages of variance capture a greater amount of information regarding the underlying structure of the data. Hence, the first component, characterized by its significant variance percentage, accounts for a substantial proportion of the variability present in the dataset. The loadings of various metals on each component offered valuable insights into the interconnections between variables. In this instance, the first component displayed significant loadings of Zn and Cu, suggesting a robust link between these metals in the dataset. This indicated a strong correlation between the levels of Zn and Cu in the samples. In contrast, the second component showed a strong association with Hg, indicating that changes in Hg levels are less influenced by Zn and Cu levels and may indicate a unique pattern of variability in the dataset. In general, these findings indicate a strong correlation between the levels of Zn and Cu, although the variability in Hg contents differs among the analyzed samples. (Figure 2). Furthermore, the PCA outcomes were corroborated by Pearson’s correlation analyses, revealing strong linear relationships between Zn and Cu (0.82) and Cu and Hg (0.79) at a significance level of 0.05 (Table 7). Such correlations imply that Zn, Cu, and Hg may share common origins, hinting at a reasonable connection among these heavy metals within the environment [71,72,73]. These findings suggest that the presence of heavy metals in fish species likely stems from diverse sources, whether anthropogenic (attributed to human activities) or natural [4,20,71]. Given that the measured levels of these metals in the study area exceeded standard values, they probably originated from anthropogenic activities within the river’s catchment area, spanning from upstream to downstream. This catchment area is predominantly utilized for agricultural activities, human habitation, aquaculture, fishing, metal galvanization, and certain pharmaceutical industries [20]). Consequently, the widespread application of agrochemicals in croplands, discharge of household and industrial wastes, operations of upstream metal plating facilities, and the presence of airborne particles could potentially account for the elevated concentrations of Zn, Cu, and Hg in the area [20]).

4. Conclusions

This study aimed to assess the contamination levels and associated health risks posed by five heavy metals (Pb, Hg, Zn, Cu, and Cr) in two commercially significant fish species from the Feni River estuary. Analysis of heavy metal concentrations in the muscle tissue of both fish species revealed a descending order of Zn > Cu > Hg > Pb > Cr. The highest concentrations of Zn, Pb, and Cr were observed in the muscle tissue of Labeo bata, whereas Otolithoides pama exhibited the highest levels of Cu and Hg. The levels of studied metals in the gills of the two species varied. Disparities in heavy metal presence in the fish species suggest that dietary habits and habitat may influence metal accumulation. While levels of Pb and Hg exceeded permissible thresholds for human consumption, assessments of target hazard quotient (THQ), hazard index (HI), and estimated daily intake (EDI) indicated that consuming fish from the studied region did not pose significant health risks, except for potential cancer hazards for Zn. The notable correlations among Zn, Cu, and Hg imply potentially shared origins, whether anthropogenic or natural. Although isotopic analyses could provide definitive evidence of metal origins, possible sources may include widespread use of agrochemicals in croplands, household waste, upstream metal plating activities, and other human activities within the catchment area. Given that fish continues to be a vital and healthy component of a balanced diet, it is essential to recognize the potential human health risks of contaminated fish. Therefore, it is advisable to maintain regular monitoring of toxic metals in riverine fish.

Supplementary Materials

The following supporting information can be downloaded at: https://www.mdpi.com/article/10.3390/biology13040260/s1, Table S1: MDLs (mg/kg) for EDXRF (Epsilon 5) and comparative values of the measured and certified concentrations of standard reference materials (Marine sediment, IAEA 433).

Author Contributions

Conceptualization, M.B.H.; methodology, M.M.A., Y.N.J. and A.-A.U.N.; software, A.-A.U.N. and S.S.; validation, M.B.H., T.A. and B.A.P.; investigation, M.M.A. and A.-A.U.N.; writing—original draft preparation, M.M.A., M.B.H. and S.S.; review and draft, M.B.H., B.A.P., J.Y. and T.A.; funding acquisition, B.A.P. and T.A. All authors have read and agreed to the published version of the manuscript.

Funding

This study was supported by Researchers Supporting Project Number (RSP2024R144), King Saud University, Riyadh, Saudi Arabia.

Institutional Review Board Statement

Ethical approval was taken from the Research cell of Noakhali Science and Technology University. The reference number: Ref: 09/2020/RCNSTU-88.

Informed Consent Statement

Not applicable.

Data Availability Statement

Data are provided in the article.

Acknowledgments

The authors would like to extend their sincere appreciation to the Researchers Supporting Project Number (RSP2024R144), King Saud University, Riyadh, Saudi Arabia.

Conflicts of Interest

The authors declare no conflicts of interest.

References

  1. Dixit, R.; Malaviya, D.; Pandiyan, K.; Singh, U.B.; Sahu, A.; Shukla, R.; Singh, B.P.; Rai, J.P.; Sharma, P.K.; Lade, H.; et al. Bioremediation of heavy metals from soil and aquatic environment: An overview of principles and criteria of fundamental processes. Sustainability 2015, 7, 2189–2212. [Google Scholar] [CrossRef]
  2. Qin, D.; Jiang, H.; Bai, S.; Tang, S.; Mou, Z. Determination of 28 trace elements in three farmed cyprinid fish species from Northeast China. Food Control 2015, 50, 1–8. [Google Scholar] [CrossRef]
  3. Zhou, H.; Yang, W.-T.; Zhou, X.; Liu, L.; Gu, J.-F.; Wang, W.-L.; Zou, J.-L.; Tian, T.; Peng, P.-Q.; Liao, B.-H. Accumulation of heavy metals in vegetable species planted in contaminated soils and the health risk assessment. Int. J. Environ. Res. Public Health 2016, 13, 289. [Google Scholar] [CrossRef] [PubMed]
  4. Hossain, M.B.; Tanjin, F.; Rahman, M.S.; Yu, J.; Akhter, S.; Noman, M.A.; Sun, J. Metals bioaccumulation in 15 commonly consumed fishes from the lower Meghna river and adjacent areas of Bangladesh and associated human health hazards. Toxics 2022, 10, 139. [Google Scholar] [CrossRef] [PubMed]
  5. Kang, M.-J.; Kwon, Y.K.; Yu, S.; Lee, P.-K.; Park, H.-S.; Song, N. Assessment of Zn pollution sources and apportionment in agricultural soils impacted by a Zn smelter in South Korea. J. Hazard. Mater. 2019, 364, 475–487. [Google Scholar] [CrossRef] [PubMed]
  6. Qu, L.; Huang, H.; Xia, F.; Liu, Y.; Dahlgren, R.A.; Zhang, M.; Mei, K. Risk analysis of heavy metal concentration in surface waters across the rural-urban interface of the Wen-Rui Tang River, China. Environ. Pollut. 2018, 237, 639–649. [Google Scholar] [CrossRef] [PubMed]
  7. Reza, R.; Singh, G. Heavy metal contamination and its indexing approach for river water. Int. J. Environ. Sci. Technol. 2010, 7, 785–792. [Google Scholar] [CrossRef]
  8. Chen, H.; Wang, L.; Hu, B.; Xu, J.; Liu, X. Potential driving forces and probabilistic health risks of heavy metal accumulation in the soils from an e-waste area, southeast China. Chemosphere 2022, 289, 133182. [Google Scholar] [CrossRef] [PubMed]
  9. Dutta, D.; Goel, S.; Kumar, S. Health risk assessment for exposure to heavy metals in soils in and around E-waste dumping site. J. Environ. Chem. Eng. 2022, 10, 107269. [Google Scholar] [CrossRef]
  10. Algül, F.; Beyhan, M. Concentrations and sources of heavy metals in shallow sediments in Lake Bafa, Turkey. Sci. Rep. 2020, 10, 11782. [Google Scholar] [CrossRef]
  11. Jiménez-Oyola, S.; Chavez, E.; García-Martínez, M.-J.; Ortega, M.F.; Bolonio, D.; Guzmán-Martínez, F.; García-Garizabal, I.; Romero, P. Probabilistic multi-pathway human health risk assessment due to heavy metal(loid)s in a traditional gold mining area in Ecuador. Ecotoxicol. Environ. Saf. 2021, 224, 112629. [Google Scholar] [CrossRef] [PubMed]
  12. Septiono, M.A.; Roosmini, D. Heavy metal distribution in water, sediment and fish at upper Citarum river and its potential exposure pathway to human. In Proceedings of the 5th Environmental Technology and Management Conference “Green Technology towards Sustainable Environment”, Bandung, Indonesia, 23–24 November 2015; Volume 23. [Google Scholar]
  13. Pintaeva, E.T.; Bazarsadueva, S.V.; Radnaeva, L.D.; Petrov, E.A.; Smirnova, O.G. Content and character of metal accumulation in fish of the Kichera River (a tributary of Lake Baikal). Contemp. Probl. Ecol. 2011, 4, 64–68. [Google Scholar] [CrossRef]
  14. Subotić, S.; Jeftić, Ž.V.; Spasić, S.; Hegediš, A.; Krpo-Ćetković, J.; Lenhardt, M. Distribution and accumulation of elements (As, Cu, Fe, Hg, Mn, and Zn) in tissues of fish species from different trophic levels in the Danube River at the confluence with the Sava River (Serbia). Environ. Sci. Pollut. Res. 2013, 20, 5309–5317. [Google Scholar] [CrossRef]
  15. Yildirim, Y.; Gonulalan, Z.; Narin, I.; Soylak, M. Evaluation of trace heavy metal levels of some fish species sold at retail in Kayseri, Turkey. Environ. Monit. Assess. 2009, 149, 223–228. [Google Scholar] [CrossRef] [PubMed]
  16. Bosch, A.C.; O’Neill, B.; Sigge, G.O.; Kerwath, S.E.; Hoffman, L.C. Heavy metals in marine fish meat and consumer health: A review. J. Sci. Food Agric. 2016, 96, 32–48. [Google Scholar] [CrossRef] [PubMed]
  17. Galimberti, C.; Corti, I.; Cressoni, M.; Moretti, V.M.; Menotta, S.; Galli, U.; Cambiaghi, D. Evaluation of mercury, cadmium and lead levels in fish and fishery products imported by air in North Italy from extra-European Union Countries. Food Control 2016, 60, 329–337. [Google Scholar] [CrossRef]
  18. Gu, Y.-G.; Lin, Q.; Wang, X.-H.; Du, F.-Y.; Yu, Z.-L.; Huang, H.-H. Heavy metal concentrations in wild fishes captured from the South China Sea and associated health risks. Mar. Pollut. Bull. 2015, 96, 508–512. [Google Scholar] [CrossRef] [PubMed]
  19. Nor Hasyimah, A.K.; James Noik, V.; Teh, Y.Y.; Lee, C.Y.; Pearline Ng, H.C. Assessment of cadmium (Cd) and lead (Pb) levels in commercial marine fish organs between wet markets and supermarkets in Klang Valley, Malaysia. Int. Food Res. J. 2011, 18, 795–802. [Google Scholar]
  20. Islam, M.S.; Hossain, M.B.; Matin, A.; Sarker, M.S.I. Assessment of heavy metal pollution, distribution, and source apportionment in the sediment from Feni River estuary, Bangladesh. Chemosphere 2018, 202, 25–32. [Google Scholar] [CrossRef]
  21. Akila, M.; Anbalagan, S.; Lakshmisri, N.M.; Janaki, V.; Ramesh, T.; Merlin, R.J.; Kamala-Kannan, S. Heavy metal accumulation in selected fish species from Pulicat Lake, India, and health risk assessment. Environ. Technol. Innov. 2022, 27, 102744. [Google Scholar] [CrossRef]
  22. Kibria, G.; Hossain, M.M.; Mallick, D.; Lau, T.C.; Wu, R. Trace/heavy metal pollution monitoring in estuary and coastal area of Bay of Bengal, Bangladesh and implicated impacts. Mar. Poll. Bull. 2016, 105, 393–402. [Google Scholar] [CrossRef] [PubMed]
  23. Khatun, N.; Nayeem, J.; Deb, N.; Hossain, S.; Kibria, M.M. Heavy metals contamination: Possible health risk assessment in highly consumed fish species and water of Karnafuli River Estuary, Bangladesh. Toxicol. Environ. Health Sci. 2021, 13, 375–388. [Google Scholar] [CrossRef]
  24. Sarker, M.J.; Polash, A.U.; Islam, M.A.; Rima, N.N.; Farhana, T. Heavy metals concentration in native edible fish at upper Meghna River and its associated tributaries in Bangladesh: A prospective human health concern. SN Appl. Sci. 2020, 2, 1667. [Google Scholar] [CrossRef]
  25. Ahmed, A.S.S.; Rahman, M.; Sultana, S.; Babu, S.M.O.F.; Sarker, M.S.I. Bioaccumulation and heavy metal concentration in tissues of some commercial fishes from the Meghna River Estuary in Bangladesh and human health implications. Mar. Pollut. Bull. 2019, 145, 436–447. [Google Scholar] [CrossRef] [PubMed]
  26. Ali, M.M.; Ali, M.L.; Proshad, R.; Islam, S.; Rahman, Z.; Tusher, T.R.; Kormoker, T.; Al, M.A. Heavy metal concentrations in commercially valuable fishes with health hazard inference from Karnaphuli river, Bangladesh. Hum. Ecol. Risk Assess. Int. J. 2020, 26, 2646–2662. [Google Scholar] [CrossRef]
  27. Mohiuddin, M.; Hossain, M.B.; Ali, M.M.; Hossain, M.K.; Habib, A.; Semme, S.A.; Rakib, R.J.; Rahman, A.; Yu, J.; Al-Sadoon, M.K.; et al. Human health risk assessment for exposure to heavy metals in finfish and shellfish from a tropical estuary. J. King Saud Univ. Sci. 2022, 34, 102035. [Google Scholar] [CrossRef]
  28. Miah, M.Y.; Robel, F.N.; Bhowmik, S.; Bhattacharjee, S.; Paul, S.C.; Hossain, M.J.; Hossain, M.Z. Assessment of the coastal area water quality in Noakhali, Bangladesh. Int. J. Sci. Engin. Res. 2015, 6, 1116–1123. [Google Scholar]
  29. USEPA (United States Environmental Protection Agency). USEPA Regional Screening Level (RSL) Summary Table; USEPA: Washington, DC, USA, 2011.
  30. Ahmed, M.K.; Baki, M.A.; Islam, M.S.; Kundu, G.K.; Habibullah-Al-Mamun, M.; Sarkar, S.K.; Hossain, M.M. Human health risk assessment of heavy metals in tropical fish and shellfish collected from the river Buriganga, Bangladesh. Environ. Sci. Pollut. Res. 2015, 22, 15880–15890. [Google Scholar] [CrossRef] [PubMed]
  31. Yi, Y.; Yang, Z.; Zhang, S. Ecological risk assessment of heavy metals in sediment and human health risk assessment of heavy metals in fishes in the middle and lower reaches of the Yangtze River basin. Environ. Pollut. 2011, 159, 2575–2585. [Google Scholar] [CrossRef]
  32. National Standard NO. 12968; Food and Feed-Maximum Limit of Heavy Metals. ISIRI (Institute of Standards and Industrial Research of Iran): Tehran, Iran, 2010.
  33. El-Moselhy, K.M.; Othman, A.I.; El-Azem, H.A.; El-Metwally, M.E.A. Bioaccumulation of heavy metals in some tissues of fish in the Red Sea, Egypt. Egypt. J. Basic Appl. Sci. 2014, 1, 97–105. [Google Scholar] [CrossRef]
  34. Esmaili-Sari, A. Pollutants, Health and Standards in the Environment. Tehran. Naghsh-e-Mehr. 2002, 24, 767. [Google Scholar]
  35. USEPA. Region III Risk-Based Concentration Table: Technical Background; USEPA: Washington, DC, USA, 2006.
  36. USEPA. Guidance Manual for Assessing Human Health Risks from Chemically Contaminated, Fish and Shellfish; USEPA: Washington, DC, USA, 1989.
  37. FAO. Compilation of Legal Limits for Hazardous Substances in Fish and Fishery Product; FAO: Rome, Italy, 2014. [Google Scholar]
  38. Batista, D.; Muricy, G.; Rocha, R.C.; Miekeley, N.F. Marine sponges with contrasting life histories can be complementary biomonitors of heavy metal pollution in coastal ecosystems. Environ. Sci. Pollut. Res. 2014, 21, 5785–5794. [Google Scholar] [CrossRef] [PubMed]
  39. Hosseini, M.; Nabavi, S.M.B.; Nabavi, S.N.; Pour, N.A. Heavy metals (Cd, Co, Cu, Ni, Pb, Fe, and Hg) content in four fish commonly consumed in Iran: Risk assessment for the consumers. Environ. Monit. Assess. 2015, 187, 237. [Google Scholar] [CrossRef] [PubMed]
  40. Jiang, X.; Wang, J.; Pan, B.; Li, D.; Wang, Y.; Liu, X. Assessment of heavy metal accumulation in freshwater fish of Dongting Lake, China: Effects of feeding habits, habitat preferences and body size. J. Environ. Sci. 2022, 112, 355–365. [Google Scholar] [CrossRef]
  41. Yi, Y.; Tang, C.; Yi, T.; Yang, Z.; Zhang, S. Health risk assessment of heavy metals in fish and accumulation patterns in food web in the upper Yangtze River, China. Ecotoxicol. Environ. Saf. 2017, 145, 295–302. [Google Scholar] [CrossRef] [PubMed]
  42. Jovanović, D.A.; Marković, R.V.; Teodorović, V.B.; Šefer, D.S.; Krstić, M.P.; Radulović, S.B.; Ćirić, J.S.I.; Janjić, J.M.; Baltić, M.Ž. Determination of heavy metals in muscle tissue of six fish species with different feeding habits from the Danube River, Belgrade—Public health and environmental risk assessment. Environ. Sci. Pollut. Res. 2017, 24, 11383–11391. [Google Scholar] [CrossRef] [PubMed]
  43. Wei, Y.; Zhang, J.; Zhang, D.; Tu, T.; Luo, L. Metal concentrations in various fish organs of different fish species from Poyang Lake, China. Ecotoxicol. Environ. Saf. 2014, 104, 182–188. [Google Scholar] [CrossRef] [PubMed]
  44. Nowosad, J.; Kucharczyk, D.; Łuczyńska, J. Changes in mercury concentration in muscles, ovaries and eggs of European eel during maturation under controlled conditions. Ecotoxicol. Environ. Saf. 2018, 148, 857–861. [Google Scholar] [CrossRef]
  45. Nowosad, J.; Kucharczyk, D.; Szmyt, M.; Łuczynska, J.; Tamás, M.; Horváth, L. Changes in cadmium concentration in muscles, ovaries, and eggs of Silver European Eel (Anguilla anguilla) during maturation under controlled conditions. Animals 2021, 11, 1027. [Google Scholar] [CrossRef]
  46. Łuczyńska, J.; Paszczyk, B.; Nowosad, J.; Łuczyński, M.J. Mercury, fatty acids content and lipid quality indexes in muscles of freshwater and marine fish on the polish market: Risk assessment of fish consumption. Int. J. Environ. Res. Public Health 2017, 14, 1120. [Google Scholar] [CrossRef]
  47. Łuczyńska, J.; Paszczyk, B.; Łuczyński, M.J.; Kowalska-Góralska, M.; Nowosad, J.; Kucharczyk, D. Using Rutilus rutilus (L.) and Perca fluviatilis (L.) as bioindicators of the environmental condition and human health: Lake Łańskie, Poland. Int. J. Environ. Res. Public Health 2020, 17, 7595. [Google Scholar] [CrossRef] [PubMed]
  48. Canli, M.; Ay, Ö.; Kalay, M. Levels of Heavy Metals (Cd, Pb, Cu, Cr and Ni) in Tissue of Cyprinus carpio, Barbus capito and Chondrostoma regiumfrom the Seyhan River, Turkey. Turk. J. Zool. 1998, 22, 149–158. [Google Scholar]
  49. Türkmen, M.; Türkmen, A.; Tepe, Y.; Töre, Y.; Ateş, A. Determination of metals in fish species from Aegean and Mediterranean seas. Food Chem. 2009, 113, 233–237. [Google Scholar] [CrossRef]
  50. Reddy, T.A.; Maor, I.; Panjapornpon, C. Calibrating detailed building energy simulation programs with measured data—Part II: Application to three case study office buildings (RP-1051). HVAC&R Res. 2007, 13, 243–265. [Google Scholar]
  51. FAO. Compilation of Legal Limits for Hazardous Substances in Fish and Fishery Product; FAO: Rome, Italy, 1983; Volume 746, p. 104. [Google Scholar]
  52. Rahman, M.S.; Molla, A.H.; Saha, N.; Rahman, A. Study on heavy metals levels and its risk assessment in some edible fishes from Bangshi River, Savar, Dhaka, Bangladesh. Food Chem. 2012, 134, 1847–1854. [Google Scholar] [CrossRef] [PubMed]
  53. Noël, L.; Chekri, R.; Millour, S.; Merlo, M.; Leblanc, J.-C.; Guérin, T. Distribution and relationships of As, Cd, Pb and Hg in freshwater fish from five French fishing areas. Chemosphere 2013, 90, 1900–1910. [Google Scholar] [CrossRef] [PubMed]
  54. Zhou, Q.; Yang, N.; Li, Y.; Ren, B.; Ding, X.; Bian, H.; Yao, X. Total concentrations and sources of heavy metal pollution in global river and lake water bodies from 1972 to 2017. Glob. Ecol. Conserv. 2020, 22, e00925. [Google Scholar] [CrossRef]
  55. Raj, D.; Maiti, S.K. Sources, bioaccumulation, health risks and remediation of potentially toxic metal (loid) s (As, Cd, Cr, Pb and Hg): An epitomised review. Environ. Monit. Assess. 2020, 192, 108. [Google Scholar] [CrossRef]
  56. Keshavarzi, B.; Hassanaghaei, M.; Moore, F.; Mehr, M.R.; Soltanian, S.; Lahijanzadeh, A.R.; Sorooshian, A. Heavy metal contamination and health risk assessment in three commercial fish species in the Persian Gulf. Mar. Pollut. Bull. 2018, 129, 245–252. [Google Scholar] [CrossRef]
  57. Tüzen, M. Determination of heavy metals in fish samples of the middle Black Sea (Turkey) by graphite furnace atomic absorption spectrometry. Food Chem. 2003, 80, 119–123. [Google Scholar] [CrossRef]
  58. Hossein Khezri, P.; Takhsha, M.; Aein Jamshid, K.; Aghshenas, A. Assessment level of heavy metals (Pb, Cd, Hg) in four fish species of Persian Gulf (Bushehr-Iran). Int. J. Adv. Technol. Eng. Res. 2014, 4, 7–11. [Google Scholar]
  59. Raissy, M.; Ansari, M. Health risk assessment of mercury and arsenic associated with consumption of fish from the Persian Gulf. Environ. Monit. Assess. 2014, 186, 1235–1240. [Google Scholar] [CrossRef] [PubMed]
  60. Rajeshkumar, S.; Li, X. Bioaccumulation of heavy metals in fish species from the Meiliang Bay, Taihu Lake, China. Toxicol. Rep. 2018, 5, 288–295. [Google Scholar] [CrossRef] [PubMed]
  61. Batvari, B.P.D.; Kamala-Kannan, S.; Shanthi, K.; Krishnamoorthy, R.; Lee, K.J.; Jayaprakash, M. Heavy metals in two fish species (Carangoidel malabaricus and Belone stronglurus) from Pulicat Lake, North of Chennai, Southeast Coast of India. Environ. Monit. Assess. 2008, 145, 167–175. [Google Scholar] [CrossRef] [PubMed]
  62. ROPME, Kuwait: Regional Organization for the Protection of the Marine Environment (ROPME). 1999. Available online: https://ropme.org/ (accessed on 17 August 2023).
  63. Mansour, S.A.; Gad, M.F. Risk assessment of pesticides and heavy metals contaminants in vegetables: A novel bioassay method using Daphnia magna Straus. Food Chem. Toxicol. 2010, 48, 377–389. [Google Scholar] [CrossRef] [PubMed]
  64. Irwandi, J.; Farida, O. Mineral and heavy metal contents of marine fin fish in Langkawi Island, Malaysia. Int. Food Res. J. 2009, 16, 105–112. [Google Scholar]
  65. Liu, Q.; Liao, Y.; Shou, L. Concentration and potential health risk of heavy metals in seafoods collected from Sanmen Bay and its adjacent areas, China. Mar. Pollut. Bull. 2018, 131, 356–364. [Google Scholar] [CrossRef] [PubMed]
  66. Li, J.; Huang, Z.Y.; Hu, Y.; Yang, H. Potential risk assessment of heavy metals by consuming shellfish collected from Xiamen, China. Environ. Sci. Pollut. Res. 2013, 20, 2937–2947. [Google Scholar] [CrossRef]
  67. Javed, M.; Usmani, N. Accumulation of heavy metals and human health risk assessment via the consumption of freshwater fish Mastacembelus armatus inhabiting, thermal power plant effluent loaded canal. SpringerPlus 2016, 5, 776. [Google Scholar] [CrossRef]
  68. USEPA. Risk-Based Concentration Table; USEPA: Washington, DC, USA, 2010. Available online: https://archive.epa.gov/region9/superfund/web/html/index-23.html (accessed on 12 November 2023).
  69. World Health Organization (WHO). Diabetes Mellitus: Report of a WHO Study Group; World Health Organization: Cham, Switzerland, 1985; Available online: https://iris.who.int/handle/10665/39592 (accessed on 17 August 2023).
  70. Shaukat, S.S.; Rao, T.A.; Khan, M.A. Impact of sample size on principal component analysis ordination of an environmental data set: Effects on eigenstructure. Ekologia 2016, 35, 173–190. [Google Scholar] [CrossRef]
  71. Sultana, S.; Hossain, M.B.; Choudhury, T.R.; Yu, J.; Rana, M.S.; Abu Noman, M.A.; Hosen, M.M.; Paray, B.A.; Arai, T. Ecological and human health risk assessment of heavy metals in cultured shrimp and aquaculture sludge. Toxics 2022, 10, 175. [Google Scholar] [CrossRef] [PubMed]
  72. Hossain, M.B.; Sultana, J.; Jolly, Y.N.; Nur, A.-A.U.; Sultana, S.; Miazee, R.; Islam, M.S.; Paray, B.A.; Arai, T.; Yu, J. Seasonal variation, contamination and ecological risk assessment of heavy metals in sediments of coastal wetlands along the Bay of Bengal. Mar. Pollut. Bull. 2023, 194, 115337. [Google Scholar] [CrossRef] [PubMed]
  73. Hossain, M.B.; Rahman, M.A.; Hossain, M.K.; Nur, A.-A.U.; Sultana, S.; Semme, S.; Albeshr, M.F.; Arai, T.; Yu, J. Contamination status and associated ecological risk assessment of heavy metals in different wetland sediments from an urbanized estuarine ecosystem. Mar. Pollut. Bull. 2022, 185, 114246. [Google Scholar] [CrossRef] [PubMed]
Figure 1. Map of the study area and location of the sampling sites (red circle) in the Feni River Estuary.
Biology 13 00260 g001
Figure 2. Principal component analysis (PCA) biplot of log-transformed metal concentration in fish tissue.
Biology 13 00260 g002
Table 1. Biometrics data (mean ± SD) of the selected fish samples from the Feni River.
SampleLocal NameNPreference of FeedHabitantBody Weight (g)Length (cm)Gill Weight (g)
O. pamaPoa18Small invertebrates and herbivore (on algae)Pelagic87 ± 1122.5 ± 42.98 ± 0.8
L. bataBata18Filter Feeders (benthic invertebrates)Benthopelagic61 ± 818.8 ± 3.52.32 ± 06
Table 2. Summary of the heavy metal concentration in the muscle and gill of the studied fish species (mg/kg).
SpeciesElementsOrganMean Value + SDMinimumMaximum
O. pamaPbMuscle0.772 ± 0.0830.6890.857
Gill0.658 ± 0.1020.5570.762
HgMuscle1.945 ± 0.0361.9061.978
Gill2.522 ± 0.1722.4122.720
ZnMuscle110. 85 ± 1.236109.411111.586
Gill110.158 ± 1.236128.461155.296
CuMuscle59.821 ± 5.83953.78365.438
Gill59.821 ± 5.83945.64559.212
CrMuscle<DL a<DL a<DL a
Gill3.678 ± 1.8592.5955.825
L. bataPbMuscle0.974 ± 0.1390.8461.123
Gill0.884 ± 0.0920.7840.967
HgMuscle1.326 ± 0.0661.2581.390
Gill1.360 ± 0.0971.2821.469
ZnMuscle119.382 ± 0.736118.544119.928
Gill122.359 ± 9.969110.853128.409
CuMuscle50.088 ± 4.08545.52653.407
Gill50.088 ± 4.08547.86457.914
CrMuscle3.862 ± 0.7863.1344.696
Gill<DL a<DL a<DL a
a Values were below the detection limits.
Table 3. Comparison of heavy metals concentrations in this study with other studies and FAO standard values (mg/kg). The combined metal values are derived from both species and three stations.
AreaPbHgZnCuCrReference
Muscle
Feni River Estuary (Bangladesh)0.68–1.121.25–1.39109.41–119.9345.52–65.430.31–5.82Present study
Musa estuary (Persian Gulf)0.07–0.770.56–14.00NA1.37–3.14NA[56]
Red Sea (Egypt, Jordan)0.21–0.88NA a1.9–350.22–0.631.0–10.3[33]
Mediterranean Sea (Turkey)2.98–5.57NA3.51–53.52.19–4.410.07–1.48[48,49]
Black Sea (Turkey)0.68NA aNA a1.55NA a[57]
Yangtze River (China)0.1170.043NA1.020NA a[31]
Bushehr (Persian Gulf)0.680.86NA aNA aNA a[58]
Gulf of Cambaya (India)1.09NA a38.242.370.77[50]
Hendijan (Persian Gulf)NA0.13NA aNA aNA a[59]
Standard value d0.50.5100070NA a[51]
Gill
Feni River Estuary (Bangladesh)0.55–0.961.28–2.72110.85–155.2945.64–59.21<DL cPresent study
Taihu Lake fish samples0.49NA aNA a0.240.16[60]
Pulicat Lake, India1.1NA aND b1.30.2[61]
ROPME0.01–1.281NA0.05–19.52.3[62]
Tigris River in Baghdad1.50ND b1.051.102.20[63]
Bangshi River7.360.39183.6441.194.36[52]
Langkawi Island1.001.4749.3911.55NA a[64]
a Not available; b not detected; c values were below the limits of detection; d Food and Agricultural Organization.
Table 4. Target hazard quotient (THQ) for different heavy metals and their hazard index (HI).
SpeciesStationPbHgZnCuCrHI
O. pamaStation-10.0150.6320.0340.1120.0990.892
Station-20.0140.6720.0370.1300.0740.927
Station-30.0160.6240.0330.1200.1680.961
Average of THQ0.0150.6420.0350.1210.1140.930
L. bataStation-10.0220.3780.0350.1070.0950.637
Station-20.0180.3650.0320.1010.1350.651
Station-30.0190.4110.0340.1200.0900.674
Average of THQ0.0190.3840.0330.1090.1070.646
Table 5. Target risk (TR) values of different species in different stations.
SpeciesStationPbCrZn
O. pamaStation-12.603 × 10−67.443 × 10−41.766 × 10⁻⁴
Station-22.474 × 10−65.605 × 10−42.007 × 10⁻³
Station-32.821 × 10−61.258 × 10−32.031 × 10⁻³
Average of TR2.632 × 10−68.542 × 10−41.438 × 10−3
L. bataStation-13.848 × 10−67.124 × 10−41.226 × 10⁻³
Station-23.218 × 10−61.014 × 10−41.296 × 10⁻³
Station-33.200 × 10−66.769 × 10−41.575 × 10⁻³
Average of TR3.422 × 10−64.969 × 10−41.365 × 10−3
Table 6. Estimated daily intake (EDI) from fish consumption by local residents (mg/kg/day).
LocationFish SpeciesPbHgZnCuCr
Station 1O. pama0.3060.9510.10422.601.493
L. bata0.4520.5700.72221.561.431
Station 2O. pama0.2911.0111.18125.8971.124
L. bata0.3780.5500.76320.2342.034
Station 3O. pama0.3310.9401.19624.0672.535
L. bata0.3760.6190.92724.1191.358
M T D I   a 0.400.5–1.00.903–300.5–2.0
a Maximum tolerable daily intake.
Table 7. Pearson correlation analysis of heavy metals in fish tissue.
PbCrCuHgZn
Pb1
Cr−0.391
Cu0.50−0.721
Hg−0.75−0.220.79 **1
Zn0.26−0.9400.82 **−0.691
(p < 0.05 **).
Disclaimer/Publisher’s Note: The statements, opinions and data contained in all publications are solely those of the individual author(s) and contributor(s) and not of MDPI and/or the editor(s). MDPI and/or the editor(s) disclaim responsibility for any injury to people or property resulting from any ideas, methods, instructions or products referred to in the content.

