Simple Summary
Climate change poses a significant threat to agriculture, primarily through the increased frequency and severity of droughts. These extreme weather conditions reduce water availability, impacting crop yields and biomass production. Drought stress is particularly challenging for regions already prone to water scarcity, compromising food security. Addressing these issues requires innovative strategies and a thorough understanding of plant responses to water deficit conditions. This study aims to unravel the molecular mechanisms underlying drought tolerance in Citrus, crucial for developing adaptive strategies. The findings show that Bitters (C22) exhibits greater drought tolerance than Carrizo Citrange and identify key genes involved in responding to water scarcity. In conclusion, this research enhances our understanding of how citrus plants respond to water stress and identifies promising candidate genes. These insights will guide future research aimed at developing drought-tolerant plants.
Abstract
Agriculture faces the dual challenge of increasing food production and safeguarding the environment. Climate change exacerbates this challenge, reducing crop yield and biomass due to drought stress, especially in semi-arid regions where Citrus plants are cultivated. Understanding the molecular mechanisms underlying drought tolerance in Citrus is crucial for developing adaptive strategies. Plants of two citrus rootstocks, Carrizo Citrange and Bitters (C22), were grown in aerated half-strength Hoagland’s nutrient solution. Post-acclimation, the plants were exposed to a solution containing 0% (control) or 15% PEG-8000 for 10 days. Leaf malonyl dialdehyde (MDA) and hydrogen peroxide (H2O2) content were measured to assess the reached oxidative stress level. Total RNA was extracted, sequenced, and de novo-assembled. Weighted Gene Correlation Network Analysis (WGCNA) was conducted to examine the relationship between gene expression patterns and the levels of MDA and H2O2 used as oxidative stress indicators. Plant visual inspection and MDA and H2O2 contents clearly indicate that Bitters is more tolerant than Carrizo towards PEG-induced drought stress. RNA-Seq analysis revealed a significantly higher number of differentially expressed genes (DEGs) in Carrizo (6092) than in Bitters (320), with most being associated with drought sensing, ROS scavenging, osmolyte biosynthesis, and cell wall metabolism. Moreover, the WGCNA identified transcription factors significantly correlated with MDA and H2O2 levels, thus providing insights into drought-coping strategies and offering candidate genes for enhancing citrus drought tolerance.
1. Introduction
With the global population projected to reach 9 billion by mid-century, the agricultural sector faces the challenge of increasing food production while safeguarding the environment and ecosystem functionality. This task is compounded by ongoing climate change, adversely impacting plant growth and leading to a considerable reduction in crop yield and biomass [1]. Due to limited rainfall and insufficient water availability, drought stress represents one of the most deleterious environmental factors contributing to substantial and unpredictable losses in global agricultural production [2,3]. This constraint is expected to escalate in frequency, intensity, and geographic range, and might represent an especially challenging circumstance for Citrus trees, widely grown in semi-arid regions such as southern Italy and Spain. These areas are well known for the occurrence of dry and hot summers often characterised by an elevated evaporative demand. Indeed, given their high water consumption, the growth, yield, and fruit quality of Citrus are reported to be significantly constrained by limited water resources [4,5,6]. Research on plant–water relations indicates that plants have evolved two main mechanisms of drought resistance: stress avoidance and tolerance. Stress avoidance involves the plant’s capacity to maintain a suitable water status in its tissues during progressive soil water deficit and aims to balance water uptake and water loss. This response relies on various strategies, such as stomatal closure, reduced leaf area and growth, deep rooting, accelerating leaf senescence, and increased water use efficiency [7]. Furthermore, photosynthesis declines due to the CO2 scarcity induced by the closure of stomata [8]. Under such conditions, excessive light triggers photo-oxidation, increasing the accumulation of reactive oxygen species (ROS) (hydrogen peroxide, singlet oxygen, and superoxide radicle) [9]. In particular, excessive levels of H2O2 might lead to the accumulation of MDA, an indicator of membrane lipid peroxidation. On the other hand, stress tolerance refers to the plant’s ability to partially dehydrate but remain viable and restart growth when rainfall resumes. Primary strategies contributing to drought tolerance include changes in tissue elasticity, osmotic adjustment, and efficient antioxidant capacity [10]. Experimental evidence indicates that drought tolerance in Citrus spp., related genera (e.g., Poncirus), and their hybrids (e.g., citranges and citrumelos) primarily relies on avoidance mechanisms. Additionally, some evidence suggests that citrus plants may also employ tolerance mechanisms to drought, including osmotic [11,12,13] and cell wall elasticity [14] adjustments. A common approach to enhance drought tolerance involves the employment of rootstocks known for their abiotic stress tolerance, a strategy adopted across various plant species [15,16,17,18], Citrus spp. included. A proper rootstock (a) may reduce the adverse effects of environmental stresses on the scion, increasing its resistance to drought conditions; (b) may enable plant long-term survival and fruit quality by improving the efficiency of natural (water and soil) resource utilisation; and (c) may decrease the use of chemical inputs [19,20]. Until the early 2000s, most of the Italian citriculture was almost exclusively based on the use of sour orange as a rootstock, which conferred high quality to the scion cultivars. Unfortunately, sour orange sensitivity to citrus tristeza virus (CTV) [21] has led to new plantings mostly using Troyer and Carrizo Citranges (Citrus sinensis (L.) Osb. × Poncirus trifoliata), and Swingle citrumelo (Citrus paradisi Macf. × P. trifoliata) [22]. However, these rootstocks are known to be salt-sensitive [23] and to have low tolerance to high-pH calcareous soils, which are typical of many growing areas of southern Italy. Recently, the University of California Riverside (UCR) released Sunki mandarin (Citrus sunki Hort. ex Tan.) × trifoliate orange (P. trifoliata) hybrid rootstock, namely, Bitters (C22), showing good performance in many trials in terms of yield efficiency and high tolerance to calcareous soils [22]. Furthermore, Bitters has emerged as a promising suitable rootstock candidate, displaying higher tolerance to PEG-induced drought stress than Carrizo Citrange, the latter also exhibiting low efficiency in soil water utilisation [15,24]. Previous efforts in the drought tolerance screening of citrus species were restricted to in vivo and in vitro testing [13,25]. Alternatively, hydroponic platforms have been increasingly employed for rapid and effective drought screening of agronomic crops. However, relatively few studies have been conducted on fruit crops using hydroponic systems. Drought stress can be artificially induced through various strategies, such as water restriction [26], abscisic acid (ABA) treatment, and the application of polyethylene glycol (PEG) [27]. Among these methods, the use of PEG, a non-ionic water-soluble polymer, is widely favoured as it is not expected to penetrate plant cells [28]. In particular, Ziogas and co-workers analysed the proteome reprogramming resulting from the imposition of drought stress conditions in citrus plants using 15% (w/v) PEG-6000 application for 21 days to replicate drought stress conditions [29]. Mass spectrometry analysis enabled the identification of 42 differentially expressed proteins in PEG-treated plants and the majority of those proteins were downregulated, especially proteins involved in the photosynthetic process [29]. However, the global transcriptomic response of citrus to PEG-induced drought stress still remains unexplored. The widespread use of high-performance RNA sequencing platforms to dissect the regulatory mechanisms of plants under specific conditions has become a cornerstone for enhancing our comprehension of plant responses to adverse conditions such as drought stress, contributing to the isolation of genes of interest, creation of functional markers, and quantification of gene expression [30,31,32,33], especially when it is coupled with Weighted Gene Correlation Network Analysis (WGCNA) [34]. WGCNA is a systems biology method that groups genes exhibiting similar expression patterns into modules based on both the correlation among gene expressions acquired via NGS and the interconnectedness of biological processes in plants. As a result, RNA-Seq analysis followed by WGCNA has been extensively employed to explore the biological connections between co-expression networks and plant traits. It also aids in the identification of key genes strongly linked to traits, which can serve as valuable biomarkers [35,36,37,38]. In this work, to deepen the knowledge and comprehension of the molecular responses to PEG-induced drought stress in sweet orange, the transcriptomes of two citrus rootstocks of different sensitivity to drought, namely, Carrizo Citrange and C22, were analysed using RNA-Seq analysis and the de novo RNA assembly approach. Notably, this study represents the first transcriptome analysis of both Carrizo Citrange and C22 rootstocks under PEG-induced drought stress, providing novel insights into the diverse strategies adopted by different citrus genotypes to cope with water scarcity. Furthermore, the relationship between the transcriptomic outcome and the amount of H2O2 and MDA [39], which can be accurately quantified and can be used as stress indicators, was revealed by WGCNA. As far as we know, this is the first time that transcriptomic data are correlated with stress indicator metabolites in citrus, leading to the discovery of hub genes that might function as markers of water stress.
2. Materials and Methods
2.1. Plant Growth and Experimental Design
One-year-old plants of two citrus rootstock genotypes (Carrizo Citrange [C. sinensis (L.) Osb. cv. Washington navel × P. trifoliata (L.) Raf.] and Bitters (C22) [C. sunki × P. trifoliata]) were grown hydroponically in aerated half-strength Hoagland’s nutrient solution under a 16 h photoperiod (250 μmole m−2 s−1) and a 24 ± 1 °C temperature. After seven days of acclimation, the plants of both rootstock genotypes were divided into two groups and transferred to half-strength Hoagland’s nutrient solution containing 0 (control, CK) or 15% PEG-8000 (PEG-treated, PEG) for 10 days to impose the drought stress condition. Each treatment (CK or PEG) was independently run in triplicate, and each replicate consisted of three individual plants. After ten days of PEG treatment, the young leaves of each replicate were randomly sampled, immediately frozen in liquid nitrogen, and stored at −80 °C for further analyses.
2.2. Measurement of MDA and H2O2 Content
The measurement of MDA content was carried out on 70 mg of leaf tissue according to the method described in López-Hidalgo et al. [40]. H2O2 determination was carried out on 500 mg of leaf tissue according to the method described in Velikova et al. [41].
2.3. Total RNA Extraction and cDNA Synthesis
The total RNA from young leaves was extracted using TRIzolTM reagent (ThermoFisher Scientific, Waltham, MA, USA). RNA degradation and contamination were monitored on 1% agarose gels. RNA purity and concentration were checked using the NanoDrop spectrophotometer (ThermoFisher Scientific). Before sequencing, sample RNA integrity (RIN) was assessed using the Agilent Bioanalyzer 2100 system (Agilent Technologies, Santa Clara, CA, USA).
2.4. Library Preparation and Sequencing
After the QC procedures, sequencing libraries were generated using NEBNext® Ultra™ RNA Library Prep Kit for Illumina® (New England Biolabs, Ipswich, MA, USA) following the manufacturer’s recommendations. Briefly, mRNA was enriched using poly-T oligo-attached magnetic beads. Fragmentation was carried out using divalent cations under elevated temperature in NEBNext First Strand Synthesis Reaction Buffer (5×), followed by cDNA synthesis using random hexamers and M-MuLV Reverse Transcriptase (RNase H-). After first-strand synthesis, a custom second-strand synthesis buffer (Illumina) was added containing dNTPs, RNase H, and Escherichia coli polymerase I to generate the second strand by nick-translation. After the adenylation of 3’ ends of DNA fragments, NEBNext Adaptors with a hairpin loop structure were ligated to prepare for hybridisation. To select cDNA fragments preferentially 150~200 bp in length, the library fragments were purified with the AMPure XP system (Beckman Coulter, Beverly, MA, USA). Then, 3 µL USER Enzyme by NEB was used with size-selected, adaptor-ligated cDNA at 37 °C for 15 min followed by 5 min at 95 °C before PCR. Successively, PCR was performed with Phusion High-Fidelity DNA polymerase, Universal PCR primers, and Index (X) Primer. The library concentration was first quantified using a Qubit 2.0 fluorometer (Life Technologies, Carlsbad, CA, USA), and then diluted to 1 ng/µL before checking the insert size on an Agilent Bioanalyzer 2100 system (Agilent Technologies, Santa Clara, CA, USA). Cluster generation and sequencing were performed by Novogene Bioinformatics Technology Co., Ltd. (Beijing, China). After cluster generation, the libraries were sequenced on the Illumina HiSeq2000 platform to generate paired-end reads. Raw data (raw reads) of fastq format were first processed through in-house Perl scripts. In this step, clean data were obtained by removing reads containing adapters, reads containing poly-N, and low-quality reads. Then, the Q20, Q30, GC-content, and sequence duplication level of the clean data were calculated. All downstream analyses were based on clean, high-quality data.
2.5. De Novo Transcriptome Assembling and Gene Functional Annotation
De novo transcriptome assembly was accomplished using Trinity (2.6.6 version) with minKmerCov = 3, min_glue = 4. Then, Hierarchical Clustering was performed by Corset (1.09 version) to remove redundancy (parameter −f true, Default, −m 10) and the longest transcript of each cluster was selected as unigenes. Gene function was annotated based on the following databases (and software): National Center for Biotechnology Information (NCBI) non-redundant protein sequences (Nr) and NCBI nonredundant nucleotide sequences (Nt) (NCBI blast, version 2.9.0, e-value = 1e-5), Protein family (Pfam) (hmmscan, version HMMER 3.1, parameter e-value = 0.01), Clusters of Orthologous Groups of proteins (KOG/COG) and Swiss-Prot (Diamond, version 0.8.22, parameter e-value = 1e-5), Kyoto Encyclopedia of Genes and Genomes (KEGG) (Diamond, KAAS, version 0.8.22, parameter e-value = 1e-5), and Gene Ontology (GO) (blast2go, version b2g4pipe_v2.5, parameter e-value = 1e-6).
2.6. Quantification of Gene Expression and Differential Expression Analysis
The gene expression levels were estimated by RSEM (1.2.28 version) with bowtie2 mismatch 0 parameters to map the Corset-filtered transcriptome. For each sample, clean data were mapped back onto the assembled transcriptome and read counts for each gene were then obtained. Differential expression analysis between the control (CK) and treated (PEG) samples was performed using the DESeq2 R package (1.26.0 version). The resulting p-values were adjusted using the Benjamini and Hochberg’s approach for controlling the false discovery rate [42]. Genes retrieved by DESeq2 with an adjusted p-value < 0.05 were assigned as differentially expressed. A log2 Fold Change threshold of ±1 was adopted. The GO enrichment analysis of the differentially expressed genes (DEGs) was implemented by the GOseq and topGO R packages (1.32.0 and 2.32.0 versions, corrected p-value < 0.05) Wallenius non-central hyper-geometric distribution. Furthermore, all of the unigenes were submitted to the KEGG pathway database for the systematic analysis of gene functions. KOBAS software (v3.0 version, corrected p-value < 0.05) was used to test the statistical enrichment of the differentially expressed genes in the KEGG pathways [43].
2.7. Real-Time Validation of Selected DEG Candidates Using qRT-PCR
Total leaf RNA (2 µg) was reverse-transcribed using the SuperScript™ Vilo™ cDNA synthesis kit by ThermoFisher Scientific (Warrington WA1 4SR, UK). Real-time qRT-PCR was performed with PowerUp SYBR Green Master mix (ThermoFisher Scientific) and carried out in the Rotor-Gene Q (QIAGEN®, Venlo, The Netherlands). The quantification of the relative expression of a total of nine DEGs was performed in triplicate and the fold changes were calculated by the 2−ΔΔCT method. Primers were designed using the Primer3web PCR primer design tool (version 4.1.0) and obtained by Eurofins genomics. The Actin housekeeping gene was used as an endogenous reference. The ΔΔCT was calculated by subtracting the ΔCT of the control sample from the ΔCT of the PEG-treated sample. The selected DEGs and their corresponding primer sequences are provided in Table S1.
2.8. Weighted Gene Correlation Network Analysis
Co-expression analysis was performed using the WGCNA package in R [35] to identify gene clusters with highly correlated expression profiles (hub genes). In detail, an adjacency matrix was created using FPKM values of the unigenes obtained by RNA-Seq, filtered considering a threshold of FPKM > 1 in at least one sample. The pickSoftThreshold function was used to choose the proper soft-thresholding power [35]. In particular, for each analysis, the lowest power for which the scale-free topology fit index reaches 0.90 was used. The specific WGCNA analysis parameters in this study were set as follows: soft powers β = 14, WGCNA “mergeCutHeight” = 0.25. The adjacency matrix was transformed into a topological overlap matrix (TOM) as well as the corresponding dissimilarity (1-TOM). Afterwards, a hierarchical clustering dendrogram of the 1-TOM matrix was constructed to classify similar genes’ expression into different gene co-expression modules. To achieve the high reliability of the results, the minimum number of genes was set to 30. The relationships between each module and the MDA and H2O2 levels were estimated by calculating Pearson’s correlation using the module eigengene values. Therefore, modules with high correlation coefficients and a correlation padj ≤ 0.05 were selected for subsequent analysis. Gene Significance (GS) and Module Membership (MM) were calculated and a threshold of 0.65 was applied. Modules with correlation significance exceeding 0.7 were selected for further analysis.
2.9. Statistical Analysis
The statistical analyses were performed using R Studio (R version 2023.9.1.494) [44]. The significance of differences for MDA and H2O2 measurements was tested by ANOVA (p-value < 0.05).
3. Results
3.1. Plant Phenotype and Quantification of MDA and H2O2 Content
After 10 days of PEG treatment, the visual inspection of the plant phenotype revealed that Carrizo plants showed evident signs of water stress, including wilting and curled yellow leaves. In contrast, the Bitters plants exhibited milder symptoms, with their leaves retaining a greener hue and displaying less pronounced curling (Figure S1). To assess the level of oxidative stress, MDA and H2O2 content were measured as described in the Materials and Methods section. With regard to the MDA content, under drought stress conditions (PEG), Carrizo plants accumulated higher MDA levels than the control plants, whereas no significant differences were observed between the PEG-treated and CK plants in Bitters (Figure 1A). Moreover, the PEG-treated plants contained a higher amount of H2O2 content than the CK plants in both genotypes, reaching the highest level in PEG-treated Carrizo Citrange plants (Figure 1B).
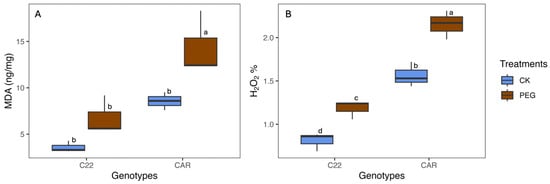
Figure 1.
Malondialdehyde (MDA) (A) and hydrogen peroxide (H2O2) (B) content in treated (PEG) and control (CK) plants of two citrus rootstock genotypes after 10 days of PEG treatment. Each point represents the mean value of three replicates. Different letters indicate significantly different values (ANOVA, p < 0.05); CAR, Carrizo Citrange; C22, Bitters.
3.2. Transcript Assembly and Annotation
Raw reads were filtered to remove reads containing adapters or reads of low quality so that the downstream analyses were based on a total of 387 million clean reads with an average of ~32 million reads per sample, with the average percentage of Q30 and GC being 91.1% and 44%, respectively (Table 1). The de novo assembly of clean reads resulted in 190,539 transcripts and 55,679 unigenes with N50 lengths of 2544 and 2384, respectively (Table 1), indicating that good contiguity of the transcriptome had been achieved. To evaluate the assembly consistency, the filtered unique reads were mapped back to the final assembled leaf transcriptome and the average read mapping rate, using the alignment software Bowtie2, was 77.22% (Table 1). Both transcript and unigene length distributions are reported in Figure S2. These data showed that the throughput and sequencing quality were high, allowing us to perform further analyses.

Table 1.
Summary statistics of the RNA quality and sequencing results.
To achieve comprehensive gene functional annotation, all assembled unigenes were blasted against public databases, including the National Center for Biotechnology Information (NCBI), Protein family (Pfam), Clusters of Orthologous Groups of proteins (KOG/COG), Swiss-Prot, Ortholog database (KO) and Gene Ontology (GO) (Table 2). A total of 43,905 unigenes were annotated in at least one searched database, accounting for 78.85% of the obtained total unigenes. Among them, 34,859 (62.6%) and 36,131 (64.89%) assembled unigenes showed identity with sequences in the Nr and Nt databases, respectively. The percentage of assembled unigenes homologous to sequences in KO, Swiss-Prot, Pfam, GO, and KOG databases were 23.67, 47.77, 44.58, 44.58, and 16.05%, respectively (Table 2).
Table 2.
The number and percentage of successfully annotated genes.
3.3. Identification of Differentially Expressed Genes (DEGs)
The characterisation of the citrus plant’s transcriptional response to drought stress was carried out by the identification of the unigenes whose expression level changed upon PEG treatment within each genotype. A total of 6092 DEGs (2119 upregulated and 3973 downregulated genes) were identified in the CAR_PEG vs. CAR_CK comparison (Figure 2A), whereas 320 DEGs (15 upregulated and 305 downregulated genes) were identified in the C22_PEG vs. C22_CK comparison, thus indicating that a limited PEG-induced transcriptomic reprogramming occurred in C22 and that nearly all genes were downregulated under drought conditions (Figure 2B). The validation of expression levels for nine selected DEG candidates was carried out by quantitative real-time PCR (qRT-PCR). The results show high congruence between RNA-Seq results and qRT-PCR analysis (coefficient of determination R2 = 0.99), indicating the reliability of RNA-Seq in the quantification of gene expression (Figure S3).
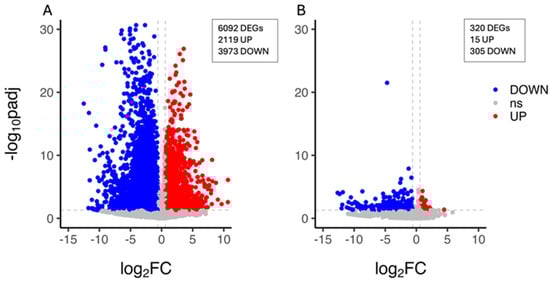
Figure 2.
Volcano plot showing the differentially expressed genes (DEGs) in the CAR_PEG vs. CAR_CK (A) and the C22_PEG vs. C22_CK (B) comparisons. Red dots represent the upregulated genes with statistical significance, the blue dots represent the downregulated genes with statistical significance, and the grey dots (ns) are DEGs with −log10padj < 1.3, adopting a log2 Fold Change threshold of 1 (2.0 fold change). The X-axis is the gene expression change, and the Y-axis is the p-value adjusted after normalisation.
3.4. Functional Classification of DEGs
GO terms and KEGG pathway functional enrichments were performed to identify biological processes or pathways involved in drought stress response. We performed GO enrichment analysis on the set of DEGs comparing PEG-treated and CK plants within each genotype (CAR_PEG vs. CAR_CK and C22_PEG vs. C22_CK). Figure 3 shows the ten most significantly enriched terms within each GO category for each comparison. Considering the “Molecular function” category, “heme binding”, “tetrapyrrole binding”, and “cellulose synthase activity” are the three most enriched GO terms in the CAR_PEG vs. CAR_CK comparison (Figure 3A), while “structural constituent of ribosome”, “structural molecule activity”, and “anion binding” are the three most enriched GO terms in the C22_PEG vs. C22_CK comparison (Figure 3B). Among the ten most significantly enriched terms, both genotypes share only two significantly enriched terms: “oxidoreductase activity” (GO: 0016491) and “catalytic activity” (GO: 0003824). In the “Biological processes” category, “cellulose biosynthetic process”, “cellulose metabolic process”, and “UDP-glucose metabolic process” are the three most enriched GO terms in the CAR_PEG vs. CAR_CK comparison (Figure 3A). “Organonitrogen compound metabolic process”, “ribosome biogenesis”, and “ribonucleoprotein complex biogenesis” are the three most enriched GO terms in the C22_PEG vs. C22_CK comparison (Figure 3B). Finally, in the “Cellular component” category, “microtubule”, “photosystem”, and “thylakoid part” are the three most enriched GO terms in the CAR_PEG vs. CAR_CK comparison (Figure 3A), while “ribosome”, “macromolecular complex”, and “non-membrane-bounded organelle” are the three most enriched GO terms in the C22_PEG vs. C22_CK comparison (Figure 3B).
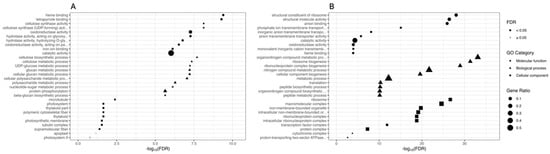
Figure 3.
Gene Ontology (GO) enrichment analysis for the DEGs in the CAR_PEG vs. CAR_CK (A) and the C22_PEG vs. C22_CK (B) comparisons. The X-axis indicates the -log10(FDR), and the Y-axis indicates the GO terms within each category. Black dots indicate significantly enriched terms (FDR < 0.05), while grey dots indicate non-significantly enriched terms (FDR ≥ 0.05). Symbols indicate the GO category (circles indicate the Molecular function category, triangles indicate the Biological process category, and squares indicate the Cellular component category). The dot size indicates the Gene Ratio.
The sets of DEGs originating from the two comparisons were also mapped onto the KEGG database. Figure 4 shows the main ten KEGG pathways, sorted by decreasing significance value (adjusted p-value). In the CAR_PEG vs. CAR_CK comparison, the most significantly enriched terms are “Metabolic pathways”, “Other glycan degradation”, and “Starch and sucrose metabolism”, indicating that a deep reprogramming of these metabolisms under drought conditions occurred. Other important pathways such as “Biosynthesis of secondary metabolites”, “Phenylpropanoid biosynthesis”, “Glycerophospholipid metabolism”, and “Cutin, suberin and wax biosynthesis” were also found to be deregulated by drought (Figure 4A). In contrast, in the C22_PEG vs. C22_CK comparison, no terms are significantly enriched (padj ≥ 0.05). However, the most represented terms are “Glucosinolate biosynthesis”, “Phenylpropanoid biosynthesis”, and “Tryptophan metabolism” (Figure 4B).
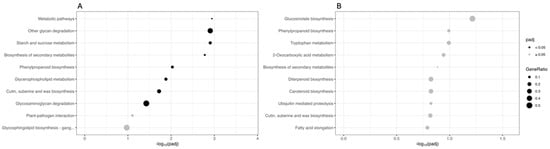
Figure 4.
Kyoto Encyclopedia of Genes and Genomes (KEGG) enrichment analysis for the DEGs in the CAR_PEG vs. CAR_CK (A) and the C22_PEG vs. C22_CK (B) comparisons. The X-axis indicates the −log10(padj), and the Y-axis indicates the KEGG pathways. Black dots indicate significantly enriched terms (padj < 0.05), while grey dots indicate non-significantly enriched terms (padj ≥ 0.05). The dot size indicates the Gene Ratio.
3.5. Identification of Functional Genes Related to Drought Stress Tolerance
To unravel citrus responses to drought stress, we analysed the RNA-Seq datasets from the two comparisons, focusing on genes known to be related to water scarcity, from drought sensing and signalling to the main downstream metabolisms [45,46]. With regard to the C22_PEG vs. C22_CK comparison, the subsets of DEGs associated with the three most significant GO terms in each category were specifically examined. Notably, among these, several genes related to cell cycle and growth were identified, including C. clementina protein PELPK1 and probable carboxylesterase 15, C. sinensis protein ENDOSPERM DEFECTIVE 1, C. sinensis G2/mitotic-specific cyclin S13-7, C. sinensis cell division control protein 6 homologue B, C. clementina microtubule-associated protein RP/EB family member 1C, C. clementina cell division cycle 20.2, and homologues to A. thaliana Cyclin-dependent kinase B2-2 and Protein POLLENLESS 3-LIKE 2 (Table 3). Interestingly, clusters specifically associated with the response to drought stress were observed in CAR_PEG vs. CAR_CK, which exhibited a more remarkable reorganisation of the transcriptome in response to water scarcity. Being worthy of attention, the following analysis was focused on the Carrizo genotype.
Table 3.
List of DEGs related to drought stress response identified in C22_PEG vs. C22_CK comparison.
3.5.1. Drought Sensing and Signalling
The analysis of differently expressed genes between CAR_PEG and CAR_CK samples revealed several Calmodulin-like proteins (CMLs), exhibiting both upregulation and downregulation in response to drought stress (Table 4). Specifically, C. sinensis calmodulin-like proteins 3 and 8, C. sinensis probable calcium-binding protein CML41, and homologue to A. thaliana Calmodulin-like protein 30 were found downregulated, whereas C. sinensis probable calcium-binding proteins CML11 and 16, C. clementina probable calcium-binding protein CML44, and homologue to A. thaliana Calcium-binding proteins CML37, 42, and 50 were found upregulated. CMLs act as calcium ion (Ca2+) sensors and serve as key components of calcium signalling networks in plants, playing pivotal roles in coordinating cellular responses to environmental stimuli and developmental cues [47]. In the comparison of CAR_PEG vs. CAR_CK, a cluster encoding the Citrus clementina 9-cis-epoxycarotenoid dioxygenase gene (NCED3) and a homologue to A. thaliana molybdenum cofactor sulfurase (ABA3), both encoding pivotal enzymes in ABA biosynthesis, exhibited increased expression in response to drought. Conversely, genes involved in ABA perception and signalling, such as those encoding homologues to A. thaliana PYR1-LIKE 7 (PYL7) and A. thaliana leucine-rich repeat (LRR) receptor-like kinase (RLK) (GUARD CELL HYDROGEN PEROXIDE-RESISTANT1, GHR1), playing a crucial role in the early ABA signalling cascade, showed downregulation. Nevertheless, a homologue to A. thaliana G-PROTEIN COUPLED RECEPTOR 2 (GCR2), encoding a plasma-membrane-localised ABA receptor known to initiate the ABA-induced responses, was upregulated. Several protein phosphatase 2C (PP2C) genes, including SAG113 and ABI1, involved in ABA signalling, were upregulated under water stress conditions. Furthermore, an upregulated homologue of Oryza sativa Serine/threonine-protein kinase (SAPK9), which belongs to the SNF1-RELATED PROTEIN KINASE (SnRK2) family [48], was identified. This kinase plays a positive regulatory role in both ABA-responsive transcription factors and the downstream metabolic pathways influenced by ABA response. Finally, the Responsive to Dehydration 29B (RD29B) gene, a well-known ABA-induced stress-responsive gene, was induced by drought.
Table 4.
List of DEGs related to drought stress response identified in CAR_PEG vs. CAR_CK comparison.
3.5.2. ROS Scavenging
As shown in Table 4, clusters known to be involved in enzymatic ROS scavenging were retrieved. Our analysis revealed the upregulation of a cluster encoding C. sinensis Glutathione reductase (GR), a key player in ROS scavenging, involved in the reduction of glutathione disulfide (GSSG) to the sulfhydryl form glutathione (GSH) [49,50]. Additionally, the upregulation of a homologue A. thaliana Glutathione Peroxidase 1 (GPX1), which utilises glutathione to reduce H2O2 and is involved in the reduction of lipid and organic hydroperoxides [51], was observed. Moreover, a cluster encoding a homologue of A. thaliana L-ascorbate peroxidase S (APXS), which utilises ascorbic acid as its specific electron donor to reduce H2O2 to water [52], was upregulated in response to water scarcity in Carrizo (Table 4).
3.5.3. Osmolyte Biosynthesis
A significant upregulation of C. sinensis 1-delta-pyrroline-5-carboxylate synthase (P5CS), a key enzyme in proline biosynthesis, was registered in the CAR_PEG vs. CAR_CK comparison (Table 4). Moreover, a homologue of A. thaliana ornithine-δ-aminotransferase (δ-OAT), involved in an alternative biosynthetic pathway of proline under stress conditions [53,54], was among the upregulated genes. The expression of a cluster encoding a homologue of A. thaliana choline monooxygenase (CMO) was induced by drought in the CAR_PEG vs. CAR_CK comparison. CMO catalyses the conversion of choline into betaine aldehyde, a crucial intermediate in the well-known osmoprotectant glycine betaine biosynthetic pathway [55]. The downregulation of a cluster encoding a homologue of A. thaliana Polyamine Oxidase 5 (PAO5), an enzyme responsible for the oxidation of polyamines resulting in H2O2 production, was also observed (Table 4). An upregulated cluster encoding for C. clementina Galactinol synthase 2 (GOLS2) was identified in the CAR_PEG vs. CAR_CK comparison (Table 4). Galactinol synthase plays a crucial role in the biosynthesis of raffinose family oligosaccharides (RFOs), which act as osmoprotectants in plants [56,57]. Two clusters encoding C. sinensis beta-amylase 1 (BAM1) and Alpha-amylase 3 (AMY3), both involved in carbohydrate metabolism, were found upregulated (Table 4). BAM1 acts specifically at the nonreducing ends of α-1,4–linked glucan chains producing β-maltose, and AMY3 collaborates with BAM1 in facilitating starch breakdown in the leaves during osmotic stress [58]. Finally, a cluster encoding a homologue of A. thaliana Branched-chain-amino-acid aminotransferase 2 (BCAT2), exhibiting upregulation, was identified (Table 4) in the CAR_PEG vs. CAR_CK comparison. BCAT2 is an enzyme that catalyses the transfer of an amino group from branched-chain amino acids (BCAAs), such as leucine, isoleucine, and valine, to α-ketoglutarate, forming branched-chain keto acids (BCKAs) and glutamate.
3.5.4. Cell Wall Metabolism
The GO enrichment analysis of the CAR_PEG vs. CAR_CK comparison revealed a significant enrichment of terms associated with cell wall metabolism. Among them, we identified 33 DEGs implicated in cellulose synthesis, cell wall biogenesis, and modification (Table 5). Notably, our analysis revealed the presence of several cellulose synthase proteins, including homologues to A. thaliana Cellulose synthase-like protein B4 and Cellulose synthase-like protein G2, as well as homologues to O. sativa Cellulose synthase-like protein H2 and Cellulose synthase A catalytic subunit 4. Additionally, C. sinensis cellulose synthase-like protein D5, C. sinensis cellulose synthase A catalytic subunits 1, 2, and 4, and C. clementina cellulose synthase A catalytic subunits 7 and 8 were also identified. Several Xyloglucan endotransglucosylase/hydrolase (XTH) proteins, which play a crucial role in modifying the structure and properties of the cell wall in plants, were also identified including C. sinensis xyloglucan endotransglucosylase/hydrolase protein 2-like, 5, 9, 33, and B, as well as C. clementina probable xyloglucan endotransglucosylase/hydrolase protein 6. Finally, DEGs related to cell wall modification were also identified. These DEGs include C. clementina pectinesterase 1, C. sinensis pectinesterase 2, 8, and 53, C. clementina probable pectinesterase/pectinesterase inhibitor 25 and 61, C. sinensis probable pectinesterase/pectinesterase inhibitor 12 and 51, A. thaliana pectinesterase/pectinesterase inhibitor 6, 40, and 41, and C. sinensis polygalacturonase and C. sinensis pectate lyase-like. Notably, all of these DEGs exhibited downregulation in response to drought stress, except for those involved in hemicellulose biosynthesis (“Cellulose synthase-like protein B4, H2, and G2”), which showed upregulation.
Table 5.
List of DEGs related to cell wall identified in CAR_PEG vs. CAR_CK comparison.
3.6. Analysis of Transcription Factor Gene Families
A total of 345 DEGs encoding transcription factors (TFs) were identified and categorised into families. Figure 5 shows the number of both up- and downregulated DEGs across the ten most abundant families. In the CAR_PEG vs. CAR_CK comparison, 29 DEGs belong to NAC, 28 to MYB-related, 28 to MYB, and 27 to AP2/ERF-ERF families, respectively. The majority underwent downregulation in response to drought stress, except for the bZIP family (Figure 5A). Conversely, in the C22_PEG vs. C22_CK comparison (Figure 5B), only a total of 21 DEGs encoding TFs were recruited. All DEGs divided into ten TF families were downregulated by drought stress, except for those belonging to the NAC and GNAT families. In particular, five DEGs belong to AP2/ERF-ERF, four to WRKY, three to MYB, and two to NAC families, respectively (Figure 5B).
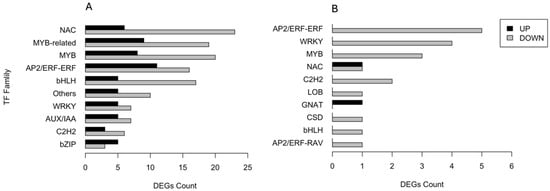
Figure 5.
Distribution of the ten most abundant families of transcription factors responsive to drought stress in the CAR_PEG vs. CAR_CK (A) and the C22_PEG vs. C22_CK (B) comparisons.
3.7. WCGNA Analysis
The application of WGCNA based on the expression data of 6255 unigenes in orange leaves, considering an FPKM > 1 threshold, aimed to establish correlations between MDA or H2O2 levels and gene expression patterns. Using the parameters and thresholds indicated in the Materials and Methods section, these genes were grouped into nine co-expressed modules, each represented by a branch of the tree (Figure S4). The number of eigengenes in different modules is reported in Figure S5. The grey60 (1988), turquoise (1720) and darkorange (1220) modules include the highest number of eigengenes, whereas the grey60 module (13) gathered the lowest number of eigengenes (Figure S5). As shown in Figure 6, illustrating the module–trait relationships, the grey60 module exhibited significant negative correlations with both MDA and H2O2 contents, showing −0.88 and −0.91 correlation coefficients, respectively. Similarly, the darkturquoise module displayed significant positive correlations with MDA (0.82), whereas the turquoise module exhibited a significant correlation solely with H2O2 (0.7) (Figure 6).
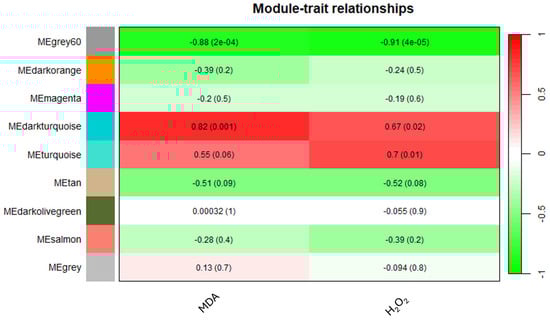
Figure 6.
Heatmap of the correlation between modules and MDA and H2O2 levels.
In the WGCNA, GS indicates the correlation between a gene and a specific trait, while MM reflects the correlation between an individual gene and the module eigengene. Figure S6 illustrates the relationships between MM and GS for the traits of interest: MDA and H2O2. By filtering for MM and GS values ≥ 0.65, 1269 eigengenes correlated with H2O2 in the grey60 module and 1242 eigengenes were discovered to correlate with MDA. Intriguingly, all 1242 eigengenes correlating with MDA were also included within the 1269 eigengenes correlating with H2O2 (Figure 7), so that 27 genes were exclusively correlated with H2O2 content (Figure 7). Notably, all 1269 eigengenes correlating with H2O2 were DEGs in the CAR_PEG vs. CAR_CK comparison. Among them, only 16 genes were in the C22_PEG vs. C22_CK comparison (Figure 7). Similarly, a total of 1232 eigengenes correlating with MDA content were DEGs, and 1223 were within the CAR_PEG vs. CAR_CK comparison, whereas only nine genes were DEGs exclusively in the C22_PEG vs. C22_CK comparison. Finally, only 10 genes were in common between the comparisons (Figure 7). Within the turquoise module positively correlating with H2O2 content, all 817 eigengenes were DEGs in the CAR_PEG vs. CAR_CK comparison, whereas only one eigengene was differentially expressed in the C22_PEG vs. C22_CK comparison (Figure 8). Similarly, in the darkturquoise module, positively correlating with MDA levels, a total of 73 eigengenes were discovered, all of them being DEGs in CAR_PEG vs. CAR_CK comparison, whereas only one eigengene was differentially expressed in the C22_PEG vs. C22_CK comparison (Figure 8).
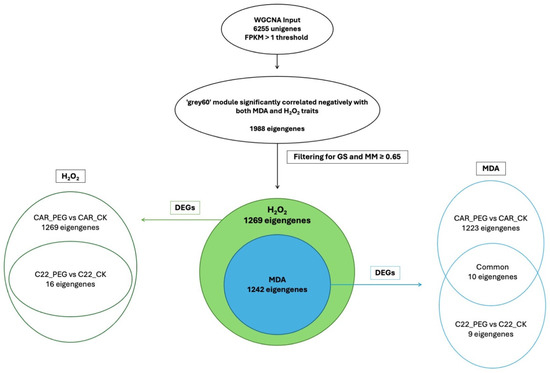
Figure 7.
Diagrams illustrating the abundance and distribution of eigengenes associated with the grey60 module across various traits and comparisons.
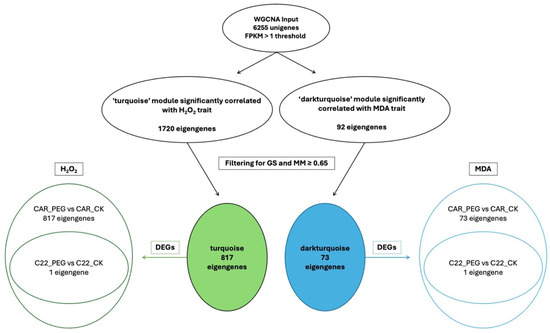
Figure 8.
Diagrams illustrating the abundance and distribution of eigengenes associated with the turquoise and darkturquoise modules across various traits and comparisons.
Transcription Factors Among the Eigengenes in Each Module
The genes belonging to the aforementioned modules underwent filtering based on their classification as TFs. Among them, several TFs are associated with the regulation of secondary wall biosynthesis, plant growth, and drought response in the CAR-PEG vs. CAR_CK comparison (Table 6). With regard to cell wall biogenesis, five TFs were identified within the grey60 module. These include genes coding a homologue of C. clementina NAC domain-containing protein 104 (NAC104/XND1), a homologue of C. clementina transcription repressor OFP4 (OFP4), and a homologue of A. thaliana NAC domain-containing protein 37 (NAC037/VND1), which negatively correlate with both MDA and H2O2 levels. Conversely, C. sinensis NAC domain-containing protein 12-like (NAC012/SND1) and C. sinensis transcription factor MYB83 (MYB83) were found to negatively correlate exclusively with MDA content (Table 6). Genes coding proteins involved in growth dynamics showing a negative correlation with both MDA and H2O2 levels were also found in the grey60 module, specifically, a homologue of C. clementina Growth-regulating factor 7 (GRF7) and C. sinensis B-box zinc finger protein 20 (BBX20/BZS1). Moreover, genes coding proteins involved in growth dynamics also show a positive correlation with H2O2 levels within the turquoise module. In particular, a homologue of A. thaliana Homeobox-leucine zipper protein ATHB-12-like (ATHB-12), a transcription factor required for ABA-mediated growth inhibition but not for stomatal closure, and a C. sinensis probable N-acetyltransferase HLS1 (HLS1) were found upregulated within the turquoise module (Table 6). Remarkably, HLS1 is the sole gene among the selected TFs displaying deregulation in both genotypes (data not shown).
Table 6.
List of DE TFs identified by the WGCNA analysis in the CAR_PEG vs. CAR_CK comparison.
Finally, several genes coding TFs involved in response to drought showed correlation with either MDA or H2O2 contents in the grey60, turquoise, and darkturquoise modules. Within the grey60 module, a gene encoding C. sinensis homeobox-leucine zipper (HAT22/ABIG1) negatively correlates with both H2O2 and MDA amount. Instead, four TFs positively correlate with H2O2 within the turquoise module, namely, C. sinensis ethylene-responsive transcription factor RAP2-1-like (RAP2.1), a negative regulator of DREB-type activators, C. sinensis cell differentiation protein rcd1-like (RCD1), and two clusters encoding DREB-type genes, namely, C. sinensis dehydration-responsive element-binding protein 2A (DREB2A) and a homologue of C. clementina dehydration-responsive element-binding protein 3 (DREB3/TINY2) (Table 6). These genes act as transcriptional activators, crucial in regulating gene expression under drought-stress conditions. Finally, a gene coding C. sinensis transcription factor (MYB2), known to act as a positive regulator conferring tolerance to salt, cold, and dehydration stress in rice, was found to be positively correlated to MDA in the darkturquoise module (Table 6).
4. Discussion
The impact of abiotic and biotic stresses on plant and crop growth, as well as on reproduction, is substantial. Unravelling the intricate molecular mechanisms of the cellular responses to these stresses is crucial for addressing challenges related to climate change and food security. Recent studies have investigated the transcriptome changes of various citrus rootstock genotypes under drought stress by RNA-Seq. Sweet orange [Citrus sinensis (L.) Osbeck var. Westin] grafted onto Rangpur lime (Citrus limonia Osbeck, “Santa Cruz” selection) or “Flying Dragon” trifoliate orange [Poncirus trifoliata (L.) Raf.] were exposed to a progressive soil water deficit by reducing the irrigation volume [59]. In that study, drought tolerance was shown to be related to the activation of genes involved in cell wall metabolism, soluble carbohydrates, and antioxidants, along with the downregulation of genes associated with starch metabolism, light reactions, and the ethylene signalling pathway [59]. More recently, the transcriptome analysis of “Longhuihong” navel orange (Citrus sinensis Osbeck cv. Longhuihong), a bud mutant of “Newhall” navel orange, along with “Newhall” navel orange (Citrus sinensis Osbeck cv. Newhall), both grafted on trifoliate orange (Poncirus trifoliata (L.) Raf.) and exposed to drought stress, suggested that the heightened tolerance of the mutant is associated with elevated levels of total waxes and aliphatic wax compounds, proline, soluble sugar, and significantly enhanced ROS-scavenging activities [60].
In this work, the results of RNA sequencing and the de novo assembly of two Citrus rootstock genotypes under PEG-induced drought stress are reported. The phenotype (Figure S1) and MDA levels clearly indicated a minimal impact of drought on Bitters plants. In this genotype, MDA levels slightly increased under drought, but they were not significantly higher than those in control plants. Differential gene expression analysis revealed a very low number of DEGs between C22 PEG-treated and control plants, mostly downregulated, suggesting that only a very moderate rearrangement of the transcriptome in response to stressful conditions occurred, with no identification of genes known to be directly involved in the response to drought stress. However, the observed downregulation of genes mainly related to the cell cycle and plant growth suggests that C22 plants modulated growth rates to adapt to challenging conditions under PEG treatment. On the contrary, Carrizo Citrange plants exhibited marked susceptibility to water stress, as pointed out by both phenotypic changes and the significant increase in MDA and H2O2 levels compared to control plants. Moreover, the upregulation of various ROS-scavenging enzymes observed in Carrizo plants under drought stress indicates the plant’s active response to mitigate the excessive accumulation of ROS. Similarly, the increased expression of genes involved in osmolyte biosynthesis (proline, glycine betaine, galactinol, and maltose) are evident indicators of stress-overcoming attempts to regulate osmotic balance. An essential physiological characteristic of drought-tolerant plants is their ability to increase cell wall elasticity and limit transpiration during drought conditions [61]. In Carrizo plants, a total of 27 DEGs implicated in cell wall biosynthesis and modification have been identified, the majority of which were downregulated under drought stress conditions. Among these DEGs, we found several genes encoding enzymes that play a critical role in modifying the structure and properties of the cell wall, aiding in cell wall loosening, a crucial process for plant adaptation to drought stress [62]. The involvement of these cell-wall-related proteins in plant response to drought stress has been documented in several previous studies and, in particular, Cellulose Synthase-Like D5 (CSLD5) has been proposed to be indispensable for osmotic stress tolerance in Arabidopsis, as mutants with decreased CSLD5 expression accumulate elevated ROS levels under osmotic stress and exhibit heightened sensitivity to the oxidative stress [63]. The downregulation of these genes encoding cell-wall-related proteins in Carrizo plants under drought stress suggests their potential vulnerability to such conditions.
The development of resistance to drought stress in plants involves intricate physiological signalling pathways, including ABA (abscisic acid)- and ROS (reactive oxygen species)-induced pathways, as well as calcium ion (Ca2+) currents. The synthesis, sequestration, transportation, and turnover of ABA play a pivotal role in regulating critical abiotic stress responses, specifically influencing water balance and osmotic stress tolerance under conditions of drought and salt stress [64]. In our investigation, elevated expression levels of a gene homologous to Citrus clementina 9-cis-epoxycarotenoid dioxygenase (NCED3) and another homologous to A. thaliana molybdenum cofactor sulfurase (ABA3) in Carrizo were observed. These genes encode crucial enzymes involved in ABA biosynthesis whose heightened expression suggests that ABA synthesis persisted after 10 days under drought-stress conditions. Once synthesised, ABA initiates an elevation in Ca2+ currents by activating H2O2 production, a significant component of ROS in guard cells [65]. Calmodulin-like proteins, known as CMLs, emerge as potential candidates for Ca2+-binding proteins, acting as sensors to perceive and transmit the Ca2+ signal in cellular signalling pathways [47], including their involvement in responding to various abiotic stress factors such as drought, salt, and osmotic stress [66]. However, it is intriguing that certain AtCMLs function as negative regulators of the ABA accumulation induced by drought stress. Therefore, our data suggest that the differentially expressed CMLs, whether functioning as positive or negative regulators, are implicated in the drought signalling pathway in Carrizo. ABA possesses various receptors, including ABAR/CHLH, GCR2, GTG1/2, and PYR/PYL/RCAR. Specifically, the PYR/PYL/RCAR protein attaches to ABA molecules outside the cell membrane. This interaction then hinders the phosphatase activity of the downstream protein phosphatase PP2C [67]. The deactivation of PP2C results in the accumulation of the active configuration of SNF1-RELATED PROTEIN KINASE (SnRK2) that, in turn, serves as a positive regulator for ABA-responsive transcription factors, as well as for downstream ABA-responsive metabolic pathways. Nevertheless, we registered the downregulation of two genes associated with early ABA signalling pathways. These genes are homologous to A. thaliana PYR1-LIKE 7 (PYL7) and A. thaliana leucine-rich repeat (LRR) receptor-like kinase (RLK), known as GUARD CELL HYDROGEN PEROXIDE-RESISTANT1 (GHR1). These findings indicate that PYL7 and GHR1 might not be active participants in the ABA signalling pathways in Carrizo plants under drought stress. In our analysis, several PP2C genes, including SAG113 and ABI1, were upregulated under water stress conditions. PP2Cs are well known for their negative regulatory impact on ABA signalling [68]. During drought stress, modulating ABA responses can be crucial for both plant survival and growth, and it could involve adjusting the sensitivity of cells to ABA or regulating the downstream signalling pathways to promote growth under stress conditions.
Transcription factors stand as pivotal regulators, governing the expression of a broad range of target genes and consequently impacting the level of drought tolerance in plants. They play an important role in converting stress-induced signals to cellular responses. The WGCNA analysis enabled the identification of TFs whose expression showed positive or negative correlations with the levels of MDA and/or H2O2. Among them, a group of TFs within the grey60 module exhibiting significant negative correlations with MDA content are related to cell wall biosynthesis and are all downregulated in Carrizo plants. In particular, NAC012/SND1 involves the binding to the promoter regions of Myb46, thus leading to lignin biosynthesis induction.
MYB83 is known to be directly activated by NAC012/SND1 displaying a coherent expression pattern [69]. MYB83 facilitates the activation of downstream transcription factors and a suite of genes crucial for secondary wall biosynthesis, cell wall modification, and programmed cell death pathways [70], representing an additional tier of master switches essential for regulating various aspects of secondary wall formation [69]. The downregulation observed in MYB83 aligns with NAC012/SND1 expression changes in Carrizo and accounts for the impairment of cell wall biosynthesis in Carrizo plants under drought. Studies have proposed that NAC104/XND1 acts as a negative regulator of secondary cell wall fibre synthesis and programmed cell death in Arabidopsis [71]. OFP4 protein belongs to a plant-specific family of regulatory proteins functioning as transcriptional repressors, exerting a negative regulatory influence on secondary cell wall formation [72,73,74]. These findings underscore the redundancy and interplay among transcription factors governing secondary wall biosynthesis processes in plants. Moreover, since both positive regulators (such as NAC012/SND1 and MYB83) and negative regulators (NAC104/XND1 and OFP4) of secondary cell wall synthesis were discovered to be downregulated, tight control of secondary wall synthesis probably occurred in response to drought stress in Carrizo plants.
Two TFs related to plant growth were found within the grey60 module, i.e., GRF7 and BZS1, respectively known for their involvement in the regulation of cell expansion [75] and function as a positive regulator of seedling photomorphogenesis. On the contrary, ATHB12 and HLS1, two TFs within the turquoise module, are upregulated and positively correlated with H2O2 content in Carrizo. ATHB12 is proposed to function as a negative regulator of growth and its induction is contingent upon the presence of ABA [76]. The HLS1 gene is implicated in negatively modulating both sugar and auxin signalling pathways in Arabidopsis [77]. Taken together, the regulation of their gene expression corroborates the global idea that drought reduces cell growth in Carrizo plants by orchestrating the expression of both positive and negative growth regulation. In particular, the upregulation of HLS1 in Carrizo plants might indicate that the suppression of auxin signalling through HLS1 is part of Carrizo’s response to drought stress. A group of six TFs whose function is related to drought response were discovered within the turquoise (4), grey60 (1), and darkturquoise (1) modules. The four TFs within the turquoise module negatively correlate with H2O2 content: RAP2.1, RCD1, DREB2A, and DREB3. RAP2.1 possesses an APETALA2 (AP2) domain binding to dehydration-responsive elements (DREs) and acts as a negative regulator of DREB-type activators. RAP2.1 undergoes robust induction in response to drought and cold stress via an ABA-independent pathway. Arabidopsis plants overexpressing RAP2.1 exhibit heightened sensitivity to cold and drought stresses [78], whereas the Arabidopsis mutant rcd1 displays reduced sensitivity to ABA, ethylene, and methyl jasmonate, leading to alterations in the expression of hormonally regulated genes and increased stomatal conductance compared to the wild-type [79]. RAP2.1 is upregulated in Carrizo under drought conditions, probably being part of an unfavourable gene list determining the sensitiveness to water deficit. Two DREB proteins, DREB2A and DREB3, were found upregulated in this work. DREB2A is recognised as a pivotal transcription factor involved in triggering gene expression during high-salt and dehydration stress in Arabidopsis vegetative tissues [80] as its overexpression confers significant drought stress tolerance [81]. The induction of DREB3 was observed following treatments with ABA, cold, drought, and wounding [82]. HAT22 negatively correlates with both MDA and H2O2 contents within the grey60 module and plays a crucial role in ABA-mediated growth inhibition during drought stress [83]. MYB2 is known to act as a positive regulator, conferring tolerance to salt, cold, and dehydration stress in rice. It has been demonstrated that plants overexpressing OsMYB2 displayed increased accumulation of compatible osmolytes such as soluble sugars, free proline, and LEA proteins, while concurrently reducing the accumulation of MDA and H2O2 [84]. Concordantly, the deregulation of these latter genes (DREB2A, DREB2B, HAT22, and MYB2), along with their function being evaluated in other species in conferring stress tolerance, suggests that they can be objects of further future work aimed to generate stress-tolerant citrus rootstocks using genome editing approaches.
5. Conclusions
In this study, we exposed two citrus rootstock genotypes, Carrizo Citrange and Bitters (C22), to PEG-induced drought stress in a hydroponic system to evaluate their transcriptomic responses. C22 plants exhibited a minimal response to 10-day drought stress, as evidenced by limited phenotypic impact, non-significant MDA level changes, and minimal transcriptomic reprogramming. On the other hand, Carrizo plants sharply responded to water scarcity, attempting to withstand the stressful conditions. A putative induction of the ABA-mediated responses to water deficit was registered, as indicated by the deregulation of key ABA biosynthetic genes and other genes implicated in ABA signalling. However, the upregulation of certain negative ABA regulators suggests a potential modulation of ABA-induced drought response to mitigate the negative impact of sustained ABA signalling on plant growth. WGCNA suggests that Carrizo plants reprogrammed their metabolic priorities, trying to shift from growth-related processes towards the activation of mechanisms tailored for drought response by deregulating specific TFs. The response of Carrizo to PEG-induced osmotic stress involves a robust engagement of osmolytes, evidenced by the upregulation of proline, glycine betaine, and RFO biosynthetic genes, alongside the downregulation of a polyamine catabolic gene. The significant modulation of gene expression related to cell wall metabolism represents a critical response to drought stress in Carrizo plants. The robust response of Carrizo plants to stress provides valuable insights into the strategies employed to cope with drought, offering potential candidate genes for enhancing drought tolerance in Citrus.
Supplementary Materials
The following supporting information can be downloaded at https://www.mdpi.com/article/10.3390/biology13080595/s1: Figure S1. Plant phenotypes. Figure S2. Transcript and unigene length distributions. Figure S3. RNA-Seq validation. Figure S4. Clustering dendrogram. Figure S5. Number of eigengenes. Figure S6. Gene significance and module membership. Table S1. Primer sequences.
Author Contributions
Conceptualisation, A.R.L.P.; methodology, E.S., A.S. and A.R.L.P.; software, E.S. and A.S.; validation, E.S.; formal analysis, E.S. and A.S.; investigation, E.S.; resources, E.S., A.C. and A.G.; data curation, E.S. and A.R.L.P.; writing—original draft preparation, E.S.; writing—review and editing, E.S., A.S., A.C., A.G. and A.R.L.P.; visualisation, A.C. and A.G.; supervision, A.R.L.P.; funding acquisition, A.R.L.P. All authors have read and agreed to the published version of the manuscript.
Funding
This research was funded by “Miglioramento delle produzioni agroalimentari mediterranee in condizioni di carenza di risorse idriche—WATER4AGRIFOOD”—Code: ARS01_00825, PON “RICERCA E INNOVAZIONE” 2014–2020, Azione II—Obiettivo Specifico 1b, CUP: B64I20000160005.
Institutional Review Board Statement
Not applicable.
Informed Consent Statement
Not applicable.
Data Availability Statement
The data presented in this study are openly available from the NCBI (https://www.ncbi.nlm.nih.gov/geo/ accessed on 5 August 2024, reference number PRJNA1126089).
Acknowledgments
The authors acknowledge the support received from Silvia Americo, Martina Cortese, and Fabio Arcidiacono during plant growth and sample collection.
Conflicts of Interest
The authors declare no conflicts of interest.
References
- Rosenzweig, C.; Jones, J.W.; Hatfield, J.L.; Ruane, A.C.; Boote, K.J.; Thorburn, P.; Antle, J.M.; Nelson, G.C.; Porter, C.; Janssen, S.; et al. The Agricultural Model Intercomparison and Improvement Project (AgMIP): Protocols and Pilot Studies. Agric. For. Meteorol. 2013, 170, 166–182. [Google Scholar] [CrossRef]
- Osakabe, Y.; Osakabe, K.; Shinozaki, K.; Tran, L.-S.P. Response of Plants to Water Stress. Front. Plant Sci. 2014, 5, 86. [Google Scholar] [CrossRef] [PubMed]
- Gupta, A.; Rico-Medina, A.; Caño-Delgado, A.I. The Physiology of Plant Responses to Drought. Science 2020, 368, 266–269. [Google Scholar] [CrossRef] [PubMed]
- Romero, P.; Navarro, J.M.; Pérez-Pérez, J.; García-Sánchez, F.; Gómez-Gómez, A.; Porras, I.; Martinez, V.; Botía, P. Deficit Irrigation and Rootstock: Their Effects on Water Relations, Vegetative Development, Yield, Fruit Quality and Mineral Nutrition of Clemenules Mandarin. Tree Physiol. 2006, 26, 1537–1548. [Google Scholar] [CrossRef] [PubMed]
- Puglisi, I.; Nicolosi, E.; Vanella, D.; Lo Piero, A.R.; Stagno, F.; Saitta, D.; Roccuzzo, G.; Consoli, S.; Baglieri, A. Physiological and Biochemical Responses of Orange Trees to Different Deficit Irrigation Regimes. Plants 2019, 8, 423. [Google Scholar] [CrossRef] [PubMed]
- Sicilia, A.; Basu, S.; Lo Piero, A.R. Genomic Design for Abiotic Stress Resistant Citrus. In Genomic Designing for Abiotic Stress Resistant Fruit Crops; Kole, C., Ed.; Springer International Publishing: Cham, Switzerland, 2022; pp. 41–59. ISBN 978-3-031-09875-8. [Google Scholar]
- Salekdeh, G.H.; Reynolds, M.; Bennett, J.; Boyer, J. Conceptual Framework for Drought Phenotyping during Molecular Breeding. Trends Plant Sci. 2009, 14, 488–496. [Google Scholar] [CrossRef] [PubMed]
- Chaves, M.M. Effects of Water Deficits on Carbon Assimilation. J. Exp. Bot. 1991, 42, 1–16. [Google Scholar] [CrossRef]
- Kele, Y.; Ünyayar, S. Responses of Antioxidant Defense System of Helianthus Annuus to Abscisic Acid Treatment under Drought and Waterlogging. Acta Physiol. Plant. 2004, 26, 149–156. [Google Scholar] [CrossRef]
- Chaves, M.M.; Oliveira, M.M. Mechanisms Underlying Plant Resilience to Water Deficits: Prospects for Water-Saving Agriculture. J. Exp. Bot. 2004, 55, 2365–2384. [Google Scholar] [CrossRef]
- García-Sánchez, F.; Syvertsen, J.P.; Gimeno, V.; Botía, P.; Perez-Perez, J.G. Responses to Flooding and Drought Stress by Two Citrus Rootstock Seedlings with Different Water-Use Efficiency. Physiol. Plant. 2007, 130, 532–542. [Google Scholar] [CrossRef]
- Pérez-Pérez, J.G.; Robles, J.M.; Tovar, J.C.; Botía, P. Response to Drought and Salt Stress of Lemon ‘Fino 49’ under Field Conditions: Water Relations, Osmotic Adjustment and Gas Exchange. Sci. Hortic. 2009, 122, 83–90. [Google Scholar] [CrossRef]
- Rodríguez-Gamir, J.; Primo-Millo, E.; Forner, J.B.; Forner-Giner, M.A. Citrus Rootstock Responses to Water Stress. Sci. Hortic. 2010, 126, 95–102. [Google Scholar] [CrossRef]
- Savé, R.; Biel, C.; Domingo, R.; Ruiz-Sánchez, M.C.; Torrecillas, A. Some Physiological and Morphological Characteristics of Citrus Plants for Drought Resistance. Plant Sci. 1995, 110, 167–172. [Google Scholar] [CrossRef]
- Aparicio-Durán, L.; Gmitter, F.G., Jr.; Arjona-López, J.M.; Calero-Velázquez, R.; Hervalejo, Á.; Arenas-Arenas, F.J. Water-Stress Influences on Three New Promising HLB-Tolerant Citrus Rootstocks. Horticulturae 2021, 7, 336. [Google Scholar] [CrossRef]
- Abu Glion, H.; Alkalai-Tuvia, S.; Zaaroor-Presman, M.; Chalupowicz, D.; Zanbar, M.; Amichai, M.; Cohen, S.; Shemer, T.; Sarig, S.; Fallik, E. Effects of Rootstock/Scion Combination and Two Irrigation Water Qualities on Cherry Tomato Yield and Postharvest Fruit Quality. Horticulturae 2019, 5, 35. [Google Scholar] [CrossRef]
- López-Serrano, L.; Canet-Sanchis, G.; Vuletin Selak, G.; Penella, C.; San Bautista, A.; López-Galarza, S.; Calatayud, Á. Pepper Rootstock and Scion Physiological Responses Under Drought Stress. Front. Plant Sci. 2019, 10, 38. [Google Scholar] [CrossRef] [PubMed]
- Zhang, L.; Marguerit, E.; Rossdeutsch, L.; Ollat, N.; Gambetta, G.A. The Influence of Grapevine Rootstocks on Scion Growth and Drought Resistance. Theor. Exp. Plant Physiol. 2016, 28, 143–157. [Google Scholar] [CrossRef]
- Castle, W.S.; Baldwin, J.C.; Muraro, R.P.; Littell, R. Performance of ‘Valencia’ Sweet Orange Trees on 12 Rootstocks at Two Locations and an Economic Interpretation as a Basis for Rootstock Selection. HortScience 2010, 45, 523–533. [Google Scholar] [CrossRef]
- Santana-Vieira, D.D.S.; Freschi, L.; da Hora Almeida, L.A.; de Moraes, D.H.S.; Neves, D.M.; Santos, L.M.D.; Bertolde, F.Z.; Filho, W.D.S.S.; da Silva Gesteira, A. Survival Strategies of Citrus Rootstocks Subjected to Drought. Sci. Rep. 2016, 6, 38775. [Google Scholar] [CrossRef]
- Davino, S.; Davino, M.; Sambade, A.; Guardo, M.; Caruso, A. The First Citrus Tristeza Virus Outbreak Found in a Relevant Citrus Producing Area of Sicily, Italy. Plant Dis. 2003, 87, 314. [Google Scholar] [CrossRef]
- Caruso, M.; Continella, A.; Modica, G.; Pannitteri, C.; Russo, R.; Salonia, F.; Arlotta, C.; Gentile, A.; Russo, G. Rootstocks Influence Yield Precocity, Productivity, and Pre-Harvest Fruit Drop of Mandared Pigmented Mandarin. Agronomy 2020, 10, 1305. [Google Scholar] [CrossRef]
- Modica, G.; Di Guardo, M.; Puglisi, I.; Baglieri, A.; Fortuna, S.; Arcidiacono, F.; Costantino, D.; La Malfa, S.; Gentile, A.; Arbona, V.; et al. Novel and Widely Spread Citrus Rootstocks Behavior in Response to Salt Stress. Environ. Exp. Bot. 2024, 225, 105835. [Google Scholar] [CrossRef]
- Scialò, E.; Sicilia, A.; Continella, A.; Modica, G.; Lo Piero, A.R. On the “Priming” Steps: Initial Results on the Effect of PEG-Induced Drought Stress upon the Oxidative Status and Related Gene Expression in Citrus Rootstocks. Acta Hortic. 2024, 1399, 131–138. [Google Scholar] [CrossRef]
- Zaher-Ara, T.; Boroomand, N.; Sadat-Hosseini, M. Physiological and Morphological Response to Drought Stress in Seedlings of Ten Citrus. Trees 2016, 30, 985–993. [Google Scholar] [CrossRef]
- Dong, B.; Liu, H.; Able, J.A.; Liu, M. Effects of Drought Stress on Pollen Sterility, Grain Yield, Abscisic Acid and Protective Enzymes in Two Winter Wheat Cultivars. Front. Plant Sci. 2017, 8, 1008. [Google Scholar] [CrossRef] [PubMed]
- Tong, S.; Ni, Z.; Peng, H.; Dong, G.; Sun, Q. Ectopic Overexpression of Wheat TaSrg6 Gene Confers Water Stress Tolerance in Arabidopsis. Plant Sci. 2007, 172, 1079–1086. [Google Scholar] [CrossRef]
- Djibril, S.; Mohamed, O.K.; Diaga, D.; Diégane, D.; Abaye, B.F.; Maurice, S.; Alain, B. Growth and Development of Date Palm (Phoenix dactylifera L.) Seedlings under Drought and Salinity Stresses. Afr. J. Biotechnol. 2005, 4, 9. [Google Scholar]
- Ziogas, V.; Tanou, G.; Belghazi, M.; Filippou, P.; Fotopoulos, V.; Grigorios, D.; Molassiotis, A. Roles of Sodium Hydrosulfide and Sodium Nitroprusside as Priming Molecules during Drought Acclimation in Citrus Plants. Plant Mol. Biol. 2015, 89, 433–450. [Google Scholar] [CrossRef] [PubMed]
- Sicilia, A.; Catara, V.; Dimaria, G.; Scialò, E.; Russo, M.; Gentile, A.; Lo Piero, A.R. Transcriptome Analysis of Lemon Leaves (Citrus limon) Infected by Plenodomus Tracheiphilus Reveals the Effectiveness of Pseudomonas Mediterranea in Priming the Plant Response to Mal Secco Disease. J. Plant Interact. 2023, 18, 2243097. [Google Scholar] [CrossRef]
- Russo, R.; Sicilia, A.; Caruso, M.; Arlotta, C.; Di Silvestro, S.; Gmitter, F.G.; Nicolosi, E.; Lo Piero, A.R. De Novo Transcriptome Sequencing of Rough Lemon Leaves (Citrus jambhiri Lush.) in Response to Plenodomus Tracheiphilus Infection. Int. J. Mol. Sci. 2021, 22, 882. [Google Scholar] [CrossRef]
- Sicilia, A.; Santoro, D.F.; Testa, G.; Cosentino, S.L.; Lo Piero, A.R. Transcriptional Response of Giant Reed (Arundo donax L.) Low Ecotype to Long-Term Salt Stress by Unigene-Based RNAseq. Phytochemistry 2020, 177, 112436. [Google Scholar] [CrossRef] [PubMed]
- Sicilia, A.; Testa, G.; Santoro, D.F.; Cosentino, S.L.; Lo Piero, A.R. RNASeq Analysis of Giant Cane Reveals the Leaf Transcriptome Dynamics under Long-Term Salt Stress. BMC Plant Biol. 2019, 19, 355. [Google Scholar] [CrossRef] [PubMed]
- Sicilia, A.; Russo, R.; Catara, V.; Lo Piero, A.R. Hub Genes and Pathways Related to Lemon (Citrus limon) Leaf Response to Plenodomus Tracheiphilus Infection and Influenced by Pseudomonas Mediterranea Biocontrol Activity. Int. J. Mol. Sci. 2024, 25, 2391. [Google Scholar] [CrossRef] [PubMed]
- Langfelder, P.; Horvath, S. WGCNA: An R Package for Weighted Correlation Network Analysis. BMC Bioinform. 2008, 9, 559. [Google Scholar] [CrossRef] [PubMed]
- Wu, Q.; Pan, Y.-B.; Su, Y.; Zou, W.; Xu, F.; Sun, T.; Grisham, M.P.; Yang, S.; Xu, L.; Que, Y. WGCNA Identifies a Comprehensive and Dynamic Gene Co-Expression Network That Associates with Smut Resistance in Sugarcane. Int. J. Mol. Sci. 2022, 23, 10770. [Google Scholar] [CrossRef] [PubMed]
- Li, Z.-X.; Zhang, W.-L.; Jue, D.-W.; Liu, X.; Jiang, Y.-S.; Tang, J.-M. Transcriptome Changes Induced by Botrytis Cinerea Stress and Weighted Gene Co-Expression Network Analysis (WGCNA) in Actinidia Chinensis. Plant Mol. Biol. Rep. 2022, 40, 389–401. [Google Scholar] [CrossRef]
- Azam, M.; Zhang, S.; Li, J.; Ahsan, M.; Agyenim-Boateng, K.G.; Qi, J.; Feng, Y.; Liu, Y.; Li, B.; Qiu, L.; et al. Identification of Hub Genes Regulating Isoflavone Accumulation in Soybean Seeds via GWAS and WGCNA Approaches. Front. Plant Sci. 2023, 14, 1120498. [Google Scholar] [CrossRef] [PubMed]
- Chauhan, J.; Srivastava, J.P.; Singhal, R.K.; Soufan, W.; Dadarwal, B.K.; Mishra, U.N.; Anuragi, H.; Rahman, M.A.; Sakran, M.I.; Brestic, M.; et al. Alterations of Oxidative Stress Indicators, Antioxidant Enzymes, Soluble Sugars, and Amino Acids in Mustard [Brassica juncea (L.) Czern and Coss.] in Response to Varying Sowing Time, and Field Temperature. Front. Plant Sci. 2022, 13, 875009. [Google Scholar] [CrossRef] [PubMed]
- López-Hidalgo, C.; Meijón, M.; Lamelas, L.; Valledor, L. The Rainbow Protocol: A Sequential Method for Quantifying Pigments, Sugars, Free Amino Acids, Phenolics, Flavonoids and MDA from a Small Amount of Sample. Plant Cell Environ. 2021, 44, 1977–1986. [Google Scholar] [CrossRef]
- Velikova, V.; Yordanov, I.; Edreva, A. Oxidative Stress and Some Antioxidant Systems in Acid Rain-Treated Bean Plants. Plant Sci. 2000, 151, 59–66. [Google Scholar] [CrossRef]
- Benjamini, Y.; Hochberg, Y. Controlling the False Discovery Rate: A Practical and Powerful Approach to Multiple Testing. J. R. Stat. Soc. Ser. B Methodol. 1995, 57, 289–300. [Google Scholar] [CrossRef]
- Bu, D.; Luo, H.; Huo, P.; Wang, Z.; Zhang, S.; He, Z.; Wu, Y.; Zhao, L.; Liu, J.; Guo, J.; et al. KOBAS-i: Intelligent Prioritization and Exploratory Visualization of Biological Functions for Gene Enrichment Analysis. Nucleic Acids Res. 2021, 49, W317–W325. [Google Scholar] [CrossRef] [PubMed]
- RStudio Team. RStudio: Integrated Development Environment for R. RStudio, PBC: Boston, MA, 2020. Available online: http://www.rstudio.com/ (accessed on 5 August 2024).
- Salvi, P.; Manna, M.; Kaur, H.; Thakur, T.; Gandass, N.; Bhatt, D.; Muthamilarasan, M. Phytohormone Signaling and Crosstalk in Regulating Drought Stress Response in Plants. Plant Cell Rep. 2021, 40, 1305–1329. [Google Scholar] [CrossRef] [PubMed]
- Takahashi, F.; Kuromori, T.; Urano, K.; Yamaguchi-Shinozaki, K.; Shinozaki, K. Drought Stress Responses and Resistance in Plants: From Cellular Responses to Long-Distance Intercellular Communication. Front. Plant Sci. 2020, 11, 556972. [Google Scholar] [CrossRef] [PubMed]
- McCormack, E.; Tsai, Y.-C.; Braam, J. Handling Calcium Signaling: Arabidopsis CaMs and CMLs. Trends Plant Sci. 2005, 10, 383–389. [Google Scholar] [CrossRef] [PubMed]
- Dey, A.; Samanta, M.K.; Gayen, S.; Maiti, M.K. The Sucrose Non-Fermenting 1-Related Kinase 2 Gene SAPK9 Improves Drought Tolerance and Grain Yield in Rice by Modulating Cellular Osmotic Potential, Stomatal Closure and Stress-Responsive Gene Expression. BMC Plant Biol. 2016, 16, 158. [Google Scholar] [CrossRef] [PubMed]
- Gill, S.S.; Anjum, N.A.; Hasanuzzaman, M.; Gill, R.; Trivedi, D.K.; Ahmad, I.; Pereira, E.; Tuteja, N. Glutathione and Glutathione Reductase: A Boon in Disguise for Plant Abiotic Stress Defense Operations. Plant Physiol. Biochem. 2013, 70, 204–212. [Google Scholar] [CrossRef] [PubMed]
- Lo Piero, A.R.; Mercurio, V.; Puglisi, I.; Petrone, G. Different Roles of Functional Residues in the Hydrophobic Binding Site of Two Sweet Orange Tau Glutathione S-Transferases. FEBS J. 2010, 277, 255–262. [Google Scholar] [CrossRef] [PubMed]
- Noctor, G.; Gomez, L.; Vanacker, H.; Foyer, C.H. Interactions between Biosynthesis, Compartmentation and Transport in the Control of Glutathione Homeostasis and Signalling. J. Exp. Bot. 2002, 53, 1283–1304. [Google Scholar] [CrossRef]
- Hussain, S.; Rao, M.J.; Anjum, M.A.; Ejaz, S.; Zakir, I.; Ali, M.A.; Ahmad, N.; Ahmad, S. Oxidative Stress and Antioxidant Defense in Plants Under Drought Conditions. In Plant Abiotic Stress Tolerance: Agronomic, Molecular and Biotechnological Approaches; Hasanuzzaman, M., Hakeem, K.R., Nahar, K., Alharby, H.F., Eds.; Springer International Publishing: Cham, Switzerland, 2019; pp. 207–219. ISBN 978-3-030-06118-0. [Google Scholar]
- Roosens, N.H.; Bitar, F.A.; Loenders, K.; Angenon, G.; Jacobs, M. Overexpression of Ornithine-δ-Aminotransferase Increases Proline Biosynthesis and Confers Osmotolerance in Transgenic Plants. Mol. Breed. 2002, 9, 73–80. [Google Scholar] [CrossRef]
- Wu, L.; Fan, Z.; Guo, L.; Li, Y.; Zhang, W.; Qu, L.-J.; Chen, Z. Over-Expression of an Arabidopsis δ-OAT Gene Enhances Salt and Drought Tolerance in Transgenic Rice. Chin. Sci. Bull. 2003, 48, 2594–2600. [Google Scholar] [CrossRef]
- Giri, J. Glycinebetaine and Abiotic Stress Tolerance in Plants. Plant Signal. Behav. 2011, 6, 1746–1751. [Google Scholar] [CrossRef]
- Nishizawa, A.; Yabuta, Y.; Shigeoka, S. Galactinol and Raffinose Constitute a Novel Function to Protect Plants from Oxidative Damage. Plant Physiol. 2008, 147, 1251–1263. [Google Scholar] [CrossRef]
- Valluru, R.; Van den Ende, W. Myo-Inositol and beyond—Emerging Networks under Stress. Plant Sci. 2011, 181, 387–400. [Google Scholar] [CrossRef]
- Thalmann, M.; Pazmino, D.; Seung, D.; Horrer, D.; Nigro, A.; Meier, T.; Kölling, K.; Pfeifhofer, H.W.; Zeeman, S.C.; Santelia, D. Regulation of Leaf Starch Degradation by Abscisic Acid Is Important for Osmotic Stress Tolerance in Plants. Plant Cell 2016, 28, 1860–1878. [Google Scholar] [CrossRef]
- Gonçalves, L.P.; Boscariol Camargo, R.L.; Takita, M.A.; Machado, M.A.; dos Soares Filho, W.S.; Costa, M.G.C. Rootstock-Induced Molecular Responses Associated with Drought Tolerance in Sweet Orange as Revealed by RNA-Seq. BMC Genom. 2019, 20, 110. [Google Scholar] [CrossRef] [PubMed]
- Liang, B.; Wan, S.; Ma, Q.; Yang, L.; Hu, W.; Kuang, L.; Xie, J.; Liu, D.; Liu, Y. Transcriptome and Physiological Analyses of a Navel Orange Mutant with Improved Drought Tolerance and Water Use Efficiency Caused by Increases of Cuticular Wax Accumulation and ROS Scavenging Capacity. Int. J. Mol. Sci. 2022, 23, 5660. [Google Scholar] [CrossRef] [PubMed]
- Gonçalves, L.P.; Alves, T.F.O.; Martins, C.P.S.; de Sousa, A.O.; dos Santos, I.C.; Pirovani, C.P.; Almeida, A.-A.F.; Filho, M.A.C.; Gesteira, A.S.; dos S Soares Filho, W.; et al. Rootstock-Induced Physiological and Biochemical Mechanisms of Drought Tolerance in Sweet Orange. Acta Physiol. Plant. 2016, 38, 174. [Google Scholar] [CrossRef]
- Le Gall, H.; Philippe, F.; Domon, J.-M.; Gillet, F.; Pelloux, J.; Rayon, C. Cell Wall Metabolism in Response to Abiotic Stress. Plants 2015, 4, 112–166. [Google Scholar] [CrossRef]
- Zhu, J.; Lee, B.-H.; Dellinger, M.; Cui, X.; Zhang, C.; Wu, S.; Nothnagel, E.A.; Zhu, J.-K. A Cellulose Synthase-like Protein Is Required for Osmotic Stress Tolerance in Arabidopsis. Plant J. Cell Mol. Biol. 2010, 63, 128–140. [Google Scholar] [CrossRef]
- Kuromori, T.; Seo, M.; Shinozaki, K. ABA Transport and Plant Water Stress Responses. Trends Plant Sci. 2018, 23, 513–522. [Google Scholar] [CrossRef] [PubMed]
- Hamilton, D.W.A.; Hills, A.; Köhler, B.; Blatt, M.R. Ca2+ Channels at the Plasma Membrane of Stomatal Guard Cells Are Activated by Hyperpolarization and Abscisic Acid. Proc. Natl. Acad. Sci. USA 2000, 97, 4967–4972. [Google Scholar] [CrossRef] [PubMed]
- Perochon, A.; Aldon, D.; Galaud, J.-P.; Ranty, B. Calmodulin and Calmodulin-like Proteins in Plant Calcium Signaling. Biochimie 2011, 93, 2048–2053. [Google Scholar] [CrossRef]
- Yin, P.; Fan, H.; Hao, Q.; Yuan, X.; Wu, D.; Pang, Y.; Yan, C.; Li, W.; Wang, J.; Yan, N. Structural Insights into the Mechanism of Abscisic Acid Signaling by PYL Proteins. Nat. Struct. Mol. Biol. 2009, 16, 1230–1236. [Google Scholar] [CrossRef]
- Schweighofer, A.; Hirt, H.; Meskiene, I. Plant PP2C Phosphatases: Emerging Functions in Stress Signaling. Trends Plant Sci. 2004, 9, 236–243. [Google Scholar] [CrossRef] [PubMed]
- McCarthy, R.L.; Zhong, R.; Ye, Z.-H. MYB83 Is a Direct Target of SND1 and Acts Redundantly with MYB46 in the Regulation of Secondary Cell Wall Biosynthesis in Arabidopsis. Plant Cell Physiol. 2009, 50, 1950–1964. [Google Scholar] [CrossRef]
- Zhong, R.; Ye, Z.-H. MYB46 and MYB83 Bind to the SMRE Sites and Directly Activate a Suite of Transcription Factors and Secondary Wall Biosynthetic Genes. Plant Cell Physiol. 2012, 53, 368–380. [Google Scholar] [CrossRef] [PubMed]
- Zhao, C.; Avci, U.; Grant, E.H.; Haigler, C.H.; Beers, E.P. XND1, a Member of the NAC Domain Family in Arabidopsis Thaliana, Negatively Regulates Lignocellulose Synthesis and Programmed Cell Death in Xylem. Plant J. 2008, 53, 425–436. [Google Scholar] [CrossRef]
- Hackbusch, J.; Richter, K.; Müller, J.; Salamini, F.; Uhrig, J.F. A Central Role of Arabidopsis Thaliana Ovate Family Proteins in Networking and Subcellular Localization of 3-Aa Loop Extension Homeodomain Proteins. Proc. Natl. Acad. Sci. USA 2005, 102, 4908–4912. [Google Scholar] [CrossRef]
- Wang, S.; Chang, Y.; Guo, J.; Zeng, Q.; Ellis, B.E.; Chen, J.-G. Arabidopsis Ovate Family Proteins, a Novel Transcriptional Repressor Family, Control Multiple Aspects of Plant Growth and Development. PLoS ONE 2011, 6, e23896. [Google Scholar] [CrossRef]
- Li, E.; Wang, S.; Liu, Y.; Chen, J.-G.; Douglas, C.J. OVATE FAMILY PROTEIN4 (OFP4) Interaction with KNAT7 Regulates Secondary Cell Wall Formation in Arabidopsis Thaliana. Plant J. 2011, 67, 328–341. [Google Scholar] [CrossRef] [PubMed]
- Kim, J.H.; Choi, D.; Kende, H. The AtGRF Family of Putative Transcription Factors Is Involved in Leaf and Cotyledon Growth in Arabidopsis. Plant J. 2003, 36, 94–104. [Google Scholar] [CrossRef] [PubMed]
- Olsson, A.; Engström, P.; Söderman, E. The Homeobox Genes ATHB12 and ATHB7encode Potential Regulators of Growth in Response to Water Deficit in Arabidopsis. Plant Mol. Biol. 2004, 55, 663–677. [Google Scholar] [CrossRef] [PubMed]
- Ohto, M.; Hayashi, S.; Sawa, S.; Hashimoto-Ohta, A.; Nakamura, K. Involvement of HLS1 in Sugar and Auxin Signaling in Arabidopsis Leaves. Plant Cell Physiol. 2006, 47, 1603–1611. [Google Scholar] [CrossRef] [PubMed]
- Dong, C.-J.; Liu, J.-Y. The Arabidopsis EAR-Motif-Containing Protein RAP2.1 Functions as an Active Transcriptional Repressor to Keep Stress Responses under Tight Control. BMC Plant Biol. 2010, 10, 47. [Google Scholar] [CrossRef] [PubMed]
- Ahlfors, R.; Lång, S.; Overmyer, K.; Jaspers, P.; Broscheé, M.; Tauriainen, A.; Kollist, H.; Tuominen, H.; Belles-Boix, E.; Piippo, M.; et al. Arabidopsis RADICAL-INDUCED CELL DEATH1 Belongs to the WWE Protein–Protein Interaction Domain Protein Family and Modulates Abscisic Acid, Ethylene, and Methyl Jasmonate Responses. Plant Cell 2004, 16, 1925–1937. [Google Scholar] [CrossRef] [PubMed]
- Sakuma, Y.; Liu, Q.; Dubouzet, J.G.; Abe, H.; Shinozaki, K.; Yamaguchi-Shinozaki, K. DNA-Binding Specificity of the ERF/AP2 Domain of Arabidopsis DREBs, Transcription Factors Involved in Dehydration- and Cold-Inducible Gene Expression. Biochem. Biophys. Res. Commun. 2002, 290, 998–1009. [Google Scholar] [CrossRef] [PubMed]
- Sakuma, Y.; Maruyama, K.; Osakabe, Y.; Qin, F.; Seki, M.; Shinozaki, K.; Yamaguchi-Shinozaki, K. Functional Analysis of an Arabidopsis Transcription Factor, DREB2A, Involved in Drought-Responsive Gene Expression. Plant Cell 2006, 18, 1292–1309. [Google Scholar] [CrossRef] [PubMed]
- Wei, G.; Pan, Y.; Lei, J.; Zhu, Y.-X. Molecular Cloning, Phylogenetic Analysis, Expressional Profiling and In Vitro Studies of TINY2 from Arabidopsis Thaliana. BMB Rep. 2005, 38, 440–446. [Google Scholar] [CrossRef]
- Liu, T.; Longhurst, A.D.; Talavera-Rauh, F.; Hokin, S.A.; Barton, M.K. The Arabidopsis Transcription Factor ABIG1 Relays ABA Signaled Growth Inhibition and Drought Induced Senescence. eLife 2016, 5, e13768. [Google Scholar] [CrossRef]
- Yang, A.; Dai, X.; Zhang, W.-H. A R2R3-Type MYB Gene, OsMYB2, Is Involved in Salt, Cold, and Dehydration Tolerance in Rice. J. Exp. Bot. 2012, 63, 2541–2556. [Google Scholar] [CrossRef] [PubMed]


Disclaimer/Publisher’s Note: The statements, opinions and data contained in all publications are solely those of the individual author(s) and contributor(s) and not of MDPI and/or the editor(s). MDPI and/or the editor(s) disclaim responsibility for any injury to people or property resulting from any ideas, methods, instructions or products referred to in the content. |
© 2024 by the authors. Licensee MDPI, Basel, Switzerland. This article is an open access article distributed under the terms and conditions of the Creative Commons Attribution (CC BY) license (https://creativecommons.org/licenses/by/4.0/).