Simple Summary
In environments characterized by small-scale islands, terrestrial inputs, like freshwater discharges, can significantly impact fish communities compared to ocean currents. While the influence of river discharge on marine biodiversity is well documented, the effects of submarine groundwater discharge on nearshore fish communities are less understood. Here, our results provide evidence that submarine groundwater discharge crucially influences coastal fish diversity by altering salinity and nutrient supply. This study also showed that fish community composition varies considerably over a small spatial scale, reflecting habitat partitioning on the target island.
Abstract
Submarine groundwater discharge (SGD) has recently been recognized as an influential factor in coastal ecosystems; however, little research has been conducted on its effects on coastal fish diversity. To investigate the relationship between SGD and fish diversity, we conducted a survey at the coastal island scale using the environmental DNA (eDNA) method. Our findings indicate that fish species richness and functional richness peak at stations with high SGD. Environmental variables, such as salinity, dissolved inorganic nitrogen (DIN) concentration, and SGD, significantly influence fish diversity. Carnivore fish richness was negatively correlated with salinity, while planktivore fish richness was positively correlated. Additionally, SGD and DIN concentrations were found to be crucial in shaping omnivorous and pelagic communities, respectively. This study highlights the role of SGD in enhancing nutrient conditions favorable for diverse fish communities and demonstrates the effectiveness of eDNA metabarcoding for rapid marine biodiversity assessment. These findings provide valuable insights for coastal ecosystem monitoring and management.
1. Introduction
Surface and subsurface water discharge to coastal areas is essential for supporting biodiversity by supplying the necessary nutrients for the growth and reproduction of marine organisms [1] and creating an optimal habitat environment, such as for temperature and salinity [2,3]. Several marine ecological studies have shown how river discharge (RD) affects the biological community structure and supports production in coastal areas [4]. However, few studies have focused on the impacts of submarine groundwater discharge (SGD) on coastal ecosystems [5]. Some studies have revealed that salinity changes caused by SGD influence the macro-benthic community composition [3,6]. Salinity has also been identified as a key variable for fish species distribution; for example, high salinity negatively affects the metabolism and feeding behavior of some fish species [7]. Moreover, SGD usually contains a higher concentration of nutrients than surface water, which can significantly affect phytoplankton growth and species changes in phytoplankton [4,5,6,7,8]. Fujita et al. [8] confirmed a positive relationship between SGD-derived nutrient loading and elevated benthic primary production, affecting the growth of juvenile marbled soles (Pseudopleuronectes yokohamae). Lilkendey et al. [9] demonstrated the physiological effects of fresh SGD on the augmented growth of juvenile gray demoiselle (Chrysiptera glauca) by providing optimal salinity and low pH conditions. These studies suggest that SGD is important for specific fish species by providing optimal habitats and nutrients to increase primary and secondary production. However, the effects of SGD on coastal fish diversity are poorly understood. A spatial evaluation of the relationship between SGD and fish communities would provide useful information to examine this.
Environmental DNA (eDNA) has emerged as a promising tool for investigating marine biodiversity via rapid and integrative biomonitoring [10]. eDNA is generated when organisms release genetic material into their environment and can be isolated, extracted, and sequenced using metabarcoding techniques [11,12,13,14]. This approach has shown superiority in species detection, particularly for cryptic and rare species, while being non-invasive and cost-effective [15,16,17], offering advantages over traditional surveys [10,18,19]. Recent advancements in eDNA technology and methodology have proven highly accurate in predicting the spatial distribution of species [20]. eDNA can be used to distinguish the taxonomic diversity of various habitats and quickly assess changes in biodiversity at the ecosystem level [17]. However, relying solely on individual taxonomic diversity is insufficient to reveal community variations [21]. Integrating taxonomic and functional diversity offers deeper insight into the intricate relationships between species and their environments [22,23,24]. Functional diversity, including feeding habits, swimming abilities, and habitat preferences, provides a comprehensive understanding of the responses of fish communities to various environmental conditions [2,25,26,27]. Hence, using a reliable integrated eDNA-functional biomonitoring method is valuable for fish biodiversity assessment and comprehensive impact evaluation of SGD.
Therefore, in this study, we examined the impact of SGD on the spatial patterns of fish diversity on a coastal island in western Japan where the spatial variability of SGD was confirmed [28]. To investigate the relationship between SGD and the taxonomic and functional diversity of fish, we used eDNA at an island scale.
2. Materials and Methods
2.1. Study Area Information
Ikuchijima Island (34°16′ N, 133°6′ E) is centrally located within the Seto Inland Sea (SIS) of western Japan. This island covers an area of 31.2 km2, with a perimeter of 33.6 km and a maximum elevation of 472 m. The topographic gradient is steeper in the western, southern, and eastern parts of the island than in the northern areas [28]. Annual average temperature and precipitation are 16 °C and 1100 mm [28,29]. The coastal zone surrounding the island is characterized by a high level of fish diversity of numerous species [29,30,31]. In November 2022, we surveyed 18 sampling stations (IKR1–18) in the seawater of the island. The numbering and distribution of each sampling station are shown in Figure 1c.
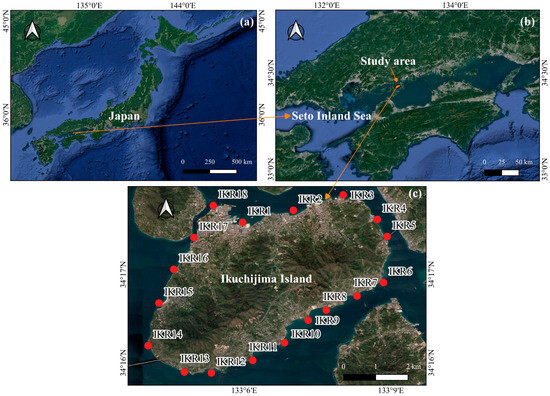
Figure 1.
Map showing the study area, with red dots indicating sampling stations. (a) Japan; (b) Seto Inland Sea and (c) Ikuchijima Island.
2.2. Sampling Collection
Seawater samples were collected from a boat by slowly circling around the target island. We used the geo-coordinates of each sampling station, directly measured at the study area with a GPS device for spatial variables. For collecting eDNA, two bottles of 1-L water sample per site (two liters) were collected from the surface using polypropylene bottles in duplicate for each station, immediately adding 1 mL of 10% benzalkonium chloride solution (Osvan 10%, Nihon Pharmaceutical Co., Ltd., Tokyo, Japan) to prevent eDNA degradation by bacteria, following the sampling manual of the eDNA society [32]. Blanks (negative controls) were set up at the study area by sterilized deionized water in the same manner to examine for contamination during the field survey. Field water samples and distilled water were kept on ice during sampling and transportation until filtration. Within 24 h after collection, each 1 L seawater sample was filtered through a Sterivex-HV filter with pore size 0.45 μm (Merck Millipore, Burlington, MA, USA) and was directly immersed in 1.5 mL of RNAlater (Thermo fisher Scientific, Waltham, MA, USA) to avoid degradation of DNA, then filtered samples were transported to the laboratory at −20 °C for further eDNA analysis.
In addition, a further 100 mL of seawater samples for each station were collected with three replicates and transported to the laboratory at 4 °C for nutrients analysis, including ammonium nitrogen (NH4-N, mg/L), nitrite (NO2-N, mg/L), nitrate (NO3-N, mg/L), phosphate (PO4-P, mg/L) and silicate (Si(OH)4-Si, mg/L). Nutrient analyses were performed using an auto-analyzer (swAAt, BLTEC). We define dissolved inorganic nitrogen (DIN) as the sum of ammonium nitrogen (NH4-N, mg/L), nitrite (NO2-N, mg/L), and nitrate (NO3-N, mg/L). Phosphate (PO4-P, mg/L) is reported as dissolved inorganic phosphorus (DIP), while silicate (Si(OH)4-Si, mg/L) is reported as dissolved silica (DSi). We also collected particulate organic matter (POM, an indicator of phytoplankton) of 0.7–125 µm from the surface seawater of each station [33]. Those samples were filtered on pre-combusted glass-fiber filters (Whatman GF/F type, 450 °C, 2 h) after sieving through a 125 µm mesh sieve [33]. While collecting seawater samples, a portable data logger (CTD-Diver, vanEssen Instruments, Delft, The Netherlands) was employed to record seawater temperatures and salinity at each station.
2.3. Environmental DNA Analysis, Taxonomic Verification
eDNA experiments, including extraction of eDNA and polymerase chain reaction (PCR) of technology, were conducted in a dedicated laboratory, PCR-free to avoid any contamination of eDNA samples. Total DNA was extracted by using a DNeasy Blood and Tissue Kit (Qiagen, Hilden, Germany) [34]. After purification, DNA was eluted with 100 μL elution buffer (buffer AE) and stored at −20 °C. The amplicon libraries of the spatial 12S rRNA region were constructed using the universal Mifish primer sets (MiFish-E-F/R-v2:MiFish-U-F/R:MiFish-U2-F/R = 1:2:1) [35]. KAPA HiFi HotStart ReadyMix (KAPA Biosystems, Wilmington, MA, USA) for amplification of eDNA, GeneRead Size Selection Kit (Qiagen, Hilden, Germany) and Agencourt AMPure XP (Beckman Coulter, Tokyo, Japan) for purification of first and second PCR products, respectively, were used according to the manufacturer’s protocol. In addition to the field/filtration blanks, PCR-negative controls were made using distilled water instead of eDNA during PCR. Purified PCR products were quantified using a Qubit 2.0 fluorometer and dsDNA HS Assay Kit (Thermo Fisher Scientific, Waltham, MA, USA), and TapeStation 4150 and DNA High Sensitivity D1000 (Agilent, Santa Clara, CA, USA). The obtained sequencing libraries were quantified using a Qubit 2.0 fluorometer and dsDNA HS Assay Kit (Thermo Fisher Scientific) and pooled in equal concentrations. Libraries were sequenced using an Illumina MiSeq system with 600-cycle chemistry (2 × 300 bp paired-end sequencing using the MiSeq Reagent Kit v3) (Illumina, San Diego, CA, USA).
Sequence pairs of all samples were performed following Miya et al. [35] and using the publicly available bioinformatics pipeline, Mifish Pipeline [36,37]. All sequencing data underwent the following processes: quality control, trimming, assembled cleaned, N-base and length filtering (229 ± 25 bp by default), primer removal, clustering and species-level assignment. The zero-radius operation taxonomic units table (ZOTUs) was obtained and queried against the Mitofish database (fish mitochondrial genome database) with threshold of identify 97% and e-value 10−5 [37,38]. After this step, a taxonomic database was made and classified based on information obtained from FishBase.
2.4. Functional Traits Verification
Functional traits of the identified fish species, such as feeding habits and depth levels, were compiled from existing literature databases and FishBase (Table 1).

Table 1.
Trait groups and modalities were used in the study, with the indication of the category definition and the explanation for trait selection.
2.5. Evaluation of Spatial Variability of SGD
Recently, DSi has become well known as a useful geochemical tracer for estimating SGD [41,42,43]. SGD typically contains high concentrations of DSi, making DSi a valuable addition to the conventional tracers, such as 222Rn or Ra [44,45]. Here, we applied DSi balance model to estimate the spatial variation in SGD on the island [42,46]. The entire island was divided into 18 boxes based on the locations of DSi sampling stations. The SGD for each box was then calculated by using the DSi balance equation, allowing us to assess the spatial distribution of SGD across the island. At steady state, sources of DSi in a system can be included, such as diffusion from bottom sediments, SGD, RD and mixing with offshore seawater. The mass balance equation for DSi can then be written as follows [41,42,46].
where is the DSi flux by RD (mmol/d), which was estimated from river flow rate () and DSi concentrations () of river water (; is the flux due to diffusion from bottom sediments (mmol/d), is the regeneration rate of DSi (mmol/m2d), is the bottom area of each sections (m2); is the flux of DSi from SGD (), is the DSi concentration of groundwater end-member (mmol/m3), is the seepage rate of groundwater (m/d); is the mixing with offshore seawater (), is the concentration of DSi in each section () subtracted for the offshore seawater concentration (), is the volume of each section (m3), is the rate at which seawater mixed with offshore seawater (d−1).
2.6. Data Analysis and Statistics
In this study, QGis software version 3.16.16 was used to visualize the spatial variation of SGD, alpha diversity, fish species composition and functional traits. The alpha diversity index, including species richness and functional richness, was calculated for characterizing fish diversity by R package vegan and mFD [47]. In a community, functional richness (FRic) indicates the number of ecological niches occupied by species. An increase in FRic indicates a more efficient use of ecological space, which reflects the stability of the community and resistance to invasion [48]. The fish reads were transformed to presence/absence data before undergoing statistical analysis. The Spearman correlation analysis performed using the linkET package (mantel test function) in R to determine the correlations between environmental variables [49], expresses statistical significance as a p-value less than 0.05. Environmental variables that were not normally distributed were transformed by using log transformations and were then standardized depending on the implementation of each analysis process [50]. To identify the major variables explaining the pattern in species richness, functional richness among the target area, we used the generalized linear models (GLMs) with a Poisson distribution and log-link function using the glm function [51]. Ggpairs function was used to determine the covariation among environmental variables, and the highly correlated variables (r > 0.5) were removed to minimize collinearity in the subsequent analyses. For each response variable, we first constructed a full model that comprised of all the environmental variables (i.e., SGD, RD, etc.). Then the dredge function in the MuMIn package was used for model selection [51]. The best models were selected using Akaike’s information criterion (AIC), and the best models have the lower value of AIC [51]. Distance-based redundancy analysis (dbRDA) was conducted to assess environmental factors affecting fish communities’ composition, with ordination biplot explaining the relationships between significant environmental variables and these patterns by R package vegan [52]. To reduce the presence of covariance among the environmental variables, variance inflation factors (VIF) were calculated to assess collinearity among predictors. VIF values were all <2, suggesting non-collinearities [50]. Then some variables with high correlation were removed and only the selected variables were input in the final model. Data underwent a three-step process: first, a community dissimilarity matrix is calculated using the Jaccard dissimilarity matrix, which derived from presence/absence species level data. Next, we performed dbRDA on dissimilarity matrix by using capscale function. Then, the permutation tests were separately performed on the axes of the model and the full model (number of permutations: 999). We analyzed the total fish species community and functional communities separately. All statistical analyses were carried out in R version 4.2.0.
3. Results
3.1. Spatial Variability of Fish Communities
A total of 2,827,847 sequences clustered into 326 ZOTUs were detected by eDNA metabarcoding, which belong to 19 orders, 34 families and 59 species (Table S1). Most of the sequence reads were assigned to Sparidae (37%), followed by Mugilidae (14%), Sillaginidae (9%), Engraulidae (8%), Gobiidae (6%), and Siganidae (5%). Among them, Sparidae, Mugilidae, Sillaginidae, and Gobiidae were found frequently in the sampling stations; especially, Sparidae and Mugilidae had 100% occurrence frequency and were detected across all stations (Figure 2a). By contrast, Haemulidae, Stichaeidae, Pristigasteridae, Scombridae, Sphyraenidae, Tripterygiidae, Hexagrammidae, Atherinidae, and Cynoglossidae were found only once between different sampling stations (Figure S1). Our data showed that 30 fish species (belonging to 12 orders, 23 families) were identified from commercial to highly commercial in terms of fishery (Table S1). The alpha diversity index of fish diversity was found to be different across the sampling stations, suggesting a complex and heterogeneous distribution of fish communities within the island ecosystem (Figure 2b,c). Fish species richness and functional richness were highest in IKR1, 2, 4, 10 and 18, and the lowest in IKR11 and 16.
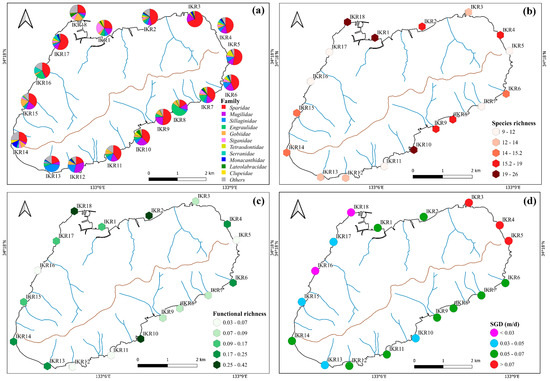
Figure 2.
Spatial variation in the percentages of (a) fish family, (b) species richness, (c) functional richness and (d) SGD (point color relate to the SGD level of each stations: red for SGD value > 0.07 m/d, green for SGD value range 0.05–0.07 m/d, blue for SGD value range 0.07–0.05 m/d, and purple for SGD value < 0.03).
Based on feeding diet preference, fish were categorized into four groups, the major traits were carnivores (32 species), followed by omnivores (15 species), planktivores (7 species), and herbivores (3 species). Two depth traits were observed based on the trophic distribution of fish, which comprised 42 demersal, and 17 pelagic species. The distribution patterns of a functional fish community were dominated by fish that belonged to carnivores (54%) and with benthic habits (71% of demersal fish) (Figure 3).
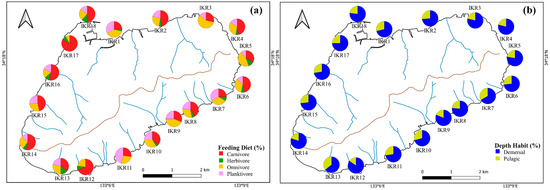
Figure 3.
Spatial variation in the percentages of (a) feeding diet and (b) depth habit.
3.2. Impacts of SGD on Fish Diversities
The temperatures recorded ranged from 19.8 °C to 21.7 °C, with a mean seawater temperature of 20.8 °C ± 0.5 SD (Standard Deviation). The average salinity was 33.5 psu ± 0.5 SD, ranging from 31.85 psu to 34.18 psu. Higher SGD occurred along the northeastern shoreline, and the lowest SGD was found along the northwestern shorelines (Figure 2d). The Spearman correlation analysis showed that SGD had a positive correlation with DSi and DIP concentrations and a negative correlation with water temperature and salinity, while RD had a positive correlation with POM (Figure 4). High positive correlations were observed among DSi and DIP, indicating that their sources were consistent and similar Figure 4).
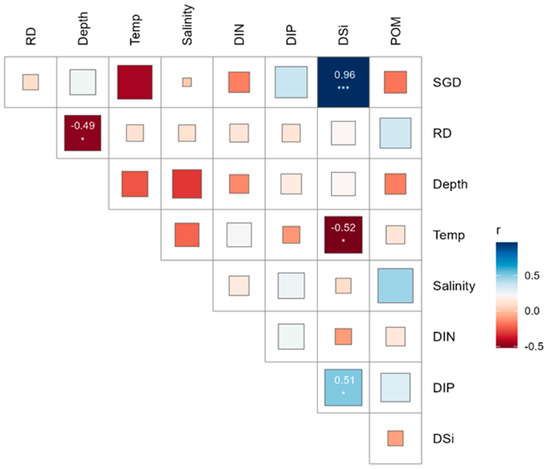
Figure 4.
Spearman’s correlation matrix illustrates the relationships between environmental variables in the target island. Statistical significance markers: *** p < 0.001, * p < 0.05.
The Alpha diversity index is an effective tool for characterizing the species diversity of Ikuchijima Island. In this study, higher species richness and functional richness were observed at stations with higher SGD, such as IKR2, 4, 6, and 14, indicating that SGD affects the composition of fish diversity within a small spatial island scale (Figure 2b,c).
Analysis of the effects of environmental variables on the pattern of fish diversity and communities showed that different species and functional traits of fish respond differently to environmental variables. The results of the best models in the GLMs are shown in Table 2. Carnivore richness had significantly negative relationships with salinity (p < 0.05), while planktivore richness and salinity had a positive relationship. RD and omnivore richness had a significant positive relationship (p < 0.05). These results suggest that the spatial patterns of fish diversity were influenced by different environmental variables.
Table 2.
Summary of results of the best models of GLMs used to assess the relationship between the alpha diversity index and environmental variables.
From the results of dbRDA, SGD and DIN concentration were key factors affecting the spatial composition of omnivore community (full model, F = 1.42, p < 0.05) (Figure 5a). SGD showed a strong significant effect on omnivore community composition (SGD, F = 1.46, p < 0.05). Takifugu pardalis and Takifugu niphobles were found to be highly occurring at high SGD sites. DIN concentration also had a strong significant effect on omnivore community (DIN, F = 1.38, p < 0.05). Lateolabrax japonicus and Stephanolepis cirrhifer were highly detected in high DIN sites. For pelagic community composition, RD and SGD were key variables affecting the community composition (full model, F = 1.34, p < 0.05) (Figure 5b). RD had a strong significant effect on pelagic community composition (RD, F = 1.56, p < 0.05). Konosirus punctatus and Hyporhamphus sajori were commonly observed in high RD sites.
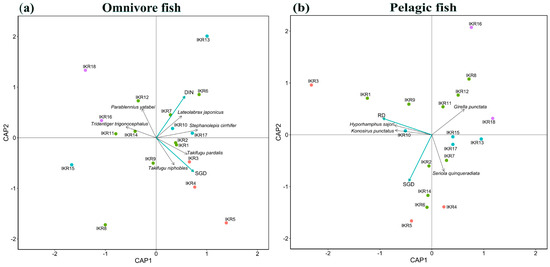
Figure 5.
dbRDA results show model residual variables in (a) omnivore and (b) pelagic fish communities. Point colors relate to the SGD level of each station: red for SGD value > 0.07 m/d, green for SGD value range 0.05–0.07 m/d, blue for SGD value range 0.07–0.05 m/d, and purple for SGD value < 0.03. Blue arrows and black arrows represent environmental variables and fish species, respectively.
4. Discussion
To our knowledge, this is the first study to address questions of spatial patterns of coastal fish communities along with variability of SGD and other environmental factors, using a combination of taxonomic and functional approaches at the coastal-island scale. In this study, we found that the functional group composition of coastal fish is greatly influenced by several variables, such as SGD, RD, salinity, and DIN concentration. Especially, the difference in salinity associated with SGD may affect the spatial distribution of fish through their choice of habitat. The positive correlation between SGD, DSi, and DIP concentrations also provides evidence of the SGD-derived nutrient supply to coastal seawater. Thus, SGD can provide physico-chemical beneficial environmental conditions for the growth and survival of fish communities. For example, the recorded conditions at station IKR2 are characterized by high SGD and RD, coupled with low salinity, as well as elevated levels of nutrients and POM.
Generally, the freshwater SGD can reduce salinity and may act as a buffer against elevated seawater salinity [6,9]. Different fish species prefer different ranges of salinity for growth, survival, feeding, breeding, nursing, etc., throughout their life cycle. We suggest that. at a small spatial scale, varying salinities influenced the spatial distribution of fish diversity within the target study. Additionally, Hata et al. [53] confirmed a high abundance of small crustaceans near the sites with high SGD, which is an important food resource for secondary consumers. Similarly, the high occurrence of omnivore-demersal species, such as panther puffer (Takifugu pardalis) and grass puffer (Takifugu niphobles), at the high SGD sites in this study suggested a similar causality in a previous study in northern Japan [54]. On the other hand, Kim et al. [55] reveal that RD had an impact on the contribution of the phytoplankton community, which may have influenced higher-trophic consumers, such as planktivore pelagic fish (Konosirus punctatus) and omnivore pelagic fish (Hyporhamphus sajori) in this study. Besides, the DIN/DIP and DIN/DSi ratios in the seawater of the target area are lower than the Redfield ratio, indicating that primary production is a nitrogen-limited condition [29]. Over recent decades, nutrient concentrations in the SIS have significantly shifted due to comprehensive efforts to reduce anthropogenic nutrient inputs, guided by the Total Pollutant Load Control System initiated in 1979 [56,57,58]. As a result, the SIS is currently characterized by oligotrophic conditions [59,60,61]. Several studies have identified nutrient scarcity resulting from oligotrophication as a critical factor in the declining fishery yields in the SIS [30,58,60]. Tanda and Harada [62] have revealed that reductions in nutrient levels are correlated with the fluctuation in the production of small pelagic and demersal fish species.
Besides, this study highlighted the advantages of the eDNA method, which provides a more comprehensive detection of fish species across an entire island than traditional methods, which have limitations in covering large areas [63,64,65]. According to Nhat et al. [29], eDNA technology can achieve similar or better results in assessing fish diversity than traditional monitoring methods. In this study, we demonstrated the feasibility of rapid marine biodiversity sampling using eDNA combined with functional traits to characterize the composition of coastal island ecosystems. Furthermore, eDNA can be used to capture the spatial distribution of fish communities within a coastal area. Several studies have shown that eDNA signals are localized in marine environments, leading to spatial patterns of fish diversity [20,21]. Here, we observed spatial variations in taxonomic and functional patterns of fish communities based on the localized signals of eDNA in the target area. Therefore, these results suggest that eDNA can provide a solution for rapid application in coastal monitoring of the spatial variability of fish diversity.
However, our study still had a few limitations. While eDNA is a valuable tool for obtaining species information, its current application is constrained in providing insights into the developmental stages of the detected organisms. Moreover, although multiple physico-chemical parameters were analyzed to understand the drivers of fish community composition, this investigation did not encompass the impact of associated communities, such as invertebrates and phytoplankton, which were not monitored during the study period. Future studies should consider developing a hybrid monitoring approach that integrates frequent eDNA surveys with traditional methods, such as fishing, Underwater Visual Census (UVC), and Baited Remote Underwater Video (BRUV). For example, combining eDNA metabarcoding with visual census methods and food web structure analysis (e.g., model analysis, stable isotope analysis) could offer a comprehensive overview of local fish composition and facilitate the exploration of relationships between fish assemblages and benthic communities. This integrated approach would enable more consistent and holistic monitoring of aquatic ecosystems. Incorporating historical survey data can enhance the precision of eDNA assays and provide a robust framework for interpreting the results. By addressing these limitations and adopting a more integrated monitoring approach, future research can achieve a more detailed and accurate understanding of the diversity and structure of fish communities, thereby improving the effectiveness of conservation and management strategies for coastal ecosystems.
5. Conclusions
In conclusion, this study demonstrated that the spatial patterns of diversity and composition of fish communities were related to the patterns of environmental variables. SGD is well recognized as one of the important factors that shape fish functional communities. This study also confirmed the usefulness of the eDNA method for assessing fish distribution and diversity in coastal ecosystems. By integrating taxonomic and functional diversity, eDNA monitoring provides complementary perspectives on community functions, thereby enhancing the overall assessment of community composition. To achieve a more detailed understanding of fish community diversity and structure, future research should incorporate eDNA methods alongside traditional monitoring techniques and consider a broader range of ecological variables. This integrated approach will offer a more comprehensive understanding of the factors shaping fish communities and improve the effectiveness of coastal ecosystem monitoring.
Supplementary Materials
The following supporting information can be downloaded at: https://www.mdpi.com/article/10.3390/biology13080609/s1, Figure S1: Heatmap of relative abundance (%) of fish family by eDNA metabarcoding at each station. The heatmap colors represent the relative abundances of fish species. Sorting is in proportion to relative abundance, with a decreasing trend from top to bottom; Table S1: Fish information in the target island.
Author Contributions
Conceptualization, M.S. and S.-i.O.; Methodology, M.S., S.-i.O., M.H. and N.H.N.; Validation, S.-i.O.; Formal analysis, N.H.N.; Investigation, M.S., S.-i.O., M.H., F.H. and N.H.N.; Data curation, N.H.N., M.H., M.S., F.H. and H.N.; Writing—original draft preparation, N.H.N.; Writing—review and editing, N.H.N., M.S., M.H., F.H. and H.N.; Visualization, N.H.N.; Supervision, M.S. and S.-i.O.; Project Administration, M.S. All authors have read and agreed to the published version of the manuscript.
Funding
This research was supported by JSPS Grant-in-Aid for Scientific Research (B) (No. 21H03650, PI: Mitsuyo Saito), Fostering Joint International Research (A) (No. 20KK0262, PI: Mitsuyo Saito) and The Asia-Pacific Network for Global Change Research (APN) (No. CRRP2019-09MY-Onodera, PI: Shin-ichi Onodera).
Institutional Review Board Statement
Not applicable.
Informed Consent Statement
Not applicable.
Data Availability Statement
The raw data supporting the conclusions of this article will be made available by the corresponding author on request.
Acknowledgments
We would like to express our gratitude to Tatsuya Sakamoto for support in using the laboratory of Ushimado Marine Institute for eDNA analysis. We would like to thank our laboratory members at Hiroshima University and Okayama University for their support in field campaigns and laboratory analyses.
Conflicts of Interest
The authors declare that they have no known competing financial interests or personal relationships that could have appeared to influence the work reported in this paper. The funders had no role in the design of the study; in the collection, analyses, or interpretation of data; in the writing of the manuscript; or in the decision to publish the results.
References
- Fabricius, K.E. Effects of Terrestrial Runoff on the Ecology of Corals and Coral Reefs: Review and Synthesis. Mar. Pollut. Bull. 2005, 50, 125–146. [Google Scholar] [CrossRef]
- Kuang, T.; Chen, W.; Huang, S.; Liu, L.; Zhou, L. Environmental Drivers of the Functional Structure of Fish Communities in the Pearl River Estuary. Estuar. Coast. Shelf Sci. 2021, 263, 107625. [Google Scholar] [CrossRef]
- Encarnação, J.; Leitão, F.; Range, P.; Piló, D.; Chícharo, M.A.; Chícharo, L. Local and Temporal Variations in Near-Shore Macrobenthic Communities Associated with Submarine Groundwater Discharges. Mar. Ecol. 2015, 36, 926–941. [Google Scholar] [CrossRef]
- Vinagre, C.; Máguas, C.; Cabral, H.N.; Costa, M.J. Spatial Variation in River Runoff into a Coastal Area—An Ecological Approach. J. Sea Res. 2011, 65, 362–367. [Google Scholar] [CrossRef]
- Moosdorf, N.; Oehler, T. Societal Use of Fresh Submarine Groundwater Discharge: An Overlooked Water Resource. Earth Sci. Rev. 2017, 171, 338–348. [Google Scholar] [CrossRef]
- La Valle, F.F.; Kantar, M.B.; Nelson, C.E. Coral Reef Benthic Community Structure Is Associated with the Spatiotemporal Dynamics of Submarine Groundwater Discharge Chemistry. Limnol. Oceanogr. 2021, 66, 188–200. [Google Scholar] [CrossRef]
- Getz, E.; Eckert, C. Effects of Salinity on Species Richness and Community Composition in a Hypersaline Estuary. Estuaries Coasts 2023, 46, 2175–2189. [Google Scholar] [CrossRef]
- Fujita, K.; Shoji, J.; Sugimoto, R.; Nakajima, T.; Honda, H.; Takeuchi, M.; Tominaga, O.; Taniguchi, M. Increase in Fish Production through Bottom-Up Trophic Linkage in Coastal Waters Induced by Nutrients Supplied via Submarine Groundwater. Front. Environ. Sci. 2019, 7, 82. [Google Scholar] [CrossRef]
- Lilkendey, J.; Pisternick, T.; Neumann, S.I.; Dumur Neelayya, D.; Bröhl, S.; Neehaul, Y.; Moosdorf, N. Fresh Submarine Groundwater Discharge Augments Growth in a Reef Fish. Front. Mar. Sci. 2019, 6, 613. [Google Scholar] [CrossRef]
- Ruppert, K.M.; Kline, R.J.; Rahman, M.S. Past, Present, and Future Perspectives of Environmental DNA (EDNA) Metabarcoding: A Systematic Review in Methods, Monitoring, and Applications of Global EDNA. Glob. Ecol. Conserv. 2019, 17, e00547. [Google Scholar] [CrossRef]
- Nguyen, B.N.; Shen, E.W.; Seemann, J.; Correa, A.M.S.; O’Donnell, J.L.; Altieri, A.H.; Knowlton, N.; Crandall, K.A.; Egan, S.P.; McMillan, W.O.; et al. Environmental DNA Survey Captures Patterns of Fish and Invertebrate Diversity across a Tropical Seascape. Sci. Rep. 2020, 10, 6729. [Google Scholar] [CrossRef] [PubMed]
- Kume, M.; Lavergne, E.; Ahn, H.; Terashima, Y.; Kadowaki, K.; Ye, F.; Kameyama, S.; Kai, Y.; Henmi, Y.; Yamashita, Y.; et al. Factors Structuring Estuarine and Coastal Fish Communities across Japan Using Environmental DNA Metabarcoding. Ecol. Indic. 2021, 121, 107216. [Google Scholar] [CrossRef]
- Bleijswijk, J.D.L.; Engelmann, J.C.; Klunder, L.; Witte, H.J.; Witte, J.I.; Veer, H.W. Analysis of a Coastal North Sea Fish Community: Comparison of Aquatic Environmental DNA Concentrations to Fish Catches. Environ. DNA 2020, 2, 429–445. [Google Scholar] [CrossRef]
- McElroy, M.E.; Dressler, T.L.; Titcomb, G.C.; Wilson, E.A.; Deiner, K.; Dudley, T.L.; Eliason, E.J.; Evans, N.T.; Gaines, S.D.; Lafferty, K.D.; et al. Calibrating Environmental DNA Metabarcoding to Conventional Surveys for Measuring Fish Species Richness. Front. Ecol. Evol. 2020, 8, 276. [Google Scholar] [CrossRef]
- Lee, Y.D.; Lee, G.M.; Park, J.Y.; Gwak, W.S. Comparing Environmental DNA Metabarcoding and Underwater Visual Census to Monitor Korean Coastal Fish Community. Ocean. Sci. J. 2022, 57, 592–606. [Google Scholar] [CrossRef]
- Gösser, F.; Schweinsberg, M.; Mittelbach, P.; Schoenig, E.; Tollrian, R. An Environmental DNA Metabarcoding Approach versus a Visual Survey for Reefs of Koh Pha-ngan in Thailand. Environ. DNA 2023, 5, 297–311. [Google Scholar] [CrossRef]
- Saccò, M.; Guzik, M.T.; van der Heyde, M.; Nevill, P.; Cooper, S.J.B.; Austin, A.D.; Coates, P.J.; Allentoft, M.E.; White, N.E. eDNA in Subterranean Ecosystems: Applications, Technical Aspects, and Future Prospects. Sci. Total Environ. 2022, 820, 153223. [Google Scholar] [CrossRef] [PubMed]
- Xing, Y.; Gao, W.; Shen, Z.; Zhang, Y.; Bai, J.; Cai, X.; Ouyang, J.; Zhao, Y. A Review of Environmental DNA Field and Laboratory Protocols Applied in Fish Ecology and Environmental Health. Front. Environ. Sci. 2022, 10, 725360. [Google Scholar] [CrossRef]
- Blabolil, P.; Harper, L.R.; Říčanová, Š.; Sellers, G.; Di Muri, C.; Jůza, T.; Vašek, M.; Sajdlová, Z.; Rychtecký, P.; Znachor, P.; et al. Environmental DNA Metabarcoding Uncovers Environmental Correlates of Fish Communities in Spatially Heterogeneous Freshwater Habitats. Ecol. Indic. 2021, 126, 107698. [Google Scholar] [CrossRef]
- Zhong, W.; Zhang, J.; Wang, Z.; Lin, J.; Huang, X.; Liu, W.; Li, H.; Pellissier, L.; Zhang, X. Holistic Impact Evaluation of Human Activities on the Coastal Fish Biodiversity in the Chinese Coastal Environment. Environ. Sci. Technol. 2022, 56, 6574–6583. [Google Scholar] [CrossRef]
- Czeglédi, I.; Sály, P.; Specziár, A.; Preiszner, B.; Szalóky, Z.; Maroda, Á.; Pont, D.; Meulenbroek, P.; Valentini, A.; Erős, T. Congruency between Two Traditional and EDNA-Based Sampling Methods in Characterising Taxonomic and Trait-Based Structure of Fish Communities and Community-Environment Relationships in Lentic Environment. Ecol. Indic. 2021, 129, 107952. [Google Scholar] [CrossRef]
- Camara, E.M.; de Andrade-Tubino, M.F.; Franco, T.P.; Neves, L.M.; dos Santos, L.N.; dos Santos, A.F.G.N.; Araújo, F.G. Temporal Dimensions of Taxonomic and Functional Fish Beta Diversity: Scaling Environmental Drivers in Tropical Transitional Ecosystems. Hydrobiologia 2023, 850, 1911–1940. [Google Scholar] [CrossRef]
- Li, Y.; Wang, J.; Ju, P.; Zhang, C.; Liu, B.; Wang, Y. Different Responses of Taxonomic and Functional Diversity to Environmental Changes: Case Study of Fish Communities in the Zhoushan Fishing Ground, China. Aquat. Sci. 2023, 85, 117. [Google Scholar] [CrossRef]
- Shah Esmaeili, Y.; Corte, G.N.; Checon, H.H.; Bilatto, C.G.; Lefcheck, J.S.; Zacagnini Amaral, A.C.; Turra, A. Revealing the Drivers of Taxonomic and Functional Diversity of Nearshore Fish Assemblages: Implications for Conservation Priorities. Divers. Distrib. 2022, 28, 1597–1609. [Google Scholar] [CrossRef]
- Aglieri, G.; Baillie, C.; Mariani, S.; Cattano, C.; Calò, A.; Turco, G.; Spatafora, D.; Di Franco, A.; Di Lorenzo, M.; Guidetti, P.; et al. Environmental DNA Effectively Captures Functional Diversity of Coastal Fish Communities. Mol. Ecol. 2021, 30, 3127–3139. [Google Scholar] [CrossRef] [PubMed]
- Henriques, S.; Guilhaumon, F.; Villéger, S.; Amoroso, S.; França, S.; Pasquaud, S.; Cabral, H.N.; Vasconcelos, R.P. Biogeographical Region and Environmental Conditions Drive Functional Traits of Estuarine Fish Assemblages Worldwide. Fish Fish. 2017, 18, 752–771. [Google Scholar] [CrossRef]
- Keck, B.P.; Marion, Z.H.; Martin, D.J.; Kaufman, J.C.; Harden, C.P.; Schwartz, J.S.; Strange, R.J. Fish Functional Traits Correlated with Environmental Variables in a Temperate Biodiversity Hotspot. PLoS ONE 2014, 9, e93237. [Google Scholar] [CrossRef] [PubMed]
- Zhu, A.; Saito, M.; Onodera, S.; Shimizu, Y.; Jin, G.; Ohta, T.; Chen, J. Evaluation of the Spatial Distribution of Submarine Groundwater Discharge in a Small Island Scale Using the 222Rn Tracer Method and Comparative Modeling. Mar. Chem. 2019, 209, 25–35. [Google Scholar] [CrossRef]
- Nhat, N.H.; Saito, M.; Hamada, M.; Onodera, S. Evaluation of the Effects of Environmental Factors on Seasonal Variations in Fish Diversity on a Coastal Island in Western Japan. Environments 2024, 11, 60. [Google Scholar] [CrossRef]
- Yoneda, M.; Fujita, T.; Yamamoto, M.; Tadokoro, K.; Okazaki, Y.; Nakamura, M.; Takahashi, M.; Kono, N.; Matsubara, T.; Abo, K.; et al. Bottom-up Processes Drive Reproductive Success of Japanese Anchovy in an Oligotrophic Sea: A Case Study in the Central Seto Inland Sea, Japan. Prog. Oceanogr. 2022, 206, 102860. [Google Scholar] [CrossRef]
- Fujita, T.; Yamamoto, M.; Kono, N.; Tomiyama, T.; Sugimatsu, K.; Yoneda, M. Temporal Variations in Hatch Date and Early Survival of Japanese Anchovy (Engraulis japonicus) in Response to Environmental Factors in the Central Seto Inland Sea, Japan. Fish. Oceanogr. 2021, 30, 527–541. [Google Scholar] [CrossRef]
- The eDNA Society Environmental DNA Sampling and Experiment Manual; The eDNA Society: Otsu, Japan, 2019.
- Takai, N.; Yorozu, A.; Tanimoto, T.; Hoshika, A.; Yoshihara, K. Transport Pathways of Microphytobenthos-Originating Organic Carbon in the Food Web of an Exposed Hard Bottom Shore in the Seto Inland Sea, Japan. Mar. Ecol. Prog. Ser. 2004, 284, 97–108. [Google Scholar] [CrossRef][Green Version]
- Minamoto, T.; Miya, M.; Sado, T.; Seino, S.; Doi, H.; Kondoh, M.; Nakamura, K.; Takahara, T.; Yamamoto, S.; Yamanaka, H.; et al. An Illustrated Manual for Environmental DNA Research: Water Sampling Guidelines and Experimental Protocols. Environ. DNA 2021, 3, 8–13. [Google Scholar] [CrossRef]
- Miya, M.; Sato, Y.; Fukunaga, T.; Sado, T.; Poulsen, J.Y.; Sato, K.; Minamoto, T.; Yamamoto, S.; Yamanaka, H.; Araki, H.; et al. MiFish, a Set of Universal PCR Primers for Metabarcoding Environmental DNA from Fishes: Detection of More than 230 Subtropical Marine Species. R. Soc. Open Sci. 2015, 2, 150088. [Google Scholar] [CrossRef] [PubMed]
- Zhu, T.; Sato, Y.; Sado, T.; Miya, M.; Iwasaki, W. MitoFish, MitoAnnotator, and MiFish Pipeline: Updates in 10 Years. Mol. Biol. Evol. 2023, 40, msad035. [Google Scholar] [CrossRef] [PubMed]
- Sato, Y.; Miya, M.; Fukunaga, T.; Sado, T.; Iwasaki, W. MitoFish and MiFish Pipeline: A Mitochondrial Genome Database of Fish with an Analysis Pipeline for Environmental DNA Metabarcoding. Mol. Biol. Evol. 2018, 35, 1553–1555. [Google Scholar] [CrossRef] [PubMed]
- Iwasaki, W.; Fukunaga, T.; Isagozawa, R.; Yamada, K.; Maeda, Y.; Satoh, T.P.; Sado, T.; Mabuchi, K.; Takeshima, H.; Miya, M.; et al. Mitofish and Mitoannotator: A Mitochondrial Genome Database of Fish with an Accurate and Automatic Annotation Pipeline. Mol. Biol. Evol. 2013, 30, 2531–2540. [Google Scholar] [CrossRef] [PubMed]
- Elliott, M.; Whitfield, A.K.; Potter, I.C.; Blaber, S.J.M.; Cyrus, D.P.; Nordlie, F.G.; Harrison, T.D. The Guild Approach to Categorizing Estuarine Fish Assemblages: A Global Review. Fish Fish. 2007, 8, 241–268. [Google Scholar] [CrossRef]
- Able, K.W.; Simenstad, C.A.; Strydom, N.A.; Bradley, M.; Sheaves, M. Habitat Use and Connectivity. In Fish and Fisheries in Estuaries; Wiley: Hoboken, NJ, USA, 2022; pp. 188–254. [Google Scholar]
- Hwang, D.W.; Lee, I.S.; Choi, M.; Kim, T.H. Estimating the Input of Submarine Groundwater Discharge (SGD) and SGD-Derived Nutrients in Geoje Bay, Korea Using222Rn-Si Mass Balance Model. Mar. Pollut. Bull. 2016, 110, 119–126. [Google Scholar] [CrossRef] [PubMed]
- Hwang, D.W.; Lee, Y.W.; Kim, G. Large Submarine Groundwater Discharge and Benthic Eutrophication in Bangdu Bay on Volcanic Jeju Island, Korea. Limnol. Oceanogr. 2005, 50, 1393–1403. [Google Scholar] [CrossRef]
- Street, J.H.; Knee, K.L.; Grossman, E.E.; Paytan, A. Submarine Groundwater Discharge and Nutrient Addition to the Coastal Zone and Coral Reefs of Leeward Hawai’i. Mar. Chem. 2008, 109, 355–376. [Google Scholar] [CrossRef]
- Tamborski, J.J.; Cochran, J.K.; Bokuniewicz, H.J. Submarine Groundwater Discharge Driven Nitrogen Fluxes to Long Island Sound, NY: Terrestrial vs. Marine Sources. Geochim. Cosmochim. Acta 2017, 218, 40–57. [Google Scholar] [CrossRef]
- Oehler, T.; Tamborski, J.; Rahman, S.; Moosdorf, N.; Ahrens, J.; Mori, C.; Neuholz, R.; Schnetger, B.; Beck, M. DSi as a Tracer for Submarine Groundwater Discharge. Front. Mar. Sci. 2019, 6, 563. [Google Scholar] [CrossRef]
- Hwang, D.W.; Kim, G.; Lee, Y.W.; Yang, H.S. Estimating Submarine Inputs of Groundwater and Nutrients to a Coastal Bay Using Radium Isotopes. Mar. Chem. 2005, 96, 61–71. [Google Scholar] [CrossRef]
- Magneville, C.; Loiseau, N.; Albouy, C.; Casajus, N.; Claverie, T.; Escalas, A.; Leprieur, F.; Maire, E.; Mouillot, D.; Villéger, S. MFD: An R Package to Compute and Illustrate the Multiple Facets of Functional Diversity. Ecography 2022, 2022. [Google Scholar] [CrossRef]
- Villéger, S.; Mason, N.W.H.; Mouillot, D. New Multidimensional Functional Diversity Indices for a Multifaceted Framework in Functional Ecology. Ecology 2008, 89, 2290–2301. [Google Scholar] [CrossRef] [PubMed]
- Huang, H. LinkET: Everything Is Linkable. R Package Version 0.0.3, Shenzhen, China, 2021; Volume 2. [Google Scholar]
- Zuur, A.F.; Ieno, E.N.; Elphick, C.S. A Protocol for Data Exploration to Avoid Common Statistical Problems. Methods Ecol. Evol. 2010, 1, 3–14. [Google Scholar] [CrossRef]
- Bartoń, K. MuMIn: Multi-Model Inference. In R Package Version 0.12.2; PAS: Opalenica, Poland, 2023. [Google Scholar]
- Oksanen, J.; Simpson, G.L.; Blanchet, F.G.; Kindt, R.; Legendre, P.; McGlinn, D.; Minchin, P.R.; O’Hara, R.B.; Solymos, P. Package “Vegan”: Community Ecology Package. R Package Version 2.6-7, Helsinki, Finland, 2024. [Google Scholar]
- Hata, M.; Sugimoto, R.; Hori, M.; Tomiyama, T.; Shoji, J. Occurrence, Distribution and Prey Items of Juvenile Marbled Sole Pseudopleuronectes yokohamae around a Submarine Groundwater Seepage on a Tidal Flat in Southwestern Japan. J. Sea Res. 2016, 111, 47–53. [Google Scholar] [CrossRef]
- Utsunomiya, T.; Hata, M.; Sugimoto, R.; Honda, H.; Kobayashi, S.; Miyata, Y.; Yamada, M.; Tominaga, O.; Shoji, J.; Taniguchi, M. Higher Species Richness and Abundance of Fish and Benthic Invertebrates around Submarine Groundwater Discharge in Obama Bay, Japan. J. Hydrol. Reg. Stud. 2017, 11, 139–146. [Google Scholar] [CrossRef]
- Kim, Y.; Lee, J.H.; Kang, J.J.; Lee, J.H.; Lee, H.W.; Kang, C.K.; Lee, S.H. River Discharge Effects on the Contribution of Small-Sized Phytoplankton to the Total Biochemical Composition of POM in the Gwangyang Bay, Korea. Estuar. Coast. Shelf Sci. 2019, 226, 106293. [Google Scholar] [CrossRef]
- International EMECS Center. Environmental Conservation of the Seto Inland Sea; International EMECS Center, Ed.; Kobe International EMECS Center: Kobe, Japan, 2008. [Google Scholar]
- Okaichi, T. Environmental Management of the Semi Enclosed Sea and Red Tide Problems in the Seto Inland Sea. Fish. Sci. 2002, 68, 483–488. [Google Scholar] [CrossRef] [PubMed][Green Version]
- Nishijima, W.; Umehara, A.; Yamamoto, K.; Asaoka, S.; Fujii, N.; Otani, S.; Wang, F.; Okuda, T.; Nakai, S. Temporal Distribution of Primary and Secondary Production Estimated from Water Quality Data in the Seto Inland Sea, Japan. Ecol. Indic. 2021, 124, 107405. [Google Scholar] [CrossRef]
- Abo, K.; Yamamoto, T. Oligotrophication and Its Measures in the Seto Inland Sea, Japan. Bull. Jpn. Fish. Res. Educ. Agency 2019, 49, 21. [Google Scholar]
- Yamamoto, T. The Seto Inland Sea—Eutrophic or Oligotrophic? In Marine Pollution Bulletin; Elsevier Ltd.: Amsterdam, The Netherlands, 2003; Volume 47, pp. 37–42. [Google Scholar]
- Yanagi, T. Oligotrophication in the Seto Inland Sea. In Eutrophication and Oligotrophication in Japanese Estuaries; Yanagi, T., Ed.; Springer: Dordrecht, Germany, 2015; pp. 39–67. [Google Scholar]
- Tanda, M.; Harada, K. Nutrient Environment and Fisheries in the Eastern Seto Inland Sea (Harima Nada). Aquabiology 2012, 34, 132–141. [Google Scholar]
- Luo, Z.; Yang, C.; Wang, L.; Liu, Y.; Shan, B.; Liu, M.; Chen, C.; Guo, T.; Sun, D. Relationships between Fish Community Structure and Environmental Factors in the Nearshore Waters of Hainan Island, South China. Diversity 2023, 15, 901. [Google Scholar] [CrossRef]
- Cheng, X.; Wang, Z.; Zhang, S.; Zhao, X.; Lin, J.; Huang, H.; Chen, Y.; Zou, Q. Analysis of Short-Term and Local Scale Variations in Fish Community Structure in Dachen Island Waters. Front. Mar. Sci. 2023, 10, 1199524. [Google Scholar] [CrossRef]
- Snigirov, S.; Goncharov, O.; Sylantyev, S. The Fish Community in Zmiinyi Island Waters: Structure and Determinants. Mar. Biodivers. 2012, 42, 225–239. [Google Scholar] [CrossRef]


Disclaimer/Publisher’s Note: The statements, opinions and data contained in all publications are solely those of the individual author(s) and contributor(s) and not of MDPI and/or the editor(s). MDPI and/or the editor(s) disclaim responsibility for any injury to people or property resulting from any ideas, methods, instructions or products referred to in the content. |
© 2024 by the authors. Licensee MDPI, Basel, Switzerland. This article is an open access article distributed under the terms and conditions of the Creative Commons Attribution (CC BY) license (https://creativecommons.org/licenses/by/4.0/).