Article

Neem Oil (Azadirachta indica L.) Response Surface Methodology (RSM)-Optimized Nanoemulsions for Sensory Quality Preservation of Oreochromis niloticus Fillets

1
Department of Zoology, The Islamia University of Bahawalpur, Bahawalpur 63100, Pakistan
2
Department of Food Sciences, Cholistan University of Veterinary and Animal Sciences, Bahawalpur 63100, Pakistan
3
School of Food and Biological Engineering, Jiangsu University, Zhenjiang 212013, China
4
Department of Industrial Engineering, University of Applied Sciences Technikum Wien, Hoechstaedtplatz 6, 1200 Vienna, Austria
*
Authors to whom correspondence should be addressed.
Biology 2025, 14(4), 400; https://doi.org/10.3390/biology14040400
Submission received: 12 January 2025 / Revised: 7 February 2025 / Accepted: 21 March 2025 / Published: 10 April 2025
(This article belongs to the Special Issue Microbial Contamination and Food Safety (Volume II))

Simple Summary

Synthetic preservatives in food products have raised toxicity concerns; hence, they should be replaced with safer alternatives. Neem oil nanoemulsions (NO NEs) have shown promise as natural antibacterial agents. Here, NO NEs effectively inhibited Staphylococcus aureus via DNA and protein leakage due to the increased permeability of bacterial membranes caused by NEs <200 nm in size. NO NEs were made with an ultrasonicator. The main compounds found, aside from nimbiol, were nimbandiol, 6-deacetyl nimbinene, and azadirachtin. NE dip coatings on fish fillets of Oreochromis niloticus maintained their pH (6.65 ± 0.43), moisture (8.23 ± 0.32%), and protein content (38 ± 7%) during the storage period. Interestingly, sensory attributes such as flavor, color, and aroma were in an acceptable range. These findings suggest that NO NEs can be a safe, effective, and ecofriendly preservative for fish and other meat products.

Abstract

Neem oil nanoemulsions (NO NEs) have gained attention as natural antibacterial agents due to toxicity concerns surrounding synthetic preservatives. This study aimed to prepare a response surface methodology (RSM)-optimized NO NE < 200 nm to achieve a stable dip solution to maintain the sensory quality of Oreochromis niloticus fillets. The NO NE achieved a stable formulation with a particle size of 160.2 ± 0.04 nm on average. The polydispersity index (PDI) was 0.1 ± 0.05, and the zeta potential was found to be 18.2 ± 0.09 mV. Gas chromatography confirmed the presence of nimbiol, nimbandiol, 6-deacetyl nimbinene, and azadirachtin in NO after ultrasonic homogenization for 10 min (alternating between 30 s rest and 30 s work time). The NE had a spherical shape with a smooth surface, as was evident from transmission electron microscopy (TEM). Furthermore, NO:PM (neem oil–potassium metabisulphite) had an MIC (minimum inhibitory concentration) value of 150 ppm, compared to 210 ppm for the NO NE alone, against Staphylococcus aureus. Time–kill dynamics revealed the more effective control of S. aureus until 72 h with NO:PM. Moreover, DNA and protein leakage also increased from 0.145 ± 0.001 to 0.769 ± 0.002 OD (optical density) and from 0.142 ± 0.002 to 0.740 ± 0.001 OD, respectively, with the co-formulation of NO:PM. Conclusively, NO:PM inhibited S. aureus at a lower dose compared to the NO NE alone. Time–kill dynamics revealed complete inhibition of S. aureus in vitro for a period of 72 h. On the other hand, a proximate analysis of O. niloticus fillets showed no alteration in pH, no protein loss, and juiciness/moisture retention during 30 days of storage (4 °C). Sensory panelists reported that O. niloticus fillets treated with NE NO had improved color, flavor, juiciness, aroma, and overall quality. These results show that NE NO is a suitable green preservative for fish and possibly other meat-based products.

1. Introduction

In global nutrition, fish plays a vital role due to its high-quality protein content with essential amino acids and omega-3 fatty acids; these are necessary to maintain health [1,2]. Nile tilapia (O. niloticus) is one of the most commonly farmed and consumed fish in Africa, Asia, and Latin America [3]. On a global level, its affordability, mild flavor, and ease of farming have made it an aquaculture staple food. However, like many other perishable food products, Nile tilapia fillets are highly susceptible to microbial contamination [4]. Fish is vulnerable to spoilage from bacteria like Vibrio spp., Aeromonas spp., Escherichia coli, S. aureus, Pseudomonas spp., and Listeria spp., which negatively affect flesh quality [5,6,7]. Proteolytic, lipolytic, and oxidative enzymes released from bacteria degrade the proteins, lipids, and carbohydrates of fish, and this process affects texture, flavor, color, and nutritional value [8,9], and food safety.
Synthetic preservatives (e.g., sodium benzoate, potassium sorbate, formaldehyde, and sulfites) have been traditionally used in the food industry to prevent the spoilage of perishable foods like fish fillets and ultimately extend their shelf lives [10]. However, the usage of synthetic preservatives can cause serious allergic reactions and toxicity [11,12]. Several countries have banned or restricted synthetic preservatives in foodstuffs due to their toxicity and sometimes even carcinogenicity [13,14]. Because of this awareness, plant-based preservatives like essential oils (EOs) have gained attention as alternatives to synthetic preservatives [15,16].
Plant essential oils are aromatic compounds with comparatively high volatility. They possess medicinal and antimicrobial properties [17,18]. Terpenoids, phenolics, and aldehydes in oregano, thyme, rosemary, and neem EOs have been found to exhibit broad-spectrum antimicrobial activity against E. coli and S. aureus [19,20]. Neem oil (NO, Azadirachta indica) is a natural preservative with antimicrobial and antifungal properties. Its addition can thereby extend the shelf life of various food products. Economically, its use supports sustainable agriculture and local industries, offering a cost-effective alternative to synthetic chemicals [21]. NO has strong antibacterial potential against the food-borne pathogen S. aureus [22]. However, EOs’ volatility, high required effective dose, and strong aromas have restricted their application areas [23,24]. NO is well known for its bactericidal, virucidal, fungicidal, insecticidal, and pest-repellent potential [25]. Nanocarriers, especially nanoemulsions, have larger surface areas, and they have revolutionized the application of natural bioactive substances, especially EOs. The small size of NEs produces transparent or translucent hydrophilic dispersions with extended solubility, stability, and antibacterial effectiveness [26,27]. The current study aimed to optimize NO NEs using RSM (response surface methodology) to determine the NO NEs’ in vitro antibacterial activity against S. aureus. Furthermore, we aimed to evaluate the potential of the NO NE to act as a natural preservative by dipping O. niloticus fillets and analyzing the impact of this treatment on the nutritional quality of O. niloticus fillets.

2. Materials and Methods

2.1. Chemicals

NO and long chain oil (canola, CA) were purchased from Karachi Essence Pvt. Ltd., Punjab, Pakistan. Ethanol and other solvents were procured from Sigma Aldrich, St. Louis, MO, USA, of analytical grade. Luria broth (LB), total plate count (TPC) agar, and sodium phosphate buffer were also purchased from Sigma Aldrich, USA. Deionized water was used for all the experiments.

2.2. Preparation of Nanoemulsions

First, 2% w/w Tween 80 (polysorbate, a nonionic surfactant and emulsifier) and 10% (50%:50%) oil phase NO:CA (neem oil:canola oil) in deionized water were processed via an ultrasonicator (UCD-1200, Biobase, Jinan, China). The coarse emulsion was first prepared using an Ultra-Turrax (UCD-1220, Biobase, China) at 18,000 rpm for 10 min. Subsequently, coarse emulsions were treated for 10 min via an ultrasonicator at an amplitude of 60–80% and the frequency was 0.6–0.8 kHz (UCD-1200, Biobase, China). The procedure of the NE preparation was adopted from previous work [28,29,30,31].

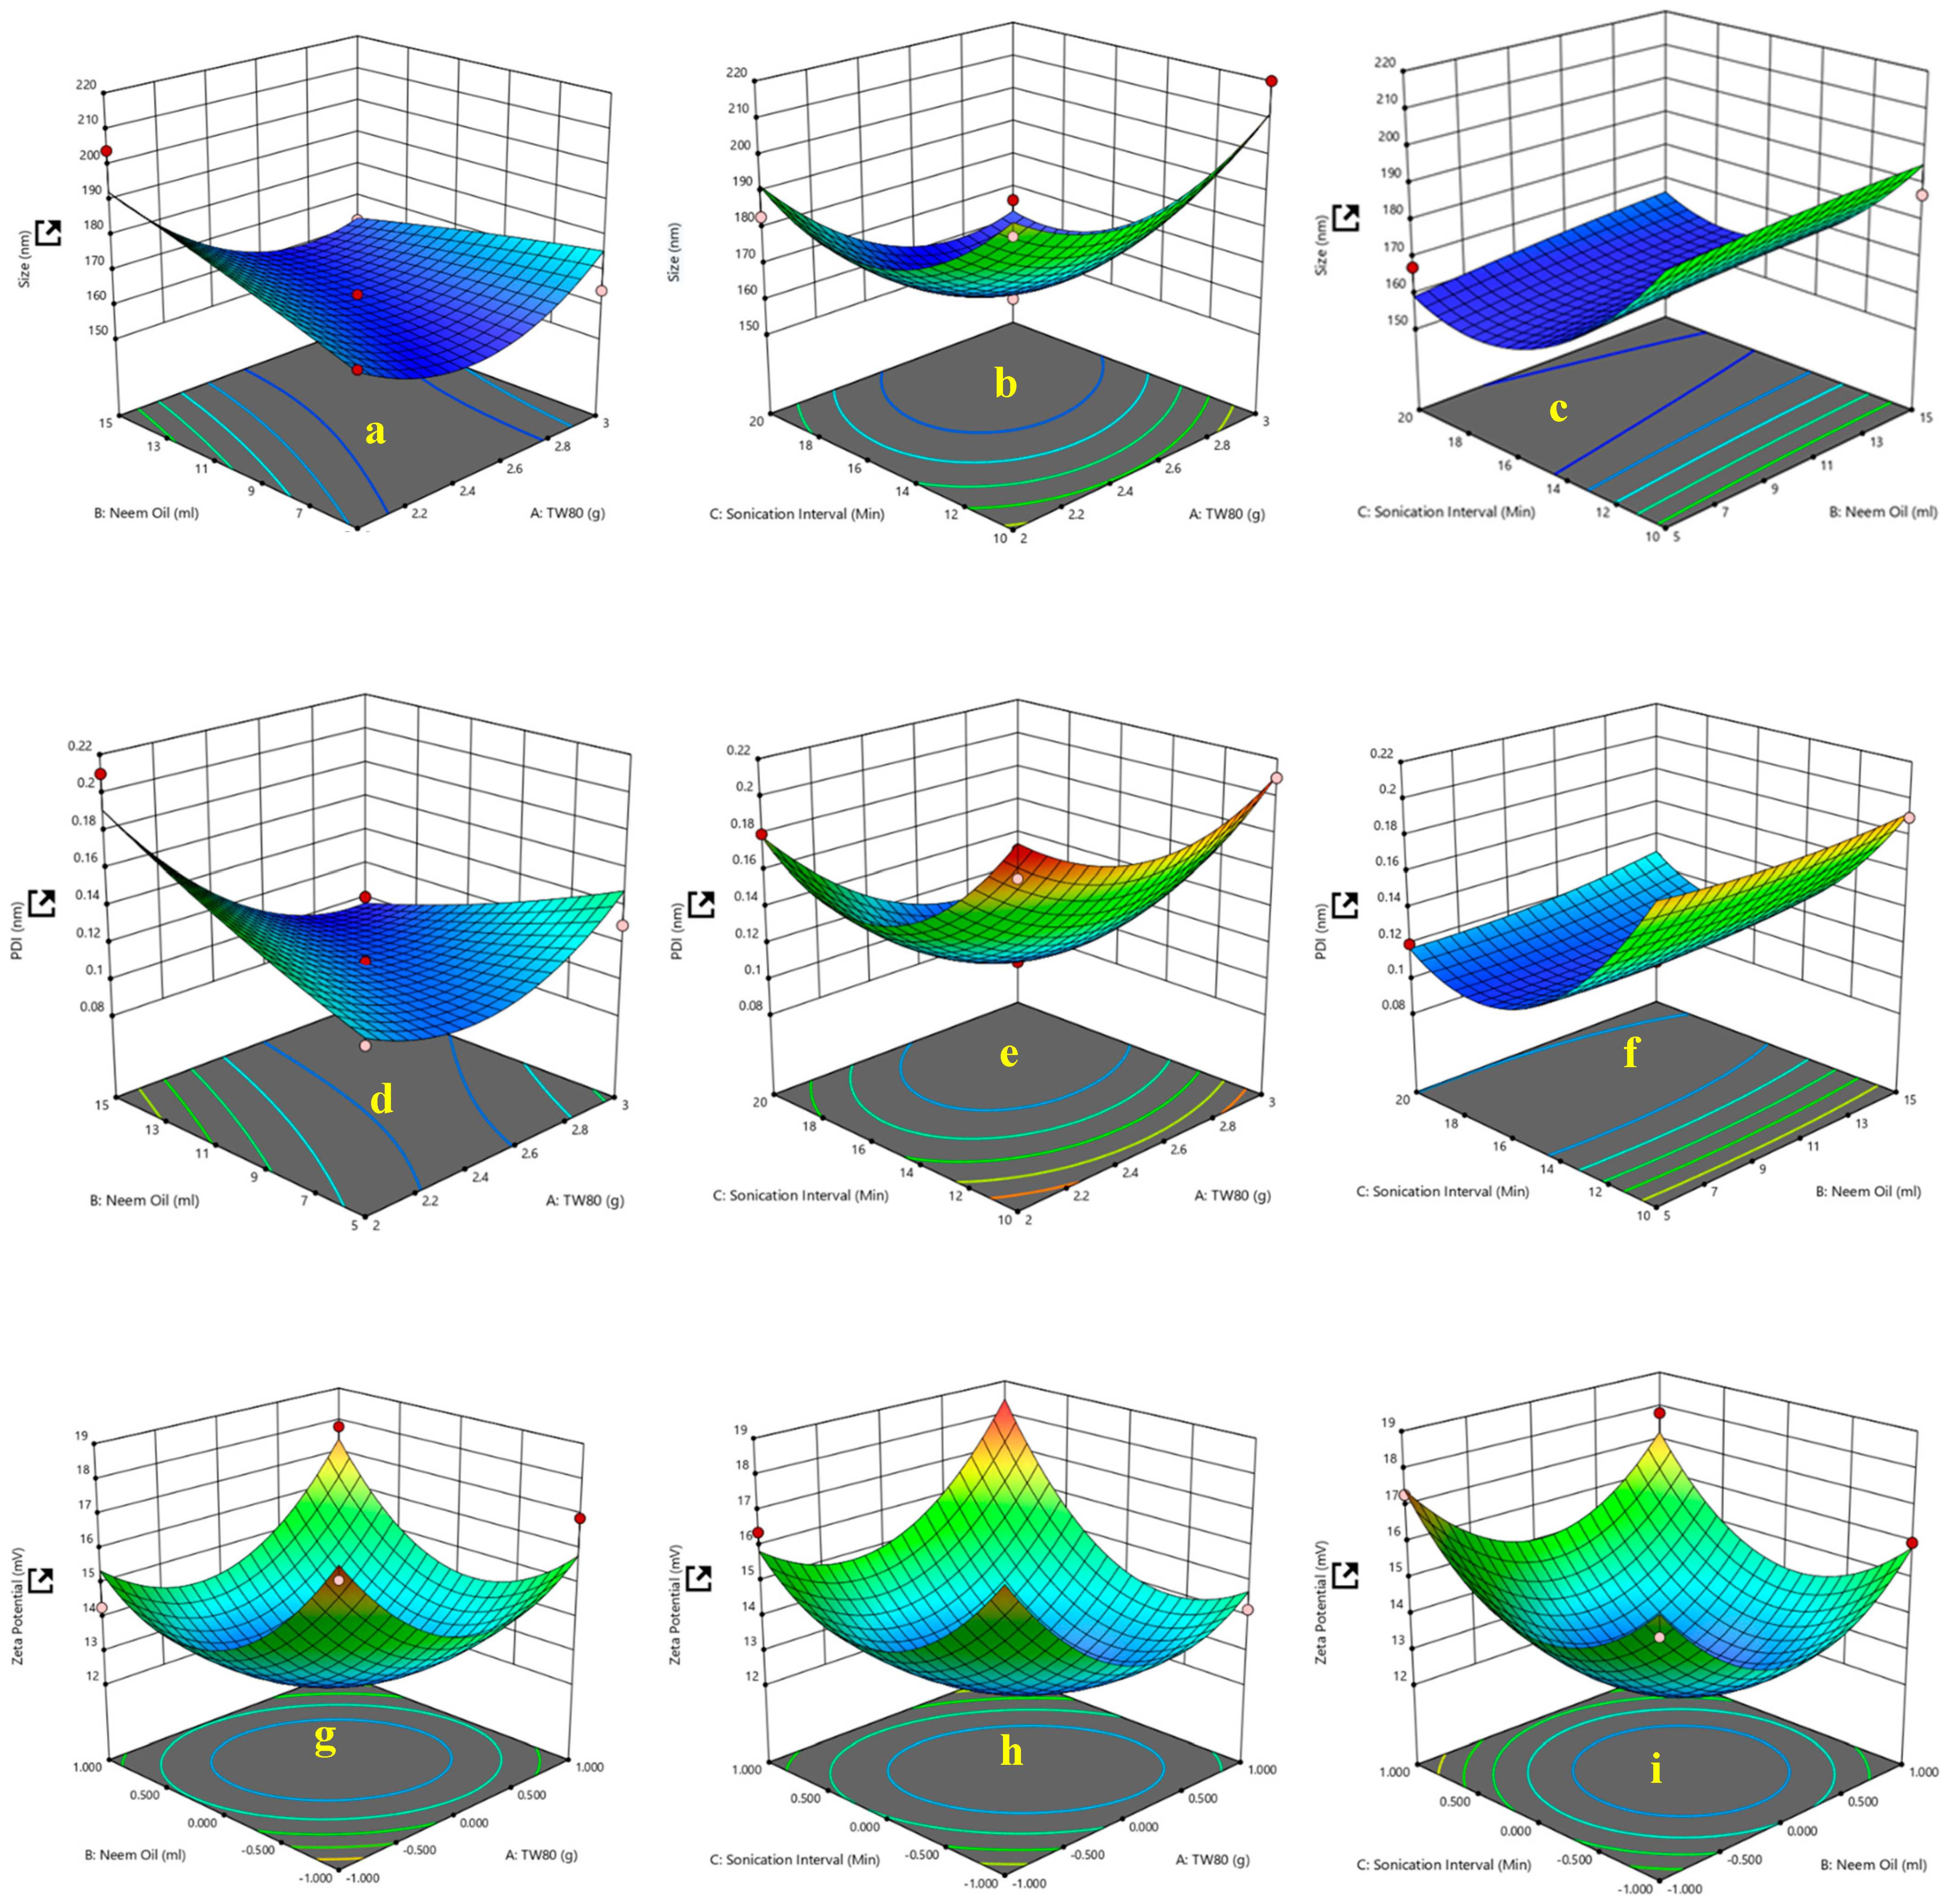
2.3. RSM for Optimized NE NEs

Response Surface Methodology (RSM) was employed to optimize the values for oil concentration, the concentration of the emulsifier, and the time of ultrasonication required to obtain narrowly distributed neem oil nanoemulsions [29]. A Box–Behnken design investigated three independent variables: the concentrations of the oil (A) and emulsifier (B), and time (C). Particle size (Y1), zeta potential (Y2), and the polydispersity index (PDI, Y3) were the dependent variables. Overall, 14 runs were used to optimize all three parameters (mean of three experimental readings). The final equation with “coded factors” is shown here:
Size= 507.813 + −199.875 × A + 9.7775 × B + −14.76 × C + −3.67 × AB + −3.6 × AC + 0.03 × BC + 55.85 × A2 + −0.0255 × B2 + 0.6795 × C2
PDI= 0.84625 + −0.35 × A + 0.02625 × B + −0.04525 × C + −0.012 × AB + −0.006 × AC + 0.0001 × BC + 0.105 × A2 + 0.00015 × B2 + 0.00175 × C2
Zeta Potential= 122.825 + −53.875 × A + −2.93 × B + −3.9125 × C + 0.4 × AB + 0.51 × AC + 0.004 × BC + 8.45 × A2 + 0.0915 × B2 + 0.0905 × C2

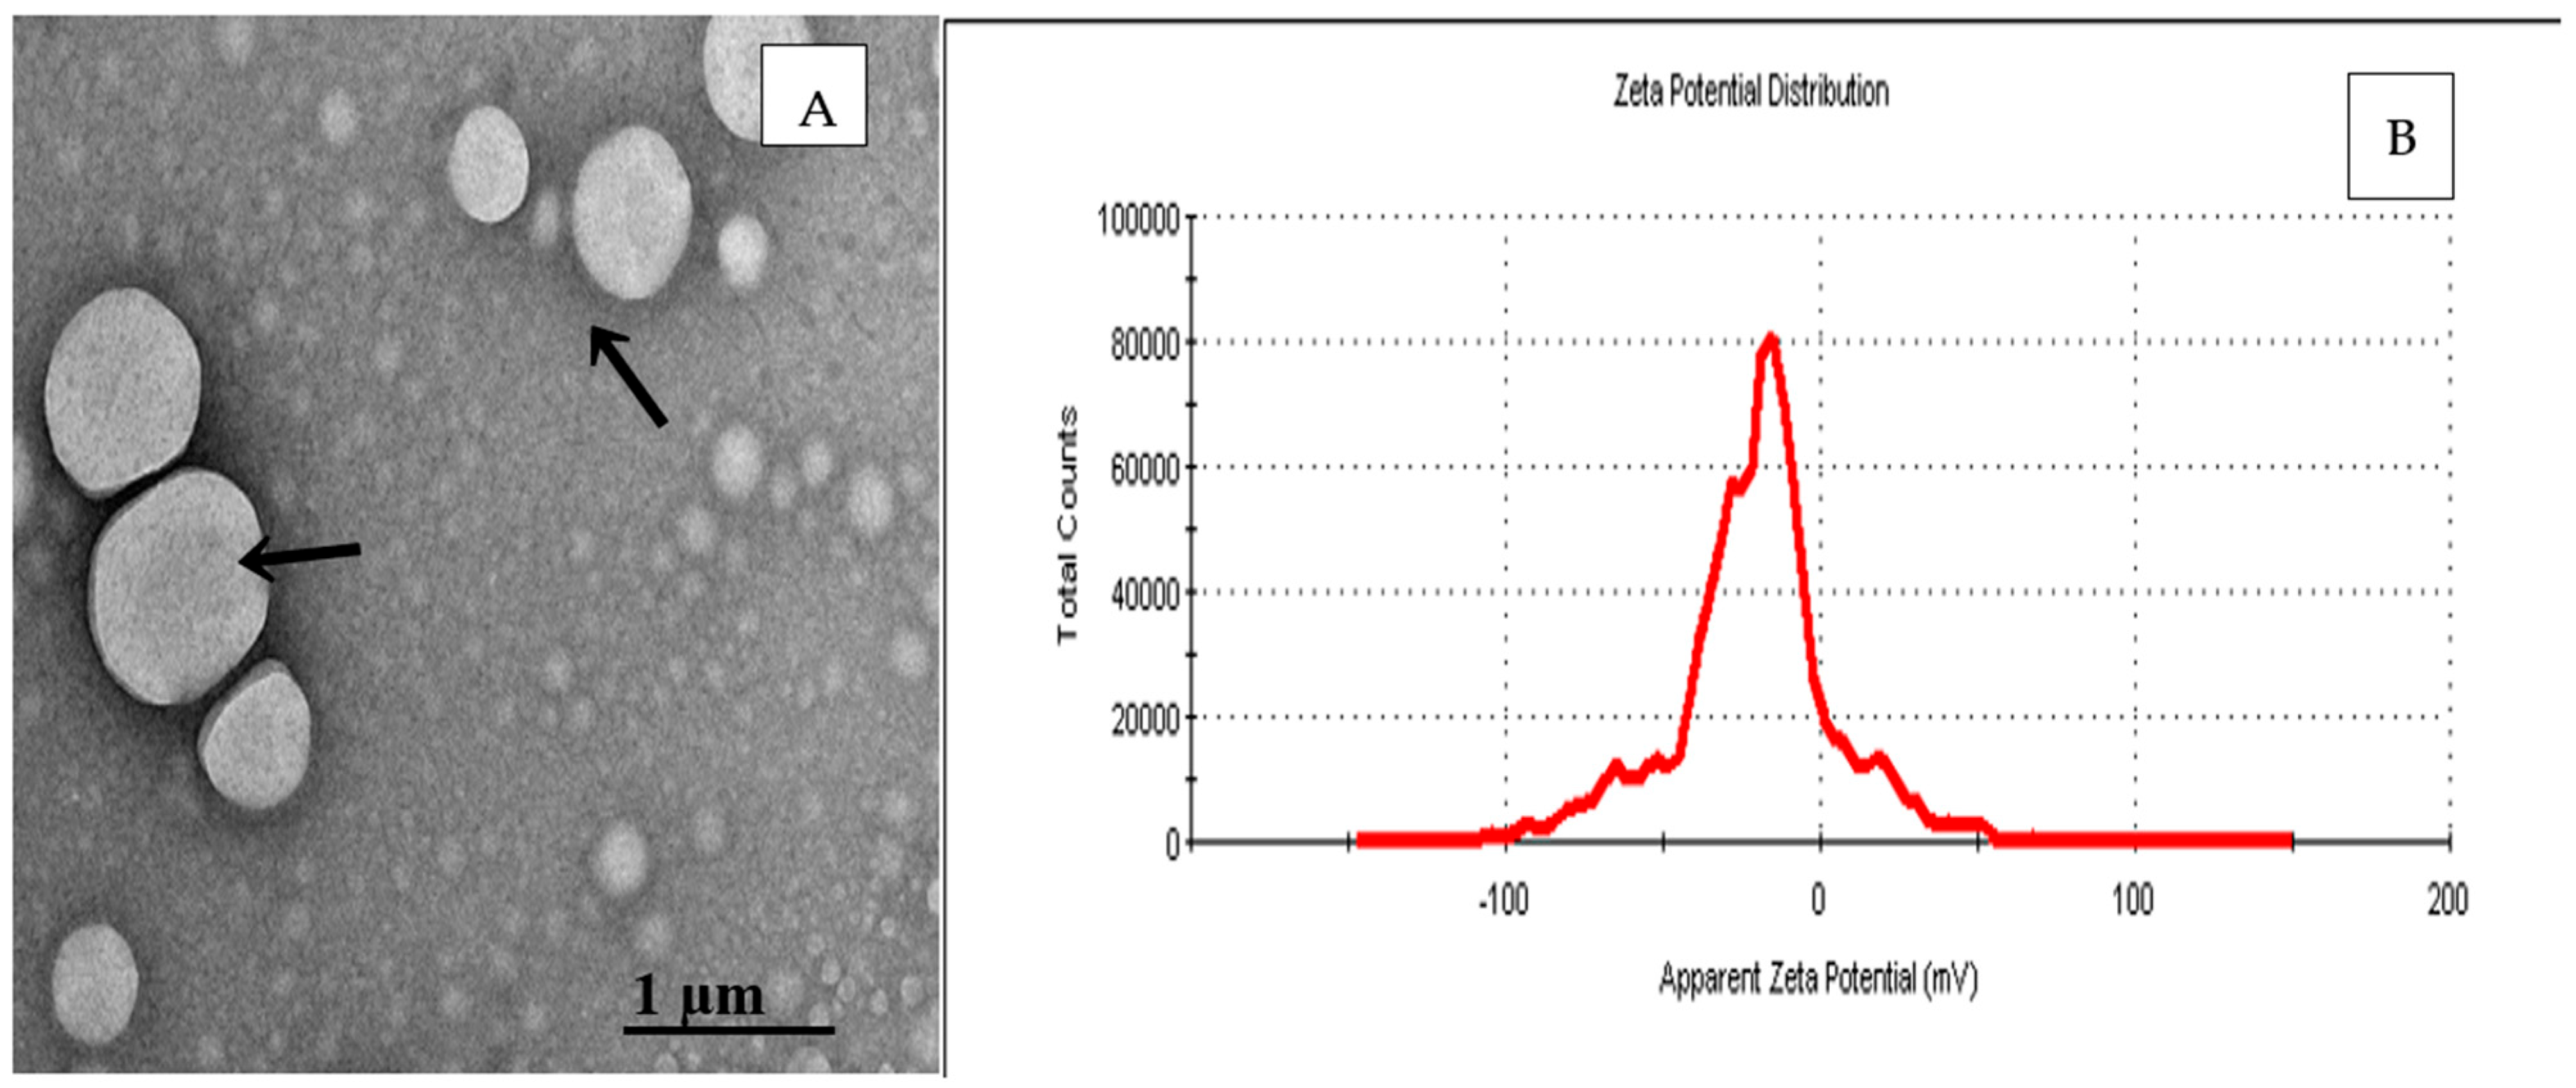
2.4. Transmission Electron Microscopy (TEM)

NO NE was analyzed for its morphology, shape, and dimensions using transmission electron microscopy (TEM) on a Jem 1010 (JEOL, Peabody, MA USA). The NE was diluted 10-fold and applied to a copper grid covered by a carbon film. Any excess liquid was removed by blotting it off to form a thin film, which was subsequently stained by a 1% phosphotungstic acid solution. Samples were dried for 1 min before examination under the JEOL Jem 1010 electron microscope at 64 kV accelerating voltage [32].

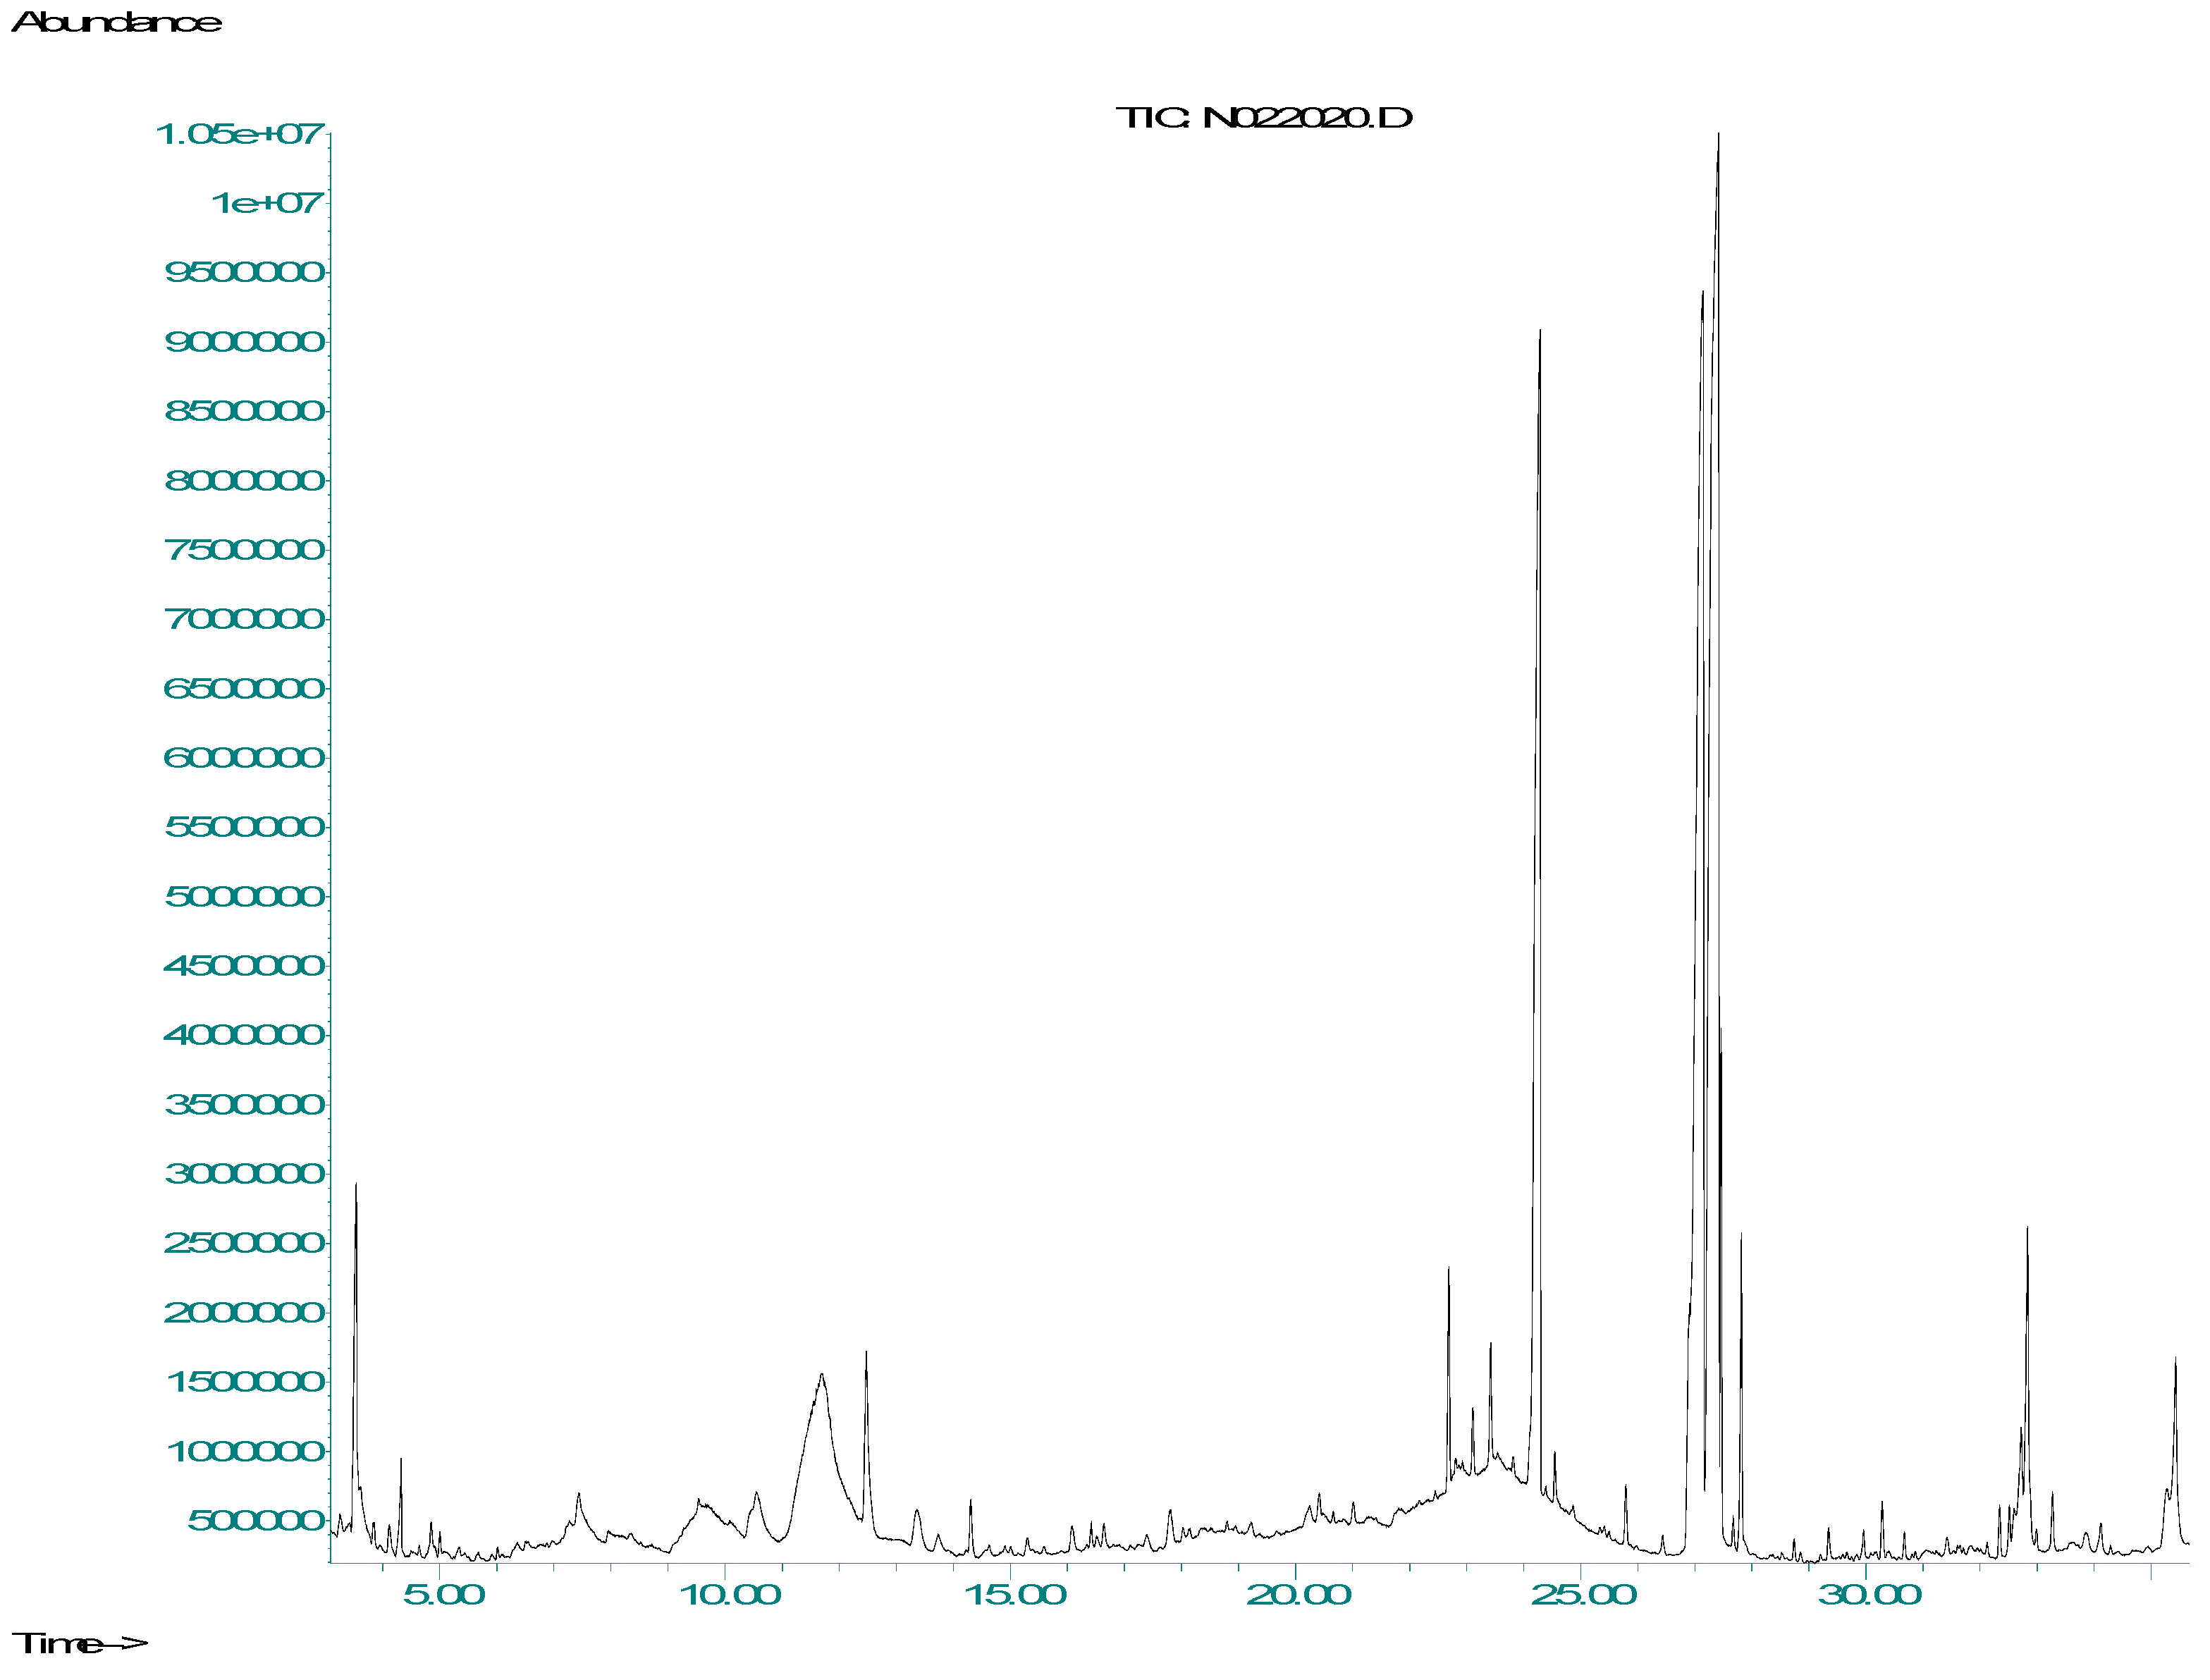
2.5. Gas Chromatography–Mass Spectrometry (GC/MS) Analysis

GC/MS (Varian 1200L, Agilent Technologies, Santa Clara, CA, USA) was performed with a DB-5 column (Agilent J&W, USA, key parameters: 30 m length, 0.25 µm film thickness, 0.25 mm column diameter). The gas chromatography was carried out at 40 °C for 2 min, followed by ramped heating from 40 to 100 °C at a rate of 8 °C per minute, and then to 230 °C at a rate of 10 °C per minute, using helium as carrier gas. Mass spectra parameters included a 70 eV ionization potential, 200 °C ion source temperature, and 30–500 Da mass range. The compounds were matched with a mass spectra library [33].

2.6. Determination of Minimum Inhibitory Concentration (MIC) Against S. aureus

MIC against S. aureus (ATCC 25923) was determined using a broth dilution assay in 96-well plates. Different concentrations of NO NE at 1 and 3% v/v (50 and 150 ppm) and PM (potassium metabisulphite) at 0.1 and 0.3% w/v (60 and 180 ppm) were added to a 96-well microplate for incubation at 37 °C. Subsequently, the samples were examined via a microplate reader at 590 nm. The lowest concentration of NO NE and NO:PM that inhibits the growth of S. aureus in terms of lower OD values was considered the MIC.

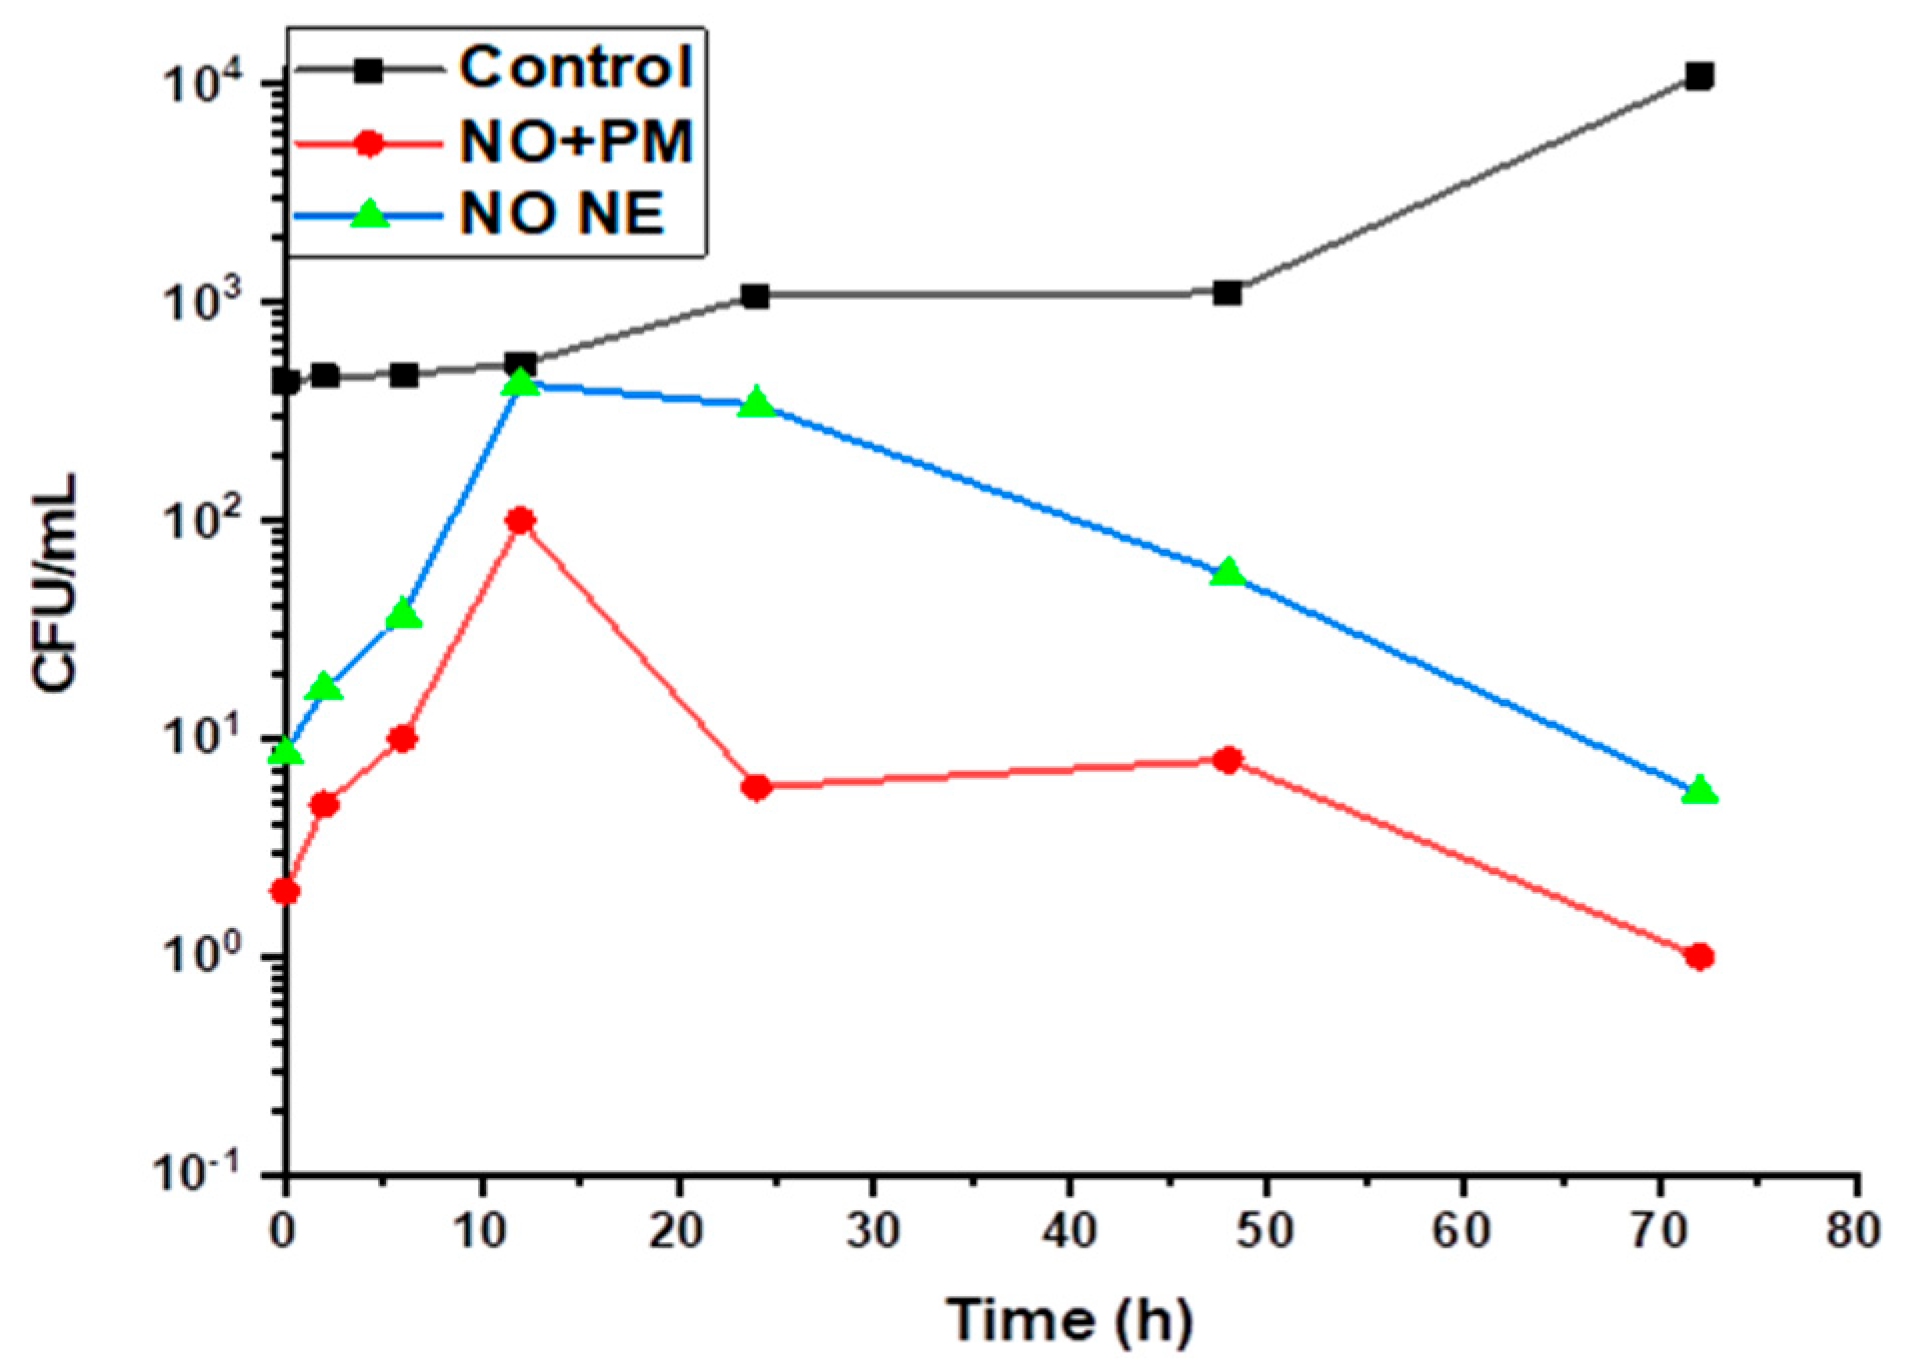
2.7. Time–Kill Dynamics

The time–kill dynamic curves were generated to evaluate the antimicrobial effectiveness of NO NE and NO:PM to counter S. aureus. The S. aureus (10 µL) was cultured on LB medium with a NO NE and NO:PM at its MIC and later incubated (37 °C) for 2 to 72 h. The bacterial colonies were counted with a marker to determine their CFU/mL. All experiments were carried out in triplicate [28].

2.8. Protein and Nucleic Acid Leakage

For the determination of protein and nucleic acid (NA) leakage, all samples were centrifuged (8000× g, 4 °C, 10 min) for pellet collection. The protein and nucleic acid release was measured via a UV–Vis spectrophotometer (UV-2600, Shimadzu, Tokyo, Japan), where the optical density (OD) at 280 and 260 nm was determined. Simultaneously, the quantity of released proteins was calculated using ultraviolet absorbance values at 280 nm against a standard curve obtained with bovine serum albumin (BSA). All experiments were performed in triplicate [34].

2.9. Surface Preparation

Fresh O. niloticus fillets were procured from the local fish market of Bahawalpur, Pakistan, kept in an ice container and transferred to the food processing lab at the Department of Food Science and Technology, Cholistan, University of Veterinary and Animal Science, Bahawalpur, Pakistan. These fillets were washed, dried, and stored for 1 day at 4 °C in sealed plastic bags. The purpose of preparing the surface was to remove any contaminants that could interfere with the adhesion of the dip.

2.10. Preparation of Dip-Coating

The NO NE (3% v/v) and NO:PM (3% v/v: 0.1% w/v) dipping solutions were prepared in deionized water to avoid any contamination. The O. niloticus fillets (65 ± 2 g) were dipped for 30 min, dried, and then refrigerated in zipper bags.

2.11. Application of Dipping

The fillets were dipped in 0.1% w/v PM, NO NE (3% v/v), and NO:PM (3% v/v: 0.1% w/v) for 30 min, then dried for 15 min before being refrigerated in sealed plastic bags. Undipped fillets served as control. All dipped and undipped fillets were stored separately in plastic bags in a refrigerator for 30 days (4 °C) to assess their preservation quality.

2.12. Proximate Analysis of the Dipped Fillets

Proximate analysis was performed at 0 and 30 days to identify the changes in proximate parameters affecting the shelf life of O. niloticus fillets in preserved and unpreserved mode. The analysis was carried out in triplicate to obtain the mean ± standard deviation (SD).

2.12.1. Moisture

The moisture content of O. niloticus fillets was determined using the procedure given by [35]. A 10 g sample was transferred to a petri dish, which was then placed in a hot air oven at 100 °C until reaching a constant weight. The moisture content was determined gravimetrically:
M o i s t u r e   c o n t e n t = L o s s   o f   w e i g h t W e i g h t   o f   s a m p l e   t a k e n × 100

2.12.2. Ash

The proximate analysis was carried out according to the standard procedures reported by [35]. The ash content of the fillets was determined in a muffle furnace (550 °C, 10 h). A 10 g fish sample was placed in a China crucible and incinerated at 550 °C until the weight stabilized. The sample was then allowed to cool in a desiccator for 15 min before its final weight was recorded. Below, the formula is shown:
A s h   c o n t e n t = W e i g h t   o f   A s h W e i g h t   o f   s a m p l e   t a k e n × 100

2.12.3. pH

For the determination of pH, 1 g of fish fillet was homogenized in normal saline using an ultrasonic crusher (DLAB, D160, Shanghai, China). The pH electrodes were dipped in the crushed solution to measure the pH. The experiment was performed in triplicate [35] at room temperature.

2.12.4. Protein

A sample of the O. niloticus fillet (10 g) was homogenized using a cell crusher (DLAB, D160, Shanghai, China), and the protein was collected by centrifugation at 10,000 rpm for 2 min (Eppendorf, Hamburg, Germany). Later, the sample was placed in a UV spectrophotometer for protein determination at 280 nm [36].

2.12.5. Carbohydrates

A 0.005 g sample was added to ethanol and vortexed for maximum extraction of the carbohydrates. The extracted carbohydrate supernatant was placed into a UV-Vis spectrophotometer and measured at 270 nm. A similar method of total carbohydrate determination has already been documented [37].

2.13. Total Plate Count (TPC) of the Fillets

A sample of the O. niloticus fillet was mixed in sterile buffered peptone water solution for homogenization. The homogenate sample was inoculated on TPC (total plate count) agar to visualize any bacterial contamination [38,39]. The control and NO NE-treated fillets were washed with saline water to attain bacterial colonies. A 10 µL sample was spread on a TPC plate and incubated at 37 °C for any colony appearance. The number of colony forming units (CFU) was identified and reported as the Total Plate Count (TPC).

2.14. Sensory Analysis

Twenty trained sensory panelists (10 male and 10 female, average age: 23, Department of Food Science, CUVAS, Bahawalpur, Pakistan) completed the blind evaluation using a 9-point hedonic scale [40]. Each sample was offered three times to each panelist, and the answers were averaged. The samples were randomly assigned to the group. The panelists were directed to score the dipped and undipped samples based on their resemblance for the following attributes: color, flavor, juiciness, tenderness, aroma, mouth feel, and overall quality.

2.15. Statistical Analysis

Data were analyzed with SPSS Statistics for Windows, version 20.0 (SPSS Inc., Chicago, IL, USA) using analysis of variance (ANOVA) (p < 0.05). All values were presented as mean ± SD (standard deviation).

3. Results

3.1. Multiple Factor Experiments

The Tween-80 concentration and NO NE dosage, as well as the sonication interval, were optimized using a Box–Behnken design of RSM, as shown in Figure 1. The droplet size of the NO NE was in the range of 160.2 ± 0.04 nm to 220 ± 0.18 nm, and the smallest droplet size of 160.2 ± 0.04 nm was observed with Tween 80 (2.5 g) and NO (10% v/v NO:CA). The PDI values were 0.1 ± 0.05 and 0.21 ± 0.05, respectively, as detailed in Table 1. The lowest PDI (0.1 ± 0.05) was achieved at 2% w/w Tween-80, 10% v/v NO, and a sonication interval of 10 min. These conditions also indicated improved NE homogeneity and stability. The zeta potential was in the range of 12.1 ± 0.01 mV to 18.2 ± 0.09 mV. The highest zeta potential value (18.2 ± 0.09 mV) was observed at Run 6 (2% w/w Tween-80, 10% NO and 10 min sonication interval), as presented in Figure 2B. The droplet size of NO NE was < 200 nm, as depicted in Figure 2A, obtained from transmission electron microscopy.
The gas chromatographic analysis revealed the retention time and peak areas of the different compounds in NO NE, as shown in Table 2. The retention time and peak area of nimbiol were 22.69 min and 115,540 (au, arbitrary units), while 6-deacetyl nimbin had a retention time of 24.29 min, and its peak area was 100,704 au. Similarly, 6-deacetyl nimbinene showed a retention time of 26.91 min with a peak area 114,381 au. The compound 9, 12, 15-octadecatrienoic acid (linolenic acid) had a retention time of 27.13 min with a peak area 113,306 au. The main active compound azadirachtin had the highest peak area of 116,666 au with a retention time of 27.46 min, as shown in Figure 3. Lastly, the shortest retention time was recorded as 4.33 min for nimbandiol, with the lowest peak area of 1319 au. These findings are consistent with (Alzohairy) [33], who reported azadirachtin as the most abundant active compound, which has been found to show its inhibitory effect on microbial growth through the disruption of cell walls.

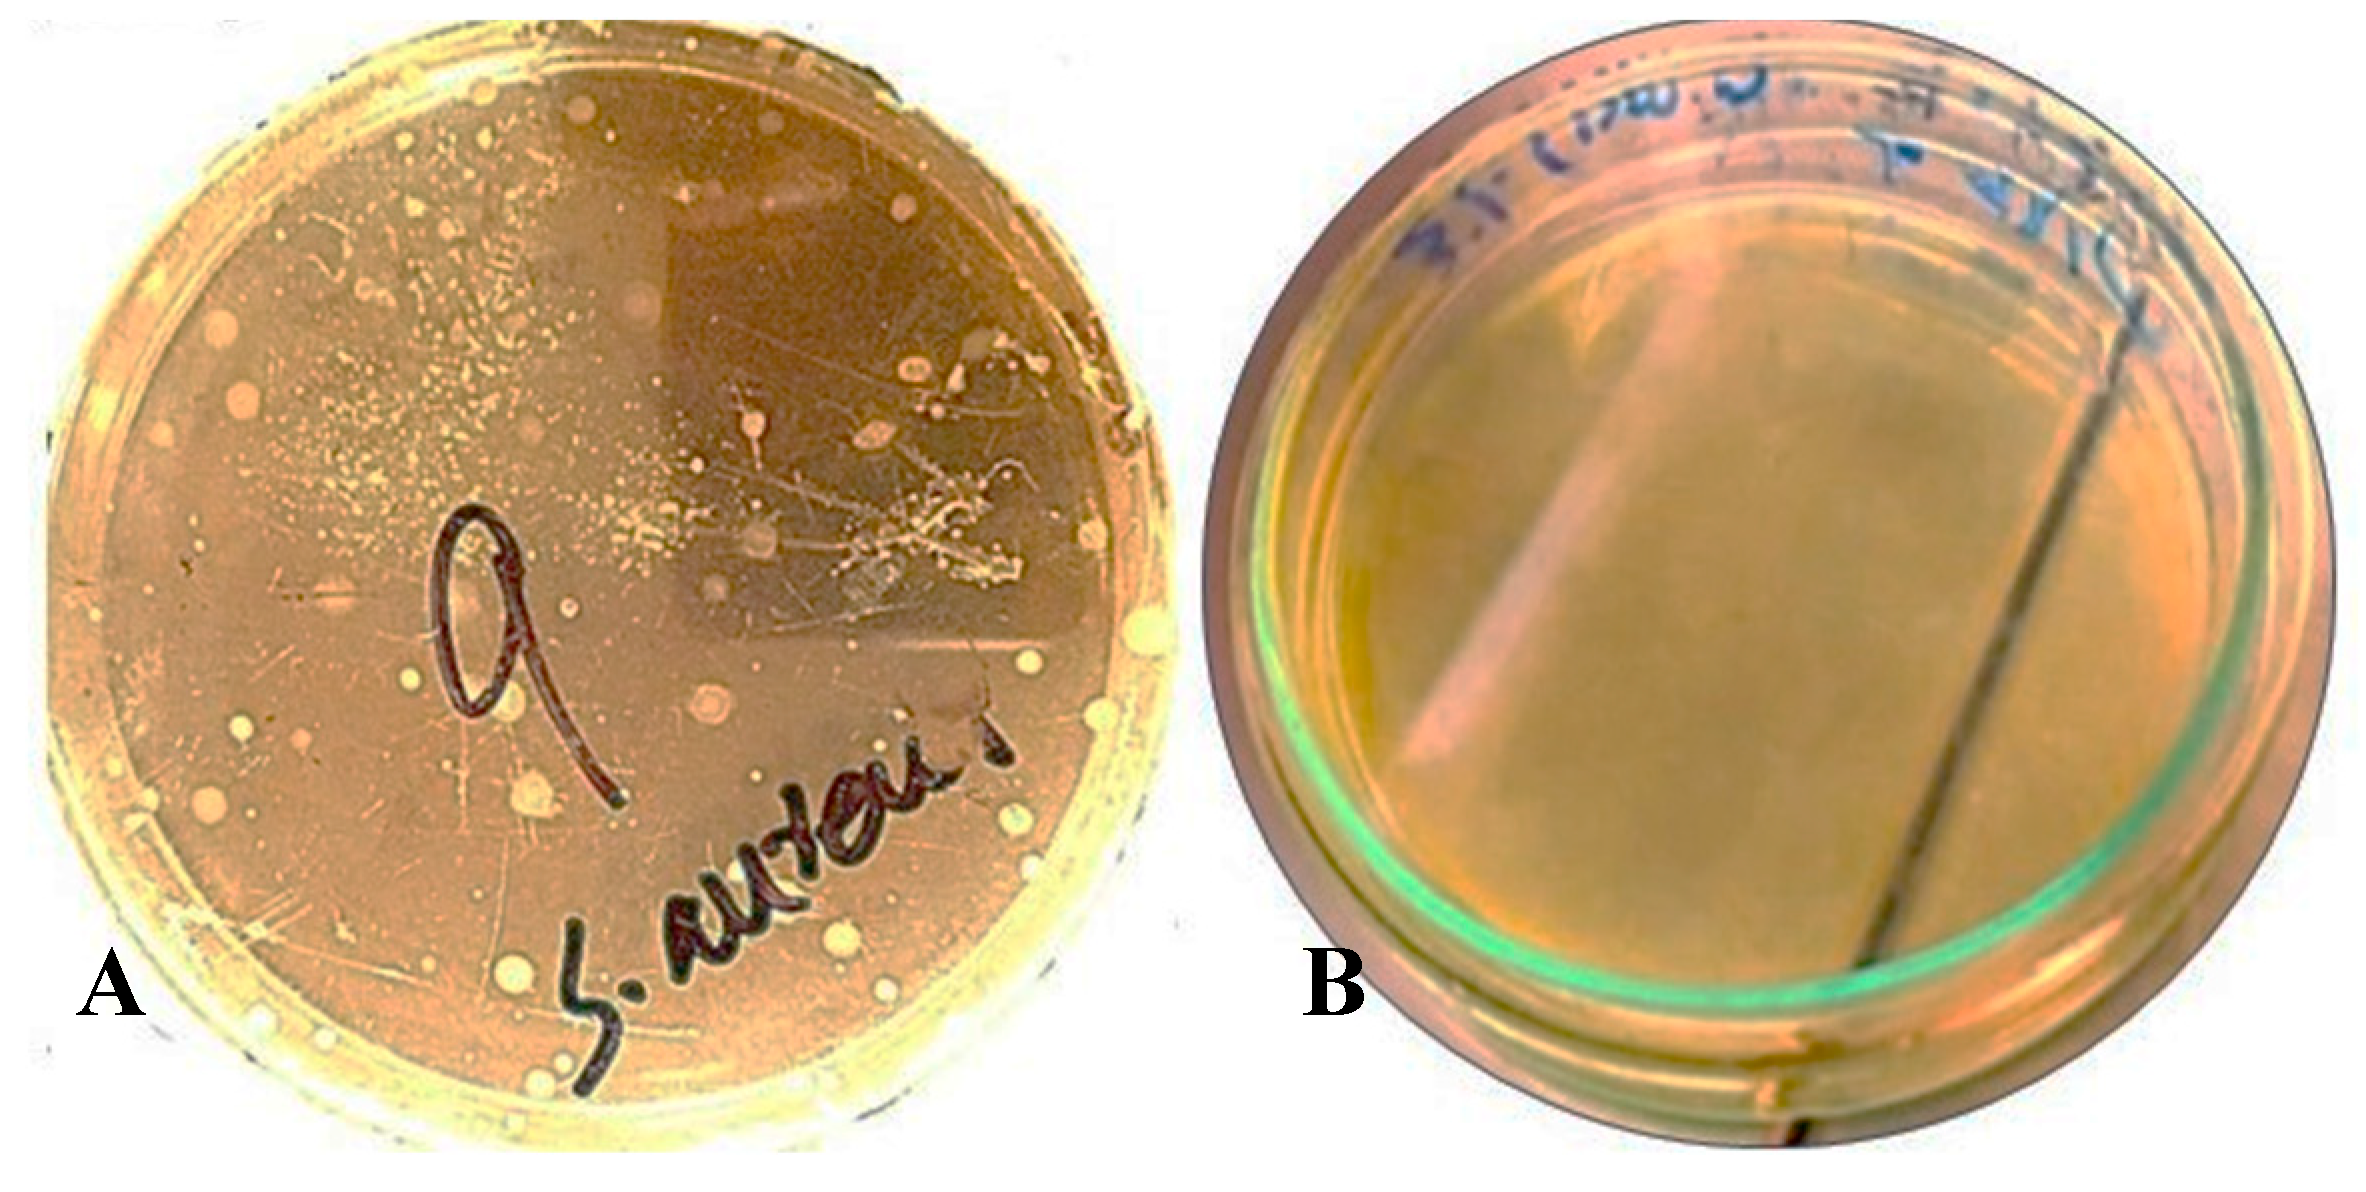
3.2. Antibacterial Activity of NO NE and PM (Potassium Metabisulphite) Against S. aureus

The MIC values of S. aureus treated with NO NE and PM are illustrated in Table 3. NO NE and PM in combination showed the highest MIC value for inhibiting bacterial growth.

3.3. Time–Kills Dynamics

The bactericidal activity of low-dose NO NE (3% v/v) and NO + PM (3% v/v: 0.1% w/v) against S. aureus was examined using a time–kill dynamic experiment. Figure 4 shows the bacterial count (CFU/mL) at 0, 2, 6, 12, 24, 48, and 72 h (CFU = colony-forming units). The control group had a steady increase in growth, reaching 105 CFU/mL after 72 h. In the case of NO NE, as shown in Figure 4, the bacterial count dropped to 101 CFU/mL after 8 h and after 12 h increased to 102 CFU/mL. After this, the bacterial count stabilized at 101 CFU/mL and remained at this level until 72 h. On the other hand, NO+PM exhibited a more rapid and effective bactericidal effect. By 12 h, the bacterial count decreased to 10¹ CFU/mL, and reached 100 after 72 h.

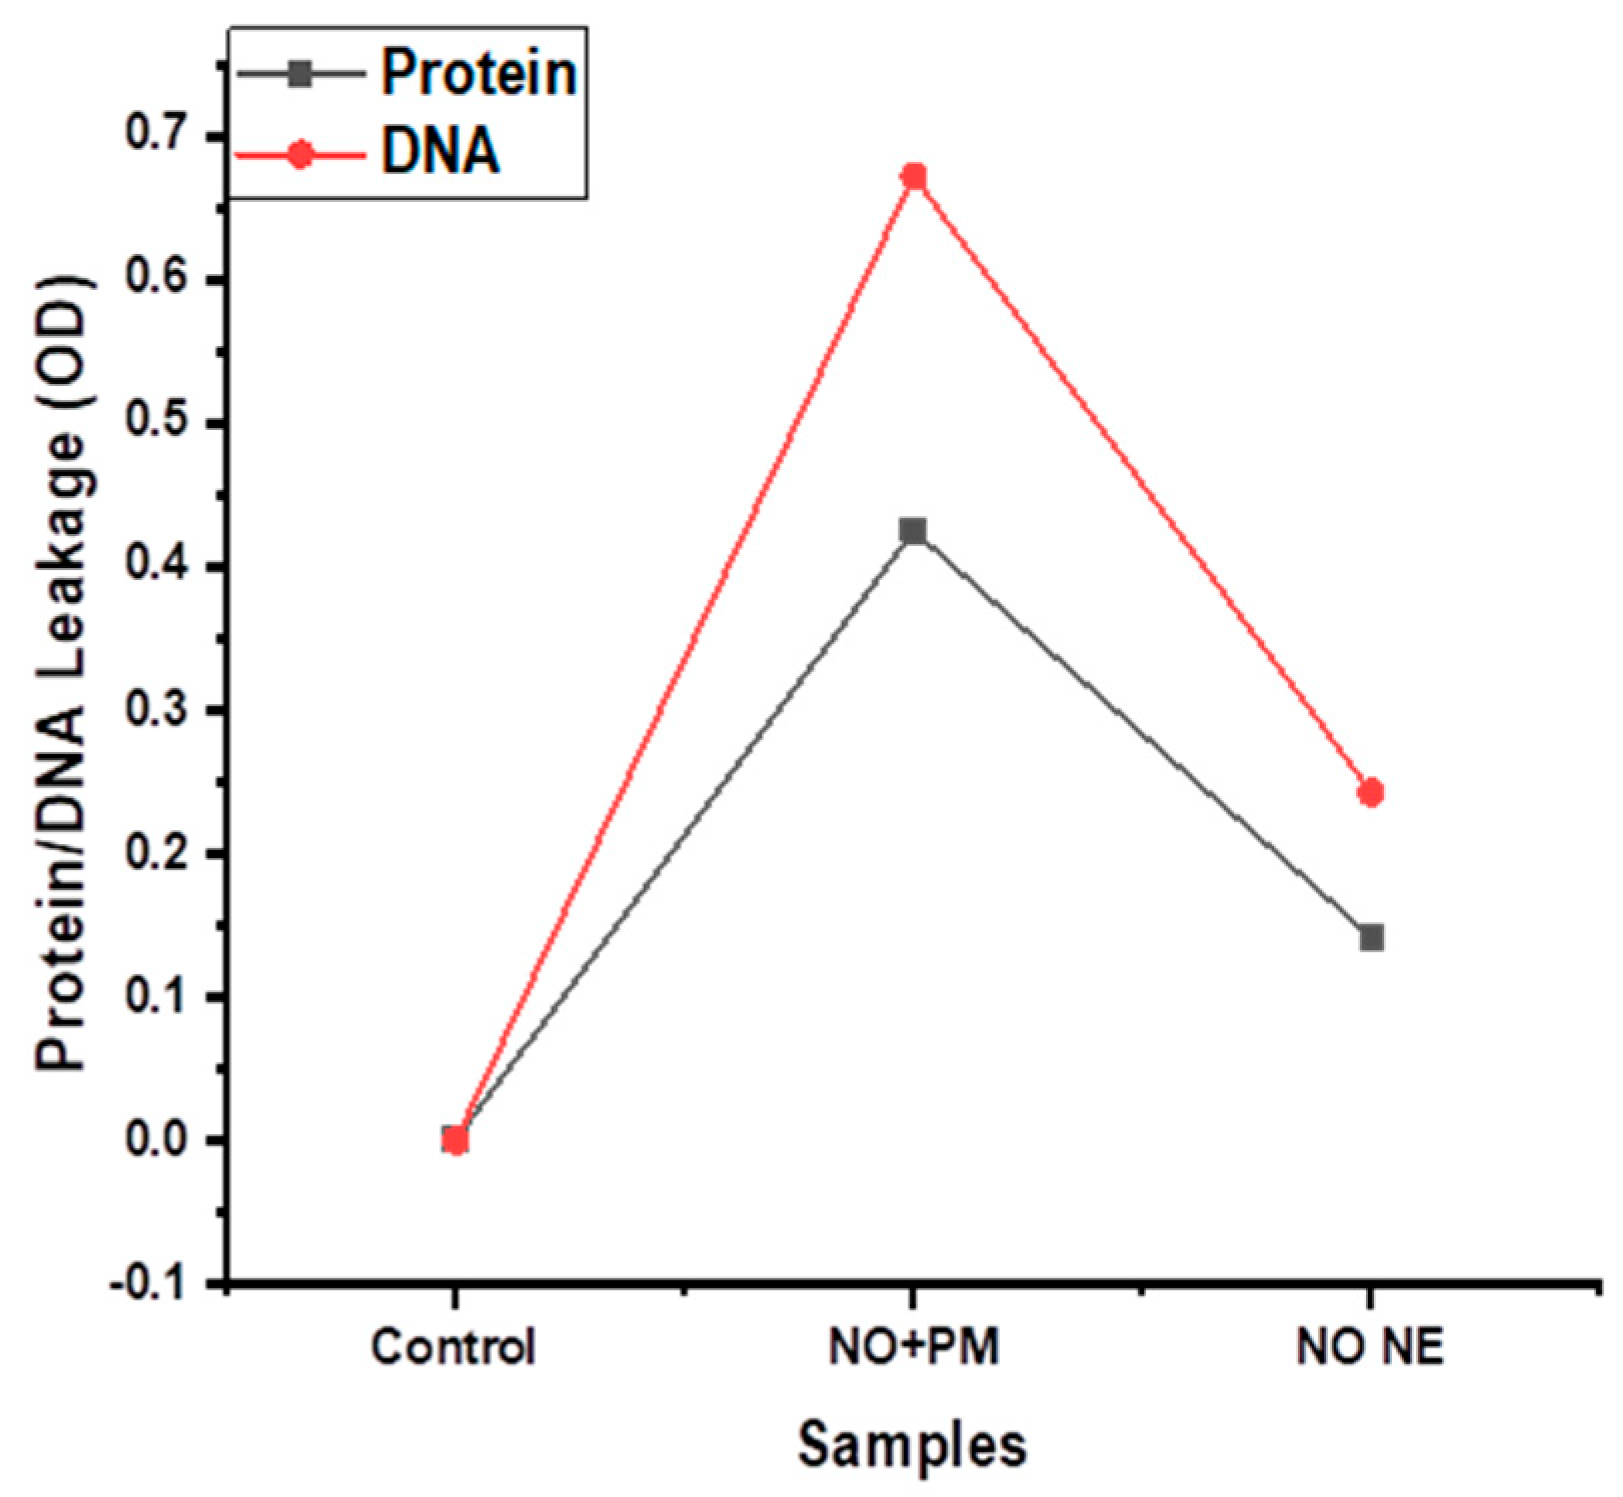
3.4. Protein and DNA Leakage

Protein and DNA leakage from S. aureus exposed to 3% v/v NO NE + 0.1% w/v PM were quantified using a spectrophotometer. The protein and DNA leakages were higher in the treatment group vs. the control, see Figure 5. S. aureus treated with NO NE exhibited protein leakage (0.13 OD), which increased to 0.36 OD when exposed to 3% v/v NO NE + 0.1% w/v PM. However, in the case of DNA, the quantity observed with 3% v/v NO NE + 0.1% w/v PM was 0.67 OD vs. the control. By contrast, the DNA leakage from NO NE-treated S. aureus was 0.27 OD, as shown in Figure 5.

3.5. Proximate Analysis

pH remained stable throughout the 30 days in all treated groups, as presented in Table 4. pH values for the 3% v/v NO NE and 3% v/v NO + 0.1% w/v PM alone consistently ranged between 5.50 and 6.65. However, the control group showed a marked decline (p < 0.05) in pH, reaching 5.50 ± 0.38 on Day 30. During the study period, protein levels decreased in all groups. The treatment with 0.1% w/v PM combined with 3% v/v NO NE slightly reduced the protein content from 0.40 ± 0.008 to 0.38 ± 0.06, and 3% v/v NO NE alone reduced it further to 0.37 ± 0.07. Ash content increased in the control group over 30 days, from 0.25% ± 0.34 to 1.31% ± 0.42 (p < 0.05), compared to treatment groups. In contrast, the combination of 3% NO NE with 0.1% w/v PM and 3% v/v NO NE alone showed a modest increase, from 1.06% ± 0.20 to 1.1% ± 0.25, respectively. All the groups maintained relatively constant moisture levels. Minor reductions in moisture were noted for 3% v/v NO NE and 3% v/v NO NE + 0.1% w/v PM, with final values between 8.20% ± 0.26 and 8.32% ± 0.42%. The decrease in moisture of the control group was slightly more pronounced, i.e., 8.12% ± 0.08 (p < 0.05). The minimal moisture loss in treated groups relative to the control implies a protective effect of NE treatments. By Day 30, carbohydrate levels in all treated groups had decreased slightly. However, the 3% v/v NO NE combined with 0.1% w/v PM and 3% v/v NO NE gave slightly suppressed carbohydrate levels, reaching 1.19% ± 0.07 and 1.15% ± 0.07, respectively. The 0.1% w/v PM showed a similar decline, with carbohydrate levels dropping to 1.15% ± 0.08. The control group exhibited a significant decrease in carbohydrate content from 1.20% ± 0.04 to 1.05% ± 0.08 (p < 0.05). Interestingly, the treatments were able to maintain or slightly lower carbohydrate concentrations, in contrast to an increase observed in the control group.

3.6. Total Plate Count (TPC)

The TPC of O. niloticus as a control and as treated with NO+PM is presented in Figure 6. The control group had clear colonies of S. aureus (104 CFU/mL), as demonstrated in Figure 6A. However, 3% v/v NO NE in combination with 0.1% w/v PM effectively inhibited the growth of bacteria, as shown in Figure 6B. Similar studies by Safya and Rotliwala [41] demonstrated that a nano emulsion formulation improves the stability, solubility, and bioavailability of neem oil, extending its sustained antimicrobial action.

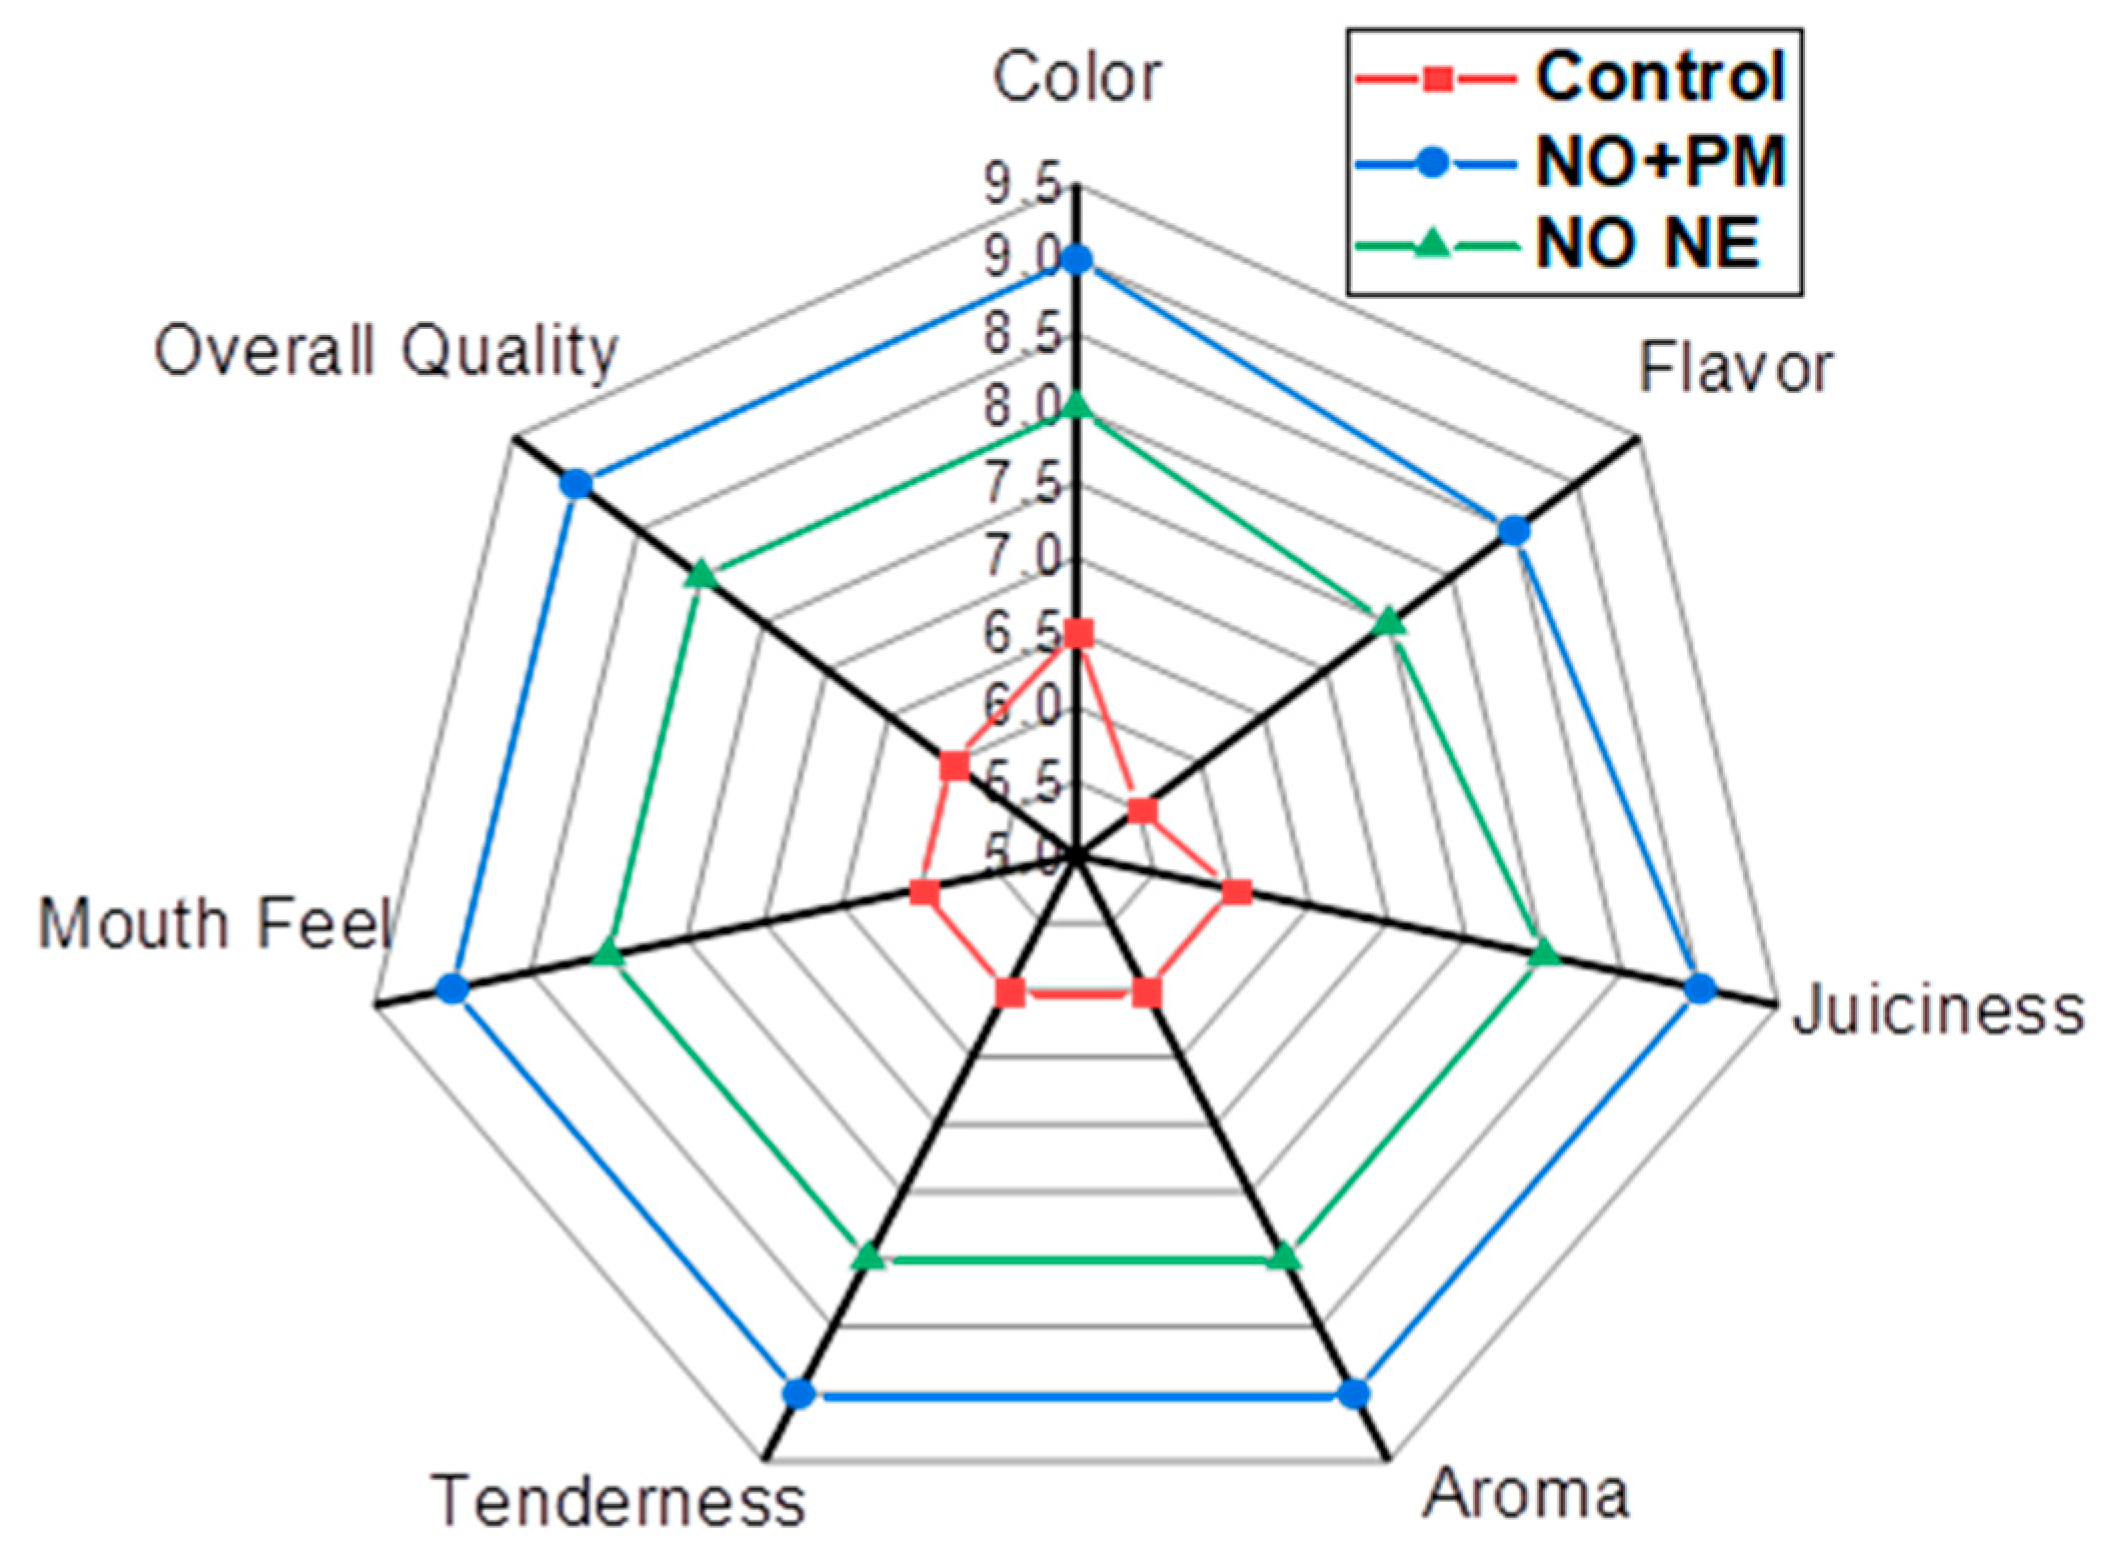
3.7. Sensory Evaluation

Sensory evaluation of O. niloticus after 30 days indicated significant improvements in all parameters under all treatments compared to the control (undipped sample), as displayed in Figure 7. The following observations were noted: The control sample scored 6.5 for color, while treatments with 0.1% w/v PM and 3% v/v NO NE scored 7.5 and 8.0, respectively. The highest score of 9.0 was achieved with 3% v/v NO NE + 0.1% w/v PM, which exhibited the most significantly vivid and appealing color (p < 0.05). Flavor scores increased from 5.5 for the control to 7.0 for 0.1% w/v PM and 7.5 for 3% v/v NO NE. The best rated (8.5) flavor was achieved with the 3% v/v NO NE + 0.1% w/v PM treatment (p < 0.05). juiciness–initially rated 6.0 for the control–improved to 7.0 and 8.0 with treatments of 0.1% w/v PM and 3% v/v NO NE, respectively. The treated 3% v/v NO NE + 0.1% w/v PM sample was awarded the highest score of 9.0, indicating significantly better juiciness retention (p < 0.05). Aroma scores for the control sample were 6.0, which increased to 7.5 when treated with 0.1% w/v PM, while 3% v/v NO NE scored 8.0. The best aroma score of 9.0 was obtained with the 3% v/v NO NE + 0.1% w/v PM treatment (p < 0.05). There was a gradual improvement in tenderness from the control (6.0) to 0.1% w/v PM (6.5) and 3% v/v NO NE (8.0). The sample treated with 3% v/v NO NE + 0.1% w/v PM received the significantly (p < 0.05) highest tenderness score of 9.0. From 2.0 in the control to 3.0, 4.0, and 5.0 with 0.1% w/v PM, 3% v/v NO NE, and 3% v/v NO NE + 0.1% w/v PM, respectively, the mouth feel score increased. This resulted in an increase in the overall quality of the samples from 6.0 for the control, 7.0 for 0.1% w/v PM, 8.0 for 3% v/v NO NE, and 9.0 for 3% v/v NO NE + 0.1% w/v PM treatment, which was significantly higher (p < 0.05).

4. Discussion

This study reveals promise for applying NO NE as a versatile formulation for improving microbial efficacy, stability, and sensory attributes. The NO NE droplet size (160.2 ± 0.04 to 220 ± 0.18 nm), PDI (0.1 ± 0.05 to 0.21 ± 0.05), and zeta potential (12.1 ± 0.01 to 18.2 ± 0.09 mV) were stable and showed excellent sustained release of the antimicrobial compounds contained therein. These results were in accordance with [29,42], who reported the 30 days’ stability of carvacrol (5-isopropyl-2-methylphenol, CAS number 499-75-2, found in oregano oil, thyme, and pepperwort) NE with a particle size of 160 nm and a PDI of 0.12. The gas chromatography confirmed the safety of the applied ultrasonication procedure, as the compounds obtained were the same as those reported in the vendor specification sheet of NO. These results were in line with [28], who reported a similar composition of clove oil (rich in eugenol) in nanoemulsions after high-pressure homogenization. Similarly to our work, [43] studied the effect of Rosmarinus officinalis composition on antibacterial activity and concluded that a high portion of α-pinene showed increased effectiveness against S. aureus.
The results on antimicrobial efficacy against S. aureus with 3% v/v NO NE + 0.1% w/v PM led to lower MIC values due to the synergistic action of NO and PM. A similar trend has been reported [44], where synthetic preservatives such as sodium benzoate and cumin oil have lower MIC values vs. the control. The time–kill-dynamics demonstrated that combined NO NE and PM substantially reduced kill efficacy to 100 CFU/mL in comparison to the control. Similarly, sodium benzoate and cumin oil synergistically enhanced time–kill efficacy against S. aureus [44,45,46]. Furthermore, the protein and DNA leakages of bacteria treated with 3% v/v NO NE + 0.1% w/v PM were significantly higher than the control. These findings correlate with [34], who noted a large amount of protein and DNA leakages from bacterial cell membranes upon treatment with ultrasound in combination with thyme oil nanoemulsion. Essential oils and their active compounds interact with membrane lipids and disrupt the integrity of the phospholipid bilayer, which leads to a leakage of cytoplasmic content. The increased surface area of nanoemulsions further enhances the penetration, which allows for more effective interactions with bacterial membranes. A direct correlation between compound concentration and cellular membrane destabilization is suggested from the progressive bacterial reduction seen with increasing NO and PM concentrations. The essential oil causes structural damage to the bacterial membrane. [47].
Proximate analysis revealed that 3% v/v NO NE + 0.1% w/v PM treatment maintained pH stability as compared to the control. This formulation could prevent bacterial growth, which supports [48], who demonstrated that cinnamon essential oil nanoemulsion treatment effectively stabilizes pH in Asian seabass (Lates Calcarifer) fillets. The pH stability is crucial for preventing microbial growth and maintaining product quality during storage [49]. The protein content was also maintained when the fillets were treated with 3% v/v NO NE + 0.1% w/v PM, while in the control, a significant product deterioration was recorded. These findings correlate with [50], who reported that the protein content remained stable when chicken patties were treated with clove oil as a natural preservative to improve the shelf-life. Moreover, significantly decreased ash content results from 3% v/v NO NE + 0.1% w/v PM treatment indicate a retention of mineral content similar to previous work carried out by [51], who confirmed that essential oil-based nanoemulsions enhance mineral retention and utilization during the storage of Oncorhynchus aguabonita fillets. Further loss of moisture content was observed in the control, whereas 3% v/v NO NE + 0.1% w/v PM treatment successfully retained a higher moisture level. These findings align with work carried out by [52], where it was revealed that rosemary and olive oil nanoemulsions maintain the moisture content of fish fillets through the formation of a protective barrier. Furthermore, 3% v/v NO NE + 0.1% w/v PM treatment showed a slight decrease in carbohydrate levels, while a significant decrease in the control was noted. These findings are consistent with [53], who concluded that clove essential oil nanoemulsion could prevent carbohydrate breakdown during meat storage and inhibit harmful chemical changes. The current findings extend the understanding of NO NE’s role in maintaining nutritional attributes, which is particularly important for consumer acceptance and marketability.
The results of the TPC highlighted that the control group had visible growth of S. aureus. However, the 3% v/v NO NE + 0.1% w/v PM sample exhibited strong antimicrobial properties, entirely preventing the growth of bacteria. The presence of S. aureus in the control group correlates well with a previous study [54], in which the authors observed the lowest bacterial growth with chitosan + Ferulago angulata oil nanoemulsion treatment and the highest one in the control at the end of the storage period of rainbow trout fillets. The presence of a high bacterial count in the control is associated with poor hygiene and its role as a pathogenic contaminant in fish, which is hazardous to the quality and safety of fish.
Treated O. niloticus fillets were evaluated by a sensory panel. Significant improvements were noted for color, flavor, aroma, juiciness, and tenderness, with the highest scores observed for 3% v/v NO NE + 0.1% w/v PM and the lowest one for the control group. The highest scores of color obtained indicate that nanoemulsions can form a protective barrier that can minimize oxidative discoloration. Chitosan combined with Hyssopus officinalis oil nanoemulsions developed by [55] was found to effectively prevent lipid oxidation and natural color changes during the storage of shrimp (Litopenaeus vannamei). The result of increased flavor indicated less spoilage, and these findings are consistent with [56], who reported that grape and cinnamon essential oil nanoemulsions increase flavor while reducing the proliferation of spoilage bacteria that lead to the development of off flavors in chilled flathead mullet (Mugil cephalus). The enhancement of aroma suggests the inhibition of trimethylamine, similar to [55], who highlighted microbial growth and the formation of malodorous compounds like trimethylamine; these were inhibited due to the treatment of fish with Chitosan + hyssop (Hyssopus officinalis) oil nanoemulsion. It has been shown that nanoemulsions can reduce protein denaturation during storage by stabilizing the biochemical environment of the fish [57]. The improvement observed shows the dual advantages of NO NE of extending shelf life and improving the sensory appeal of preserved fish.

5. Conclusions

This study highlights the capability of NO NE as an effective antimicrobial agent and natural food preservative. The optimized formulations achieved by RSM resulted in a small average particle size, low polydispersity index, and favorable zeta potential, which demonstrated stability and efficacy against S. aureus, particularly when combined with 0.1% w/v PM (potassium metabisulphite). Proximate analysis revealed that NO NE in combination with PM maintained pH stability, reduced protein degradation, and minimized ash accumulation, as well as preserved moisture content during 30 days of storage. Sensory evaluation showed significant improvements in all parameters (flavor, color, juiciness, and overall quality) of O. niloticus fillets, with 3% v/v NO NE + 0.1% w/v PM being the most effective formulation. These results underscore the dual benefits of NO NE to prolong the shelf-life and increase product quality, providing a sustainable, natural alternative to synthetic preservatives. This approach provides promising implications for food safety and quality management in fish preservation. There is additional potential in the development of natural preservatives for foodstuff, like different meats [31], and also applications in the pharma industry, for instance. However, the large-scale production of uniformly sized NE particles could be a challenge, and their commercial application requires regulatory procedures that must be addressed.

Author Contributions

Conceptualization, J.K. and K.J.I.; methodology, A.S.; validation, A.S., K.J.I. and J.K., formal analysis, U.M.; investigation, K.J.I., J.K. and A.S.; data curation, A.S., K.J.I. and J.K.; writing—original draft preparation, J.K., K.J.I. and A.S.; writing—review and editing, J.K.; M.L.; visualization, U.M.; supervision, K.J.I. All authors have read and agreed to the published version of the manuscript.

Funding

Open Access Funding by the University of Applied Sciences Technikum Wien.

Institutional Review Board Statement

The Islamia University of Bahawalpur Ethical Committee has approved the experimental steps involved and the safety of the product for human beings (No. 449/ORIC, Date. 19 December 2024).

Informed Consent Statement

To the sensory panelists Performa, details of the experimental material utilized to produce nanoemulsion dips were provided. The informed consent of all the sensory panelists was collected.

Data Availability Statement

Data will be made available on demand.

Conflicts of Interest

The authors declare that no conflicts of interest exist.

References

  1. Badoni, P.; Nazir, I.; Aier, M.; Maity, P.B.; Samanta, S.; Das, A. Significant Role of Fish Nutrients with Special Emphasis to Essential Fatty Acid in Human Nutrition. Int. J. Curr. Microbiol. Appl. Sci. 2021, 10, 2034–2046. [Google Scholar]
  2. Mishra, S.P.; Pradesh, U. Significance of Fish Nutrients for Human Health. Int. J. Fish. Aquat. Res. 2020, 5, 47–49. [Google Scholar]
  3. El-Sayed, A.M.; Fitzsimmons, K. From Africa to the World—The Journey of Nile Tilapia. Rev. Aquac. 2023, 15, 6–21. [Google Scholar] [CrossRef]
  4. Youssef, A.M.; El-Sayed, H.S.; Islam, E.-N.; El-Sayed, S.M. Preparation and Characterization of Novel Bionanocomposites Based on Garlic Extract for Preserving Fresh Nile Tilapia Fish Fillets. RSC Adv. 2021, 11, 22571–22584. [Google Scholar] [CrossRef]
  5. Sheng, L.; Wang, L. The Microbial Safety of Fish and Fish Products: Recent Advances in Understanding Its Significance, Contamination Sources, and Control Strategies. Comp. Rev. Food Sci. Food Safe 2021, 20, 738–786. [Google Scholar] [CrossRef]
  6. Salama, Y.; Chennaoui, M. Microbial Spoilage Organisms in Seafood Products: Pathogens and Quality Control. Eur. J. Microbiol. Infect Dis. 2024, 1, 66–89. [Google Scholar] [CrossRef]
  7. Zhai, X.; Sun, Y.; Cen, S.; Wang, X.; Zhang, J.; Yang, Z.; Li, Y.; Wang, X.; Zhou, C.; Arslan, M. Anthocyanins-Encapsulated 3D-Printable Bigels: A Colorimetric and Leaching-Resistant Volatile Amines Sensor for Intelligent Food Packaging. Food Hydrocoll. 2022, 133, 107989. [Google Scholar] [CrossRef]
  8. Yang, Z.; Chu, Y.; Zhang, C.; Yan, J.; Xie, J. Changes in the Physicochemical Properties of Grouper (Epinephelus coioides) Fillets Stored under Vacuum Packaging at Chilly Temperature Contributing with the Spoilage Bacteria. Food Biosci. 2023, 55, 103017. [Google Scholar] [CrossRef]
  9. Zhang, J.; Huang, X.; Zhang, J.; Liu, L.; Shi, J.; Muhammad, A.; Zhai, X.; Zou, X.; Xiao, J.; Li, Z. Development of Nanofiber Indicator with High Sensitivity for Pork Preservation and Freshness Monitoring. Food Chem. 2022, 381, 132224. [Google Scholar] [CrossRef]
  10. Sharma, H.; Rajput, R. The Science of Food Preservation: A Comprehensive Review of Synthetic Preservatives. J. Curr. Res. Food Sci. 2023, 4, 25–29. [Google Scholar]
  11. Yewande, O.A.; Esther, F.A.; Ajadi, B.M.; Olowe, A.O. A Review of the Evaluation and Potential Genotoxicity of Sodium Benzoate and Potassium Benzoate as Food Preservatives in Health and Various Applications. Int. J. Innov. Sci. Res. 2024, 74, 212–2182024. [Google Scholar]
  12. Dwivedi, S.; Prajapati, P.; Vyas, N.; Malviya, S.; Kharia, A. A Review on Food Preservation: Methods, Harmful Effects and Better Alternatives. Asian J. Pharm. Pharmacol. 2017, 3, 193–199. [Google Scholar]
  13. Novais, C.; Molina, A.K.; Abreu, R.M.V.; Santo-Buelga, C.; Ferreira, I.C.F.R.; Pereira, C.; Barros, L. Natural Food Colorants and Preservatives: A Review, a Demand, and a Challenge. J. Agric. Food Chem. 2022, 70, 2789–2805. [Google Scholar] [CrossRef]
  14. He, W.-S.; Zhao, L.; Sui, J.; Li, X.; Huang, S.; Ding, H.; Zhu, H.; Chen, Z.-Y. Enzymatic Synthesis of a Novel Antioxidant Octacosanol Lipoate and Its Antioxidant Potency in Sunflower Oil. J. Agric. Food Chem. 2024, 72, 21781–21793. [Google Scholar] [CrossRef]
  15. Al-Maqtari, Q.A.; Rehman, A.; Mahdi, A.A.; Al-Ansi, W.; Wei, M.; Yanyu, Z.; Phyo, H.M.; Galeboe, O.; Yao, W. Application of Essential Oils as Preservatives in Food Systems: Challenges and Future Prospectives—A Review. Phytochem. Rev. 2022, 21, 1209–1246. [Google Scholar] [CrossRef]
  16. Islam, F.; Saeed, F.; Imran, A.; Shehzadi, U.; Ali, R.; Nosheen, F.; Chauhan, A.; Asghar, A.; Ojukwu, M. Bio-Preservatives and Essential Oils as an Alternative to Chemical Preservatives in the Baking Industry: A Concurrent Review. J. Food Sci. Technol. 2024, 61, 609–620. [Google Scholar] [CrossRef]
  17. Zhang, J.; Zhang, J.; Huang, X.; Shi, J.; Muhammad, A.; Zhai, X.; Xiao, J.; Li, Z.; Povey, M.; Zou, X. Study on Cinnamon Essential Oil Release Performance Based on pH-Triggered Dynamic Mechanism of Active Packaging for Meat Preservation. Food Chem. 2023, 400, 134030. [Google Scholar] [CrossRef]
  18. He, W.-S.; Wang, Q.; Zhao, L.; Li, J.; Li, J.; Wei, N.; Chen, G. Nutritional Composition, Health-Promoting Effects, Bioavailability, and Encapsulation of Tree Peony Seed Oil: A Review. Food Funct. 2023, 14, 10265–10285. [Google Scholar] [CrossRef]
  19. Perumal, A.B.; Huang, L.; Nambiar, R.B.; He, Y.; Li, X.; Sellamuthu, P.S. Application of Essential Oils in Packaging Films for the Preservation of Fruits and Vegetables: A Review. Food Chem. 2022, 375, 131810. [Google Scholar] [CrossRef]
  20. Wylie, M.R.; Merrell, D.S. The Antimicrobial Potential of the Neem Tree Azadirachta indica. Front. Pharmacol. 2022, 13, 891535. [Google Scholar] [CrossRef]
  21. Kumar, S.; Singh, N.; Devi, L.S.; Kumar, S.; Kamle, M.; Kumar, P.; Mukherjee, A. Neem Oil and Its Nanoemulsion in Sustainable Food Preservation and Packaging: Current Status and Future Prospects. J. Agric. Food Res. 2022, 7, 100254. [Google Scholar] [CrossRef]
  22. Wasim, A.; Bushra, H.; Rakhi, R.; Ashish, V. Comprehensive Review of the Neem Plant’s Attributes and Applications. Int. J. Res. Dev. Technol. 2023, 1, 1–14. [Google Scholar]
  23. Hai, Y.; Zhou, D.; Lam, Y.L.N.; Li, X.; Chen, G.; Bi, J.; Lou, X.; Chen, L.; Yang, H. Nanoemulsified Clove Essential Oils-Based Edible Coating Controls Pseudomonas Spp.-Causing Spoilage of Tilapia (Oreochromis niloticus) Fillets: Working Mechanism and Bacteria Metabolic Responses. Food Res. Int. 2022, 159, 111594. [Google Scholar] [CrossRef] [PubMed]
  24. Hala, A.; Neven, M.; Omara, E. Assessment the Impact of Green Tea and Rosemary Nanoemulsion on the Shelf Life of Fish Fillets. Anim. Health Res. J. 2019, 7, 68–80. [Google Scholar]
  25. Bai, J.; Li, J.; Chen, Z.; Bai, X.; Yang, Z.; Wang, Z.; Yang, Y. Antibacterial Activity and Mechanism of Clove Essential Oil against Foodborne Pathogens. LWT 2023, 173, 114249. [Google Scholar] [CrossRef]
  26. Singh, I.R.; Pulikkal, A.K. Nano Emulsions Stabilized by Natural Emulsifiers: A Comprehensive Review on Feasibility, Stability and Bio-Applicability. J. Drug Deliv. Sci. Technol. 2023, 92, 105303. [Google Scholar] [CrossRef]
  27. Jiang, H.; Lin, H.; Lin, J.; Adade, S.Y.-S.S.; Chen, Q.; Xue, Z.; Chan, C. Non-Destructive Detection of Multi-Component Heavy Metals in Corn Oil Using Nano-Modified Colorimetric Sensor Combined with near-Infrared Spectroscopy. Food Control 2022, 133, 108640. [Google Scholar] [CrossRef]
  28. Majeed, H.; Liu, F.; Hategekimana, J.; Sharif, H.R.; Qi, J.; Ali, B.; Bian, Y.-Y.; Ma, J.; Yokoyama, W.; Zhong, F. Bactericidal Action Mechanism of Negatively Charged Food Grade Clove Oil Nanoemulsions. Food Chem. 2016, 197, 75–83. [Google Scholar] [CrossRef]
  29. Majeed, U.; Majeed, H.; Liu, X.; Shafi, A.; Liu, T.; Ye, J.; Meng, Q.; Luo, Y. Succinylated Starch Emulsified Eugenol and Carvacrol Nanoemulsions Improved Digestive Stability, Bio-Accessibility and Salmonella typhimurium Inhibition. Int. J. Biol. Macromol. 2024, 259, 129230. [Google Scholar] [CrossRef]
  30. Majeed, H.; Antoniou, J.; Shoemaker, C.F.; Fang, Z. Action Mechanism of Small and Large Molecule Surfactant-Based Clove Oil Nanoemulsions against Food-Borne Pathogens and Real-Time Detection of Their Subpopulations. Arch. Microbiol. 2015, 197, 35–45. [Google Scholar] [CrossRef]
  31. Jabbar, M.; Baboo, I.; Majeed, H.; Farooq, Z.; Palangi, V.; Lackner, M. Preparation and Characterization of Cumin Essential Oil Nanoemulsion (CEONE) as an Antibacterial Agent and Growth Promoter in Broilers: A Study on Efficacy, Safety, and Health Impact. Animals 2024, 14, 2860. [Google Scholar] [CrossRef] [PubMed]
  32. Shehabeldine, A.M.; Doghish, A.S.; El-Dakroury, W.A.; Hassanin, M.M.; Al-Askar, A.A.; AbdElgawad, H.; Hashem, A.H. Antimicrobial, Antibiofilm, and Anticancer Activities of Syzygium aromaticum Essential Oil Nanoemulsion. Molecules 2023, 28, 5812. [Google Scholar] [CrossRef] [PubMed]
  33. Alzohairy, M.A. Therapeutics Role of Azadirachta Indica (Neem) and Their Active Constituents in Diseases Prevention and Treatment. Evid. Based Complement. Altern. Med. 2016, 2016, 7382506. [Google Scholar] [CrossRef] [PubMed]
  34. He, Q.; Zhang, L.; Song, L.; Zhang, X.; Liu, D.; Hu, Y.; Guo, M. Inactivation of Staphylococcus aureus Using Ultrasound in Combination with Thyme Essential Oil Nanoemulsions and Its Synergistic Mechanism. LWT 2021, 147, 111574. [Google Scholar] [CrossRef]
  35. Khairy, N.; Karmi, M.; Maky, M.A. Proximate Composition Analysis of Beef Sausage. Aswan Univ. J. Environ. Stud. 2021, 2, 155–161. [Google Scholar]
  36. Nikolaeva, T.N.; Lapshin, P.V.; Zagoskina, N.V. Method for Determining the Total Content of Phenolic Compounds in Plant Extracts with Folin–Denis Reagent and Folin–Ciocalteu Reagent: Modification and Comparison. Russ. J. Bioorg. Chem. 2022, 48, 1519–1525. [Google Scholar] [CrossRef]
  37. Ji, X.; Cheng, Y.; Tian, J.; Zhang, S.; Jing, Y.; Shi, M. Structural Characterization of Polysaccharide from Jujube (Ziziphus jujuba Mill.) Fruit. Chem. Biol. Technol. Agric. 2021, 8, 54. [Google Scholar] [CrossRef]
  38. Kusumah, N.A.F.; Widjiati, W.; Puspitasari, Y.; Tyasningsih, W.; Wardhana, D.; Permatasari, D.A.; Luqman, E.M. Comparison of Total Number of Bacteria in Raw Milk Friesian Holstein Cow Based on Milking Techniques Using Total Plate Count (TPC) Test. Int. J. Sci. Adv. 2023, 4, 1–7. [Google Scholar] [CrossRef]
  39. Zhai, X.; Wang, X.; Zhang, J.; Yang, Z.; Sun, Y.; Li, Z.; Huang, X.; Holmes, M.; Gong, Y.; Povey, M. Extruded Low Density Polyethylene-Curcumin Film: A Hydrophobic Ammonia Sensor for Intelligent Food Packaging. Food Packag. Shelf Life 2020, 26, 100595. [Google Scholar] [CrossRef]
  40. Saavedra, A.R.; Rios-Mera, J.D.; Imán, A.; Vásquez, J.; Saldana, E.; Siche, R.; Tello, F. A Sequential Approach to Reduce Sodium Chloride in Freshwater Fish Burgers Considering Chemical, Texture, and Consumer Sensory Responses. LWT 2022, 167, 113854. [Google Scholar] [CrossRef]
  41. Safaya, M.; Rotliwala, Y. Neem Oil Based Nano-Emulsion Formulation by Low Energy Phase Inversion Composition Method: Characterization and Antimicrobial Activity. Mater. Today Proc. 2022, 57, 1793–1797. [Google Scholar] [CrossRef]
  42. Rashid, A.; Qayum, A.; Liang, Q.; Kang, L.; Raza, H.; Chi, Z.; Chi, R.; Ren, X.; Ma, H. Preparation and Characterization of Ultrasound-Assisted Essential Oil-Loaded Nanoemulsions Stimulated Pullulan-Based Bioactive Film for Strawberry Fruit Preservation. Food Chem. 2023, 422, 136254. [Google Scholar] [CrossRef] [PubMed]
  43. Jordán, M.J.; Lax, V.; Rota, M.C.; Lorán, S.; Sotomayor, J.A. Effect of Bioclimatic Area on the Essential Oil Composition and Antibacterial Activity of Rosmarinus officinalis L. Food Control. 2013, 30, 463–468. [Google Scholar] [CrossRef]
  44. Ekhtelat, M.; Khalili Borujeni, F.; Siahpoosh, A.; Ameri, A. Chemical Composition and Antibacterial Effects of Some Essential Oils Individually and in Combination with Sodium Benzoate against Methicillin-Resistant Staphylococcus aureus and Yersinia enterocolitica. In Proceedings of the Veterinary Research Forum; Faculty of Veterinary Medicine, Urmia University: Urmia, Iran, 2020; Volume 11, p. 333. [Google Scholar]
  45. Katiyar, R.; Khare, E.; Kaistha, S.D. Concentration Dependent Effect of Azadirachta Indica (Neem) Seed Oil and Neem Bark Extract on Planktonic and Established Biofilm Growth of Pseudomonas aeruginosa and Staphylococcus aureus. J. Pure Appl. Microbiol. 2023, 17, 1669–1678. [Google Scholar] [CrossRef]
  46. Ali, H.A.; Hussin, Z.S.; Taaban, S.K.; Hamad, M.T.; Jasem, A.A.-R.D. Study the effect of oil extracts of moringa, rosemary and neem plants on some pathogenic bacteria. Plant Cell Biotechnol. Mol. Biol. 2021, 22, 56–63. [Google Scholar]
  47. Garcia, C.R.; Malik, M.H.; Biswas, S.; Tam, V.H.; Rumbaugh, K.P.; Li, W.; Liu, X. Nanoemulsion Delivery Systems for Enhanced Efficacy of Antimicrobials and Essential Oils. Biomater. Sci. 2022, 10, 633–653. [Google Scholar] [CrossRef]
  48. Chuesiang, P.; Sanguandeekul, R.; Siripatrawan, U. Enhancing Effect of Nanoemulsion on Antimicrobial Activity of Cinnamon Essential Oil against Foodborne Pathogens in Refrigerated Asian Seabass (Lates calcarifer) Fillets. Food Control 2021, 122, 107782. [Google Scholar] [CrossRef]
  49. Rolfe, C.; Daryaei, H. Intrinsic and Extrinsic Factors Affecting Microbial Growth in Food Systems. In Food Safety Engineering; Demirci, A., Feng, H., Krishnamurthy, K., Eds.; Food Engineering Series; Springer International Publishing: Cham, Switzerland, 2020; pp. 3–24. ISBN 978-3-030-42659-0. [Google Scholar]
  50. Pinto, L.A.D.M.; Razente, R.A.; Benito, C.E.; Gubert, L.; Stefanello, L.R.; Simões, E.P.; Júnior, R.C.D.S.; Monteschio, J.D.O.; Fernandes, J.I.M. Clove Essential Oil (Syzygium aromaticum L.) as a Natural Preservative to Improve the Shelf-life of Chicken Patties with Different Degrees of Myopathy. Food Process. Preserv. 2022, 46, e17037. [Google Scholar] [CrossRef]
  51. Hassanpour, M.; Partovi, R.; Shahavi, M. Shelf Life Extension of Oncorhynchus aguabonita Fillets Based on Trachyspermum copticum Essential Oil Nanoemulsion Coating during Storage at 4° C. Ank. Üniversitesi Vet. Fakültesi Derg. 2024, 71, 171–182. [Google Scholar] [CrossRef]
  52. Khan, Z.; Yasmeen, R.; Shafique, H.; Shahbaz, S. Antioxidant Activity of Rosemary Oil and Olive Oil and Its Impact on the Shelf Life of Fish Fillets. BioScientific Rev. 2024, 6, 122–132. [Google Scholar] [CrossRef]
  53. Das, J.K.; Chatterjee, N.; Nanda, P.K.; Das, A.; Nath, S.; Pal, S.; Dhar, P.; Bandyopadhyay, S.; Verma, A.K.; Sen, A.; et al. Encapsulation and Delivery of Clove Essential Oil Using Nanoemulsions: Impact on the Physicochemical, Microbial, and Sensory Properties of Chicken Meatballs. Food Biophys. 2024, 19, 701–716. [Google Scholar] [CrossRef]
  54. Shokri, S.; Parastouei, K.; Taghdir, M.; Abbaszadeh, S. Application an Edible Active Coating Based on Chitosan-Ferulago Angulata Essential Oil Nanoemulsion to Shelf Life Extension of Rainbow Trout Fillets Stored at 4 C. Int. J. Biol. Macromol. 2020, 153, 846–854. [Google Scholar] [CrossRef] [PubMed]
  55. Mehraie, A.; Khanzadi, S.; Hashemi, M.; Azizzadeh, M. New Coating Containing Chitosan and Hyssopus Officinalis Essential Oil (Emulsion and Nanoemulsion) to Protect Shrimp (Litopenaeus vannamei) against Chemical, Microbial and Sensory Changes. Food Chem. X 2023, 19, 100801. [Google Scholar] [CrossRef] [PubMed]
  56. Ameur, A.; Bensid, A.; Ozogul, F.; Ucar, Y.; Durmus, M.; Kulawik, P.; Boudjenah-Haroun, S. Application of Oil-in-water Nanoemulsions Based on Grape and Cinnamon Essential Oils for Shelf-life Extension of Chilled Flathead Mullet Fillets. J. Sci. Food Agric. 2022, 102, 105–112. [Google Scholar] [CrossRef]
  57. Aboutorab, M.; Ahari, H.; Allahyaribeik, S.; Yousefi, S.; Motalebi, A. Nano-emulsion of Saffron Essential Oil by Spontaneous Emulsification and Ultrasonic Homogenization Extend the Shelf Life of Shrimp (Crocus Sativus L.). J. Food Process. Preserv. 2021, 45, e15224. [Google Scholar] [CrossRef]
Figure 1. (a) NO (mL) versus Tween80 concentration (g); (b) Sonication interval (min) versus Tween80 concentration (g); (c) sonication interval (min) versus NO (%); (d) NO (mL) versus Tween80 (g); (e) sonication interval (min) versus NO (%); (f) Sonication interval (min) versus Tween80 concentration (g); (g) NO (%) versus Tween80 concentration (w/v); (h) Sonication interval (min) versus Tween80 concentration (g); (i) sonication interval (min) versus NO (%).
Biology 14 00400 g001
Figure 2. Transmission electron microscopy (TEM) image of NO NE (A) and Zeta Potential (B).
Biology 14 00400 g002
Figure 3. Gas chromatogram of NO NE compounds after ultrasonication. X-axis: retention time in min; Y-axis: detector signal (arbitrary units).
Biology 14 00400 g003
Figure 4. Time–kill plot for neem oil nanoemulsion (NO NE) and neem oil nanoemulsion + potassium metabisulphite (NO+PM) against S. aureus.
Biology 14 00400 g004
Figure 5. Protein and DNA leakage of S. aureus caused by exposure to neem oil nanoemulsion + potassium metabisulphite (NO + PM) and NO NE.
Biology 14 00400 g005
Figure 6. (A) S. aureus growth in the (untreated) control sample of O. niloticus fillet (B) No bacterial growth in the sample of O. niloticus treated with 3% v/v NO NE + 0.1% w/v PM. Diameter of the dishes: 90 mm.
Biology 14 00400 g006
Figure 7. Sensory evaluation of O. niloticus fillets: control, NO NE, and NO:PM-treated fillets.
Biology 14 00400 g007
Table 1. The variation of Tween 80 concentration (TW80), NO, and sonication interval on the particle size, PDI, and zeta potential of NO NE.
Factor 1Factor 2Factor 3Response 1Response 2Response 3
RunA: TW80B: Neem OilC: Sonication IntervalSizePDIZeta Potential
(g)(ml)(min)(nm)(1)(mV)
121515204.1 ± 0.010.21 ± 0.0414.3 ± 0.07
231020166 ± 0.150.13 ± 0.0117.5 ± 0.01
32.51015160.2 ± 0.040.11 ± 0.0212.3 ± 0.05
431010220 ± 0.180.21 ± 0.0514.2 ± 0.09
521020183.2 ± 0.090.18 ± 0.0716.4 ± 0.1
621010201.2 ± 0.030.2 ± 0.0418.2 ± 0.09
73515164.2 ± 0.10.13 ± 0.0216.9 ± 0.11
82.5520167.3 ± 0.010.12 ± 0.0317.3 ± 0.04
92.51015163.1 ± 0.030.11 ± 0.0712.1 ± 0.01
1031515162.3 ± 0.080.1 ± 0.0517.8 ± 0.06
112515169.3 ± 0.010.12 ± 0.0317.4 ± 0.05
122.51520163.2 ± 0.040.11 ± 0.0117.8 ± 0.06
132.51510187.2 ± 0.110.19 ± 0.1116 ± 0.02
142.5510194.3 ± 0.070.21 ± 0.0515.9 ± 0.07
Table 2. Active compounds present in NO NE with their retention time and peak area.
Compound NameCAS No.Retention Time (min)Peak Area (au)
Nimbiol561-95-522.69115,540
6 deacetyl nimbin18609-16-024.29100,704
6-deacetyl nimbinene 26.91114,381
9,12,15-Octadecatrienoic acid
(alpha-linolenic acid)
463-40-127.13113,306
Azadirachtin11141-17-627.46116,666
Nimbandiol78916-53-74.331319
Table 3. MIC of NO NE and PM against S. aureus.
Antibacterial ComponentMinimum Inhibitory Concentration (MIC)
3% v/v NO NE and 0.1% w/v PM210 ppm
1% v/v NO NE50 ppm
3% v/v NO NE150 ppm
3% PM180 ppm
0.1% PM60 ppm
Table 4. Proximate analysis of Oreochromis niloticus fillets after 30 days of dip coating treatments with NO NE.
GroupspH
(0 Day)
pH
(30 Day)
Protein %
(0 Day)
Protein % (30 Day)Ash % (0 Day)Ash % (30 Day)Moisture % (0 Day)Moisture % (30 Day)Carbohydrate % (0 Day)Carbohydrate % (30 Day)
3% v/v NO NE6.80 ± 0.436.35 ± 0.4940 ± 0.837 ± 60.25 ± 0.341.1 ± 0.258.35 ± 0.488.32 ± 0.421.20 ± 0.041.15 ± 0.07
3% v/v NO NE + 0.1% w/v PM6.80 ± 0.436.65 ± 0.4240 ± 0.838 ± 70.25 ± 0.341.06 ± 0.208.35 ± 0.488.23 ± 0.321.20 ± 0.041.19 ± 0.07
0.1% w/v PM6.80 ± 0.436.35 ± 0.3540 ± 0.835 ± 60.25 ± 0.341.13 ± 0.328.35 ± 0.488.20 ± 0.261.20 ± 0.041.15 ± 0.08
Control6.80 ± 0.435.50 ± 0.3840 ± 0.831 ± 60.25 ± 0.341.31 ± 0.428.35 ± 0.488.12 ± 0.081.20 ± 0.041.05 ± 0.08
Disclaimer/Publisher’s Note: The statements, opinions and data contained in all publications are solely those of the individual author(s) and contributor(s) and not of MDPI and/or the editor(s). MDPI and/or the editor(s) disclaim responsibility for any injury to people or property resulting from any ideas, methods, instructions or products referred to in the content.

