1. Introduction
System designers need to incorporate better reliability information in early concept design because reliability significantly impacts program performance, cost, and schedule estimates [
1]. Our literature search found a research gap in this area. This research develops an approach to use early life cycle reliability analysis to assess performance, cost, and schedule in an integrated framework of models in early concept design. We illustrate the method by performing a trade-off analysis using conceptual design decisions for unmanned ground vehicles (UGV). A UGV design tradespace is generated to assess the feasibility, performance, and cost of design concepts with the early system design’s reliability model. The resulting tradespace comparison of with and without early reliability assessment illustrates that early reliability modeling can identify designs that have the potential to be feasible and cost-effective.
This paper is organized as follows: The paper begins with a literature review focused on the use of reliability modeling in early system design. Next, a discussion of integrated models for trade-off analysis and how to include reliability in them during early system design using a UGV as an example. We then discuss our reliability modeling approach and illustrate how to integrate it into our trade-off analysis framework. Next, we analyze the results of analysis with and without reliability modeling. Finally, we conclude with a summary of our results and discussion of future research opportunities.
2. Literature Review
The need for system reliability modeling and analysis in early conceptual design has increased as system developers try to reduce the development time of complex technologies. The literature review focused on models for the analysis of the reliability of complex systems in early conceptual design to understand existing approaches and identify opportunities for additional research. We used the Web of Science [
2] core collection to find relevant papers. We used this database due to its trusted sources of high-quality journals that include systems reliability. Our original literature search [
3] was updated in [
4]. This paper adds 50 additional references and updates the literature search description.
2.1. Literature Review Methodology
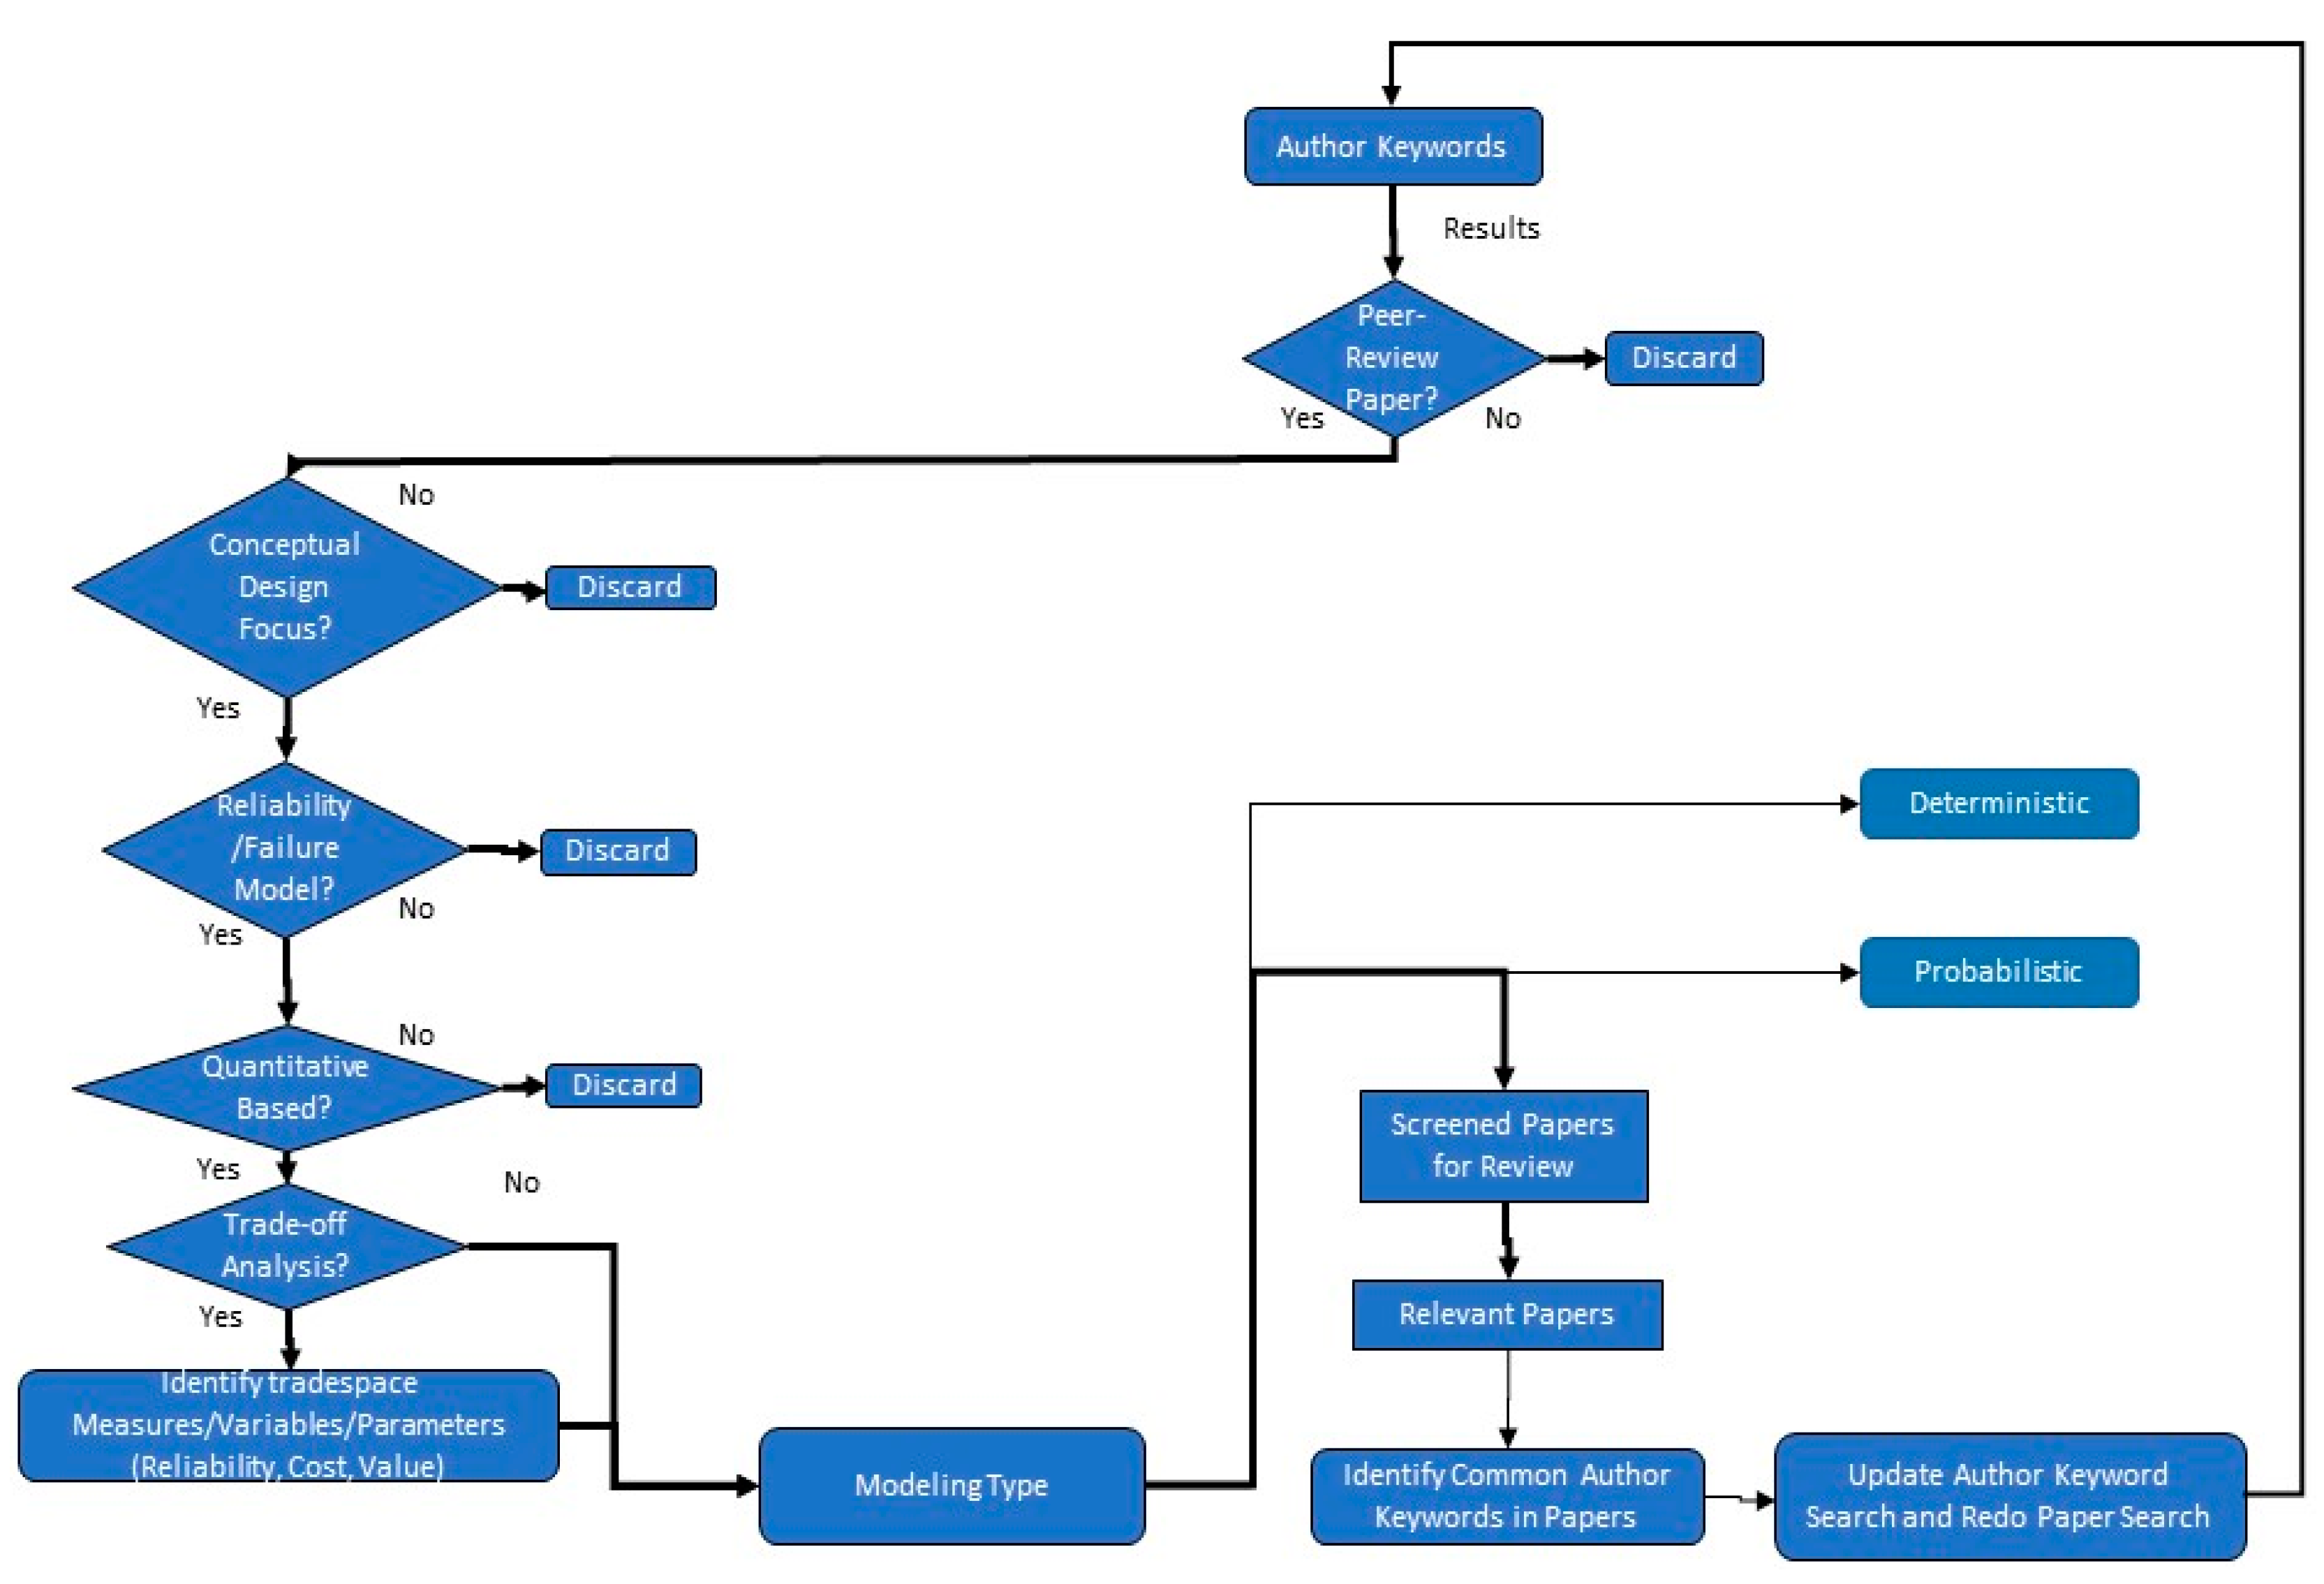
This section presents our literature review methodology. We used a systematic approach to discovering the literature relevant to the topic of interest. The literature review process was tailored to find relevant papers, shown in
Figure 1. We first developed keywords and then identified research questions to identify the most appropriate paper for our research.
Is the paper peer reviewed?
Is reliability described in conceptual design?
Does the paper have a reliability/failure model?
Do they quantitatively estimate reliability in early system design?
Do they assess the impact of reliability on system performance, cost, and schedule trade-off analysis?
For the selected papers with models, we also categorized the type of models used.
2.2. Literature Review Screening Process
To screen for the most relevant papers, we identified keyword words to search abstracts, author keywords, and titles to find relevant papers (
Table 1). The initial keywords returned papers from a broad range of sources not focused directly on our research topic.
We revised the keywords (as shown in
Table 2) to search for papers more aligned with our research questions.
Table 2 shows the keyword sets and the number of papers returned for each search iteration. After iterating through single and multiple combinations of keywords, the number of papers was reduced to a manageable 62 papers instead of a few thousand papers previously. Then, sets were combined to find a unique set of papers and eliminate duplicates. After this step, we found 50 unique papers to potentially review.
Table 2 shows the keyword sets and the number of papers returned for each search iteration. As shown in the table, all sets were not included in the final analysis. After iterating through single and multiple combinations of keywords, the number of papers was reduced to a manageable 62 papers instead of a few thousand papers previously. Then, sets were combined to find a unique set of papers and eliminate duplicates. After this step, we found 50 unique papers to potentially review. We assume that all papers were peer reviewed given that they were published in a Web of Science indexed journal.
Our next step of the literature review process was to screen each paper for their relation to conceptual design, reliability, and quantitative modeling. This process is shown in
Figure 2 with the number of papers maintained and discarded at each step.
We included papers that focused their work on the conceptual design phase. We found 15 papers of interest and removed 35 papers [
5,
6,
7,
8,
9,
10,
11,
12,
13,
14,
15,
16,
17,
18,
19,
20,
21,
22,
23,
24,
25,
26,
27,
28,
29,
30,
31,
32,
33,
34,
35,
36,
37,
38,
39]. One example of a disregarded paper is found in Hayashi et al. [
37]. They specifically state their investigation of atmosphere detritylation system design is in conceptual design, but they explicitly use components and failure rates. The use of components indicates the design is further in the design life cycle than conceptual design. Stone et al. [
5] uses a knowledge base-driven failure analysis tool called function-failure design method. This method relies on a knowledge center that connects desired functions to previous components that performs them. This use of components adds information but limits the design space. It also limits the use of the method to problems in conceptual design with previous components. We disregarded this paper for its use of components. Huang and Jin [
40] provide an example of working in conceptual design. They provide quantitative techniques but focus on functions instead of components. They explicitly state and demonstrate that their work fits modeling reliability in the conceptual design phase.
After filtering our unique papers by conceptual design focused papers, we reviewed the remaining 15 papers for their relation to reliability. This resulted in us keeping 7 papers and discarding 8 papers [
41,
42,
43,
44,
45,
46,
47,
48]. Examples of discarded papers include Arlitt et al. [
44] which provides product designers tools to assess environmental impact of functional selections and Echavarría et al. [
42] which uses functional redundancy in conceptual design but states quantifying the effects on reliability as future work. Kurtoglu et al. [
49] introduces a methodology to determine functional failures in early design and is one of the 7 papers included in our study.
We reviewed the remaining 7 papers to identify the papers that contained quantitative techniques.
Our detailed paper reviews focused on 7 quantitative-based papers that are reliability-related or use functional analyses of systems in early conceptual design. The next section focuses on the review of these papers.
2.3. Literature Review Summary of the Relevant Papers
Kurtoglu and Tumer [
50] introduced a new framework called the function-failure identification and propagation framework to allow designers to analyze the functional structure of a system concept in the early stages of design. Using high-level models, a graph-based and simulation-based approach allowed designers to understand how functions could fail and how the failure propagates throughout the system. This framework allowed designers to assess the impact of a potential failure or failure path in the system early before making costly system decisions.
Kurtoglu et al. [
49] used a functional failure methodology for informed decision-making in the early conceptual design of complex systems. A simulation-based tool was used to develop a framework, enabling system architecture analysis in the early design stages. This work extended the efforts of Kurtoglu and Tumer [
50], which introduced the Functional Failure Identification and Propagation (FFIP) analysis framework. The FFIP enables the analysis of functional failures and the impact made in early system design. The authors extended the FFIP framework to a new framework called the Functional Failure Reasoning (FFR) framework. This framework represents failure as a functional element of the system not performing its designed task. FFR framework allows analyzing multiple design alternatives in different scenarios to assess the impact of functional failures propagating throughout the system, as well as allowing the assessment of risk and the reduction in risk between design alternatives. The noticeable difference from Kurtoglu and Tumer [
50] is that this paper assessed multiple concepts instead of a single concept.
Short et al. [
51] developed the failure flow decision function (FFDF) methodology to enable designers to model failure flow decision-making problems. The authors used the failure flow of information and failure propagation methodology to improve system survivability while aiding decision-making. The difference in this paper is the methodology sacrificed non-critical subsystems and protected the functions and flow of information that enable the system to complete its primary objective. When applied to specific system designs, this framework can assess critical subsystems to inform decision-making. A case study in this paper is the Mars Exploration Rover (MER) platform. The FFDF framework was shown to effectively improve the survivability of the Rover by designing the system where the function is redirected to a different subsystem to reduce critical failures.
Jing et al. [
52] assessed the impact of failure propagation and the interaction of multiple failure modes in an integrated risk value model. The authors produced a risk-based decision model to assess risk quantitatively using functional modeling. They generated a functional/graph-based model, assessing the severity of failure propagation by calculating the score of a potential design alternative and a risk value of a failure mode for conceptual design analysis.
Tumer and Smidts [
53] also used the FFIP framework from Kurtoglu and Tumer [
49] to assess propagation of hardware, software, and hardware/software failures. This paper addressed how to evaluate the behavior of a combined software/hardware system. A focus was on software and hardware interaction that could lead to significant and costly failures.
Augustine et al. [
54] proposed a failure analysis technique to assess reliability issues in early design stages. Their approach was focused on higher-level interactions of subsystems rather than detailed component-level analysis. They used cognitive maps for system modeling and use of simulation for failure analysis. This technique was used with various failure modes along with interaction failures.
Huang and Jin [
40] proposes a method they called a Conceptual Stress and Conceptual Strength Interference Theory, which uses stress and strength interference theory to create a probabilistic reliability modeling method to use during conceptual design. It assesses, through simulation, how the selection and arrangement of functions impact overall system reliability. This method trade-offs probability of failure with their factor of safety, which measures strength of the system.
The papers focused on assessing reliability or functional failure early in conceptual design. Although there are various approaches researchers have taken or extended upon, there are missing elements for the research questions that are not addressed within these papers. When analyzing complex systems in the early life cycle, it is essential to look at different perspectives that impact decisions.
Throughout the literature review, only a few papers addressed the impact of reliability or failure analysis on performance, cost, or schedule. Kurtoglu et al. [
49] mentioned future work assessing trade-offs between the cost of the analysis vs. the benefits for more complex systems but did not mention the additional elements of trade-off analysis. Jing et al. [
52] assessed cost, performance, and benefit, but decisions did not have cascading effects. These papers focused on failure propagation analysis in conceptual design, but there is an opportunity to integrate these methods with performance, cost, and schedule modeling.
There are seven quantitative reliability papers. A significant literature gap, indicated by the intersection of the three circles in the Venn diagram shown in
Figure 3, demonstrates a gap in quantitative early life cycle reliability model papers that incorporate reliability models in integrated performance, cost, and schedule models in the early life cycle design. This work aims to fill this gap.
3. Integrated Models for Trade-Off Analysis
Integrated models enable designers, engineers, and analysts to identify key attributes and their relationships between stakeholder needs/requirements and performance indicators. For our research, we want to include reliability models in integrated models of performance, life cycle cost, and schedule of system alternatives, which are in turn can be used for trade-off analysis to inform design decisions. Reliability is included in performance measures using the mission chain and in the life cycle cost model using projected operational usage and the impact of reliability on life cycle cost elements [
55]. This section describes our process for creating integrated models and how to include reliability in them during early system design.
3.1. Influence Diagram for Integrated Models
We developed an influence diagram (
Figure 4) [
56] to capture the relationships between stakeholder needs, requirements, system alternatives, technology/manufacturing/integration readiness, stakeholder objectives, models, and simulations used for reliability and system performance modeling in the integrated trade-off analysis.
Figure 4 shows predictive models in green and prescriptive models in orange. In the diagram, we indicate if the information is a known constant, a decision, an uncertainty, a calculated uncertainty, or a value node. The diamond shape represents known information; the rectangle represents decisions; the single oval represents uncertainties; the double oval represents calculated uncertainties; and the hexagon shape represents the values for the decision. We use direct acyclic graphs to indicate the flow of information. The time is shown at the bottom of the figure to understand the relative order of the nodes.
Figure 4 begins with stakeholder needs, under the assumption that those needs are known. Stakeholder needs inform decisions about system-level requirements. Decisions are made about the potential system alternatives to meet the requirements. The technology readiness levels (TRL), material readiness levels (MRL), and integration readiness levels (IRL) depend on the system alternatives. Requirements lead to decisions about objectives, system performance measures, and models and simulation. Models and simulations calculate the system reliability and system performance of the system alternatives. The system reliability and readiness levels are used to calculate the life cycle cost and the schedule of the system alternatives. Objectives and requirements inform value functions. The performance and value functions determine the value of the system alternatives using an additive multiple objective value model (
Section 4.3). Integrated trade-off analysis is used to assess the value, cost, and schedule trade-offs of system alternatives.
3.2. Assessment Flow Diagram for Integrated Models
We created an assessment flow diagram (AFD) [
57], shown in
Figure 5, to illustrate the flow of information and the models used to calculate performance measures and the life cycle cost for a UGV concept design. The AFD starts with system design decisions such as mobility, power source, and sensor technology capabilities. Design and operational decisions are inputs to the models shown in the model-based calculations section, which determine the system alternatives’ performance measures and life cycle cost. The color-coding in
Figure 5 describes the current modeling progress. In the legend, the blue color represents future additions to the UGV model not implemented in this illustrative case study. The yellow color indicates the use of lower fidelity models. The green color indicates the use of higher fidelity models.
UGV notional objectives include maximizing transportability, survivability in operational environments, probability of enemy detection, and mission endurance. Performance measures are developed for each objective and include total vehicle weight, mission range, probability of detection, and endurance. The impact of design decisions on reliability, performance, and life cycle cost are displayed in
Figure 5.
4. Reliability, Life Cycle Cost, and Multiple-Objective Value Models
As mentioned earlier, our work focuses on developing an integrated framework of reliability, performance, cost, and value models to assess the feasibility and evaluate design concepts. Our influence diagram and assessment flow diagram begin with system design decisions, such as the mobility platform, power source, and sensor types. Calculations of the system’s reliability, performance measures, life cycle cost, and multiple-objective value are used to evaluate the design tradespace and perform trade-off analysis of the design decisions.
4.1. Reliability Modeling
Reliability is the probability that a component or system will perform its required function for a given time when used under stated operating conditions [
58]. In this research, reliability is the probability that a component or system will satisfy a given function(s) over time, in which functional performance conditions on the current state of other interrelated functions. These definitions are the same theoretically, but there is an emphasis that the failure of a component or system is dependent on the current state of other system components. Although calculations can vary depending on the method chosen for analysis, the underlying structural analysis for reliability is the same.
There are two basic structures for system configuration when analyzing the reliability of a system: series and parallel. These two structures can be combined to create a series-parallel structure. The equations for a series and parallel structure are in Equations (1) and (2), respectively. This study uses the exponential life distribution to model the reliability of the critical components for the UGV (Equation (3)). An assumption is that failure is dependent on the function, represented by the failure rate,
, where “
i” denotes the function. The failure rate for the system is critical to calculating the number of systems required for the operations concept and the life cycle cost.
Our research involves the prediction of reliability in the conceptual design stages of system development. Our approach for reliability analysis uses notional data and functional analysis to assess the reliability of a chosen design concept. The functional analysis defined the system functions that are used system alternatives.
Table 3 is a list of UGV functions and their functional relationships. The term “functional relationship” refers to functional dependencies, but due to the circular relationship of the functions, dependency is not the term used. For example, Function 8.0 depends on either function 9.0, 10.0, 11.0, 12.0 or 13.0. However, all those functions could depend on function 8.0. The interesting factor here is that we look at these functions as relationships instead of acyclic dependencies. These functions are ways of showing the flow of information. A visualization of the functions is shown in
Figure 6.
In our analysis, we use technology readiness levels that impact system designs to represent the assumed minimum, baseline, and maximum possible values for reliability for a given system component.
Table 4 represents the structure of functions, reliability, and the three levels of TRL used for indexing. These three levels were used to support our subsequent Monte Carlo analysis, which shows the impact the TRL uncertainty has on the system performance and costs.
As mentioned before, reliability data in conceptual design can be hard to obtain. Therefore, this functional analysis approach is adapted to work with technology readiness levels to indicate the potential reliability of a high-level function. This approach allows analysis of the relationships between functions and how they impact performance, value, and cost in our Excel model implementation. The Excel index function is used for three readiness levels (low, median, and high) assumed for a given system component. The system reliability is then calculated based on the system’s functional structure using Equations (1) and (2). If a function depends on all functional relationships, it is indicated by AND logic. If it only depends on a minimum of one function, it is indicated by OR logic in the functional relationships table. The following equation is used to turn the logic into a reliability estimate based on the functional relationships. To indicate the best-case scenario of non-failure, the framework takes the maximum reliability value of the functional relationships.
For example, function 3.0 depends on F1.0 or F2.0. Shown below is the method of calculating the reliability estimate.
4.2. Life Cycle Cost Model
Life cycle cost assesses all relevant costs from conceptual design, detailed design, development, production, deployment, operations, and retirement of a product or system; it is the total cost of ownership [
58]. Our focus was integrating reliability into the life cycle cost model to make the best system design decisions early in the life cycle. A cost analysis can be defined in many ways; this research uses the cost analysis structure from Ebeling [
58]. From this structure, we calculate life cycle cost (LLC) using Equations (4) and (5). Life cycle cost categories in
Table 5 and the notional inputs in
Table 6 were used.
4.2.1. Acquisition Costs
Acquisition cost includes research and development, design and prototyping, and production costs. Fixed costs were used for each design decision. In this approach, only need the cost per unit for acquisition cost (Cu) and the total number of units (N) to produce, shown in Equation (6).
4.2.2. Operations and Support Costs
Operations and support (O&S) costs include operating, failure, support, training, and technical data costs. In this paper, we consider the first three cost categories. For operating costs, the methodology includes a fixed cost of operating (F
o) upfront and an additional annual operating cost in present-day dollars over the design life. Present-day dollars (P
A) are calculated with a discount rate, where the discount rate is the difference between the assumed return on investment and the inflation rate. We assumed this is a constant over the system life. Equation (7) represents the operating costs.
Failure costs include the present worth of annual failure cost over the design life and the expected number of failures per year. This research addresses the failure cost of a design rather than focusing on the cost of improving reliability. Focusing just on this section allowed us to show how reliability impacts life cycle costs by isolating the failure costs. Equation (8) shows the failure cost calculation we used in our model.
Support is necessary for this system to ensure operational readiness and effectiveness for a complex unmanned system. Support costs include fixed and annual support costs over the design life in present-day dollars. Notional data was used for support cost over the set design life. Equation (9) summarizes the support costs calculation for the system.
4.2.3. System Requirement Costs
When a system is retired, the net salvage value represents the system’s anticipated salvage value minus the disposal costs. Our research does not incorporate this cost, but the cost should be integrated into later stages of development. Equation (10) shows the calculation for the salvage value.
This section addressed the critical points of life cycle cost: acquisition, operations, failure, and support costs. The focus of the cost model was to integrate reliability in a meaningful way to aid in system design decision-making. An important note is that all cost elements may not apply for some system concepts.
4.3. Multiple-Objective Decision Analysis Value Model
An important element of the tradespace is the value of a design alternative. Multiple objective decision analysis (MODA) quantitatively assesses the trade-offs between conflicting objectives by evaluating an alternative’s contribution to the performance measures and the importance of each performance measure [
59]. The MODA model is used to assess the alternative’s value using the objectives and performance measures (
Table 7). The overall MODA value is shown vs. life cycle cost to define a value vs. cost tradespace.
The first step in trade-off analysis is to identify the feasible tradespace. A feasible design meets all the system requirements, i.e., the performance levels that receives 0 value on each value function. Performance models are used to assess feasibility before displaying the feasible tradespace, i.e., we use a sensor detection model to determine the probability of detecting enemy activity. We then multiply the reliability times the probability of detection. If one or more requirements are not met, the model excludes the infeasible design from the tradespace.
To ensure we capture the importance of a performance measure, we use swing weights in the additive value function to calculate the total value of an alternative [
60]. The model definition is in
Table 8, defining the elements of the additive model [
59]. Shown in Equation (11) is the additive value model. Equation (12) is another equation associated with the model to satisfy the normalization of swing weights. The additive value model is used to assess alternatives and assign a value to all feasible alternatives. Value curves are shown in
Figure 7. The
x-axis indicates the level of the performance measure, and the y-axis is the score converted into a value.
5. Trade-Off Analysis Results
In this section we provide the results of our illustrative UGV trade-off analysis integrating a reliability model with performance, value, and life cycle cost models. Our integrated models index three TRLs and calculate an alternative’s reliability, value, and cost for each level. We used integrated parametric models shown in
Appendix A. The output is a tradespace that displays the trade-offs between alternative reliability, value, cost for given alternative system designs. We provide both deterministic and probabilistic analysis.
5.1. Deterministic Analysis of Integrated Models with Reliability
We compared the deterministic analysis vs. uncertainty analysis of TRL levels. According to [
61] the purpose of TRL is to “measure the maturity of technology components for a system. This measurement allows personnel to understand the progress on developing technology before being utilized.” For deterministic analysis, each function was indexed by the TRL level. The integrated framework could then calculate reliability, value, and cost for the 3 TRL levels. Below are the results of the deterministic analysis.
The first results are from a deterministic analysis shown in
Figure 8. We have a design space of 3 point designs. The blue point represents TRL 5 design, the orange represents TRL 6 design, and the green represents a TRL 7-9 design. The chart shows the impact of reliability on the life cycle cost. When a system has very low reliability, the life cycle cost is much higher due to higher maintenance, repair, and failure costs.
Figure 9 shows the impact of reliability on the value of a system design. This figure clearly shows that reliability impacts the performance of a design alternative which impacts the value of the alternative. Another important takeaway is that there is diminishing returns on value as reliability increases.
Figure 10 displays the deterministic analysis with integrated reliability for alternative value vs. life cycle cost. Reliability (driven by TRL) has a significant impact on cost and value for low TRL.
5.2. Incorporating Uncertainty in the Integrated Models
Next, we incorporated uncertainty into our models with Monte Carlo Simulation. Uncertainty was modeled as a distribution of TRL values that cause reliability, performance, value, and cost to be uncertain. The method we used to create the uncertain TRLs was the SIPmath tool from ProbabilityManagement.org [
62]. According to Probability Management, “probability management is the representation of uncertainties as data arrays called Stochastic Information Packets (SIPs) that obey the laws of arithmetic and the laws of probability.” SIPmath is an Excel-based add-in that allows an analyst to conduct a Monte Carlo Simulation on the index value (TRL, in our case). To do this, a distribution was assigned to TRL for each system function. We used a discrete-uniform distribution to select the index values. A triangular distribution was used to define the range of TRL values with minimum, likely, and maximum values [
4]. The index values for each function were defined as an “Input” for the modeler tool. Once selected, the SIPmath modeler tool simulated the index value for a set number of trials and automatically stores user-defined information. The reliability cells were defined as “output.”
It is important to understand how we modeled the uncertainty range for TRL 5, TRL 6, and TRL 7-9 for each function. For TRL 5, the range was [0.67, 0.75], TRL 6 was [0.75, 0.85], and TRL 7-9 was [0.85, 0.99]. After all the function TRLs were simulated, all the outputs (reliability, value, and cost) were calculated. The output values are colored to reflect infeasible, TRL 5, TRL 6, and TRL 7-9. It is also important to note that all displays have the same number of infeasible designs. In some cases, the points may overlap.
Figure 11 displays system reliability vs. life cycle cost, and we can see that the points with TRL 7-9 range have higher reliability and significantly lower costs than the infeasible points show in purple. The infeasible points are the designs that did not meet the minimum performance requirement. Reliability has a significant impact on LCC.
Figure 12 displays the reliability vs. alternative value for the simulated designs. Value is more sensitive to the lower TRL designs. The lower TRL designs have a potential to be infeasible.
Figure 13 shows the alternative LCC versus value. The LCC is very sensitive to TRL. The infeasible designs have the highest LCC. The infeasible and TRL 5 designs have more impact on LCC than the TRL 6 or TRL 7-9.
6. Discussion
Our literature search identified a gap for reliability modeling in early system concept design. The purpose of this research was to explore incorporating reliability into the trade-off analysis of early concept designs. This research developed an illustrative trade-off analysis for a UGV using notional data and integrated reliability, performance, value, and LCC models. We have several potential findings from this research.
For new technology systems (with low TRLs), deterministic analysis may significantly overestimate reliability, performance, and value and underestimate life cycle costs.
Integrated models for reliability, performance, value, and cost can help system decision makers assess the impact of uncertainty in early system concepts.
When reliability is included in the performance measures with a mission chain, many system alternatives may be infeasible, i.e., they may not meet the system requirements. Identifying the infeasible designs early can help select higher value and lower cost system concepts.
The impact of low TRL systems on performance, value and LCC can be significant.
Using the illustrative example, we can quantify the potential impact of modeling reliability in early system design and estimating LCC using Monte Carlo Simulation. The current approach to reliability is to establish a reliability requirement in concept design, assess reliability during test and evaluation, and then use a reliability growth program to attempt to meet the original reliability requirement. This approach leads to an increase in development costs and can lead to an increase in operations and support costs if the reliability growth program cannot meet the original reliability requirement. Using our illustrative example, we can compare the deterministic LCC with the Monte Carlo LCC’s for different levels of uncertainty of design options represented by TRLs. For the worst case (TRL 5), the deterministic LCC was estimated at about
$123M. Per
Figure 11, our Monte Carlo simulation LCC for TRL 5 can be up to
$138M with many of the potential designs not meeting the reliability requirements. Thus, formally incorporating reliability as early as possible in conceptual design allows system engineers to consider a more robust set of designs and make more informed trade-offs.
This study only used one system and notional data. These findings need to be validated with multiple systems and real data.
7. Conclusions
We believe that this research provides an illustrative example for a notional UGV system that demonstrates that reliability can be incorporated in early life cycle trade-off analyses and has the potential to provide important insights about the tradespace that could be missed in early concept design. This research generated a tradespace by enumerating all combinations of design decisions using functional TRLs and the SIPmath tool. The analysis is promising for continued work on reliability modeling methods early in the system life cycle.
8. Future Research
Areas for future research include more systems, better data, and higher fidelity modeling. We spent time researching notional data and simple parametric models, and that information could be replaced with better data and higher fidelity models. Other models such as system availability should be considered in future work. Additionally, implementing learning curves for the cost model could improve estimation performance over the design life as well.
Future research should construct higher fidelity models for reliability, performance, and cost. This is just a starting point on the methods that could be applied in early conceptual design. Other methods, depending on the information readily available, could include Bayesian Networks for estimating the impact of reliability with conditional probabilities, simulation modeling for time-based failure analysis of functions, and Monte Carlo simulation with higher fidelity parametric models that impact the functional analysis method.
Author Contributions
Conceptualization, S.R.G. and R.K.B.; software, T.B.; validation, G.S.P., E.P., E.S., S.R.G. and R.K.B.; formal analysis, T.B., G.S.P. and E.P.; data curation, T.B.; writing—original draft preparation, T.B.; writing—review and editing, G.S.P., E.S. and E.P.; visualization, T.B.; supervision, G.S.P. and E.P.; project administration, G.S.P.; funding acquisition, S.R.G. and R.K.B. All authors have read and agreed to the published version of the manuscript.
Funding
This research was funded by the Engineer Research and Development Center in Vicksburg, MS. Grant number was D8162-S3.
Institutional Review Board Statement
Not applicable.
Informed Consent Statement
Not applicable.
Data Availability Statement
Data can be obtained from the lead author.
Acknowledgments
We acknowledge the reviewer comments that improved the clarity and number of references in the paper.
Conflicts of Interest
The authors declare no conflict of interest.
Appendix A
This appendix includes the parametric model calculations that were not embedded within the body of the work. Parametric models for value and cost are included within the body of the work. Below are parametric equations that impact performance and lead to the value measures. Some of the parametric models are static (input value), and others are based on the outcome of another model. Calculations include system horsepower, power source weight, suspension weight, mobility platform weight, powerpack/drivetrain, hull weight, miles per gallon (MPG), UGV mission range, UGV endurance, and probability of detection.
System HP =
Power Source Weight =
Suspension Weight =
Mobility Platform Weight =
PowerPack/DriveTrain Weight =
Hull Weight =
MPG Calculation =
Mission Range Calculation =
Endurance calculation =
Probability of Detection =
References
- Department of Defense Instruction. DoDI 5000.02, Operation of the Defense Acquisition System; Department of Defense: Washington, DC, USA, 2015. [Google Scholar]
- Trusted Publisher-Independent Citation Database—Web of Science Group. Available online: https://clarivate.com/webofsciencegroup/solutions/web-of-science/ (accessed on 6 July 2021).
- Barker, T.; Parnell, G.S.; Pohl, E. Integrating Reliability in Conceptual Design Trade-Off Analysis: A look at the Literature. In Proceedings of the Conference on Systems Engineering Research, CSER 2022, Virtual Conference, 24–26 March 2022. [Google Scholar]
- Barker, T.J. The Impact of Reliability in Conceptual Design—An Integrated Trade-off Analysis. Master’s Thesis, University of Arkansas, Fayetteville, AR, USA, 2022. [Google Scholar]
- Stone, R.B.; Tumer, I.Y.; Stock, M.E. Linking Product Functionality to Historic Failures to Improve Failure Analysis in Design. Res. Eng. Des. 2005, 16, 96–108. [Google Scholar] [CrossRef]
- Irshad, L.; Demirel, H.O.; Tumer, I.Y. Automated Generation of Fault Scenarios to Assess Potential Human Errors and Functional Failures in Early Design Stages. J. Comput. Inf. Sci. Eng. 2020, 20, 051009. [Google Scholar] [CrossRef]
- Zhao, M.; Chen, Y.; Chen, L.; Xie, Y. A State–Behavior–Function Model for Functional Modeling of Multi-State Systems. Proc. Inst. Mech. Eng. C J. Mech. Eng. Sci. 2019, 233, 2302–2317. [Google Scholar] [CrossRef]
- Diao, X.; Zhao, Y.; Pietrykowski, M.; Wang, Z.; Bragg-Sitton, S.; Smidts, C. Fault Propagation and Effects Analysis for Designing an Online Monitoring System for the Secondary Loop of the Nuclear Power Plant Portion of a Hybrid Energy System. Nucl. Technol. 2018, 202, 106–123. [Google Scholar] [CrossRef]
- Goel, A.K. A 30-Year Case Study and 15 Principles: Implications of an Artificial Intelligence Methodology for Functional Modeling. Artif. Intell. Eng. Des. Anal. Manuf. 2013, 27, 203–215. [Google Scholar] [CrossRef] [Green Version]
- Kimita, K.; Sakao, T.; Shimomura, Y. A Failure Analysis Method for Designing Highly Reliable Product-Service Systems. Res. Eng. Des. 2018, 29, 143–160. [Google Scholar] [CrossRef] [Green Version]
- Zhang, W.Y.; Tor, S.B.; Britton, G.A. A Graph and Matrix Representation Scheme for Functional Design of Mechanical Products. Int. J. Adv. Manuf. 2005, 25, 221–232. [Google Scholar] [CrossRef]
- Castagnetti, D.; Bertacchini, A.; Spaggiari, A.; Lesnjanin, A.; Larcher, L.; Dragoni, E.; Arduini, M. A Novel Ball Joint Wear Sensor for Low-Cost Structural Health Monitoring of off-Highway Vehicles. Mech. Ind. 2015, 16, 507. [Google Scholar] [CrossRef]
- Eisenbart, B.; Gericke, K.; Blessing, L. An Analysis of Functional Modeling Approaches across Disciplines. Artif. Intell. Eng. Des. Anal. Manuf. 2013, 27, 281–289. [Google Scholar] [CrossRef]
- Duarte, D.; Marado, B.; Nogueira, J.; Serrano, B.; Infante, V.; Moleiro, F. An Overview on How Failure Analysis Contributes to Flight Safety in the Portuguese Air Force. Eng. Fail. Anal. 2016, 65, 86–101. [Google Scholar] [CrossRef]
- Kärger, L.; Kling, A. As-Built FE Simulation of Advanced Fibre Placement Structures Based on Manufacturing Data. Compos. Struct. 2013, 100, 104–112. [Google Scholar] [CrossRef]
- Abbott, D.; Lough, K.G. Component-Function Templates to Aid Engineering Design Education. Int. J. Eng. Educ. 2010, 26, 68–86. [Google Scholar]
- Kumar, M.S.; Krishnan, A.S.; Vijayanandh, R. Computational, experimental and surface characterisation of glass fibre reinforced plastic composite for wind turbine blade application. J. Environ. Prot. Ecol. 2021, 22, 602–616. [Google Scholar]
- Deng, Y.-M.; Britton, G.A.; Tor, S.B. Constraint-Based Functional Design Verification for Conceptual Design. Comput. Aided Des. 2000, 32, 889–899. [Google Scholar] [CrossRef]
- Shen, M.; Zheng, L.-R.; Tenhunen, H. Cost and Performance Analysis for Mixed-Signal System Implementation: System-on-Chip or System-on-Package? EEE Trans. Compon. Packag. Manuf. 2002, 25, 262–272. [Google Scholar] [CrossRef]
- Sinha, S.; Kumar Goyal, N.; Mall, R. Early Prediction of Reliability and Availability of Combined Hardware-Software Systems Based on Functional Failures. J. Syst. Archit. 2019, 92, 23–38. [Google Scholar] [CrossRef]
- Zhang, W.Y.; Tor, S.B.; Britton, G.A.; Deng, Y.-M. EFDEX: A Knowledge-Based Expert System for Functional Design of Engineering Systems. Eng. Comput. 2001, 17, 339–353. [Google Scholar] [CrossRef]
- Xu, Y.; Wang, D.; Wang, J.; Wang, J.; Hu, L.; Yang, Z. Fault Diagnosis of HCCB TES for ITER Based on Functional Modeling. J. Fusion Energy 2015, 34, 1489–1496. [Google Scholar] [CrossRef]
- WILHELMS, S. Function- and Constraint-Based Conceptual Design Support Using Easily Exchangeable, Reusable Principle Solution Elements. Artif. Intell. Eng. Des. Anal. Manuf. 2005, 19, 201–219. [Google Scholar] [CrossRef]
- Zadnik, Z.; Karakasic, M.; Kljajin, M.; Duhovnik, J. Function and Functionality in the Conceptual Design Process. Stroj. Vestn. J. Mech. Eng. 2009, 55, 455–471. [Google Scholar]
- Prabhakar, S.; Goel, A.K. Functional Modeling for Enabling Adaptive Design of Devices for New Environments. Artif. Intell. Eng. 1998, 12, 417–444. [Google Scholar] [CrossRef]
- Gui, J.-K.; Mäntylä, M. Functional Understanding of Assembly Modelling. Comput. Aided Des. 1994, 26, 435–451. [Google Scholar] [CrossRef]
- Krus, D.; Grantham Lough, K. Function-Based Failure Propagation for Conceptual Design. Artif. Intell. Eng. Des. Anal. Manuf. 2009, 23, 409–426. [Google Scholar] [CrossRef]
- Hoyle, C.; Tumer, I.Y.; Mehr, A.F.; Chen, W. Health Management Allocation During Conceptual System Design. J. Comput. Inf. Sci. Eng. 2009, 9, 021002. [Google Scholar] [CrossRef]
- Zhuo, L.; Yoke San, W.; Kim Seng, L. Integrated Approach to Modularize the Conceptual Product Family Architecture. Int. J. Adv. Manuf. 2008, 36, 83–96. [Google Scholar] [CrossRef]
- Pinna, T.; Carloni, D.; Carpignano, A.; Ciattaglia, S.; Johnston, J.; Porfiri, M.T.; Savoldi, L.; Taylor, N.; Sobrero, G.; Uggenti, A.C.; et al. Identification of Accident Sequences for the DEMO Plant. Fusion Eng. Des. 2017, 124, 1277–1280. [Google Scholar] [CrossRef]
- Zhang, W.Y.; Tor, S.Y.; Britton, G.A. Managing Modularity in Product Family Design with Functional Modeling. Int. J. Adv. Manuf. 2006, 30, 579–588. [Google Scholar] [CrossRef]
- Sangelkar, S.; McAdams, D.A. Mining Functional Model Graphs to Find Product Design Heuristics with Inclusive Design Illustration. J. Comput. Inf. Sci. Eng. 2013, 13, 041008. [Google Scholar] [CrossRef]
- Zadnik, Z.; Cok, V.; Duhovnik, J.; Karakasic, M.; Kljajin, M. Modularity Solutions within a Matrix of Function and Functionality, (MFF). Teh. Vjesn. Tech. Gaz. 2011, 18, 471–478. [Google Scholar]
- Giurgiutiu, V.; Zagrai, A.; Jing Bao, J. Piezoelectric Wafer Embedded Active Sensors for Aging Aircraft Structural Health Monitoring. Struct. Health Monit. 2002, 1, 41–61. [Google Scholar] [CrossRef]
- Cao, D.; Fu, M.W. Port-Based Ontology Modeling to Support Product Conceptualization. Robot. Comput. Integr. Manuf. 2011, 27, 646–656. [Google Scholar] [CrossRef]
- Karakasic, M.; Zadnik, Z.; Kljajin, M.; Duhovnik, J. Product Function Matrix and Its Request Model. Strojarstvo 2009, 51, 293–301. [Google Scholar]
- Hayashi, T.; Iwai, Y.; Kobayashi, K.; Nakamura, H.; Yamanishi, T.; Perevezentsev, A. R&D of Atmosphere Detritiation System for ITER in JAEA. Fusion Eng. Des. 2010, 85, 1386–1390. [Google Scholar] [CrossRef]
- Gödecke, H.-J.; Viedenz, U.; Gödecke, J.-H. Flachgründung Einer 400-KV-Schaltanlage Am Kaspischen Meer. Bautechnik 2012, 89, 653–657. [Google Scholar] [CrossRef]
- Martinez, E.C. Systems Thinking and Functional Modeling of Batch Process Management Using Projects. Comput. Chem. Eng. 2000, 24, 1657–1663. [Google Scholar] [CrossRef]
- Huang, Z.; Jin, Y. Extension of Stress and Strength Interference Theory for Conceptual Design-for-Reliability. J. Mech. Des. 2009, 131, 071001. [Google Scholar] [CrossRef]
- Cao, Y.; Liu, Y.; Ye, X.; Zhao, J.; Gao, S. Software-Physical Synergetic Design Methodology of Mechatronic Systems Based on Formal Functional Models. Res. Eng. Des. 2020, 31, 235–255. [Google Scholar] [CrossRef]
- Echavarría, E.; Bussel, G.J.W.; Tomiyama, T. Finding Functional Redundancies in Offshore Wind Turbine Design. Wind Energy 2012, 15, 609–626. [Google Scholar] [CrossRef]
- Murphy, A.R.; Ingram, H.E.; Nelson, J.T.; Bohm, M.R.; Linsey, J.S.; Nagel, R.L. An Update to a Functional Modeling Scoring Rubric with Overall and Question-Level Inter-Rater Reliability. J. Mech. Des. 2019, 141, 084501. [Google Scholar] [CrossRef]
- Arlitt, R.; van Bossuyt, D.L.; Stone, R.B.; Tumer, I.Y. The Function-Based Design for Sustainability Method. J. Mech. Des. 2017, 139, 041102. [Google Scholar] [CrossRef]
- Chakrabarti, A.; Bligh, T.P. An Approach to Functional Synthesis of Solutions in Mechanical Conceptual Design. Part I: Introduction and Knowledge Representation. Res. Eng. Des. 1994, 6, 127–141. [Google Scholar] [CrossRef]
- Nagel, R.L.; Midha, P.A.; Tinsley, A.; Stone, R.B.; McAdams, D.A.; Shu, L.H. Exploring the Use of Functional Models in Biomimetic Conceptual Design. J. Mech. Des. 2008, 130, 121102. [Google Scholar] [CrossRef] [Green Version]
- Stone, R.B.; Tumer, I.Y.; van Wie, M. The Function-Failure Design Method. J. Mech. Des. 2005, 127, 397–407. [Google Scholar] [CrossRef]
- Ullmann, T.A.; Scalice, R.K. A Unified Method for Functional Modeling of Mechatronic Products. J. Eng. Des. 2021, 32, 115–139. [Google Scholar] [CrossRef]
- Kurtoglu, T.; Tumer, I.Y.; Jensen, D.C. A Functional Failure Reasoning Methodology for Evaluation of Conceptual System Architectures. Res. Eng. Des. 2010, 21, 209–234. [Google Scholar] [CrossRef]
- Kurtoglu, T.; Tumer, I.Y. A Graph-Based Fault Identification and Propagation Framework for Functional Design of Complex Systems. J. Mech. Des. 2008, 130, 051401. [Google Scholar] [CrossRef]
- Short, A.-R.; Lai, A.D.; van Bossuyt, D.L. Conceptual Design of Sacrificial Sub-Systems: Failure Flow Decision Functions. Res. Eng. Des. 2018, 29, 23–38. [Google Scholar] [CrossRef]
- Jing, L.; Xu, Q.; Sun, T.; Peng, X.; Li, J.; Gao, F.; Jiang, S. Conceptual Scheme Decision Model for Mechatronic Products Driven by Risk of Function Failure Propagation. Sustainability 2020, 12, 7134. [Google Scholar] [CrossRef]
- Tumer, I.; Smidts, C. Integrated Design-Stage Failure Analysis of Software-Driven Hardware Systems. IEEE Trans. Comput. 2011, 60, 1072–1084. [Google Scholar] [CrossRef]
- Augustine, M.; Yadav, O.P.; Jain, R.; Rathore, A. Cognitive Map-Based System Modeling for Identifying Interaction Failure Modes. Res. Eng. Des. 2012, 23, 105–124. [Google Scholar] [CrossRef]
- Specking, E.; Cottam, B.; Parnell, G.; Pohl, E.; Cilli, M.; Buchanan, R.; Wade, Z.; Small, C. Assessing Engineering Resilience for Systems with Multiple Performance Measures. Risk Anal. 2019, 39, 1899–1912. [Google Scholar] [CrossRef] [PubMed]
- Howard, R.A.; Matheson, J.E. Influence Diagrams. Decis. Anal. 2005, 2, 127–143. [Google Scholar] [CrossRef]
- Cilli, M.; Parnell, G.S. Understanding Decision Management. In Trade-Off Analytics; Parnell, G.S., Ed.; Wiley: Hoboken, NJ, USA, 2017; pp. 180–181. [Google Scholar]
- Ebeling, C.E. An Introduction to Reliability and Maintainability Engineering; Waveland: Long Grove, IL, USA, 2010. [Google Scholar]
- Parnell, G.S.; Johnson, E.R.; Tani, S.N. Handbook of Decision Analysis; John Wiley & Sons: Hoboken, NJ, USA, 2013. [Google Scholar]
- Kirkwood, C. Strategic Multiple Objective Decision Analysis with Spreadsheets; Duxbury Press: Belmont, CA, USA, 1997. [Google Scholar]
- Technology Readiness Level (TRL)—AcqNotes. Available online: https://acqnotes.com/acqnote/tasks/technology-readiness-level (accessed on 17 January 2022).
- SIPmath Standards—Probability Management. Available online: https://www.probabilitymanagement.org/sipmath (accessed on 19 December 2021).
Figure 1.
Literature Review Process.
Figure 1.
Literature Review Process.
Figure 2.
Reducing Literature Review Papers.
Figure 2.
Reducing Literature Review Papers.
Figure 3.
Literature Research Gap.
Figure 3.
Literature Research Gap.
Figure 4.
Unmanned Ground Vehicle Influence Diagram with Integrated Models.
Figure 4.
Unmanned Ground Vehicle Influence Diagram with Integrated Models.
Figure 5.
Assessment Flow Diagram for Integrated Models.
Figure 5.
Assessment Flow Diagram for Integrated Models.
Figure 6.
Functional Analysis Graph.
Figure 6.
Functional Analysis Graph.
Figure 7.
Value Curves for a Notional UGV System.
Figure 7.
Value Curves for a Notional UGV System.
Figure 8.
Reliability vs. Deterministic Life Cycle Cost.
Figure 8.
Reliability vs. Deterministic Life Cycle Cost.
Figure 9.
Reliability vs. Deterministic Alternative Value.
Figure 9.
Reliability vs. Deterministic Alternative Value.
Figure 10.
Alternative Value vs. Alternative Life-Cycle Cost.
Figure 10.
Alternative Value vs. Alternative Life-Cycle Cost.
Figure 11.
Monte Carlo Simulation Reliability vs. Life Cycle Cost.
Figure 11.
Monte Carlo Simulation Reliability vs. Life Cycle Cost.
Figure 12.
Monte Carlo Simulation Reliability vs. Alternative Value.
Figure 12.
Monte Carlo Simulation Reliability vs. Alternative Value.
Figure 13.
Monte Carlo Simulation Alternative Life Cycle vs. Value.
Figure 13.
Monte Carlo Simulation Alternative Life Cycle vs. Value.
Table 1.
Literature review keyword/phrases.
Table 1.
Literature review keyword/phrases.
| Initial Keyword/Phrases | Updated Keyword/Phrases |
|---|
| Conceptual design, early life cycle, reliability design, failure propagation, functional failure | Failure propagation, functional modeling, failure modeling, failure flow decision-making, conceptual design, functional failure, failure analysis, failure prevention |
Table 2.
Updated keywords/phrases results.
Table 2.
Updated keywords/phrases results.
| Screening Sequence | Keyword | Number of Papers | Duplicates |
|---|
| Not Used | “Failure Analysis” | 15,266 | - |
| Not Used | “Failure Prevention” | 772 | - |
| Not Used | “Functional Failure” | 613 | - |
| Not Used | “Functional Modeling” | 420 | - |
| Not Used | “Failure Propagation” | 391 | - |
| Not Used | “Failure Modeling” | 234 | - |
| Not Used | “Failure Flow Decision-Making” | 1 | - |
| | Total Used | - | - |
| 1 | “Functional Modeling” AND “Conceptual Design” | 30 | - |
| 2 | “Failure Analysis” AND “Conceptual Design” | 17 | 6 |
| 3 | “Functional Failure” AND “Conceptual Design” | 7 | 2 |
| 4 | “Failure Propagation” AND “Conceptual Design” | 4 | 1 |
| 5 | “Failure Prevention” AND “Conceptual Design” | 2 | 1 |
| 6 | “Failure Flow Decision-Making” AND “Conceptual Design” | 1 | 1 |
| 7 | “Failure Modeling” AND “Conceptual Design” | 1 | 1 |
| | Total Used | 62 | 12 |
Table 3.
Functional Analysis Relationships.
Table 3.
Functional Analysis Relationships.
| Function | Functional Relationships |
|---|
| Function 1.0 | - |
| Function 2.0 | F1.0 |
| Function 3.0 | OR {F1.0, F2.0} |
| Function 4.0 | F3.0 |
| Function 5.0 | F4.0 |
| Function 6.0 | F5.0, F7.0 |
| Function 7.0 | F3.0 AND F8.0 AND (OR {F10.0, F11.0, F12.0, F13.0}) |
| Function 8.0 | OR {F9.0, F10.0, F11.0, F12.0, F13.0} |
| Function 9.0 | F8.0 |
| Function 10.0 | F8.0 |
| Function 11.0 | F8.0 |
| Function 12.0 | F8.0 |
| Function 13.0 | F8.0 |
Table 4.
Structure of Technology Readiness Level (TRL), Reliability, and Design Decisions.
Table 4.
Structure of Technology Readiness Level (TRL), Reliability, and Design Decisions.
| Function | Reliability | Index |
|---|
| 1 | 2 | 3 |
|---|
| TRL 5 | TRL 6 | TRL 7-9 |
|---|
| F1.0 | Index {1,2,3} | 0.7 | 0.8 | 0.97 |
| F2.0 | Index {1,2,3} | 0.7 | 0.8 | 0.97 |
| F3.0 | Index {1,2,3} | 0.7 | 0.8 | 0.97 |
| F4.0 | Index {1,2,3} | 0.7 | 0.8 | 0.97 |
| F5.0 | Index {1,2,3} | 0.7 | 0.8 | 0.97 |
| F6.0 | Index {1,2,3} | 0.7 | 0.8 | 0.97 |
| F7.0 | Index {1,2,3} | 0.9 | 0.95 | 0.99 |
| F8.0 | Index {1,2,3} | 0.9 | 0.95 | 0.99 |
| F9.0 | Index {1,2,3} | 0.9 | 0.95 | 0.99 |
| F10.0 | Index {1,2,3} | 0.9 | 0.95 | 0.99 |
| F11.0 | Index {1,2,3} | 0.7 | 0.9 | 0.99 |
| F12.0 | Index {1,2,3} | 0.8 | 0.9 | 0.99 |
| F13.0 | Index {1,2,3} | 0.8 | 0.9 | 0.99 |
Table 5.
Life Cycle Cost (LCC) Categories Used for UGV Cost Analysis.
Table 5.
Life Cycle Cost (LCC) Categories Used for UGV Cost Analysis.
| Acquisition | Operations and Support Costs | Phase-Out (Retirement) |
|---|
| Research and Development | Operations | Salvage Value |
| Design and Prototyping | Support | Disposal Costs |
| Production | Failure Costs | |
| | Training | |
| | Technical Data | |
Table 6.
Life Cycle Cost Inputs.
Table 6.
Life Cycle Cost Inputs.
| Cost Model Inputs |
|---|
| Cu | Unit Acquisition Cost |
| N | Number Of identical units to produce |
| Fo | Fixed cost of operating |
| Co | Annual operating cost per unit |
| Fs | Fixed Support Cost |
| Cs | Annual support cost per unit |
| Cf | Cost per failure |
| to | Operating hours per year per unit |
| td | Design life (years) |
| S | Unit salvage value |
| i | Discount rate |
| PA (i, td) | Present Day Worth over design life |
| MTTF | Mean time to failure |
Table 7.
MODA Model Objectives and Performance Measures.
Table 7.
MODA Model Objectives and Performance Measures.
| Function | Objectives | Performance Measures |
|---|
| Transport UGV | Minimize UGV Transport Weight | UGV Weight (lbs.) |
| Survive in War Environment | Maximize Survivability in Operational Environment | UGV Mission Range (miles) |
| Detect Enemy Activity | Maximize Probability of Detection of Enemy Activity | Probability of Detection |
| Detect Enemy Activity | Maximize Endurance | Endurance (hours) |
Table 8.
Additive Value Model Definition.
Table 8.
Additive Value Model Definition.
| Value Model Definitions |
|---|
| x | Vector of the alternative scores |
| v(x) | Alternative’s value of x |
| i | 1 ton is the index of the value measure |
| The alternative’s score of the ith value measure |
| Single-dimensional value of an x-axis score of |
| The swing weight of the ith value measure |
| Publisher’s Note: MDPI stays neutral with regard to jurisdictional claims in published maps and institutional affiliations. |
© 2022 by the authors. Licensee MDPI, Basel, Switzerland. This article is an open access article distributed under the terms and conditions of the Creative Commons Attribution (CC BY) license (https://creativecommons.org/licenses/by/4.0/).

 ,
, 


