
A Systematic Literature Review of the Blood Supply Chain through Bibliometric Analysis and Taxonomy


Abstract
:1. Introduction
- This study fills the gap of the last three years, which has not yet been systematically reviewed in the BSC literature.
- This study is the first scientometric review of the BSC that is able to exclude irrelevant articles from the BSC.
- The classified 262 articles are almost twice the number of articles considered by Osorio et al. [2], which is the most comprehensive systematic review of the BSC up to date.
- To the best of the authors’ knowledge, there is no other study containing both taxonomy and bibliometric and network analysis on the BSC field as conducted in this study.
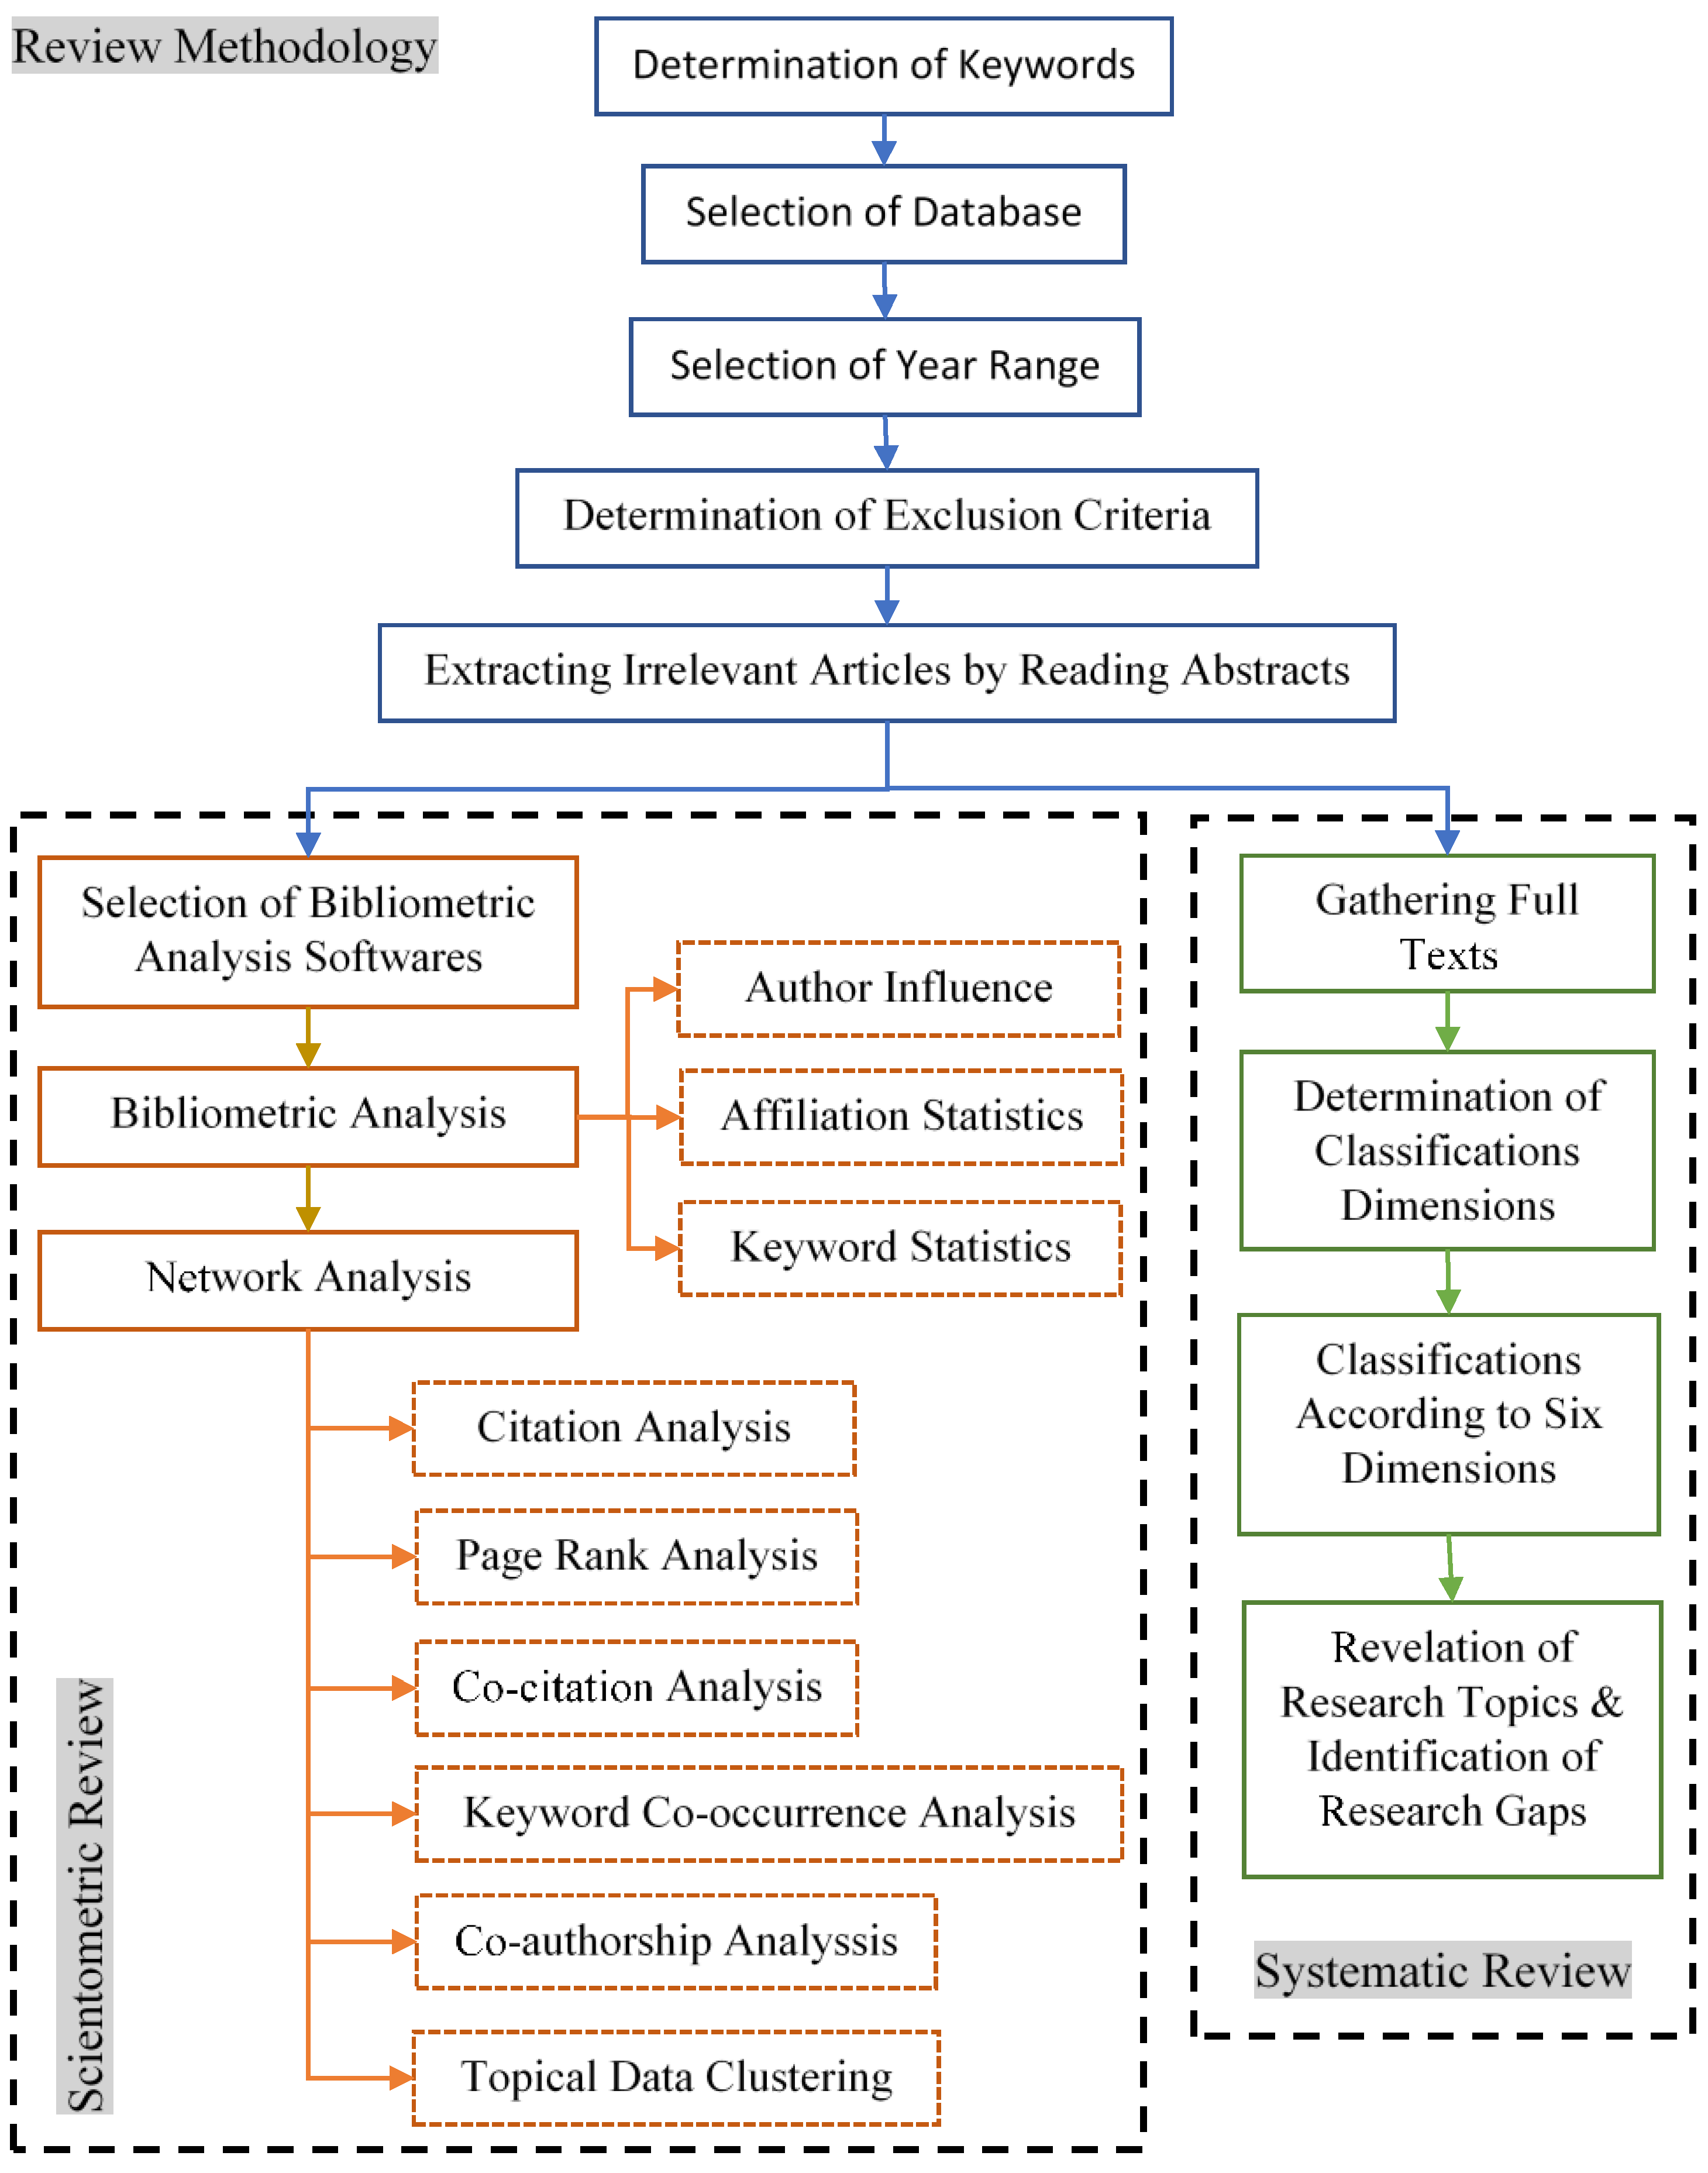
2. Research Methodology and Data Statistics
2.1. Defining Appropriate Keywords
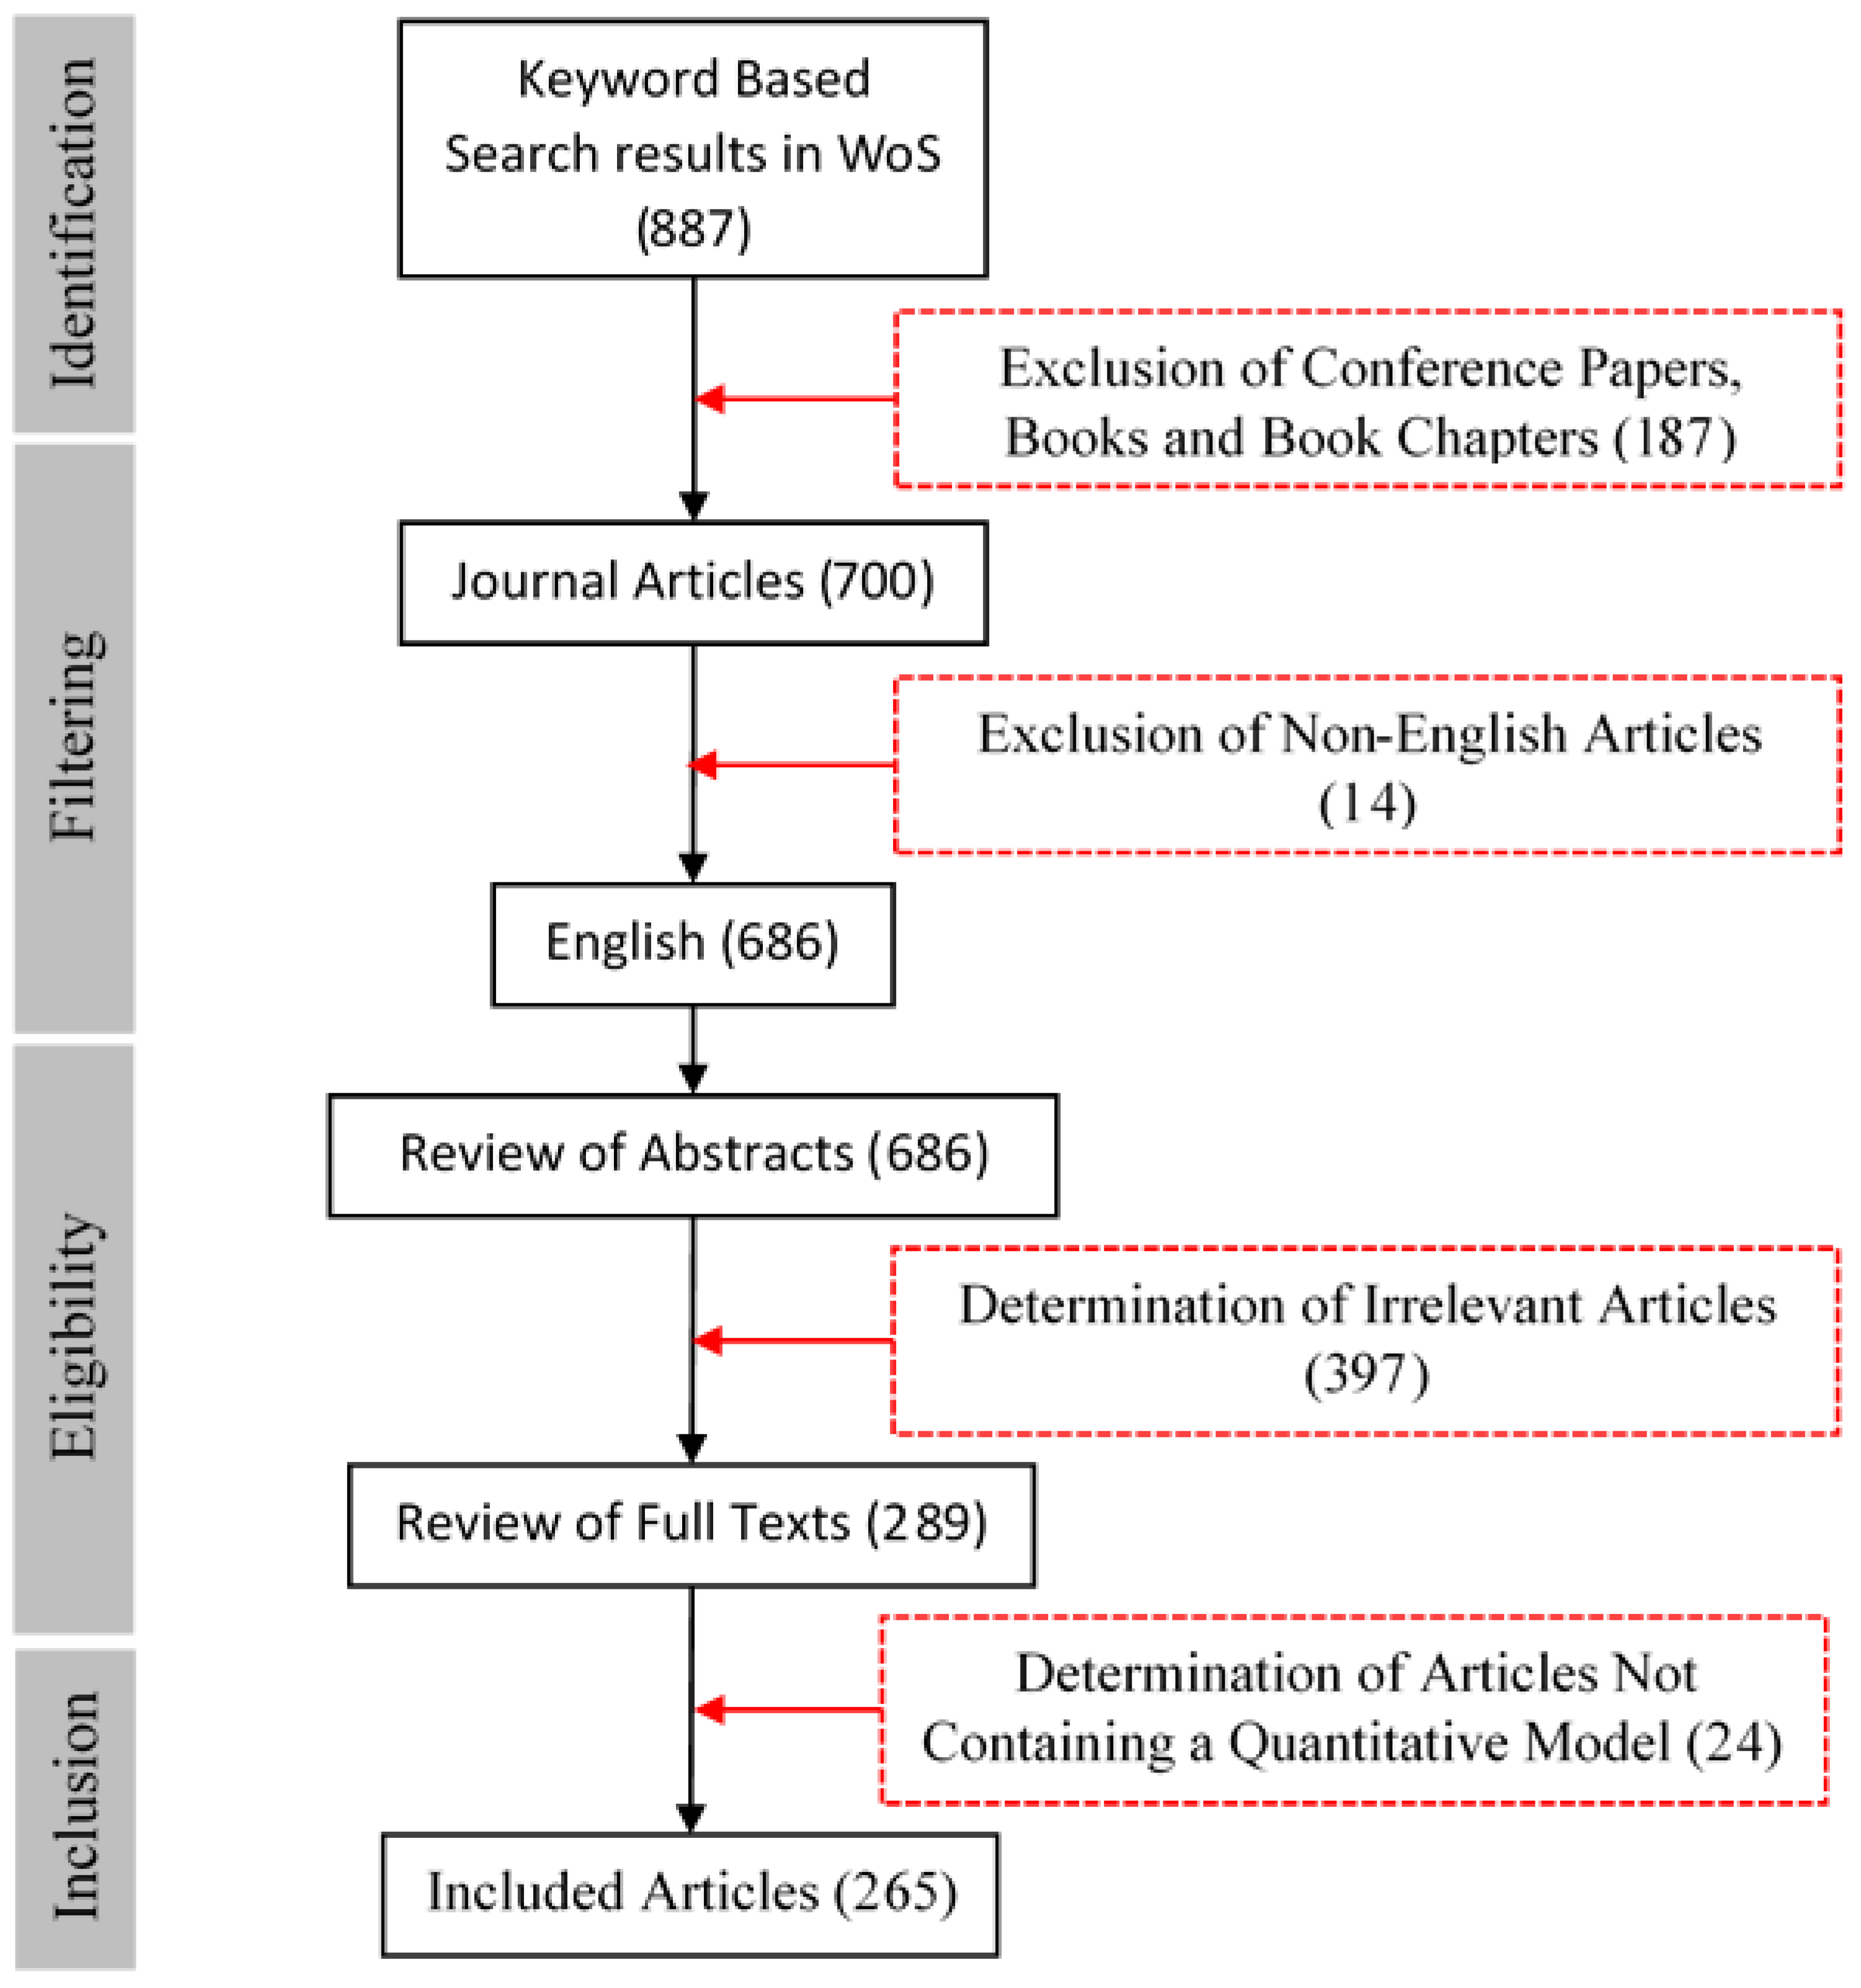
2.2. Search Results
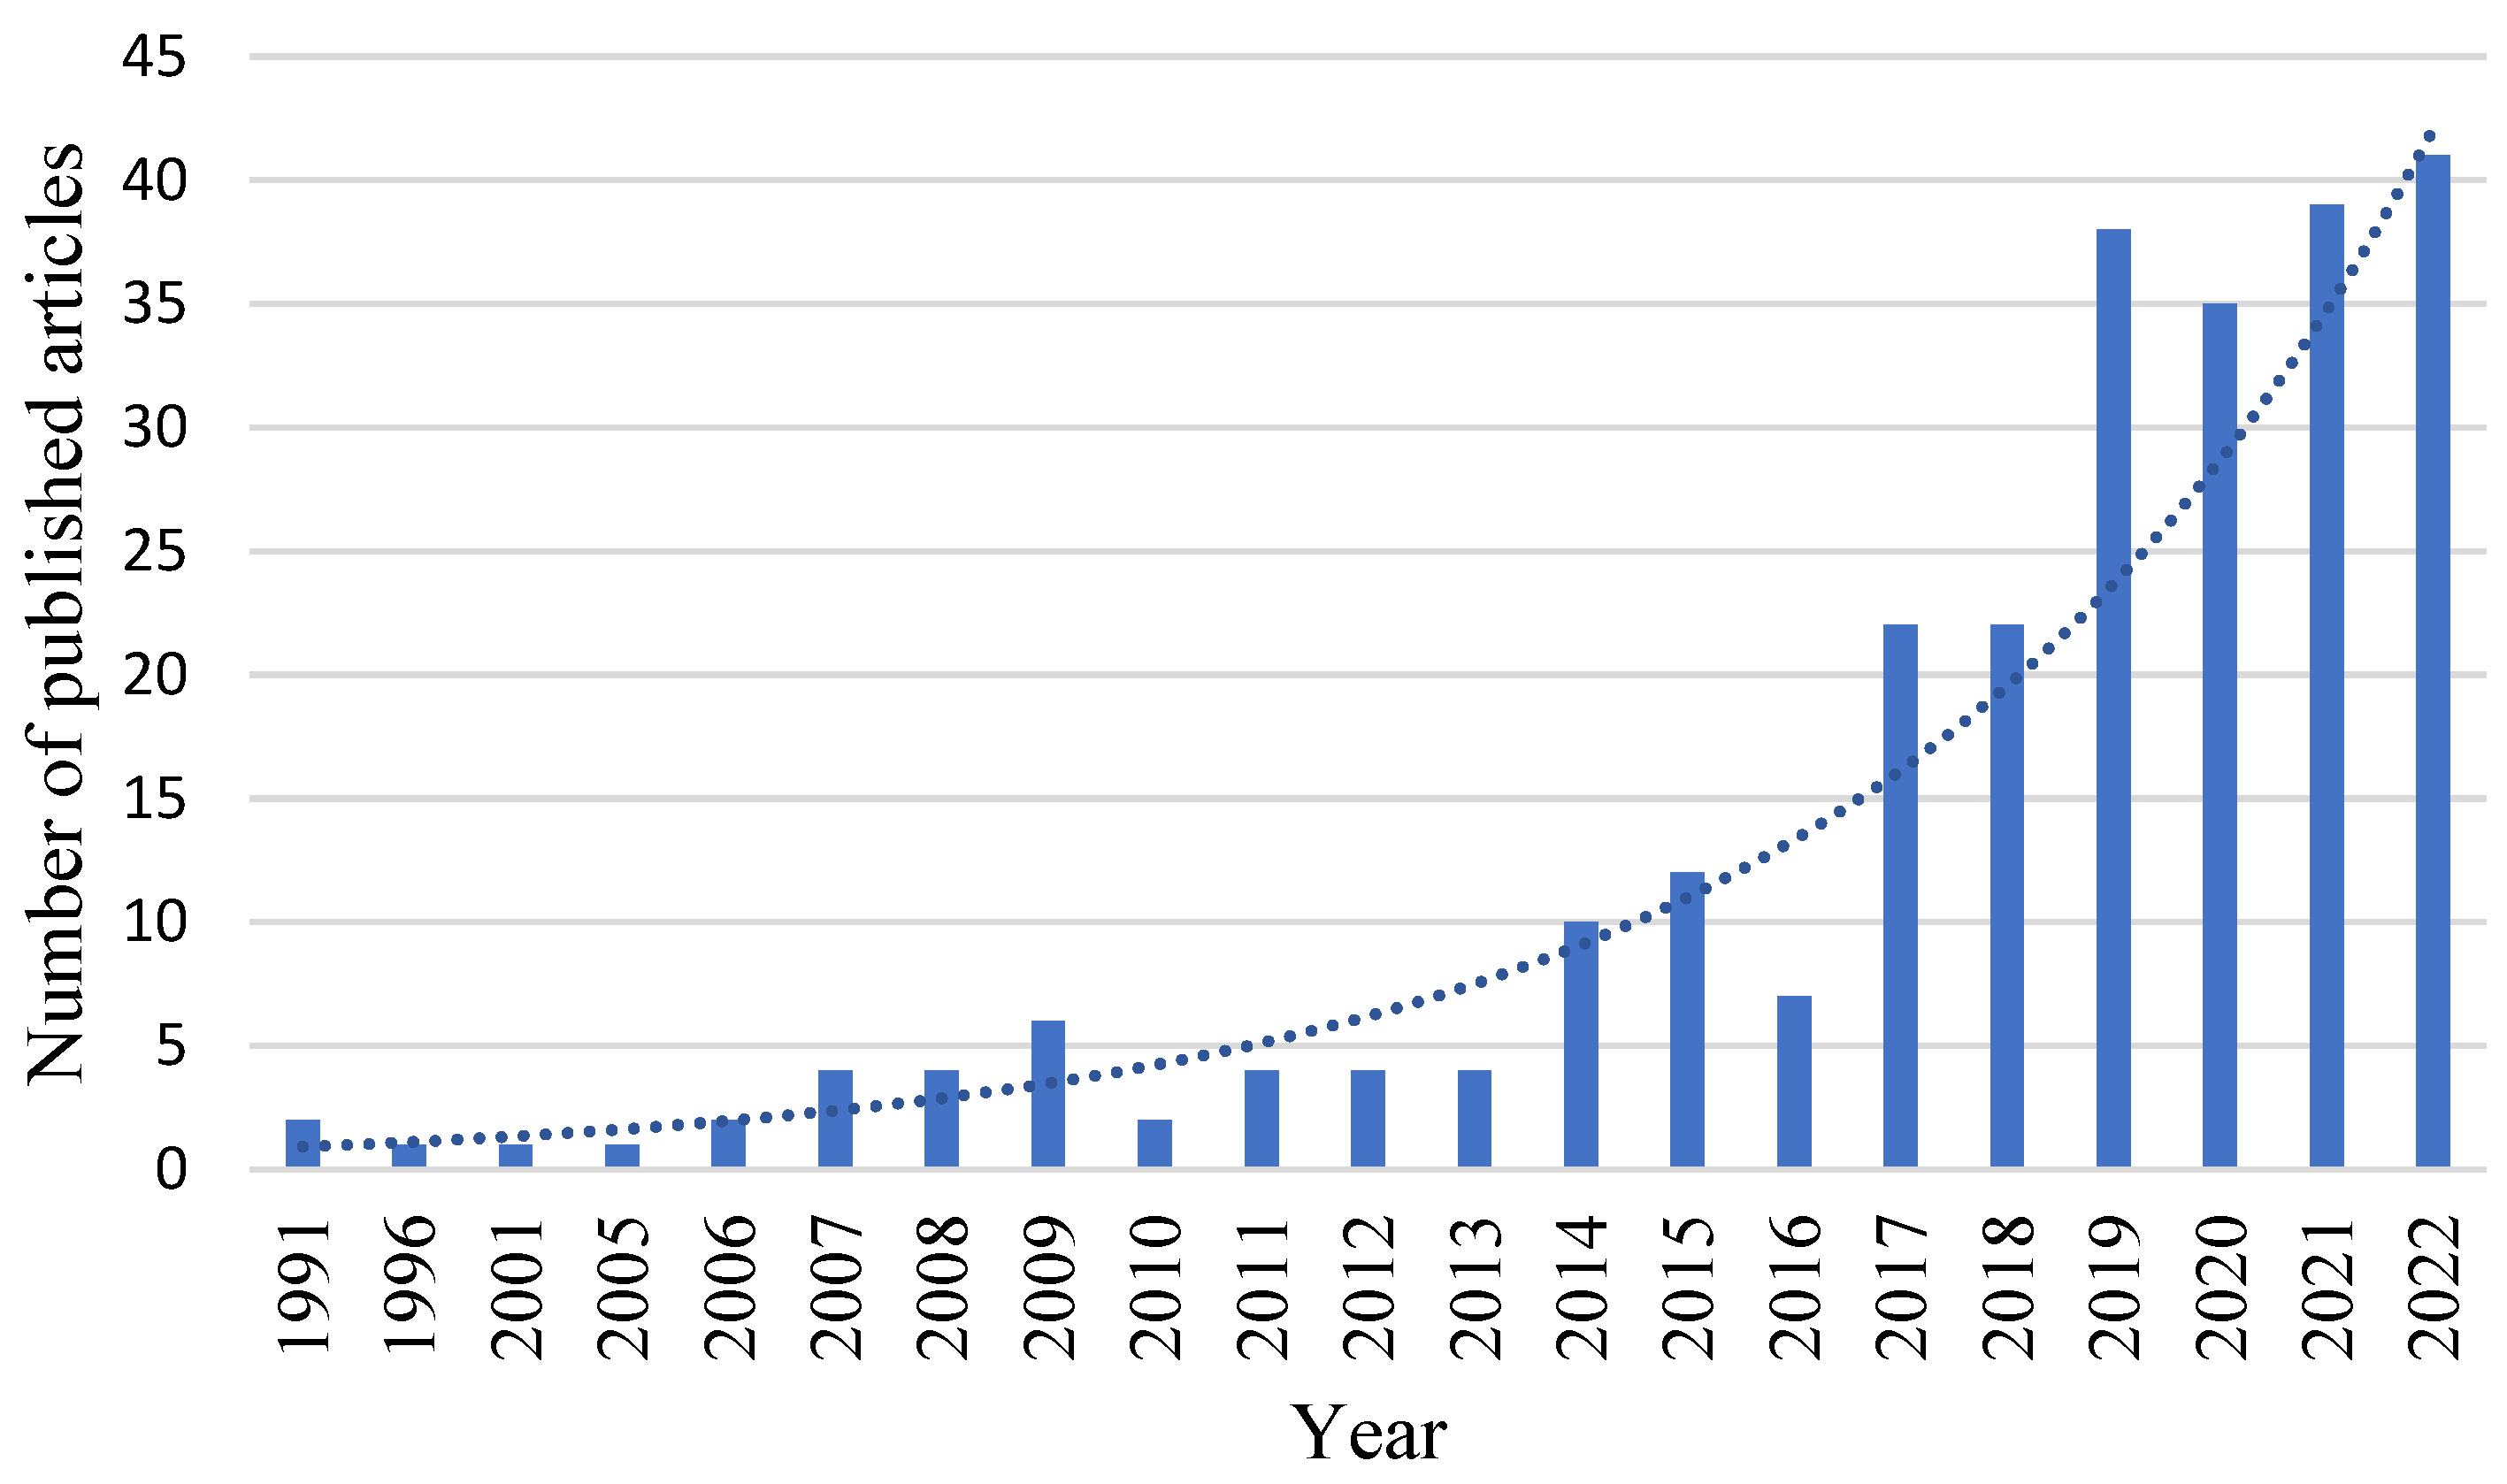
2.3. Initial Data Statistics
2.4. Data Analysis
3. Bibliometric Analysis
3.1. Author Influence
3.2. Affiliation Statistics
3.3. Keyword Statistics
4. Network Analysis
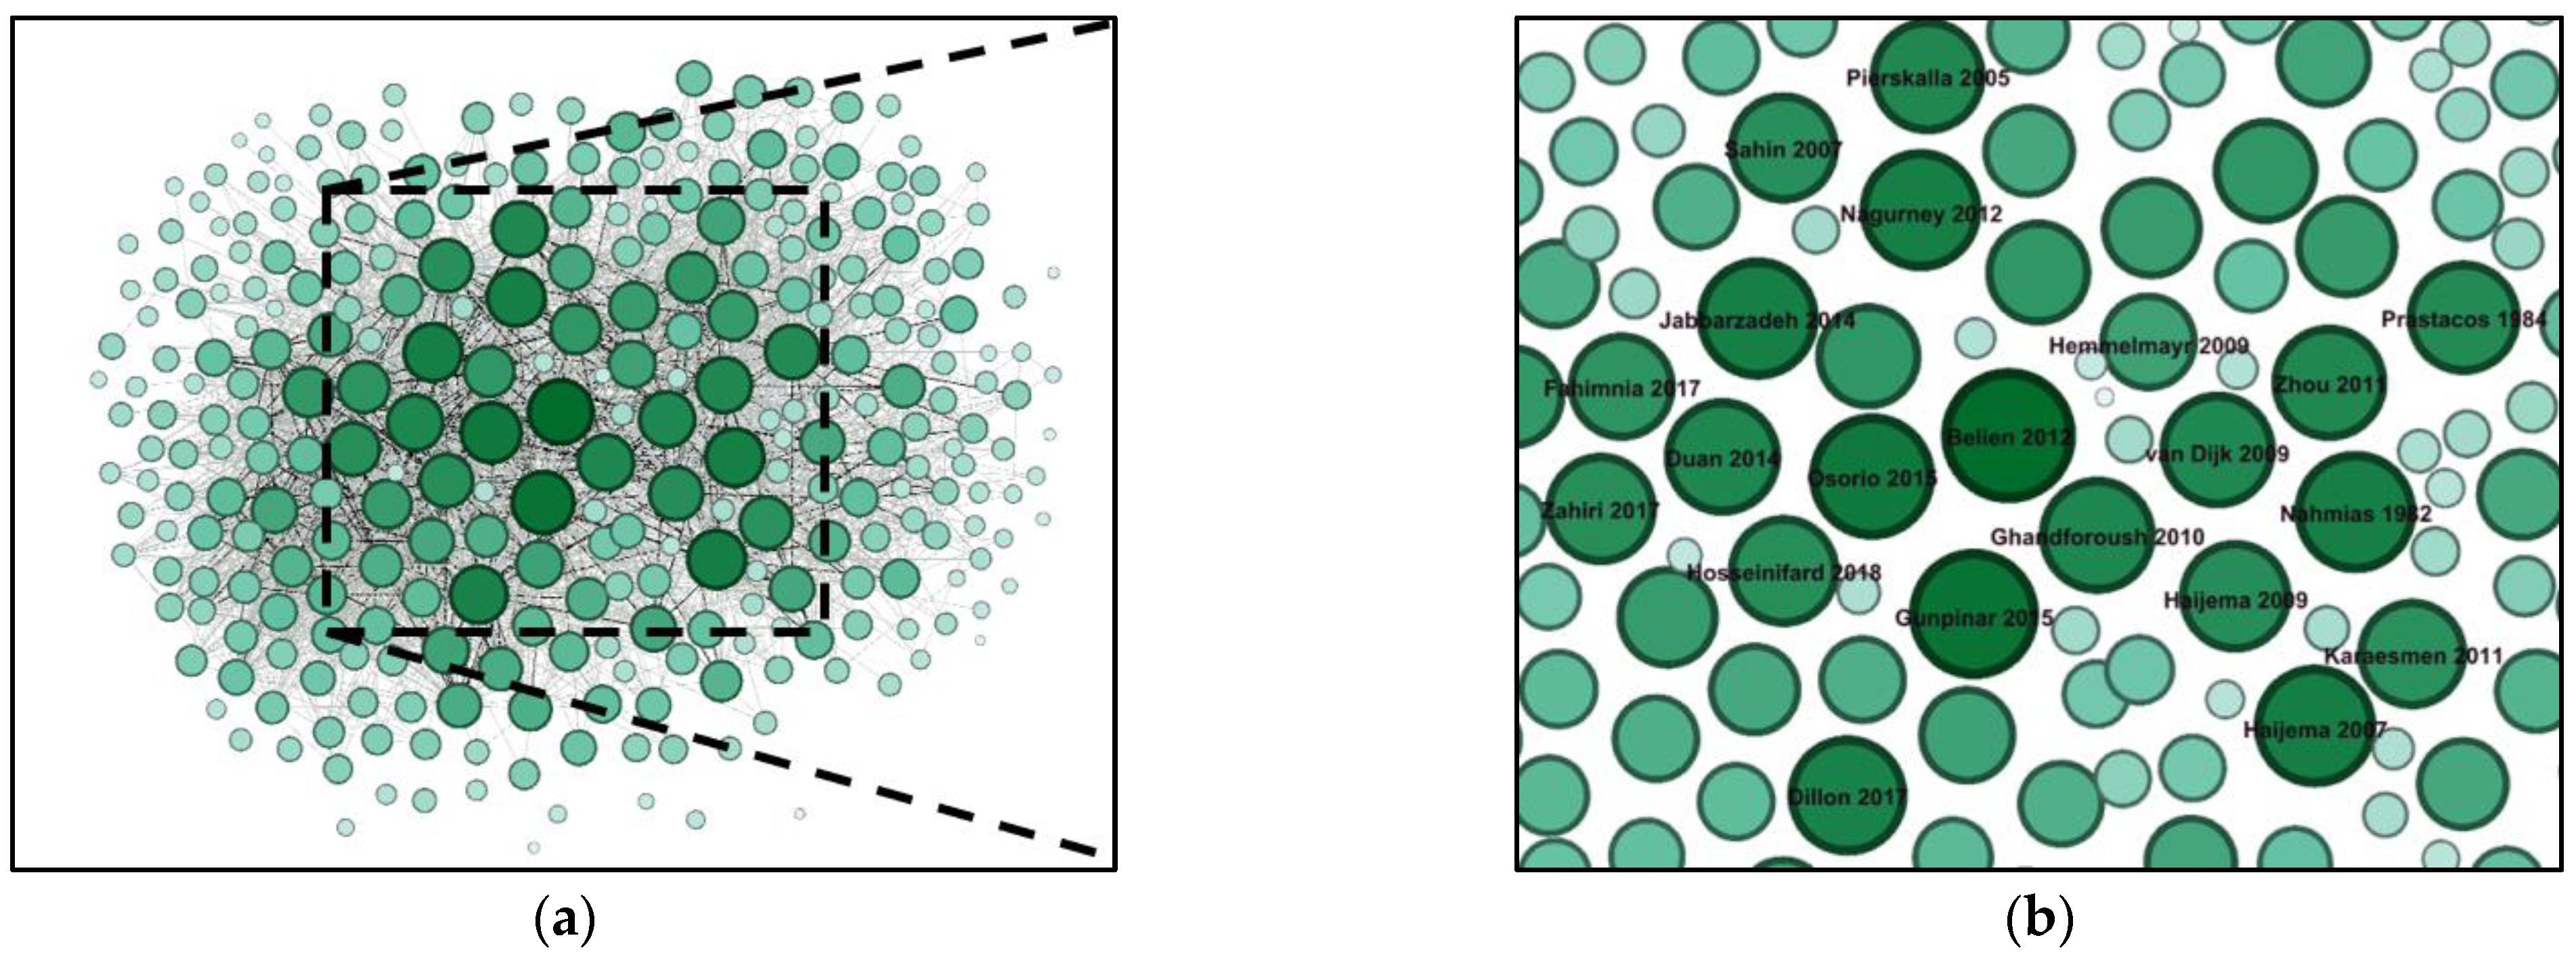
4.1. Citation Analysis

| Publication | Citation | Publication | Citation |
|---|---|---|---|
| Beliën and Forcé [1] | 114 | Dillon et al. [36] | 58 |
| Jabbarzadeh et al. [7] | 74 | Duan and Liao [37] | 53 |
| Osorio et al. [2] | 73 | Ramezanian and Behboodi [38] | 47 |
| Gunpinar and Centeno [39] | 66 | Van Dijk et al. [40] | 47 |
| Haijema et al. [41] | 64 | Şahin et al. [6] | 46 |
| Zahiri and Pishvaee [12] | 62 | Hosseinifard and Abbasi [42] | 45 |
| Nagurney et al. [43] | 61 | Pierskalla [20] | 44 |
| Prastacos [5] | 61 | Zhou et al. [44] | 43 |
| Fahimnia et al. [3] | 61 | Sha and Huang [45] | 41 |
| Nahmias [46] | 61 | Ghandforoush and Sen [47] | 41 |
4.2. PageRank Analysis
4.3. Co-Occurrence Analysis
4.3.1. Co-Citation Analysis
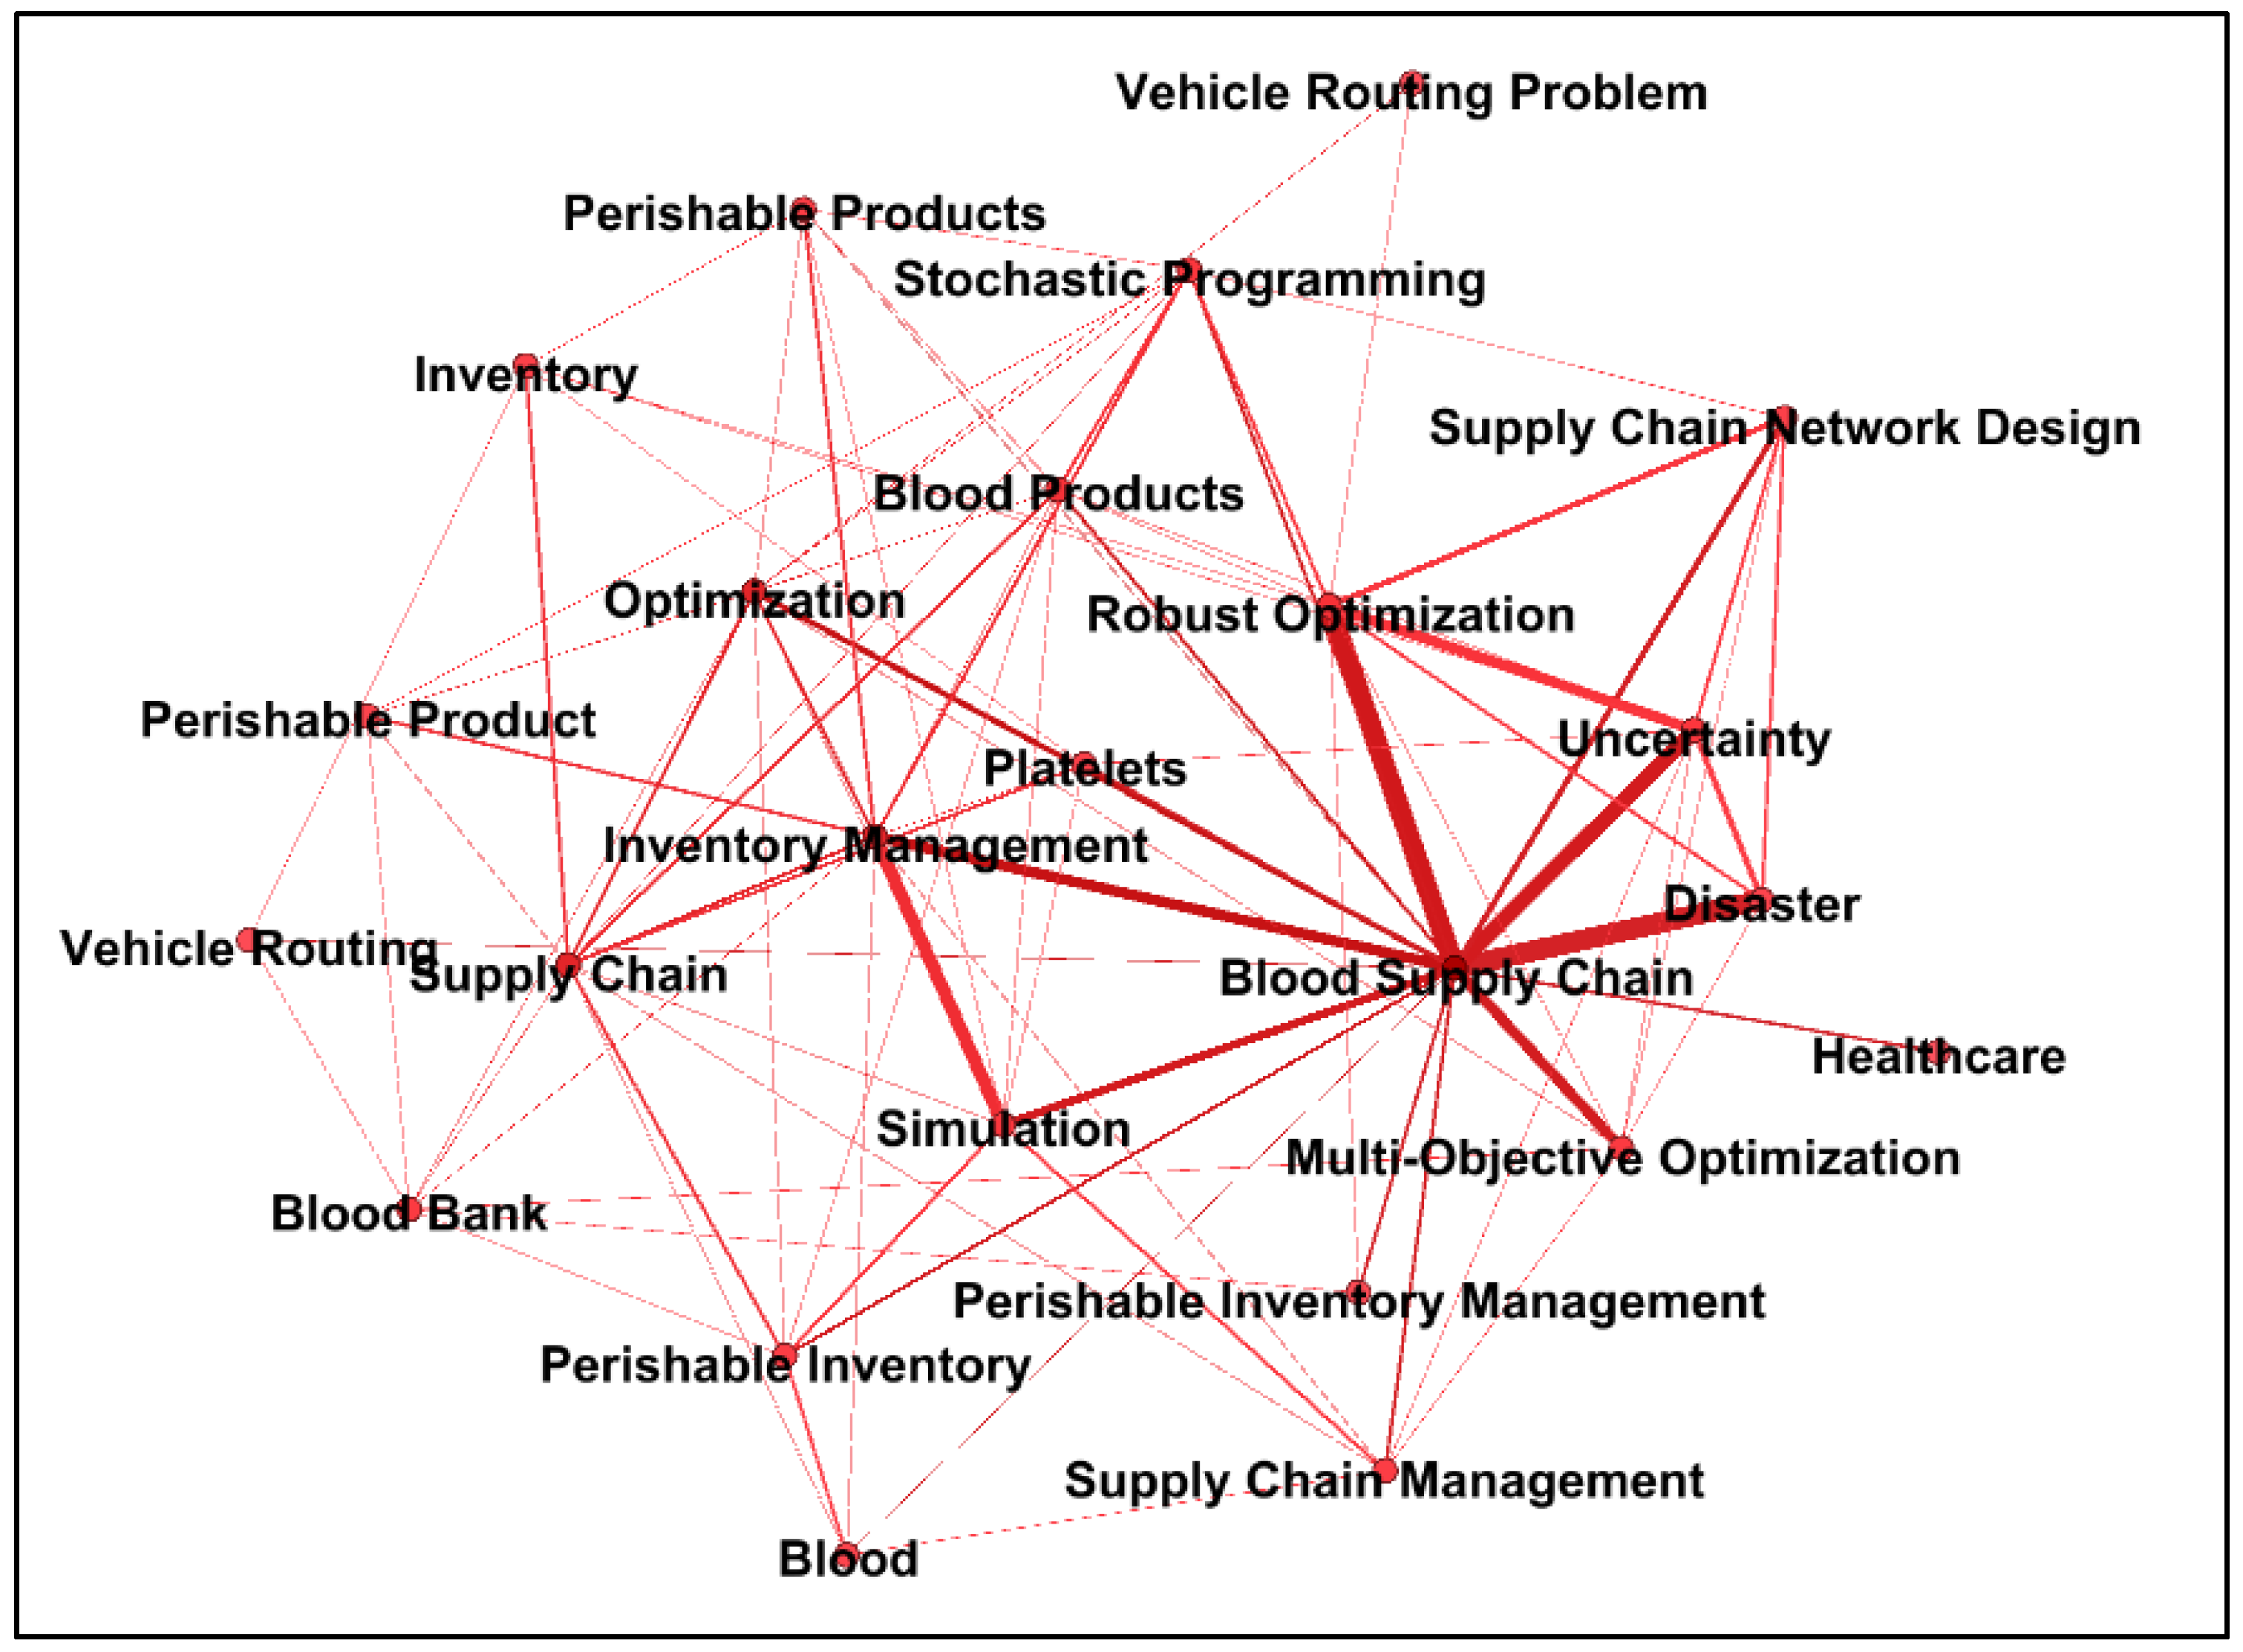
4.3.2. Keyword Co-Occurrence Analysis
4.3.3. Co-Authorship Analysis
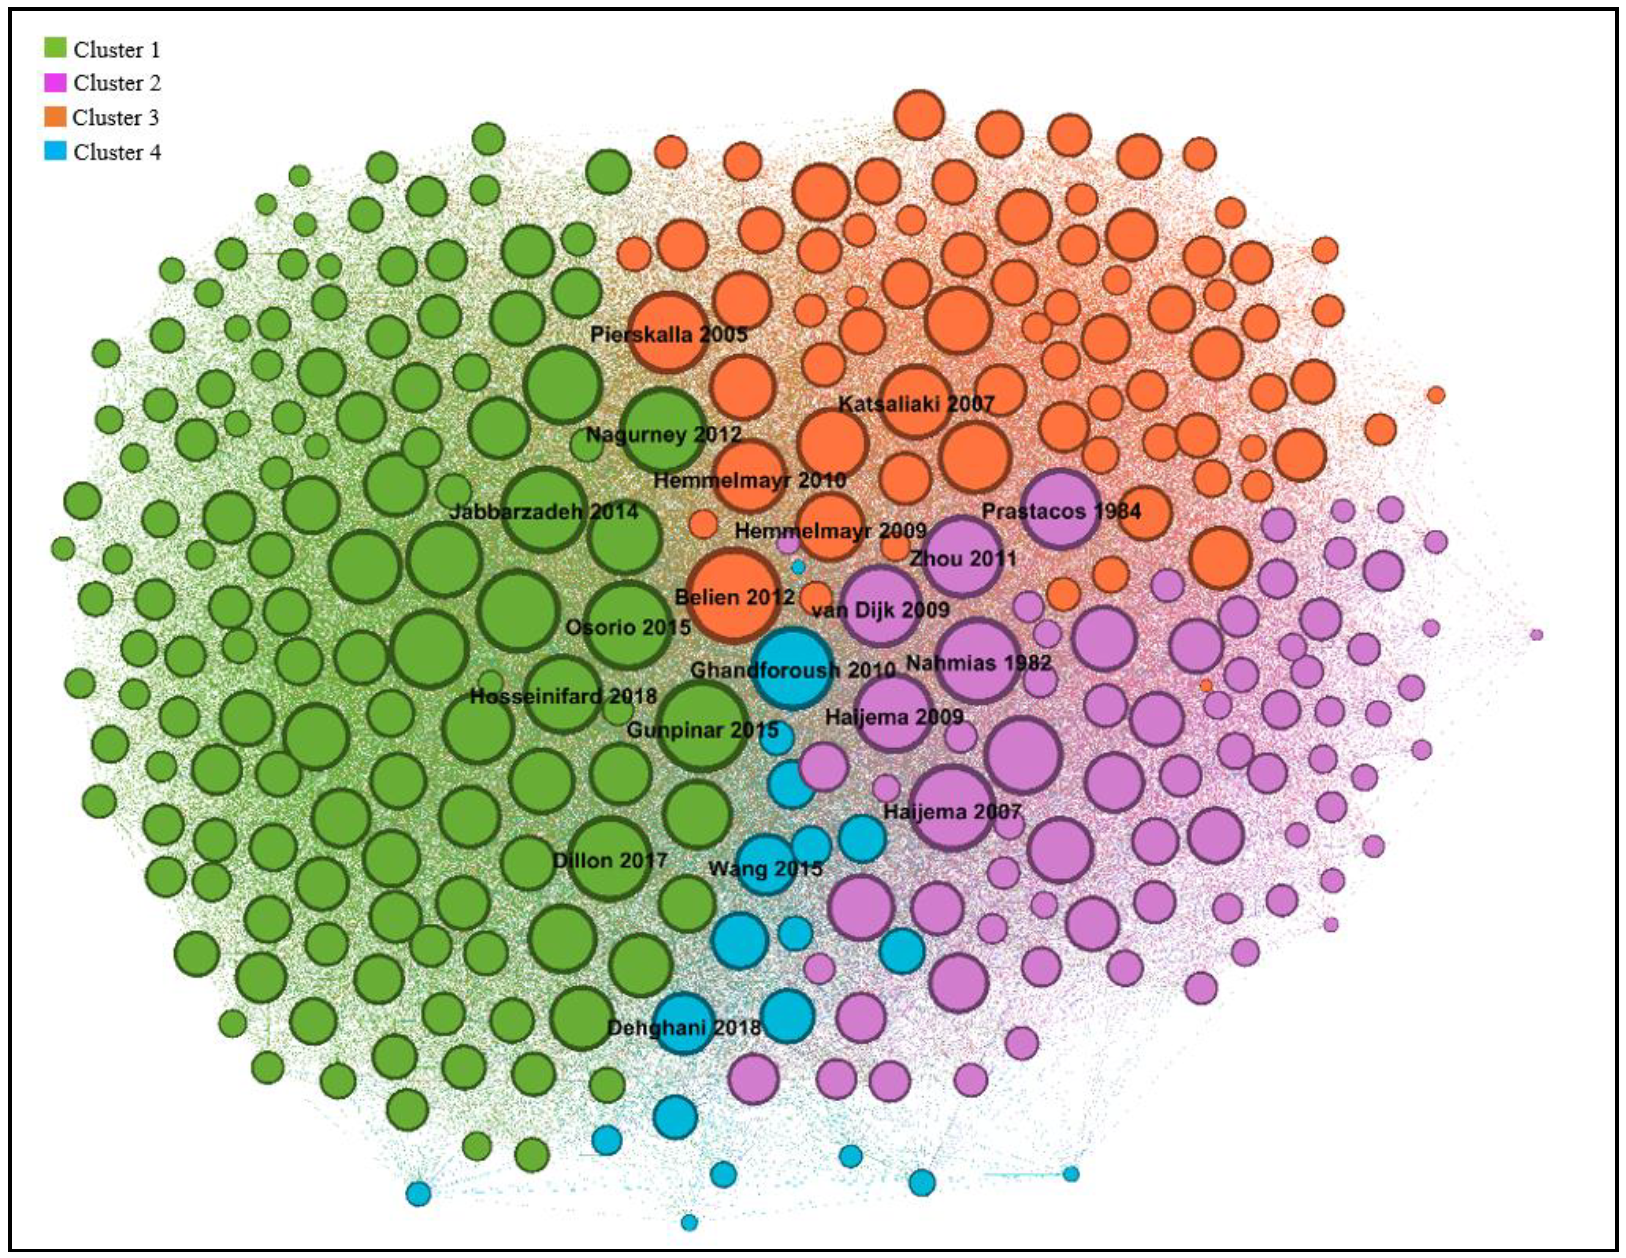
4.4. Topical Data Clustering
5. Taxonomy of BSC
- Stage of BSC
- Blood Products
- Solution Methods
- Nature of the Parameters
- Solution Approach
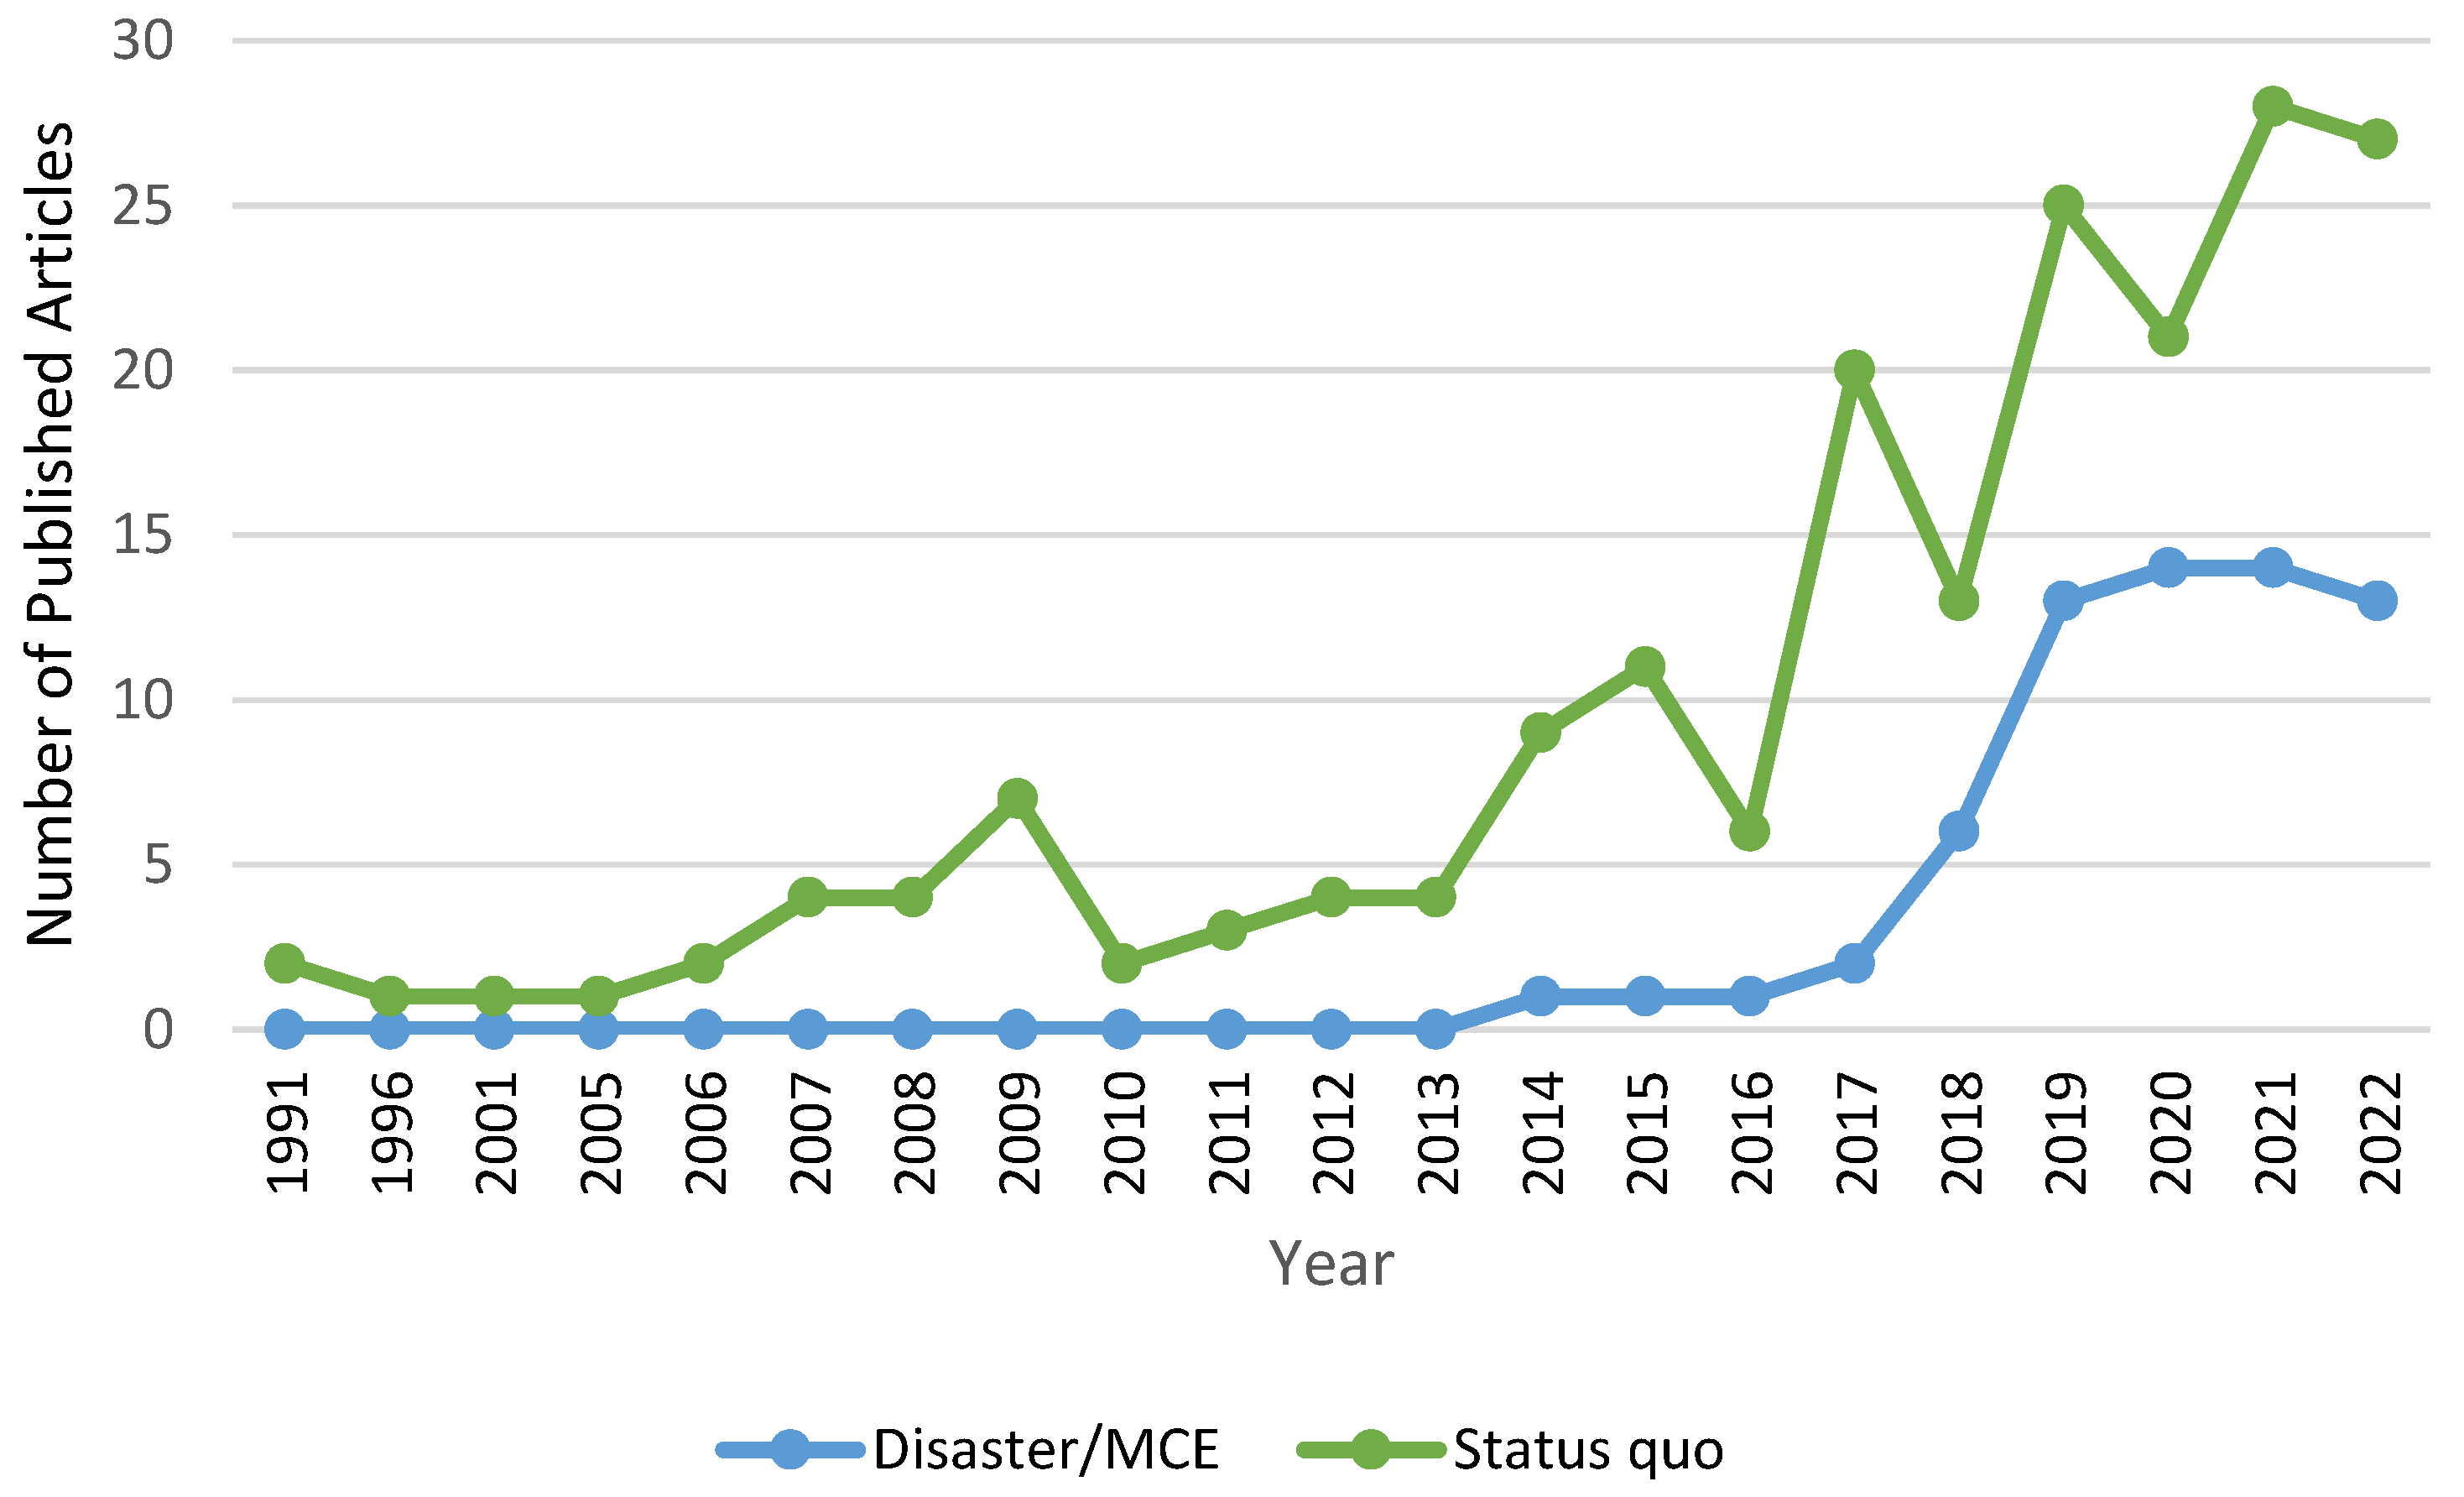
- Disaster–Mass Casualty Events (MCE) versus Status Quo
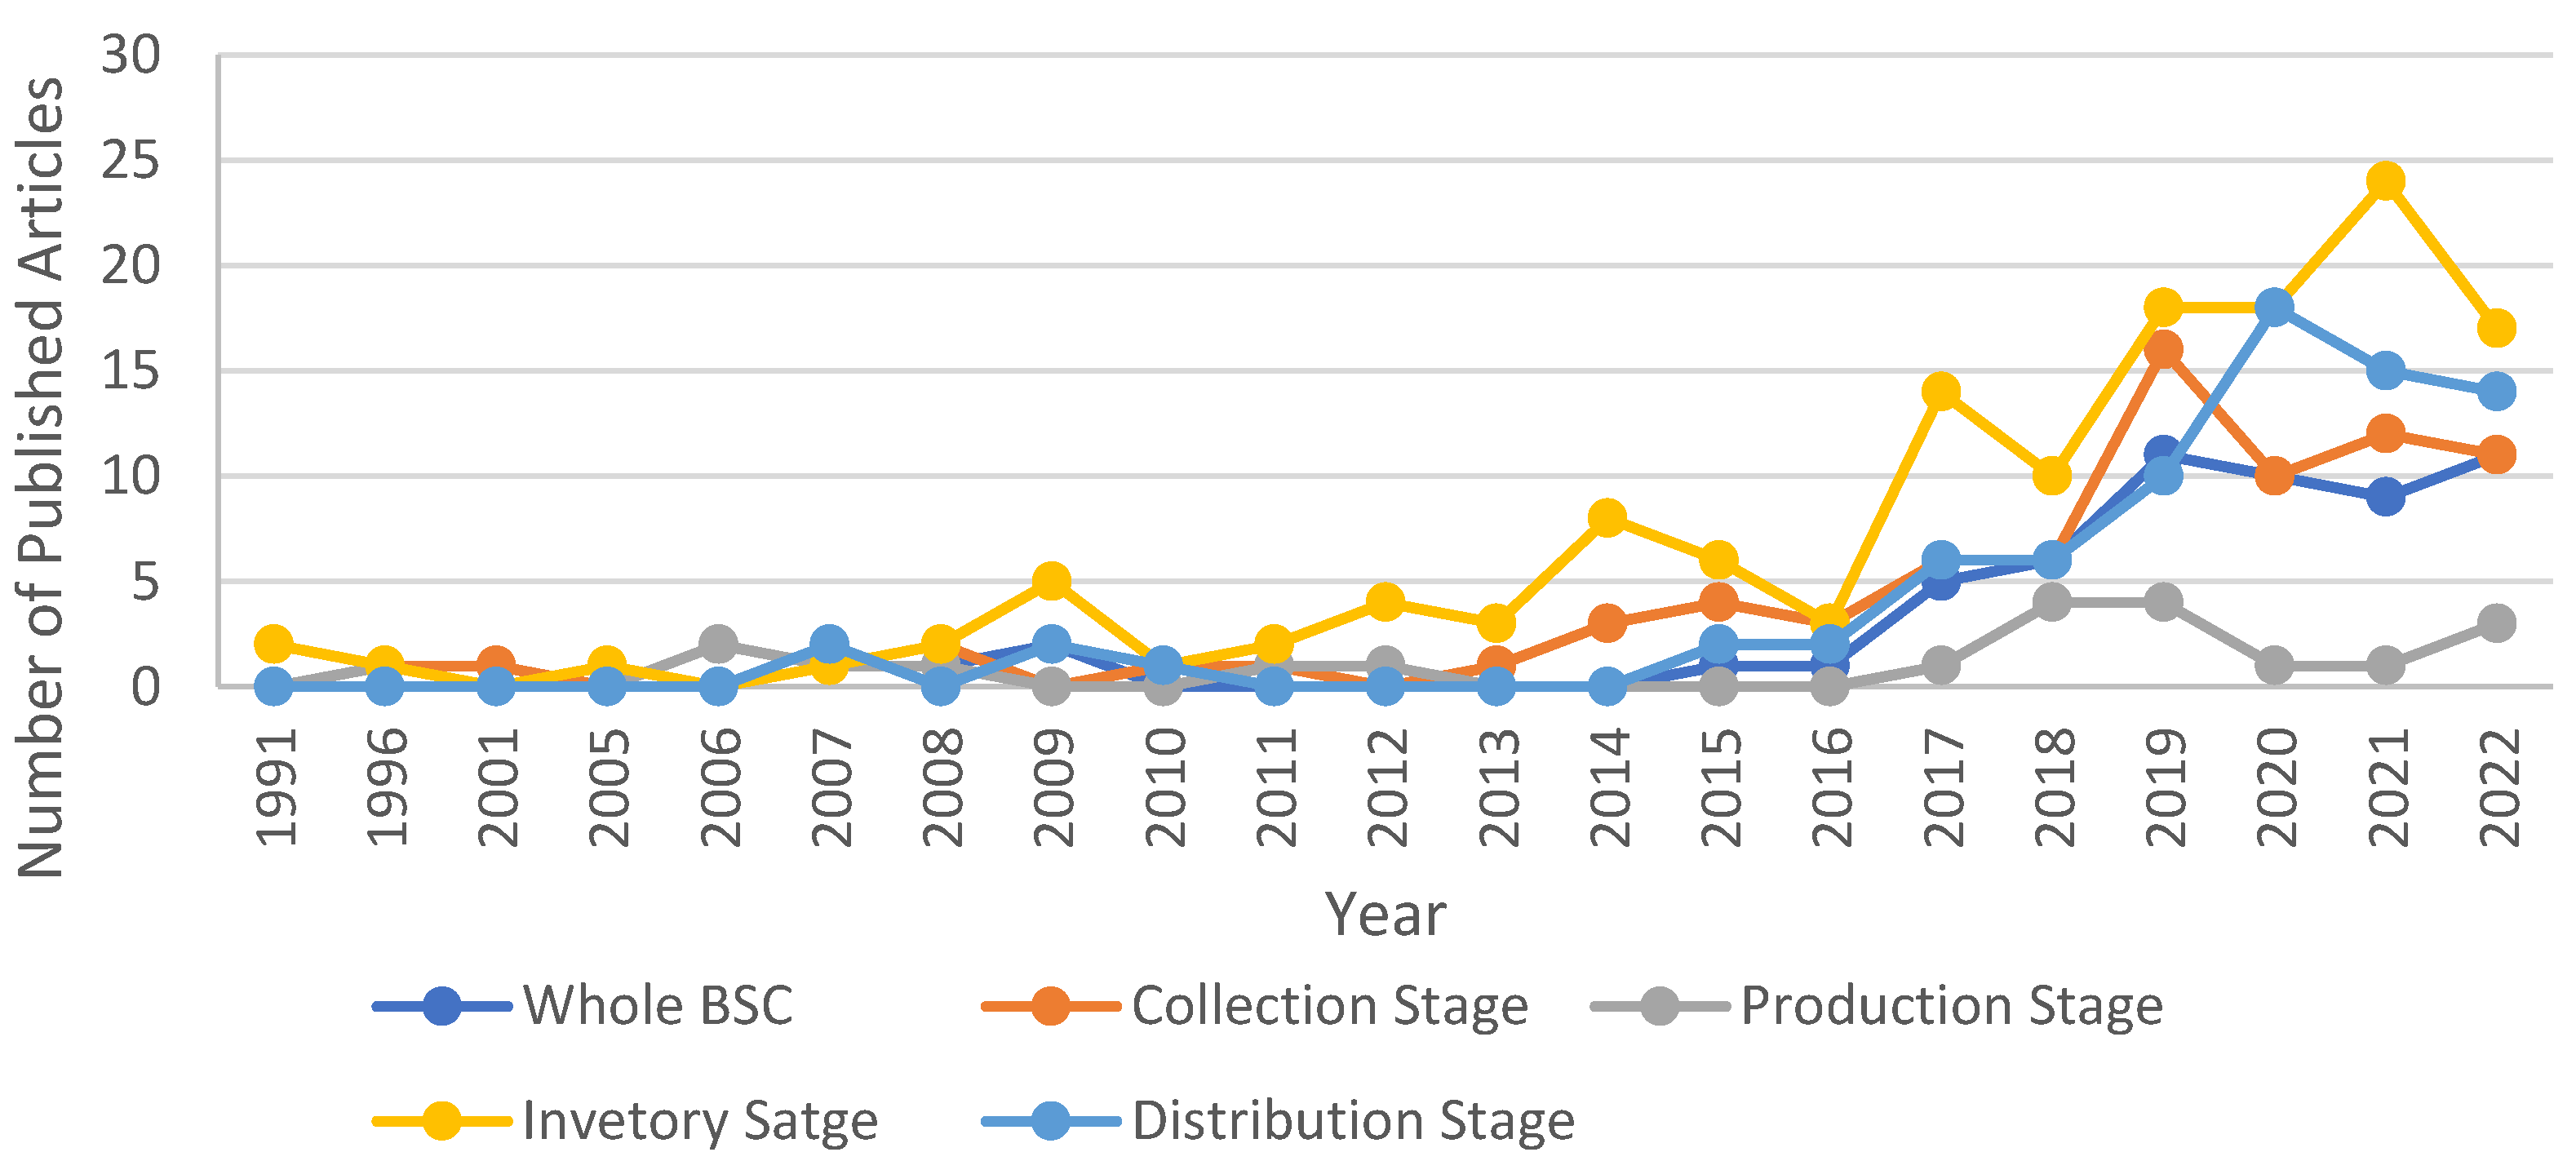
5.1. Hierarchical Level of BSC
5.1.1. Collection
5.1.2. Production
5.1.3. Inventory
5.1.4. Distribution
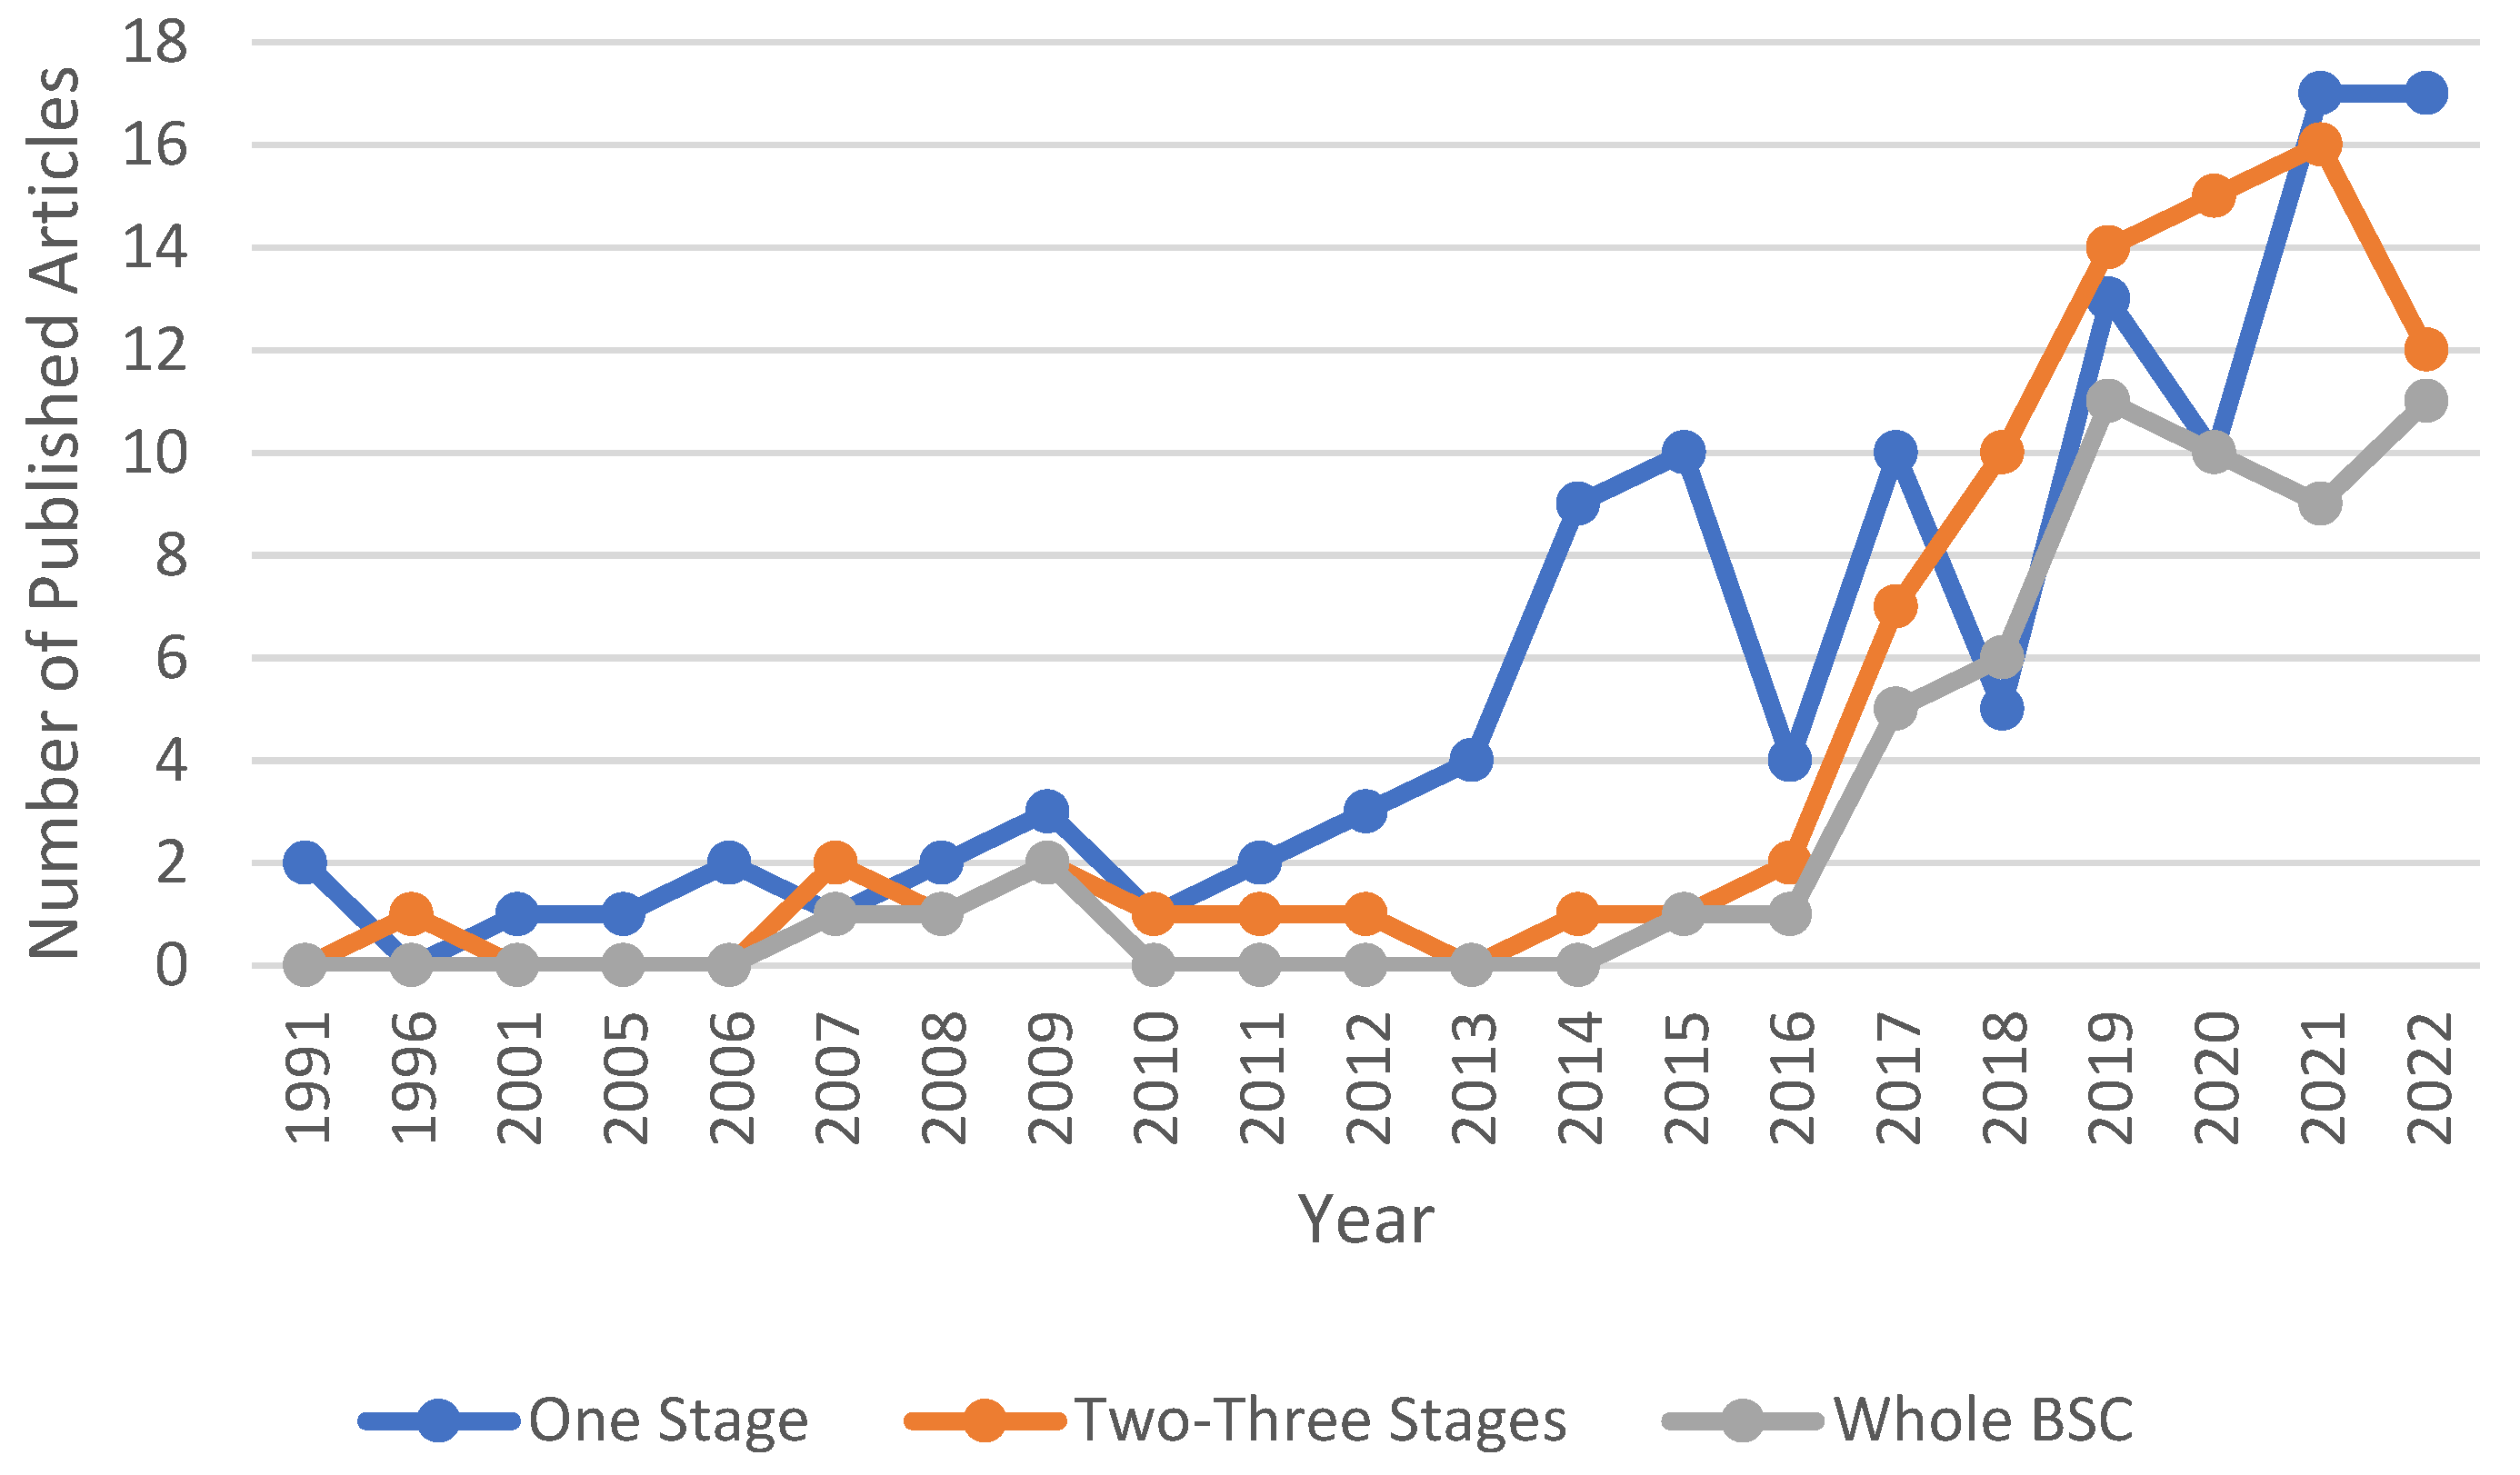
5.1.5. Trends in Stage of the BSC
5.2. Blood Products
5.2.1. Whole Blood
5.2.2. Red Blood Cells
5.2.3. Platelets
5.2.4. Plasma
5.2.5. Cryoprecipitate
5.2.6. Trends in Blood Product
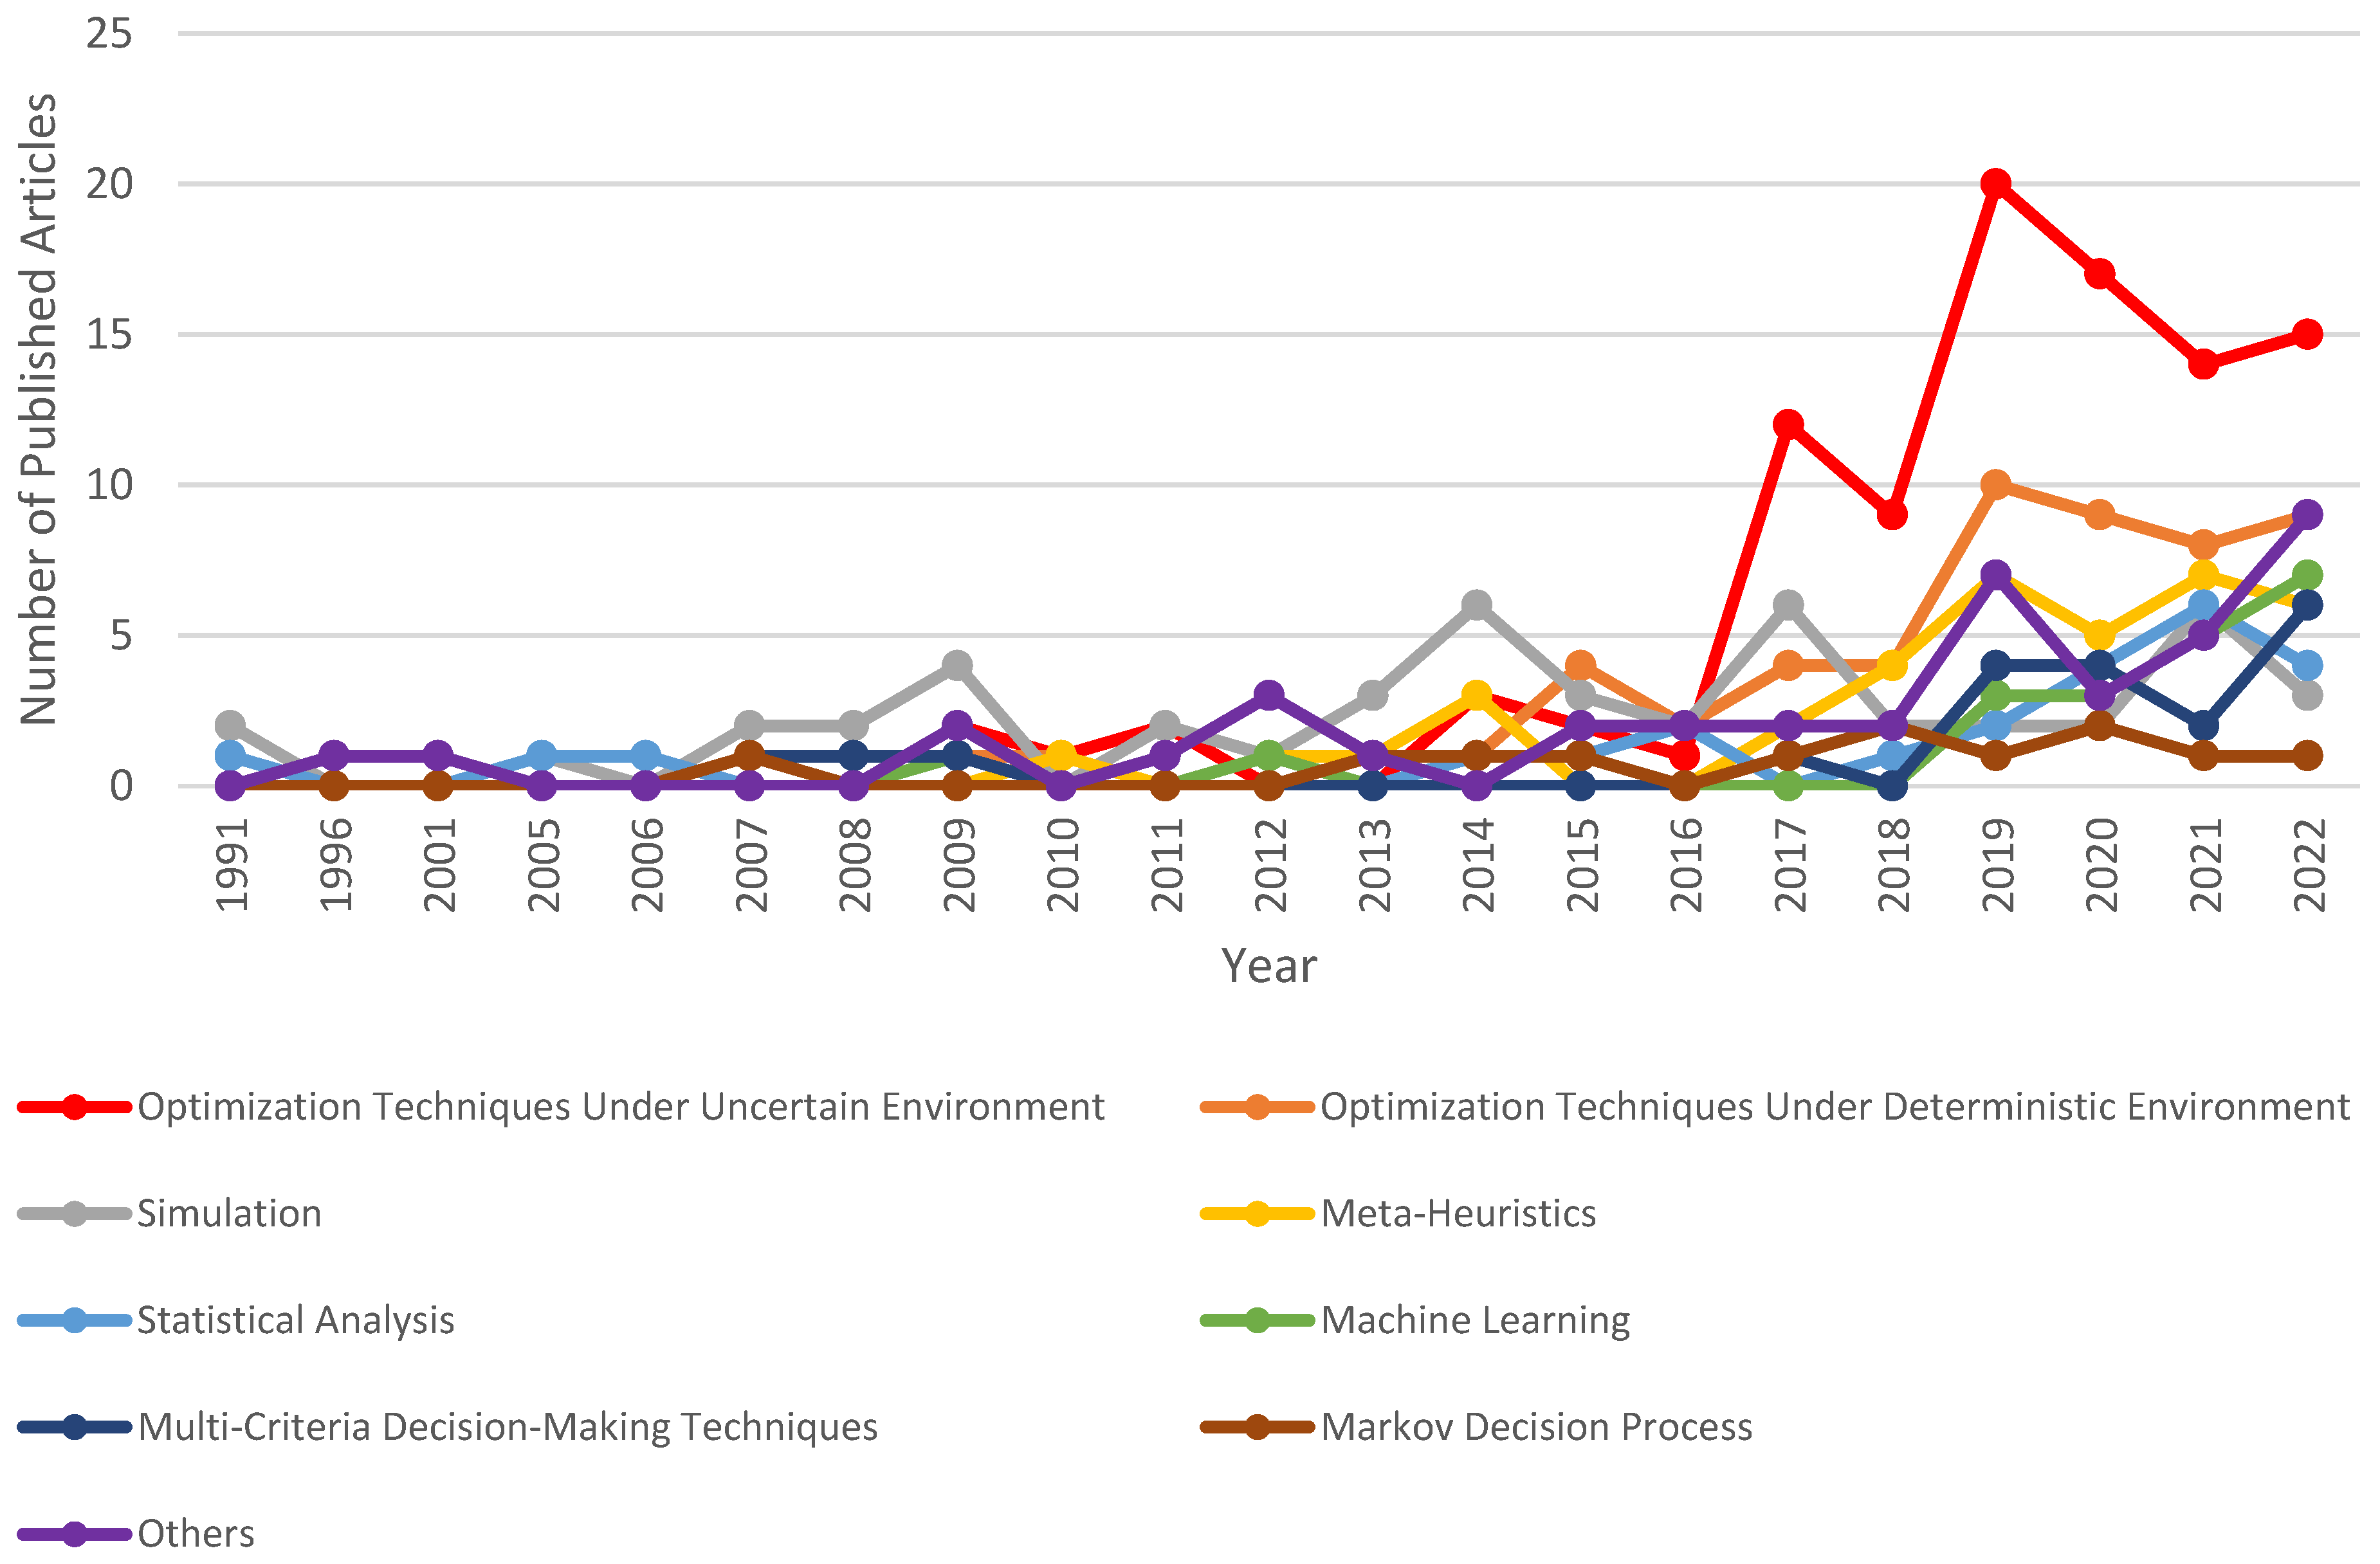
5.3. Solution Method
- Optimization techniques under uncertain environment
- Optimization techniques under deterministic environment
- Simulation techniques
- Meta-heuristics
- Statistical Analysis
- Machine learning
- Multi-Criteria Decision-Making Techniques
- Markov Decision Process
- Others
5.3.1. Optimization Techniques under Uncertain Environment
5.3.2. Optimization Techniques under Deterministic Environment
5.3.3. Simulation
5.3.4. Meta-Heuristics
5.3.5. Statistical Analysis
5.3.6. Machine Learning
5.3.7. Multi-Criteria Decision-Making Techniques
5.3.8. Markov Decision Process
5.3.9. Others
5.3.10. Trends in Solution Methods
5.4. Nature of the Parameters
5.5. Solution Approach
5.6. Disaster-MCE versus Status Quo
6. Research Gaps and Future Research Directions
- As mentioned in Section 5.1.2, the production stage is the least researched stage of the BSC, and most of the studies that focused on production only considered the cost or duration of blood tests. In line with this information, more research that considers the rate of separation of whole blood into blood products is required. In addition, the efficiency of different blood collection and separation methods still needs to be further explored.
- Another area that needs attention is the evaluation of supply points. The placement of a collection facility is a strategic decision that causes significant financial burdens. Apart from the number of potential donors, there are other critical factors that need to be considered for this decision, such as the seasonal continuity of the population, the eligibility of the population to donate blood, and the possibility of finding volunteer workers. The determination of critical factors for the evaluation of alternate locations and determination of their importance is another topic regarding the BSC that needs to be explored. To the best of the authors’ knowledge, there is also no research on the efficiency measurement of MBCs.
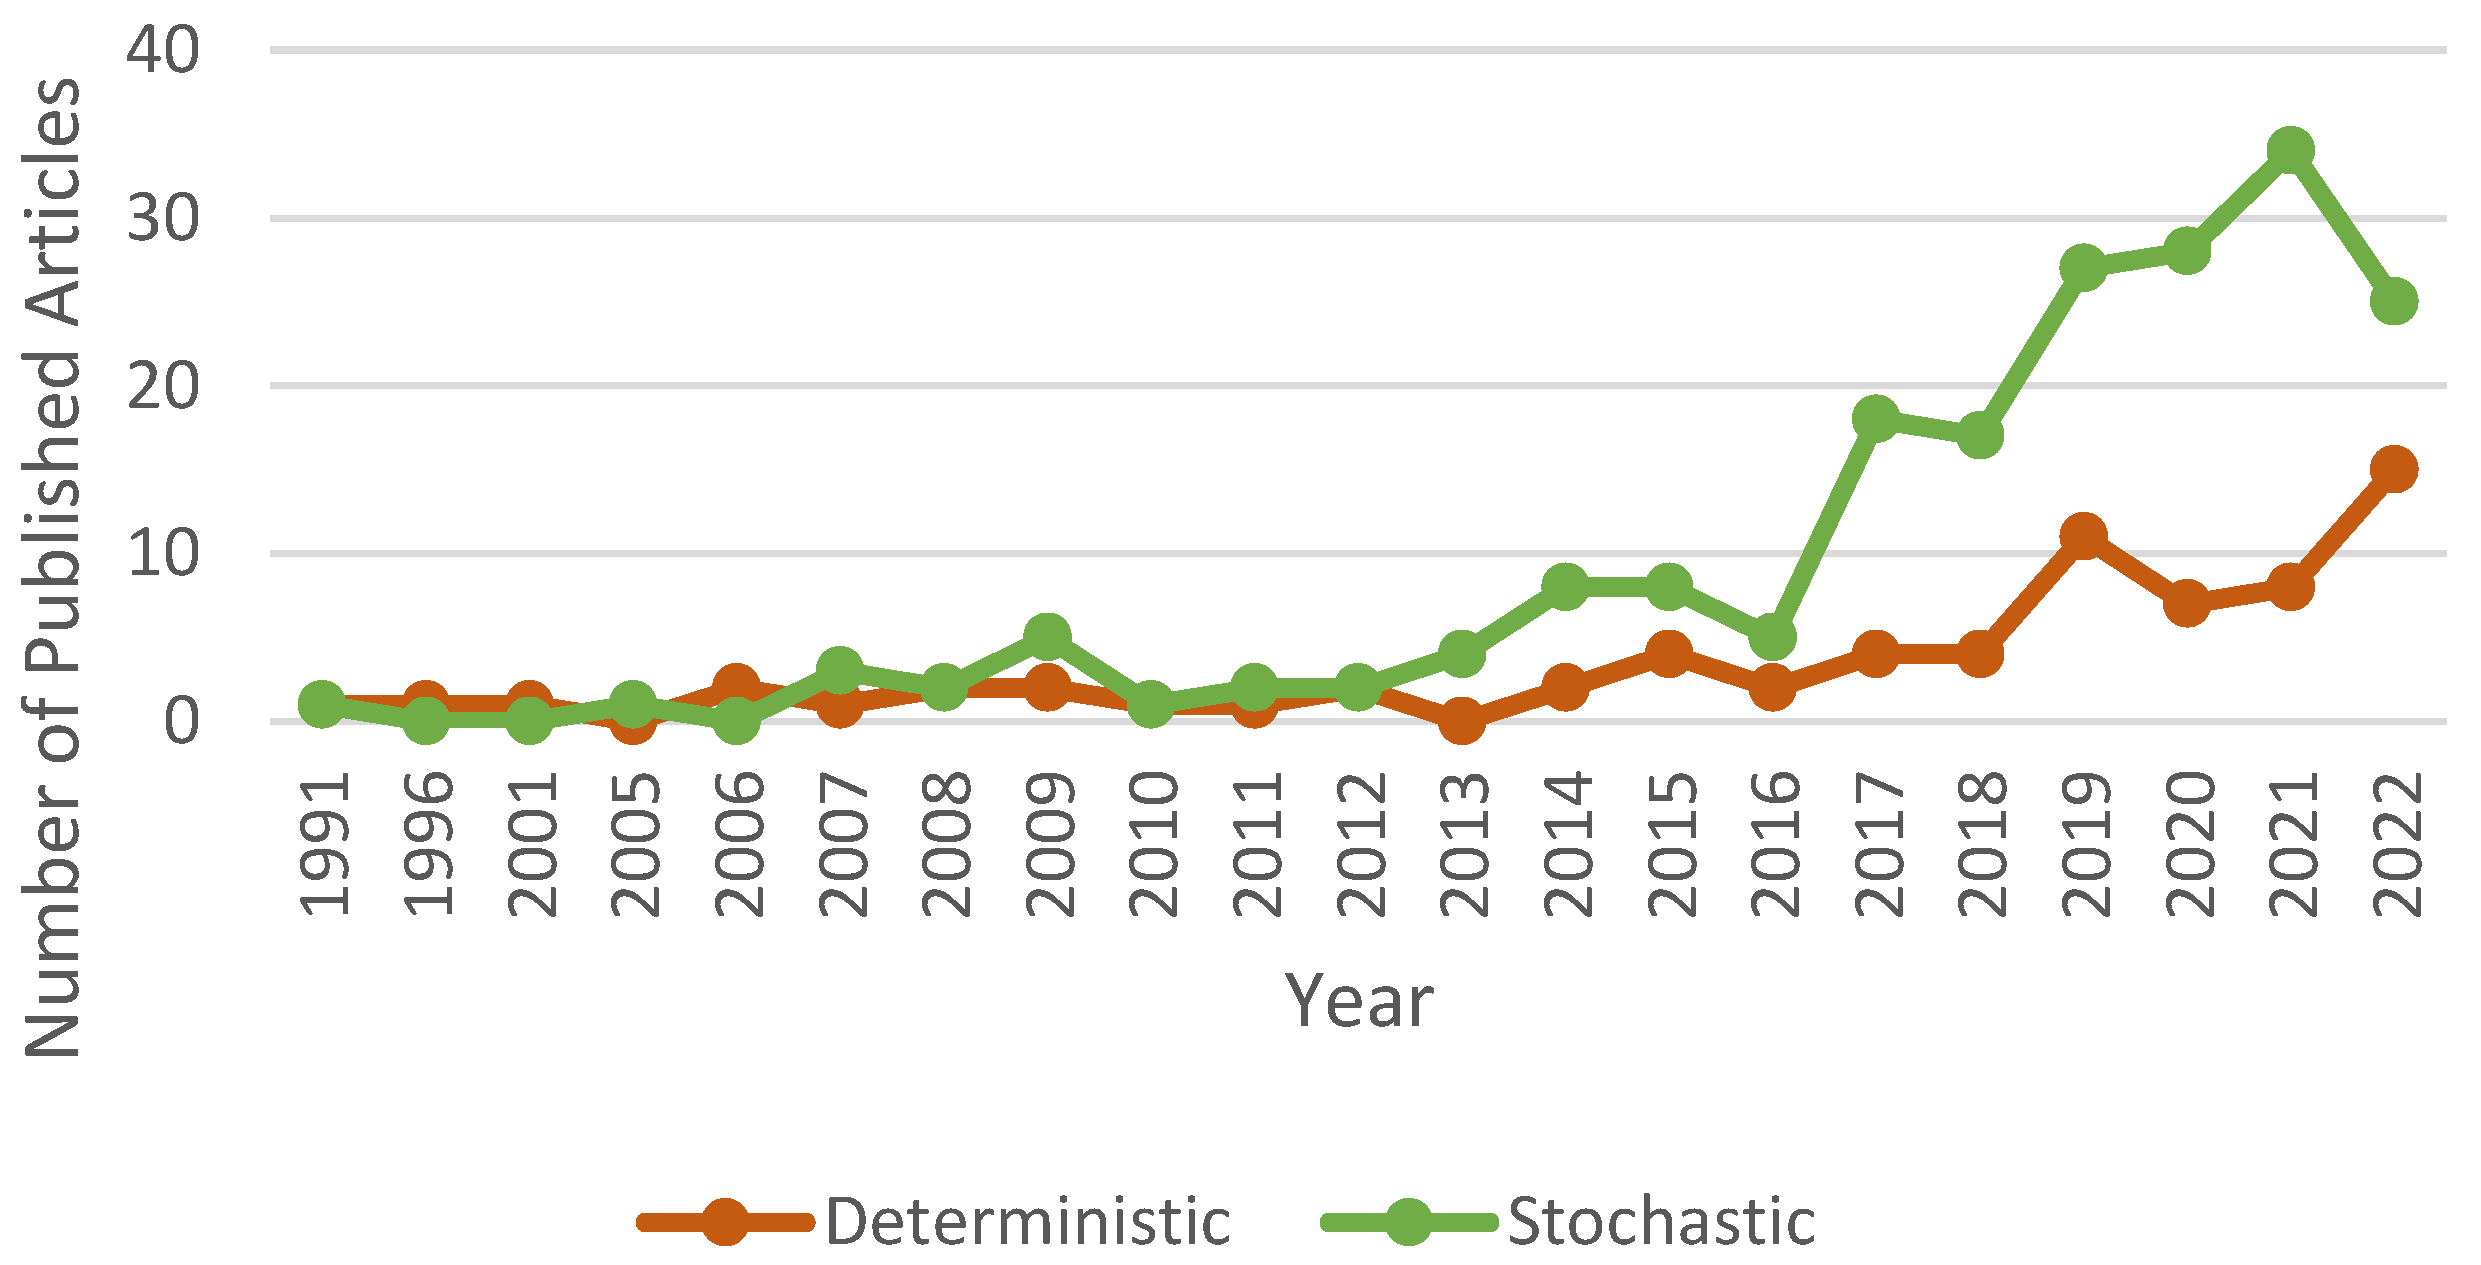
- Due to imprecise parameters in the BSC, the utilization of ‘optimization techniques under uncertain environments’ increased, especially after 2016. The authors also believe that the dominance of these methods will continue. The majority of these studies employ two-stage stochastic optimization. In a two-stage stochastic optimization, uncertain parameters are realized once, and subsequent periods are free from uncertainty. This condition is likely in situations such as disasters. However, for the status quo in the BSC, uncertain parameters are valid for each period and need to be handled with multi-stage stochastic optimization. In the current literature on the BSC, only one study employs multi-stage stochastic optimization. Hence, more studies that utilize multi-stage stochastic optimization are needed.
- The magnitude of the data on hand regarding the BSC and the variety of its sources indicate that big data applications are a good candidate for future studies in this field. Thus, an overlooked research area—causes of wastage and scarcity—can be better handled. Although some quite new studies employ big data applications in the BSC, they are mainly focused on the number of donations or demand. However, the whole BSC may be a good candidate for big data application in order to determine disruptions in the supply chain.
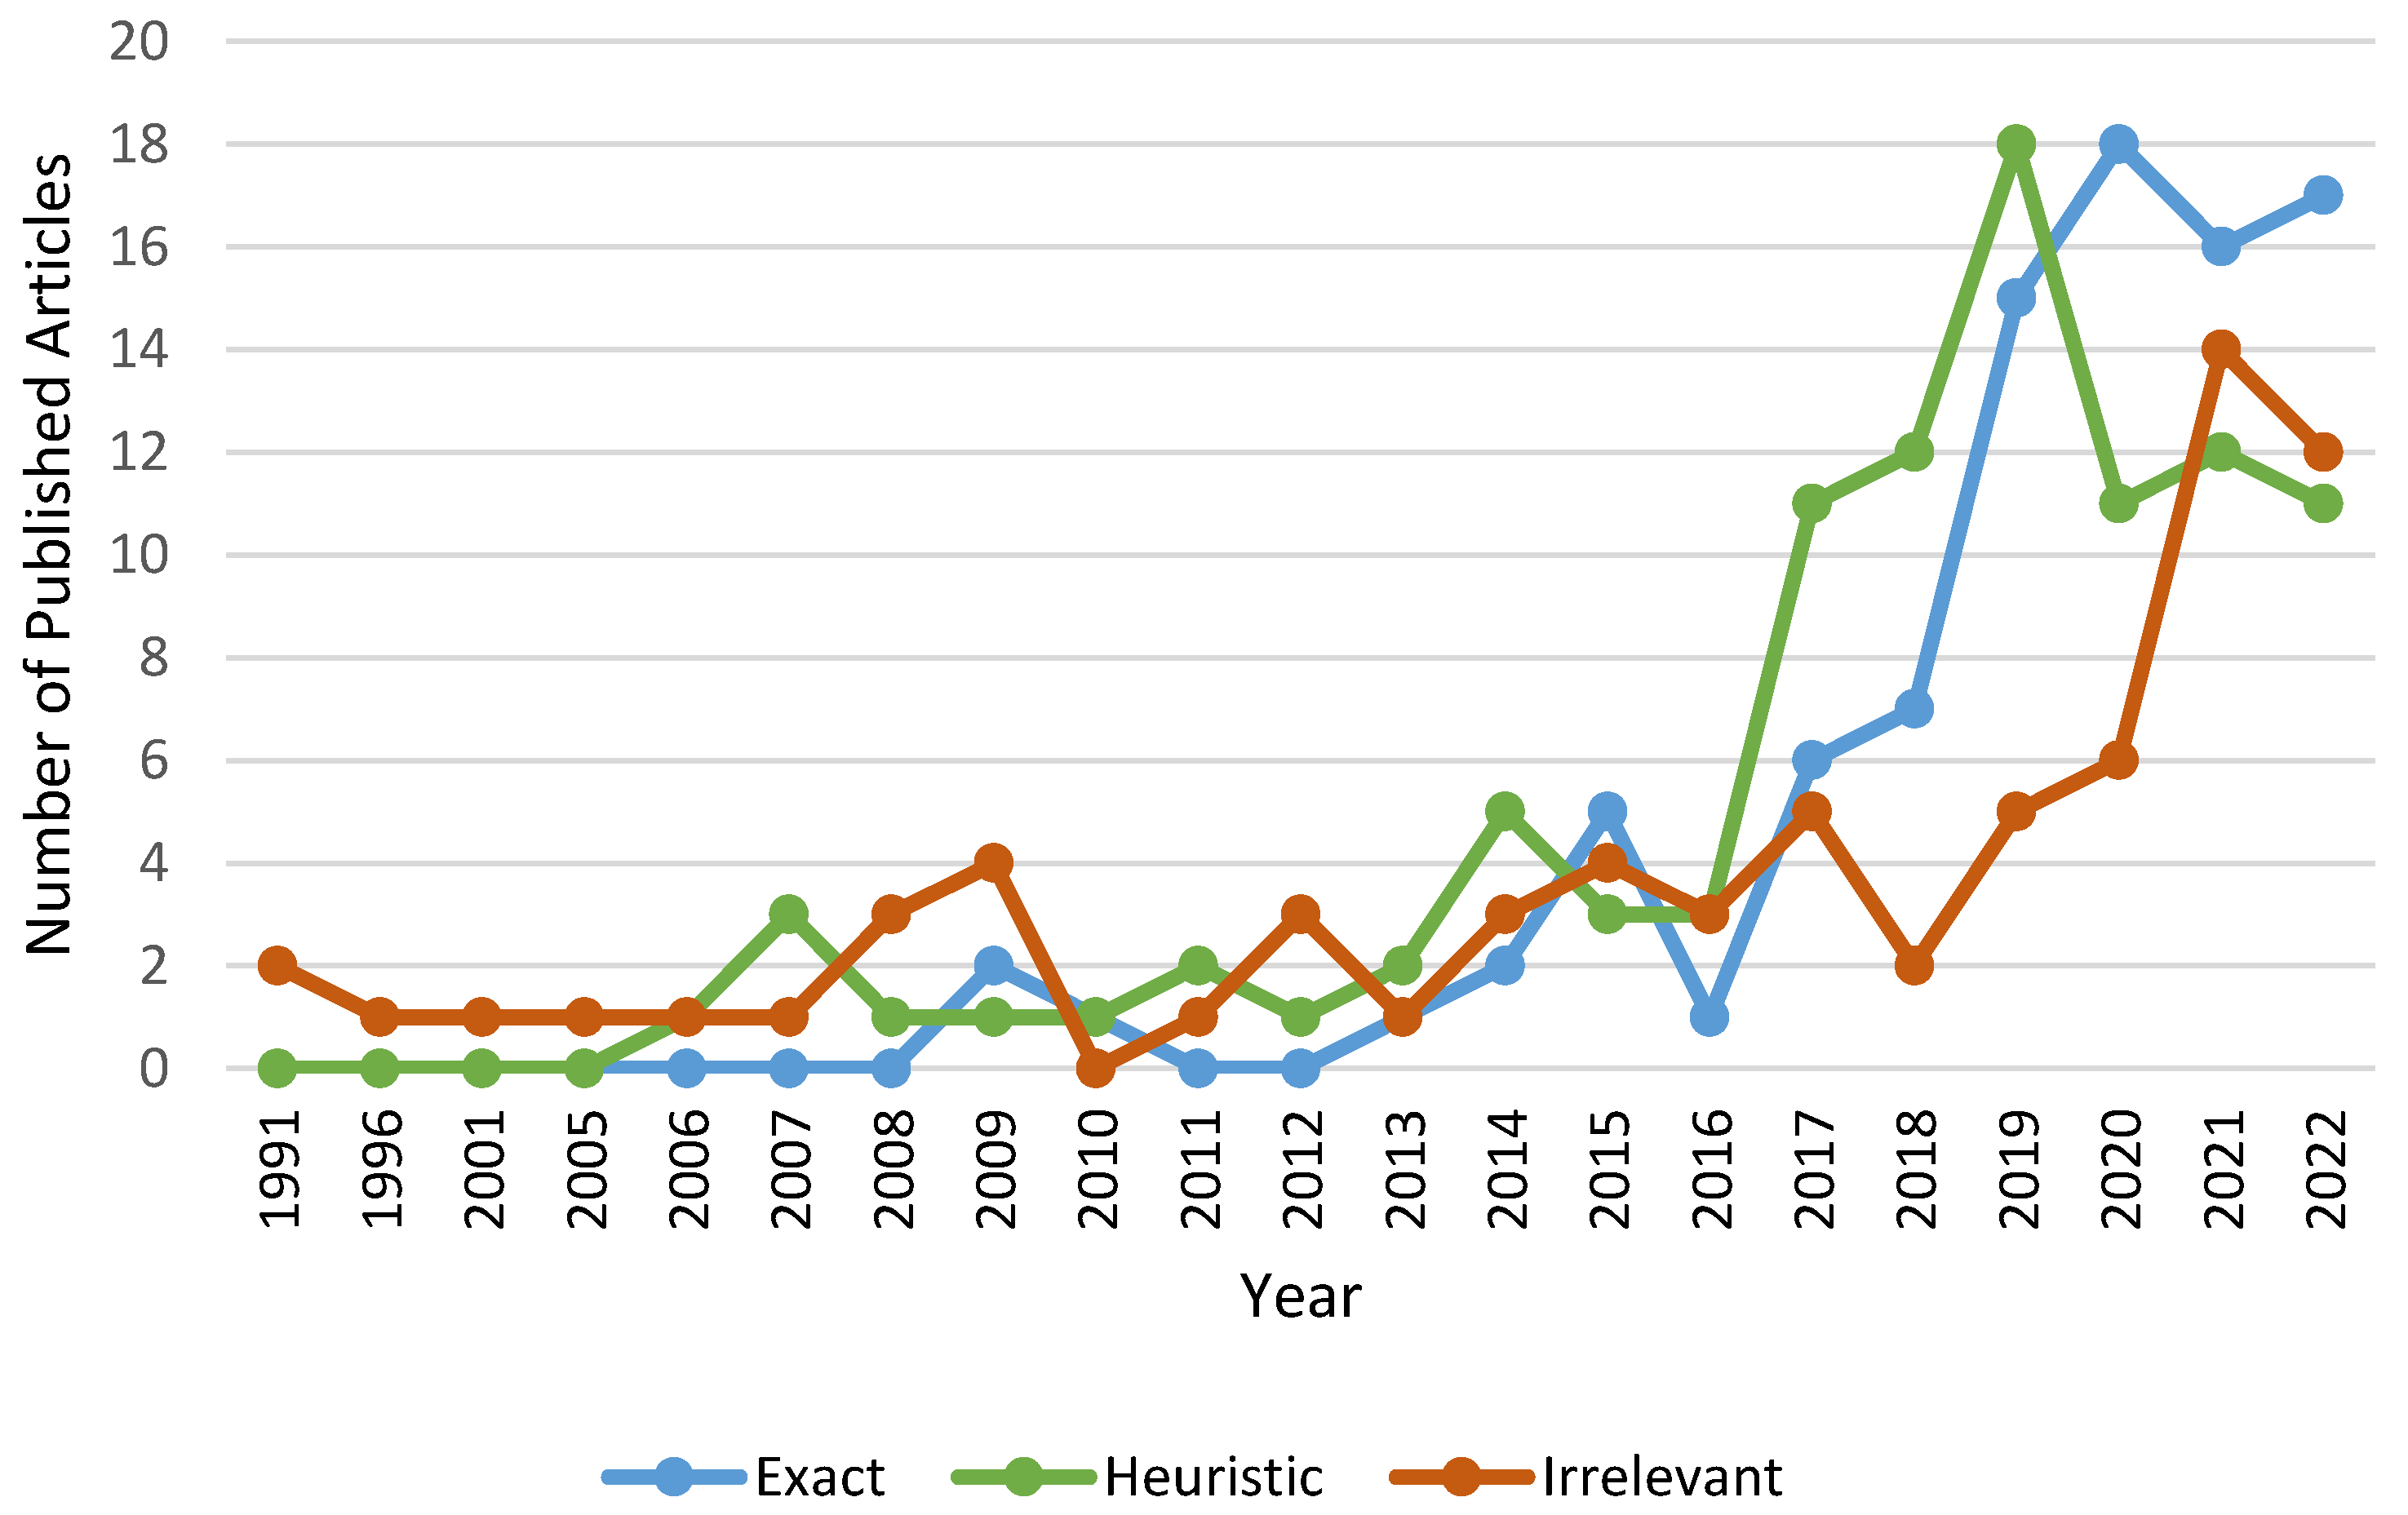
- In the existing literature, features like different donation technologies, lateral transshipment opportunities, and mismatching policies are mainly investigated in the single stage. However, a holistic view with multi-product, multi-stage consideration will reveal the actual effect of these modifications. Since the model grows bigger when it is addressed with a holistic view, it will be harder to find a solution. Accordingly, it would be appropriate to obtain near-optimal solutions by developing heuristic methodologies for these models.
- Adapting new technologies to the BSC is another research direction for future works. Blockchain implementation may be an opportunity to increase the perception of equal treatment in product allocation, as well as promote the collaboration between the non-interacted units in the same horizontal stage of the BSC hierarchy like hospitals. Since there is a time limit to separate whole blood into blood products, the internet of things (IoT) will be an appropriate way to increase the traceability of whole blood in the collection stage. Likewise, tracing the blood products may be more practical thanks to the IoT.
7. Conclusions
Author Contributions
Funding
Data Availability Statement
Conflicts of Interest
References
- Beliën, J.; Forcé, H. Supply Chain Management of Blood Products: A Literature Review. Eur. J. Oper. Res. 2012, 217, 1–16. [Google Scholar] [CrossRef]
- Osorio, A.F.; Brailsford, S.C.; Smith, H.K. A Structured Review of Quantitative Models in the Blood Supply Chain: A Taxonomic Framework for Decision-Making. Int. J. Prod. Res. 2015, 53, 7191–7212. [Google Scholar] [CrossRef]
- Fahimnia, B.; Jabbarzadeh, A.; Ghavamifar, A.; Bell, M. Supply Chain Design for Efficient and Effective Blood Supply in Disasters Behnam. Int. J. Prod. Econ. 2017, 183, 700–709. [Google Scholar] [CrossRef]
- Kendall, K.E.; Lee, S.M. Formulating Blood Rotation Policies with Multiple Objectives. Manag. Sci. 1980, 26, 1145–1157. [Google Scholar] [CrossRef]
- Prastacos, G.P. Blood Inventory Management: An Overview of Theory and Practice. Manag. Sci. 1984, 30, 777–800. [Google Scholar] [CrossRef]
- Şahin, G.; Süral, H.; Meral, S. Locational Analysis for Regionalization of Turkish Red Crescent Blood Services. Comput. Oper. Res. 2007, 34, 692–704. [Google Scholar] [CrossRef]
- Jabbarzadeh, A.; Fahimnia, B.; Seuring, S. Dynamic Supply Chain Network Design for the Supply of Blood in Disasters: A Robust Model with Real World Application. Transp. Res. Part E Logist. Transp. Rev. 2014, 70, 225–244. [Google Scholar] [CrossRef]
- Hamdan, B.; Diabat, A. A Two-Stage Multi-Echelon Stochastic Blood Supply Chain Problem. Comput. Oper. Res. 2019, 101, 130–143. [Google Scholar] [CrossRef]
- Hamdan, B.; Diabat, A. Robust Design of Blood Supply Chains under Risk of Disruptions Using Lagrangian Relaxation. Transp. Res. Part E Logist. Transp. Rev. 2020, 134, 101764. [Google Scholar] [CrossRef]
- Osorio, A.F.; Brailsford, S.C.; Smith, H.K.; Blake, J. Designing the Blood Supply Chain: How Much, How and Where? Vox Sang. 2018, 113, 760–769. [Google Scholar] [CrossRef]
- Samani, M.R.G.; Torabi, S.A.; Hosseini-Motlagh, S.M. Integrated Blood Supply Chain Planning for Disaster Relief. Int. J. Disaster Risk Reduct. 2018, 27, 168–188. [Google Scholar] [CrossRef]
- Zahiri, B.; Pishvaee, M.S. Blood Supply Chain Network Design Considering Blood Group Compatibility under Uncertainty. Int. J. Prod. Res. 2017, 55, 2013–2033. [Google Scholar] [CrossRef]
- Pirabán, A.; Guerrero, W.J.; Labadie, N. Survey on Blood Supply Chain Management: Models and Methods. Comput. Oper. Res. 2019, 112, 104756. [Google Scholar] [CrossRef]
- Blake, J.T. An Introduction to Platelet Inventory and Ordering Problems. In Wiley Encyclopedia of Operations Research and Management Science; Wiley: Hoboken, NJ, USA, 2010. [Google Scholar]
- Baş Güre, S.; Carello, G.; Lanzarone, E.; Yalçındağ, S. Unaddressed Problems and Research Perspectives in Scheduling Blood Collection from Donors. Prod. Plan. Control 2018, 29, 84–90. [Google Scholar] [CrossRef]
- Khomenko, L.; Saher, L.; Jan, P. Analysis of the Marketing Activities in the Blood Service: Bibliometric Analysis. Health Econ. Manag. Rev. 2020, 1, 20–36. [Google Scholar] [CrossRef]
- Asadpour, M.; Olsen, T.L.; Boyer, O. An Updated Review on Blood Supply Chain Quantitative Models: A Disaster Perspective. Transp. Res. Part E Logist. Transp. Rev. 2022, 158, 102583. [Google Scholar] [CrossRef]
- Meneses, M.; Santos, D.; Barbosa-Póvoa, A. Modeling the Blood Supply Chain–From Strategic to Tactical Decisions. Eur. J. Oper. Res. 2023, 307, 499–518. [Google Scholar] [CrossRef]
- Eghtesadifard, M.; Jozan, F. A Systematic Literature Review on the Blood Supply Chain: Exploring the Trend and Future Research Directions. J. Ambient Intell. Humaniz. Comput. 2022, 13, 1173–1200. [Google Scholar] [CrossRef]
- Pierskalla, W.P. Supply Chain Management of Blood Banks. In Operations Research and Health Care; Kluwer Academic Publishers: Dordrecht, The Netherlands, 2005; pp. 103–145. [Google Scholar]
- Rowley, J.; Slack, F. Conducting a Literature Review. Manag. Res. News 2004, 27, 31–39. [Google Scholar] [CrossRef]
- Fahimnia, B.; Tang, C.S.; Davarzani, H.; Sarkis, J. Quantitative Models for Managing Supply Chain Risks: A Review. Eur. J. Oper. Res. 2015, 247, 1–15. [Google Scholar] [CrossRef]
- Fahimnia, B.; Sarkis, J.; Davarzani, H. Green Supply Chain Management: A Review and Bibliometric Analysis. Int. J. Prod. Econ. 2015, 162, 101–114. [Google Scholar] [CrossRef]
- Mishra, D.; Gunasekaran, A.; Papadopoulos, T.; Childe, S.J. Big Data and Supply Chain Management: A Review and Bibliometric Analysis. Ann. Oper. Res. 2018, 270, 313–336. [Google Scholar] [CrossRef] [Green Version]
- Davarzani, H.; Fahimnia, B.; Bell, M.; Sarkis, J. Greening Ports and Maritime Logistics: A Review. Transp. Res. Part D Transp. Environ. 2016, 48, 473–487. [Google Scholar] [CrossRef]
- Mongeon, P.; Paul-Hus, A. The Journal Coverage of Web of Science and Scopus: A Comparative Analysis. Scientometrics 2016, 106, 213–228. [Google Scholar] [CrossRef]
- Web of Science. Available online: https://clarivate.libguides.com/webofscienceplatform/coverage (accessed on 10 November 2021).
- Moral-Muñoz, J.A.; Herrera-Viedma, E.; Santisteban-Espejo, A.; Cobo, M.J. Software Tools for Conducting Bibliometric Analysis in Science: An up-to-Date Review. Prof. Inf. 2020, 29, 1–20. [Google Scholar] [CrossRef] [Green Version]
- Chehbi-Gamoura, S.; Derrouiche, R.; Damand, D.; Barth, M. Insights from Big Data Analytics in Supply Chain Management: An All-Inclusive Literature Review Using the SCOR Model. Prod. Plan. Control 2020, 31, 355–382. [Google Scholar] [CrossRef]
- Persson, O.; Danell, R.D.; Schneider, J.W. Celebrating Scholarly Communication Studies: A Festschrift for Olle Persson at His 60th Birthday; ISSI; International Society for Scientometrics and Informetrics: Bloomington, IN, USA, 2009; pp. 1–95. [Google Scholar]
- Dahesh, M.B.; Tabarsa, G.; Zandieh, M.; Hamidizadeh, M. Reviewing the Intellectual Structure and Evolution of the Innovation Systems Approach: A Social Network Analysis. Technol. Soc. 2020, 63, 101399. [Google Scholar] [CrossRef]
- Reong, S.; Wee, H.M.; Hsiao, Y.L. 20 Years of Particle Swarm Optimization Strategies for the Vehicle Routing Problem: A Bibliometric Analysis. Mathematics 2022, 10, 3669. [Google Scholar] [CrossRef]
- Diaby, V.; Campbell, K.; Goeree, R. Multi-Criteria Decision Analysis (MCDA) in Health Care: A Bibliometric Analysis. Oper. Res. Health Care 2013, 2, 20–24. [Google Scholar] [CrossRef]
- Katsaliaki, K.; Brailsford, S.C. Using Simulation to Improve the Blood Supply Chain. J. Oper. Res. Soc. 2007, 58, 219–227. [Google Scholar] [CrossRef]
- Hemmelmayr, V.; Doerner, K.F.; Hartl, R.F.; Savelsbergh, M.W.P. Vendor Managed Inventory for Environments with Stochastic Product Usage. Eur. J. Oper. Res. 2010, 202, 686–695. [Google Scholar] [CrossRef]
- Dillon, M.; Oliveira, F.; Abbasi, B. A Two-Stage Stochastic Programming Model for Inventory Management in the Blood Supply Chain. Int. J. Prod. Econ. 2017, 187, 27–41. [Google Scholar] [CrossRef]
- Duan, Q.; Liao, T.W. Optimization of Blood Supply Chain with Shortened Shelf Lives and ABO Compatibility. Int. J. Prod. Econ. 2014, 153, 113–129. [Google Scholar] [CrossRef]
- Ramezanian, R.; Behboodi, Z. Blood Supply Chain Network Design under Uncertainties in Supply and Demand Considering Social Aspects. Transp. Res. Part E Logist. Transp. Rev. 2017, 104, 69–82. [Google Scholar] [CrossRef]
- Gunpinar, S.; Centeno, G. Stochastic Integer Programming Models for Reducing Wastages and Shortages of Blood Products at Hospitals. Comput. Oper. Res. 2015, 54, 129–141. [Google Scholar] [CrossRef]
- Van Dijk, N.; Haijema, R.; Van Der Wal, J.; Sibinga, C.S. Blood Platelet Production: A Novel Approach for Practical Optimization. Transfusion 2009, 49, 411–420. [Google Scholar] [CrossRef] [PubMed]
- Haijema, R.; van der Wal, J.; van Dijk, N.M. Blood Platelet Production: Optimization by Dynamic Programming and Simulation. Comput. Oper. Res. 2007, 34, 760–779. [Google Scholar] [CrossRef]
- Hosseinifard, Z.; Abbasi, B. The Inventory Centralization Impacts on Sustainability of the Blood Supply Chain. Comput. Oper. Res. 2018, 89, 206–212. [Google Scholar] [CrossRef]
- Nagurney, A.; Masoumi, A.; Yu, M. Supply Chain Network Operations Management of a Blood Banking System with Cost and Risk Minimization. Comput. Manag. Sci. 2012, 9, 205–231. [Google Scholar] [CrossRef]
- Zhou, D.; Leung, L.C.; Pierskalla, W.P. Inventory Management of Platelets in Hospitals: Optimal Inventory Policy for Perishable Products with Emergency Replenishments. Manuf. Serv. Oper. Manag. 2011, 13, 420–438. [Google Scholar] [CrossRef]
- Sha, Y.; Huang, J. The Multi-Period Location-Allocation Problem of Engineering Emergency Blood Supply Systems. Syst. Eng. Procedia 2012, 5, 21–28. [Google Scholar] [CrossRef] [Green Version]
- Nahmias, S. Perishable Inventory Theory: A Review. Oper. Res. 1982, 30, 680–708. [Google Scholar] [CrossRef] [PubMed]
- Ghandforoush, P.; Sen, T.K. A DSS to Manage Platelet Production Supply Chain for Regional Blood Centers. Decis. Support. Syst. 2010, 50, 32–42. [Google Scholar] [CrossRef]
- Haijema, R.; van Dijk, N.; van der Wal, J.; Smit Sibinga, C. Blood Platelet Production with Breaks: Optimization by SDP and Simulation. Int. J. Prod. Econ. 2009, 121, 464–473. [Google Scholar] [CrossRef]
- Zahiri, B.; Torabi, S.A.; Mousazadeh, M.; Mansouri, S.A. Blood Collection Management: Methodology and Application. Appl. Math. Model. 2015, 39, 7680–7696. [Google Scholar] [CrossRef]
- Abdulwahab, U.; Wahab, M.I.M. Approximate Dynamic Programming Modeling for a Typical Blood Platelet Bank. Comput. Ind. Eng. 2014, 78, 259–270. [Google Scholar] [CrossRef]
- Salehi, F.; Mahootchi, M.; Husseini, S.M.M. Developing a Robust Stochastic Model for Designing a Blood Supply Chain Network in a Crisis: A Possible. Ann. Oper. Res. 2017, 283, 679–703. [Google Scholar] [CrossRef]
- Narin, F.; Hamilton, K.S. Bibliometric Performance Measures. Budapest Sci. 1996, 36, 293–310. [Google Scholar] [CrossRef]
- Bollen, J.; Rodriguez, M.A.; Van De Sompel, H. Journal Status. Budapest Sci. 2006, 69, 669–687. [Google Scholar] [CrossRef] [Green Version]
- Garfield, E. Is Citation Analysis a Legitimate Evaluation Tool? Scientometrics 1979, 1, 359–375. [Google Scholar] [CrossRef]
- Brin, S.; Page, L. The Anatomy of a Large-Scale Hypertextual Web Search Engine. Comput. Netw. ISDN Syst. 1998, 30, 107–117. [Google Scholar] [CrossRef]
- Hjørland, B. Citation Analysis: A Social and Dynamic Approach to Knowledge Organization. Inf. Process. Manag. 2013, 49, 1313–1325. [Google Scholar] [CrossRef]
- Yan, E.; Ding, Y. Scholarly Network Similarities: How Bibliographic Coupling Networks, Citation Networks, Cocitation Networks, Topical Networks, Coauthorship Networks, and Coword Networks Relate to Each Other. J. Am. Soc. Inf. Sci. Technol. 2012, 63, 1313–1326. [Google Scholar] [CrossRef]
- Blondel, V.D.; Guillaume, J.L.; Lambiotte, R.; Lefebvre, E. Fast Unfolding of Communities in Large Networks. J. Stat. Mech. Theory Exp. 2008, 2008, P10008. [Google Scholar] [CrossRef] [Green Version]
- Dehghani, M.; Abbasi, B. An Age-Based Lateral-Transshipment Policy for Perishable Items. Int. J. Prod. Econ. 2018, 198, 93–103. [Google Scholar] [CrossRef]
- Wang, K.M.; Ma, Z.J. Age-Based Policy for Blood Transshipment during Blood Shortage. Transp. Res. Part E Logist. Transp. Rev. 2015, 80, 166–183. [Google Scholar] [CrossRef]
- Rajendran, S.; Ravi Ravindran, A. Inventory Management of Platelets along Blood Supply Chain to Minimize Wastage and Shortage. Comput. Ind. Eng. 2019, 130, 714–730. [Google Scholar] [CrossRef]
- Katsaliaki, K. Cost-Effective Practices in the Blood Service Sector. Health Policy 2008, 86, 276–287. [Google Scholar] [CrossRef]
- Clay, N.M.N.; Abbasi, B.; Research, A.E.; Eberhard, A.; Hearne, J. On the Volatility of Blood Inventories. Int. Trans. Oper. Res. 2018, 25, 215–242. [Google Scholar] [CrossRef]
- Rytile, J.S.; Spens, K.M. Using Simulation to Increase Efficiency in Blood Supply Chains. Manag. Res. News 2006, 29, 801–819. [Google Scholar] [CrossRef]
- Rajendran, S.; Ravindran, A.R. Platelet Ordering Policies at Hospitals Using Stochastic Integer Programming Model and Heuristic Approaches to Reduce Wastage. Comput. Ind. Eng. 2017, 110, 151–164. [Google Scholar] [CrossRef]
- Karaesmen, I.Z.; Scheller-Wolf, A.; Deniz, B. Managing Perishable and Aging Inventories: Review and Future Research Directions. In International Series in Operations Research and Management Science; Springer: New York, NY, USA, 2011; Volume 151, pp. 393–436. [Google Scholar]
- Hemmelmayr, V.; Doerner, K.F.; Hartl, R.F.; Savelsbergh, M.W.P. Delivery Strategies for Blood Products Supplies. OR Spectr. 2009, 31, 707–725. [Google Scholar] [CrossRef]
- Abbasi, B.; Hosseinifard, S.Z. On the Issuing Policies for Perishable Items Such as Red Blood Cells and Platelets in Blood Service. Decis. Sci. 2014, 45, 995–1020. [Google Scholar] [CrossRef]
- Civelek, I.; Karaesmen, I.; Scheller-Wolf, A. Blood Platelet Inventory Management with Protection Levels. Eur. J. Oper. Res. 2015, 243, 826–838. [Google Scholar] [CrossRef]
- Kopach, R.; Balcioǧlu, B.; Carter, M. Tutorial on Constructing a Red Blood Cell Inventory Management System with Two Demand Rates. Eur. J. Oper. Res. 2008, 185, 1051–1059. [Google Scholar] [CrossRef]
- Abbasi, B.; Vakili, G.; Chesneau, S. Impacts of Reducing the Shelf Life of Red Blood Cells: A View from down Under. Interfaces 2017, 47, 336–351. [Google Scholar] [CrossRef]
- Duan, Q.; Liao, T.W. A New Age-Based Replenishment Policy for Supply Chain Inventory Optimization of Highly Perishable Products. Int. J. Prod. Econ. 2013, 145, 658–671. [Google Scholar] [CrossRef]
- Delen, D.; Erraguntla, M.; Mayer, R.J.; Wu, C.-N.; Delen, D.; Erraguntla, M.; Mayer, R.J.; Wu, C.-N.; Mayer, R.J. Better Management of Blood Supply-Chain with GIS-Based Analytics. Ann. Oper. Res. 2011, 185, 181–193. [Google Scholar] [CrossRef]
- Sarhangian, V.; Abouee-Mehrizi, H.; Baron, O.; Berman, O. Threshold-Based Allocation Policies for Inventory Management of Red Blood Cells. Manuf. Serv. Oper. Manag. 2018, 20, 347–362. [Google Scholar] [CrossRef]
- Pierskalla, W.P.; Roach, C.D. Optimal Issuing Policies for Perishable Inventory. Manag. Sci. 1972, 19, 603–614. [Google Scholar] [CrossRef]
- Brodheim, E.; Derman, C.; Prastacos, G. On the Evaluation of a class of inventory policies for perishable products such as blood. Manage. Sci. 1975, 21, 1320–1325. [Google Scholar] [CrossRef]
- Rajendran, S.; Srinivas, S. Hybrid Ordering Policies for Platelet Inventory Management under Demand Uncertainty. IISE Trans. Healthc. Syst. Eng. 2019, 10, 113–126. [Google Scholar] [CrossRef]
- Pegels, C.C.; Jelmert, A.E. An Evaluation of Blood-Inventory Policies: A Markov Chain Application. Oper. Res. 1970, 18, 1087–1098. [Google Scholar] [CrossRef]
- Cohen, M.A.; Pierskalla, W.P. Target Inventory Levels for a Hospital Blood Bank or a Decentralized Regional Blood Banking System. Transfusion 1979, 19, 444–454. [Google Scholar] [CrossRef] [PubMed]
- Alshamrani, A.; Mathur, K.; Ballou, R.H. Reverse Logistics: Simultaneous Design of Delivery Routes and Returns Strategies. Comput. Oper. Res. 2007, 34, 595–619. [Google Scholar] [CrossRef]
- Veihola, M.; Aroviita, P.; Linna, M.; Sintonen, H.; Kekomäki, R. International Comparison of the Technical Efficiency of Component Preparation. Transfusion 2006, 46, 2109–2114. [Google Scholar] [CrossRef] [PubMed]
- Mustafee, N.; Taylor, S.J.E.; Katsaliaki, K.; Brailsford, S. Facilitating the Analysis of a UK National Blood Service Supply Chain Using Distributed Simulation. Simulation 2009, 85, 113–128. [Google Scholar] [CrossRef] [Green Version]
- Masoumi, A.H.; Yu, M.; Nagurney, A. Mergers and Acquisitions in Blood Banking Systems: A Supply Chain Network Approach. Int. J. Prod. Econ. 2017, 193, 406–421. [Google Scholar] [CrossRef]
- Yaghoubi, S.; Hosseini-Motlagh, S.M.; Cheraghi, S.; Gilani Larimi, N. Designing a Robust Demand-Differentiated Platelet Supply Chain Network under Disruption and Uncertainty. J. Ambient Intell. Humaniz. Comput. 2020, 11, 3231–3258. [Google Scholar] [CrossRef]
- Salazar-Concha, C.; Ramírez-Correa, P.; Karwowski, W.; Parsaei, B.; Parsaei, H.R.; Carlos, J.; Alcantud, R. Predicting the Intention to Donate Blood among Blood Donors Using a Decision Tree Algorithm. Symmetry 2021, 13, 1460. [Google Scholar] [CrossRef]
- Lin, S.W.; Anisa, K.N.; Chen, Y.C. Effects of Meteorological Factors on Blood Donation. Transfus. Apher. Sci. 2020, 59, 102901. [Google Scholar] [CrossRef] [PubMed]
- Chen, X.; Liu, L.; Guo, X. Analysing Repeat Blood Donation Behavior via Big Data. Ind. Manag. Data Syst. 2021, 121, 192–208. [Google Scholar] [CrossRef]
- AlZu’bi, S.; Aqel, D.; Lafi, M. An Intelligent System for Blood Donation Process Optimization-Smart Techniques for Minimizing Blood Wastages. Cluster Comput. 2022, 25, 3617–3627. [Google Scholar] [CrossRef]
- Saltzmann, C.; Boenigk, S. Blood Donors’ Usage Intentions of Donation Appointment-Scheduling Systems during the COVID-19 Pandemic and Beyond. J. Philanthr. Mark. 2022, 27, e1756. [Google Scholar] [CrossRef]
- Kauten, C.; Gupta, A.; Qin, X.; Richey, G. Predicting Blood Donors Using Machine Learning Techniques. Inf. Syst. Front. 2021, 24, 1547–1562. [Google Scholar] [CrossRef]
- Zhang, X.; Zhao, X.; Mou, X.; Tan, M. Mixed Time Series Approaches for Forecasting the Daily Number of Hospital Blood Collections. Int. J. Health Plan. Manag. 2021, 36, 1714. [Google Scholar] [CrossRef]
- Shih, H.; Rajendran, S. Comparison of Time Series Methods and Machine Learning Algorithms for Forecasting Taiwan Blood Services Foundation’s Blood Supply. J. Healthc. Eng. 2019, 2019, 6123745. [Google Scholar] [CrossRef] [PubMed]
- Özener, O.Ö.; Ekici, A.; Çoban, E. Improving Blood Products Supply Through Donation Tailoring. Comput. Oper. Res. 2019, 102, 10–21. [Google Scholar] [CrossRef]
- Fortsch, S.M.; Perera, S. A Resilient Donor Arrival Policy for Blood. Oper. Res. Health Care 2018, 19, 165–174. [Google Scholar] [CrossRef]
- Yalçındağ, S.; Baş Güre, S.; Carello, G.; Lanzarone, E. A Stochastic Risk-Averse Framework for Blood Donation Appointment Scheduling under Uncertain Donor Arrivals. Health Care Manag. Sci. 2020, 23, 535–555. [Google Scholar] [CrossRef]
- Mobasher, A.; Ekici, A.; Özener, O.Ö.; Örsan, O. Computers & Industrial Engineering Coordinating Collection and Appointment Scheduling Operations at the Blood Donation Sites Q. Comput. Ind. Eng. 2015, 87, 260–266. [Google Scholar] [CrossRef]
- Şahinyazan, F.G.; Kara, B.Y.; Taner, M.R. Selective Vehicle Routing for a Mobile Blood Donation System. Eur. J. Oper. Res. 2015, 245, 22–34. [Google Scholar] [CrossRef] [Green Version]
- Haitam, E.; Najat, R.; Abouchabaka, J. A Vehicle Routing Problem for the Collection of Medical Samples at Home: Case Study of Morocco. Int. J. Adv. Comput. Sci. Appl. 2021, 12, 2021. [Google Scholar] [CrossRef]
- Özener, O.Ö.; Ekici, A. Managing Platelet Supply through Improved Routing of Blood Collection Vehicles. Comput. Oper. Res. 2018, 98, 113–126. [Google Scholar] [CrossRef]
- Rabbani, M.; Aghabegloo, M.; Farrokhi-Asl, H. Solving a Bi-Objective Mathematical Programming Model for Bloodmobiles Location Routing Problem. Int. J. Ind. Eng. Comput. 2017, 8, 19–32. [Google Scholar] [CrossRef]
- Doerner, K.F.; Gronalt, M.; Hartl, R.F.; Kiechle, G.; Reimann, M. Exact and Heuristic Algorithms for the Vehicle Routing Problem with Multiple Interdependent Time Windows. Comput. Oper. Res. 2008, 35, 3034–3048. [Google Scholar] [CrossRef]
- Gunpinar, S.; Centeno, G. An Integer Programming Approach to the Bloodmobile Routing Problem. Transp. Res. Part E Logist. Transp. Rev. 2016, 86, 94–115. [Google Scholar] [CrossRef]
- Pirabán-Ramírez, A.; Guerrero-Rueda, W.J.; Labadie, N. The Multi-Trip Vehicle Routing Problem with Increasing Profits for the Blood Transportation: An Iterated Local Search Metaheuristic. Comput. Ind. Eng. 2022, 170, 108294. [Google Scholar] [CrossRef]
- Veihola, M.; Aroviita, P.; Linna, M.; Sintonen, H.; Kekomäki, R. Variation of Platelet Production and Discard Rates in 17 Blood Centers Representing 10 European Countries from 2000 to 2002. Transfusion 2006, 46, 991–995. [Google Scholar] [CrossRef]
- Mousazadeh, S.; Darestani, S.A. Modeling a Production-Inventory-Routing Problem of Blood Products Using Heuristic Solution Methods. J. Intell. Fuzzy Syst. 2019, 37, 5589–5609. [Google Scholar] [CrossRef]
- Attari, M.Y.N.; Jami, E.N. Robust Stochastic Multi-Choice Goal Programming for Blood Collection and Distribution Problem with Real Application. J. Intell. Fuzzy Syst. 2018, 35, 2015–2033. [Google Scholar] [CrossRef]
- Habibi-Kouchaksaraei, M.; Paydar, M.M.; Asadi-Gangraj, E. Designing a Bi-Objective Multi-Echelon Robust Blood Supply Chain in a Disaster. Appl. Math. Model. 2018, 55, 583–599. [Google Scholar] [CrossRef]
- Eskandari-Khanghahi, M.; Tavakkoli-Moghaddam, R.; Taleizadeh, A.A.; Amin, S.H. Designing and Optimizing a Sustainable Supply Chain Network for a Blood Platelet Bank under Uncertainty. Eng. Appl. Artif. Intell. 2018, 71, 236–250. [Google Scholar] [CrossRef]
- Glasgow, S.M.; Perkins, Z.B.; Tai, N.R.M.; Brohi, K.; Vasilakis, C. Development of a Discrete Event Simulation Model for Evaluating Strategies of Red Blood Cell Provision Following Mass Casualty Events. Eur. J. Oper. Res. 2018, 270, 362–374. [Google Scholar] [CrossRef]
- Yousefi Nejad Attari, M.; Pasandideh, S.H.R.; Akhavan Niaki, S.T. A Hybrid Robust Stochastic Programming for a Bi-Objective Blood Collection Facilities Problem (Case Study: Iranian Blood Transfusion Network). J. Ind. Prod. Eng. 2019, 36, 154–167. [Google Scholar] [CrossRef]
- Haijema, R. A New Class of Stock-Level Dependent Ordering Policies for Perishables with a Short Maximum Shelf Life. Int. J. Prod. Econ. 2013, 143, 434–439. [Google Scholar] [CrossRef]
- Li, N.; Arnold, D.M.; Down, D.G.; Barty, R.; Blake, J.; Chiang, F.; Courtney, T.; Waito, M.; Trifunov, R.; Heddle, N.M. From Demand Forecasting to Inventory Ordering Decisions for Red Blood Cells through Integrating Machine Learning, Statistical Modeling, and Inventory Optimization. Transfusion 2022, 62, 87–99. [Google Scholar] [CrossRef]
- Luo, Z.; Chen, X. Ordering Policies for Heterogeneous Platelets Demand with Unreliable Supply and Substitution. J. Oper. Res. Soc. 2021, 73, 919–935. [Google Scholar] [CrossRef]
- Meneses, M.; Marques, I.; Barbosa-Póvoa, A. Blood Inventory Management: Ordering Policies for Hospital Blood Banks under Uncertainty. Int. Trans. Oper. Res. 2021, 30, 273–301. [Google Scholar] [CrossRef]
- Haijema, R. Optimal Ordering, Issuance and Disposal Policies for Inventory Management of Perishable Products. Int. J. Prod. Econ. 2014, 157, 158–169. [Google Scholar] [CrossRef]
- Lowalekar, H.; Nilakantan, R.; Ravichandran, N. Analysis of an Order-up-to-Level Policy for Perishables with Random Issuing. J. Oper. Res. Soc. 2016, 67, 483–505. [Google Scholar] [CrossRef]
- Sarhangian, V.; Abouee-Mehrizi, H.; Baron, O.; Berman, O.; Heddle, N.M.; Barty, R. Reducing the Age of Transfused Red Blood Cells in Hospitals: Ordering and Allocation Policies. Vox Sang. 2016, 110, 385–392. [Google Scholar] [CrossRef]
- Fanoodi, B.; Malmir, B.; Jahantigh, F.F. Reducing Demand Uncertainty in the Platelet Supply Chain through Artificial Neural Networks and ARIMA Models. Comput. Biol. Med. 2019, 113, 103415. [Google Scholar] [CrossRef]
- Li, N.; Chiang, F.; Down, D.G.; Heddle, N.M. A Decision Integration Strategy for Short-Term Demand Forecasting and Ordering for Red Blood Cell Components. Oper. Res. Health Care 2021, 29, 100290. [Google Scholar] [CrossRef]
- Fortsch, S.M.; Khapalova, E.A. Reducing Uncertainty in Demand for Blood. Oper. Res. Health Care 2016, 9, 16–28. [Google Scholar] [CrossRef]
- Sun, X.; Xu, Z.; Feng, Y.; Yang, Q.; Xie, Y.; Wang, D.; Yu, Y. RBC Inventory-Management System Based on XGBoost Model. Indian J. Hematol. Blood Transfus. 2021, 37, 126–133. [Google Scholar] [CrossRef]
- Grasas, A.; Pereira, A.; Bosch, M.A.; Ortiz, P.; Puig, L. Feasibility of Reducing the Maximum Shelf Life of Red Blood Cells Stored in Additive Solution: A Dynamic Simulation Study Involving a Large Regional Blood System. Vox Sang. 2015, 108, 233–242. [Google Scholar] [CrossRef]
- Blake, J.T. Determining the Inventory Impact of Extended-Shelf-Life Platelets with a Network Simulation Model. Transfusion 2017, 57, 3001–3008. [Google Scholar] [CrossRef]
- Rashidzadeh, E.; Mohammad, S.; Molana, H.; Soltani, R.; Hafezalkotob, A. Assessing the Sustainability of Using Drone Technology for Last-Mile Delivery in a Blood Supply Chain. J. Model. Manag. 2021, 16, 1376–1402. [Google Scholar] [CrossRef]
- Dhote, J.; Limbourg, S. Designing Unmanned Aerial Vehicle Networks for Biological Material Transportation–The Case of Brussels. Comput. Ind. Eng. 2020, 148, 106652. [Google Scholar] [CrossRef]
- Farrokhizadeh, E.; Seyfi-Shishavan, S.A.; Satoglu, S.I. Blood Supply Planning during Natural Disasters under Uncertainty: A Novel Bi-Objective Model and an Application for Red Crescent. Ann. Oper. Res. 2022, 319, 73–113. [Google Scholar] [CrossRef]
- Khan, S.I.; Qadir, Z.; Munawar, H.S.; Nayak, S.R.; Budati, A.K.; Verma, K.D.; Prakash, D. UAVs Path Planning Architecture for Effective Medical Emergency Response in Future Networks. Phys. Commun. 2021, 47, 101337. [Google Scholar] [CrossRef]
- Nisingizwe, M.P.; Ndishimye, P.; Swaibu, K.; Nshimiyimana, L.; Karame, P.; Dushimiyimana, V.; Musabyimana, J.P.; Musanabaganwa, C.; Nsanzimana, S.; Law, M.R. Effect of Unmanned Aerial Vehicle (Drone) Delivery on Blood Product Delivery Time and Wastage in Rwanda: A Retrospective, Cross-Sectional Study and Time Series Analysis. Lancet Glob. Health 2022, 10, e564–e569. [Google Scholar] [CrossRef]
- Beiki, H.; Seyedhosseini, S.M.; Mihardjo, L.W.W.; Seyedaliakbar, S.M. Multiobjective Location-Routing Problem of Relief Commodities with Reliability. Environ. Sci. Pollut. Res. 2021, 1–10. [Google Scholar] [CrossRef]
- Hosseini-Motlagh, S.M.; Samani, M.R.G.; Homaei, S. Toward a Coordination of Inventory and Distribution Schedules for Blood in Disasters. Socioecon. Plan. Sci. 2020, 72, 100897. [Google Scholar] [CrossRef]
- Shokouhifar, M.; Sabbaghi, M.M.; Pilevari, N. Inventory Management in Blood Supply Chain Considering Fuzzy Supply/Demand Uncertainties and Lateral Transshipment. Transfus. Apher. Sci. 2021, 60, 103103. [Google Scholar] [CrossRef]
- Arani, M.; Chan, Y.; Liu, X.; Momenitabar, M. A Lateral Resupply Blood Supply Chain Network Design under Uncertainties. Appl. Math. Model. 2021, 93, 165–187. [Google Scholar] [CrossRef]
- Gilani Larimi, N.; Yaghoubi, S.; Hosseini-Motlagh, S.M. Itemized Platelet Supply Chain with Lateral Transshipment under Uncertainty Evaluating Inappropriate Output in Laboratories. Socioecon. Plan. Sci. 2019, 68, 100697. [Google Scholar] [CrossRef]
- Osorio, A.F.; Brailsford, S.C.; Smith, H.K. Whole Blood or Apheresis Donations? A Multi-Objective Stochastic Optimization Approach. Eur. J. Oper. Res. 2018, 266, 193–204. [Google Scholar] [CrossRef] [Green Version]
- American Red Croos Plasma, Platelets and Whole Blood|Red Cross Blood Services. Available online: https://www.redcrossblood.org/donate-blood/how-to-donate/types-of-blood-donations/blood-components.html (accessed on 26 March 2022).
- Turkulainen, E.V.; Wemelsfelder, M.L.; Janssen, M.P.; Arvas, M. A Robust Autonomous Method for Blood Demand Forecasting. Transfusion 2022, 62, 1261–1268. [Google Scholar] [CrossRef]
- Hosseini, K.M.; Ghasemzadeh, M. Implementation of Plasma Fractionation in Biological Medicines Production. Iran. J. Biotechnol. 2016, 14, 213. [Google Scholar] [CrossRef] [Green Version]
- Asadpour, M.; Boyer, O.; Tavakkoli-Moghaddam, R. A Blood Supply Chain Network with Backup Facilities Considering Blood Groups and Expiration Date: A Real-World Application. Int. J. Eng. Trans. B Appl. 2021, 34, 470–479. [Google Scholar] [CrossRef]
- Baghbani, B. A Mixed Integer Programming Optimization of Blood Plasma Supply Chain in the Uncertainty Conditions during COVID-19: A Real Case in Iran. Discret. Dyn. Nat. Soc. 2022, 2022, 3783119. [Google Scholar] [CrossRef]
- Ghasemi, P.; Goodarzian, F.; Abraham, A.; Khanchehzarrin, S. A Possibilistic-Robust-Fuzzy Programming Model for Designing a Game Theory Based Blood Supply Chain Network. Appl. Math. Model. 2022, 112, 282–303. [Google Scholar] [CrossRef] [PubMed]
- Li, N.; Zeller, M.P.; Shih, A.W.; Heddle, N.M.; St. John, M.; Bégin, P.; Callum, J.; Arnold, D.M.; Akbari-Moghaddam, M.; Down, D.G.; et al. A Data-Informed System to Manage Scarce Blood Product Allocation in a Randomized Controlled Trial of Convalescent Plasma. Transfusion 2022, 62, 2525–2538. [Google Scholar] [CrossRef] [PubMed]
- Hosseini-Motlagh, S.M.; Gilani Larimi, N.; Oveysi Nejad, M. A Qualitative, Patient-Centered Perspective toward Plasma Products Supply Chain Network Design with Risk Controlling. Oper. Res. 2022, 22, 779–824. [Google Scholar] [CrossRef]
- Ayer, T.; Zhang, C.; Zeng, C.; White, C.C.; Roshan Joseph, V. Analysis and Improvement of Blood Collection Operations. Manuf. Serv. Oper. Manag. 2019, 21, 29–46. [Google Scholar] [CrossRef]
- Haeri, A.; Hosseini-Motlagh, S.M.; Ghatreh Samani, M.R.; Rezaei, M. A Mixed Resilient-Efficient Approach toward Blood Supply Chain Network Design. Int. Trans. Oper. Res. 2020, 27, 1962–2001. [Google Scholar] [CrossRef]
- Kazemi, S.M.; Rabbani, M.; Tavakkoli-Moghaddam, R.; Shahreza, F.A. Blood Inventory-Routing Problem under Uncertainty. J. Intell. Fuzzy Syst. 2017, 32, 467–481. [Google Scholar] [CrossRef]
- Pouraliakbari-Mamaghani, M.; Ghodratnama, A.; Hamid Reza Pasandideh, S.; Saif, A.; Pouraliakbari-Mamaghani, M. A Robust Possibilistic Programming Approach for Blood Supply Chain Network Design in Disaster Relief Considering Congestion. Oper. Res. 2021, 2021, 1–46. [Google Scholar] [CrossRef]
- Kenan, N.; Diabat, A. The Supply Chain of Blood Products in the Wake of the COVID-19 Pandemic: Appointment Scheduling and Other Restrictions. Transp. Res. Part E Logist. Transp. Rev. 2022, 159, 102576. [Google Scholar] [CrossRef]
- Guo, X.; Liu, A.; Li, X.; Liu, T. A Two-Stage Stochastic Model for Daily Reserve in Inventory Management of Rh-Negative Red Blood Cells. J. Intell. Fuzzy Syst. 2020, 39, 6919–6933. [Google Scholar] [CrossRef]
- Chen, S.; Wang, C. Incorporating a Bayesian Network into Two-Stage Stochastic Programming for Blood Bank Location-Inventory Problem in Case of Disasters. Discret. Dyn. Nat. Soc. 2019, 2019, 7214907. [Google Scholar] [CrossRef] [Green Version]
- Zarezadeh, M.; Naji-Azimi, Z.; Morovati, A.; Pirayesh, M. A New Model and a Monte Carlo Based Particle Swarm Optimization Algorithm for the Stochastic Blood Assignment Problem. RAIRO-Oper. Res. 2020, 54, 1013–1025. [Google Scholar] [CrossRef]
- Zahiri, B.; Torabi, S.A.; Mohammadi, M.; Aghabegloo, M. A Multi-Stage Stochastic Programming Approach for Blood Supply Chain Planning. Comput. Ind. Eng. 2018, 122, 1–14. [Google Scholar] [CrossRef]
- Kurt, A.; Çetinkaya, F.C.; Azizoğlu, M. A Blood Distribution Problem with New Transportation Options-an Application for the Turkish Red Crescent. Eur. J. Ind. Eng. 2019, 13, 332. [Google Scholar] [CrossRef]
- Kurt, A.; Azizoglu, M.; Çetinkaya, F.C. Solution Approaches to the Blood Distribution Problem of the Turkish Red Crescent. Eur. J. Ind. Eng. 2018, 12, 405–441. [Google Scholar] [CrossRef]
- Wen, T.; Zhang, Z.; Wong, K.K.L. Multi-Objective Algorithm for Blood Supply via Unmanned Aerial Vehicles to the Wounded in an Emergency Situation. PLoS ONE 2016, 11, e0155176. [Google Scholar] [CrossRef] [Green Version]
- Kaya, O.; Ozkok, D. A Blood Bank Network Design Problem with Integrated Facility Location, Inventory and Routing Decisions. Netw. Spat. Econ. 2020, 20, 757–783. [Google Scholar] [CrossRef]
- Dharmaraja, S.; Narang, S.; Jain, V. A Mathematical Model for Supply Chain Management of Blood Banks in India. Opsearch 2020, 57, 541–552. [Google Scholar] [CrossRef]
- Al-Rabiaah, S.; Hosny, M.; AlMuhaideb, S. A Greedy Heuristic Based on Optimizing Battery Consumption and Routing Distance for Transporting Blood Using Unmanned Aerial Vehicles. Electronics 2022, 11, 3399. [Google Scholar] [CrossRef]
- Ensafian, H.; Yaghoubi, S.; Modarres Yazdi, M. Raising Quality and Safety of Platelet Transfusion Services in a Patient-Based Integrated Supply Chain under Uncertainty. Comput. Chem. Eng. 2017, 106, 355–372. [Google Scholar] [CrossRef]
- Ejohwomu, O.A.; Too, J.; Edwards, D.J. A Resilient Approach to Modelling the Supply and Demand of Platelets in the United Kingdom Blood Supply Chain. Int. J. Manag. Sci. Eng. Manag. 2021, 16, 143–150. [Google Scholar] [CrossRef]
- Ezugwu, A.E.; Olusanya, M.O.; Govender, P. Mathematical Model Formulation and Hybrid Metaheuristic Optimization Approach for Near-Optimal Blood Assignment in a Blood Bank System. Expert Syst. Appl. 2019, 137, 74–99. [Google Scholar] [CrossRef]
- Qamsari, A.S.N.; Hosseini-Motlagh, S.M.; Ghannadpour, S.F. A Column Generation Approach for an Inventory Routing Problem with Fuzzy Time Windows. Oper. Res. 2022, 22, 1157–1207. [Google Scholar] [CrossRef]
- Ghorashi, S.B.; Hamedi, M.; Sadeghian, R. Modeling and Optimization of a Reliable Blood Supply Chain Network in Crisis Considering Blood Compatibility Using MOGWO. Neural Comput. Appl. 2020, 32, 12173–12200. [Google Scholar] [CrossRef]
- Whitaker, B.; Rajbhandary, S.; Kleinman, S.; Harris, A.; Kamani, N. Trends in United States Blood Collection and Transfusion: Results from the 2013 AABB Blood Collection, Utilization, and Patient Blood Management Survey. Transfusion 2016, 56, 2173–2183. [Google Scholar] [CrossRef]
- Basavarajegowda, A.; Bajpai, M.; Arora, S.; Maheshwari, A.; Dua, S.; Sahoo, D. Survey Based Cross-Sectional Study to Analyse the Variation of Practices at Blood Centres during COVID-19 Pandemic in India. Transfus. Apher. Sci. 2021, 60, 103131. [Google Scholar] [CrossRef]
- Ahmadimanesh, M.; Tavakoli, A.; Pooya, A.; Dehghanian, F. Designing an Optimal Inventory Management Model for the Blood Supply Chain: Synthesis of Reusable Simulation and Neural Network. Medicine 2020, 99, e21208. [Google Scholar] [CrossRef]
- Abbasi, B.; Babaei, T.; Hosseinifard, Z.; Smith-Miles, K.; Dehghani, M. Predicting Solutions of Large-Scale Optimization Problems via Machine Learning: A Case Study in Blood Supply Chain Management. Comput. Oper. Res. 2020, 119, 104941. [Google Scholar] [CrossRef]
- Hosseini-Motlagh, S.M.; Samani, M.R.G.; Cheraghi, S. Robust and Stable Flexible Blood Supply Chain Network Design under Motivational Initiatives. Socioecon. Plan. Sci. 2020, 70, 100725. [Google Scholar] [CrossRef]
- Haeri, A.; Hosseini Motlagh, S.M.; Samani, M.R.G.; Rezaei, M. A Bi-Level Programming Approach for Improving Relief Logistics Operations: A Real Case in Kermanshah Earthquake. Comput. Ind. Eng. 2020, 145, 106532. [Google Scholar] [CrossRef]
- Veihola, M.; Aroviita, P.; Kekomäki, R.; Linna, M.; Sintonen, H. Discarded Cellular Components and the Technical Efficiency of Component Preparation. Eur. J. Health. Econ. 2008, 9, 325–331. [Google Scholar] [CrossRef] [PubMed]
- Abbaspour, A.; Jahan, A.; Rezaiee, M. A Simple Empirical Model for Blood Platelet Production and Inventory Management under Uncertainty. J. Ambient Intell. Humaniz. Comput. 2021, 12, 1783–1799. [Google Scholar] [CrossRef]
- Nagurney, A.; Dutta, P. Competition for Blood Donations. Omega 2019, 85, 103–114. [Google Scholar] [CrossRef]
- Dutta, P.; Nagurney, A. Multitiered Blood Supply Chain Network Competition: Linking Blood Service Organizations, Hospitals, and Payers. Oper. Res. Health Care 2019, 23, 100230. [Google Scholar] [CrossRef]
- Nagurney, A.; Dutta, P. Supply Chain Network Competition among Blood Service Organizations: A Generalized Nash Equilibrium Framework. Ann. Oper. Res. 2019, 275, 551–586. [Google Scholar] [CrossRef]
- Wilding, R.; Cotton, S.; Dobbin, J.; Chapman, J.; Yates, N. Time-Based Analysis of the Apheresis Platelet Supply Chain in England. Vox Sang. 2011, 101, 247–249. [Google Scholar] [CrossRef]
- Sharma, B.; Ramkumar, M.; Subramanian, N.; Malhotra, B. Dynamic Temporary Blood Facility Location-Allocation during and Post-Disaster Periods. Ann. Oper. Res. 2019, 283, 705–736. [Google Scholar] [CrossRef]
- Li, Y.C.; Liao, H.C. The Optimal Parameter Design for a Blood Supply Chain System by the Taguchi Method. Int. J. Innov. Comput. Inf. Control. 2012, 8, 7697–7712. [Google Scholar]
- Behroozi, F.; Monfared, M.A.S.; Hosseini, S.M.H. Investigating the Conflicts between Different Stakeholders’ Preferences in a Blood Supply Chain at Emergencies: A Trade-off between Six Objectives. Soft Comput. 2021, 25, 13389–13410. [Google Scholar] [CrossRef]


| Review | Database | Number of Articles Considered | Year Range |
|---|---|---|---|
| Beliën and Forcé [1] | WoS, Pubmed, Academic Search Premier, Business Source Premier, Econlit, SCIRIUS | 98 | 1966–2010 |
| Osorio et al. [2] | N/A | 127 | 1963–2014 |
| Piraban et al. [13] | SCOPUS | 100 | 2005–2019 |
| Eghtesadifard and Jozan [19] | WoS | 485 | 1990–2021 * |
| Groups | Keywords |
|---|---|
| Group 1 | “blood” OR “blood product” OR “blood bank” OR “whole blood” or “red blood cells” OR “platelets” OR “plasma” OR “frozen blood” OR “cryoprecipitate” |
| Group 2 | “supply chain” OR “network design” OR “humanitarian logistics” OR “disaster relief” OR “location-allocation” OR “location selection” OR “routing” OR “donation planning” OR “donation tailoring” OR “donation management” OR “ collection planning” OR “collection management” OR “collection tailoring” OR ”production planning” OR “process planning” OR ” inventory planning” OR “inventory management” OR “inventory control” OR “distribution management” OR “distribution planning” OR “demand match” OR “ blood match” OR “group compatibility” |
| Group 3 | “optimization” OR “simulation” OR “scheduling” OR “optimal” OR “heuristic” OR “stochastic” OR “robust” OR “uncertain” OR “predict” OR “forecast” OR “analysis” OR “model” OR “method” OR “algorithm” |
| Search Query | (Group 1) AND (Group 2) AND (Group 3) |
| Source | 2005 | 2006 | 2007 | 2008 | 2009 | 2010 | 2011 | 2012 | 2013 | 2014 | 2015 | 2016 | 2017 | 2018 | 2019 | 2020 | 2021 | 2022 | TOTAL |
|---|---|---|---|---|---|---|---|---|---|---|---|---|---|---|---|---|---|---|---|
| Transfusion | 2 | 2 | 1 | 1 | 1 | 2 | 2 | 1 | 2 | 2 | 4 | 20 | |||||||
| Computers and Industrial Engineering | 1 | 1 | 1 | 3 | 4 | 2 | 1 | 2 | 15 | ||||||||||
| Annals of Operations Research | 1 | 7 | 2 | 2 | 12 | ||||||||||||||
| Transportation Research Part E-Logistics and Transportation Review | 1 | 1 | 1 | 2 | 4 | 1 | 2 | 12 | |||||||||||
| Computers and Operations Research | 3 | 1 | 1 | 2 | 2 | 2 | 11 | ||||||||||||
| International Journal of Production Economics | 1 | 2 | 2 | 4 | 1 | 1 | 11 | ||||||||||||
| Vox Sanguinis | 1 | 1 | 1 | 1 | 2 | 1 | 1 | 2 | 10 | ||||||||||
| European Journal of Operational Research | 1 | 1 | 2 | 1 | 2 | 7 | |||||||||||||
| Journal of the Operational Research Society | 1 | 1 | 1 | 3 | 6 | ||||||||||||||
| Operations Research for Health Care | 2 | 1 | 1 | 1 | 1 | 6 | |||||||||||||
| Journal of Ambient Intelligence and Humanized Computing | 2 | 1 | 2 | 5 | |||||||||||||||
| Production and Operations Management | 2 | 1 | 2 | 5 | |||||||||||||||
| International Transactions in Operational Research | 1 | 2 | 1 | 1 | 5 | ||||||||||||||
| Journal of Intelligent and Fuzzy Systems | 1 | 1 | 1 | 1 | 1 | 5 | |||||||||||||
| Operational Research | 1 | 4 | 5 | ||||||||||||||||
| Discrete Dynamics in Nature and Society | 1 | 3 | 4 | ||||||||||||||||
| Omega-International Journal of Management Science | 1 | 2 | 1 | 4 | |||||||||||||||
| Applied Mathematical Modelling | 1 | 1 | 1 | 1 | 4 | ||||||||||||||
| European Journal of Industrial Engineering | 1 | 2 | 1 | 4 | |||||||||||||||
| Socio-Economic Planning Sciences | 1 | 2 | 1 | 4 |
| Number of Authors | 1 | 2 | 3 | 4 | 5 | 6 | 7 | 8 | 9 | 10 | 12 | 13 | Average |
|---|---|---|---|---|---|---|---|---|---|---|---|---|---|
| Number of Articles | 8 | 66 | 85 | 65 | 19 | 9 | 3 | 2 | 2 | 3 | 2 | 1 | 3.49 |
| Author | Hosseini-Motlagh S.M. | Samani M.R.G. | Abbasi B. | Yaghoubi S. | Heddle N.M. | Larimi N.G. | Katsaliaki K. | Tavakkoli-Moghaddam R. | Haijema R. | Jabbarzadeh A. |
|---|---|---|---|---|---|---|---|---|---|---|
| Number of articles | 17 | 12 | 9 | 7 | 5 | 5 | 5 | 5 | 5 | 4 |
| Author | Nahmias S. | Osorio A.F. | Zahiri B. | Haijema R. | Belien J. | Prastacos G.P. | Nagurney A. | Samani M.R.G. | Pierskalla W.P. | Jabbarzadeh A. |
|---|---|---|---|---|---|---|---|---|---|---|
| Number of citation | 155 | 140 | 135 | 134 | 117 | 97 | 96 | 94 | 85 | 83 |
| Country | Number of Articles | Country | Number of Articles |
|---|---|---|---|
| Iran | 80 | Colombia | 6 |
| USA | 62 | Finland | 6 |
| Canada | 32 | Germany | 5 |
| People’s Republic China | 30 | Spain | 5 |
| United Kingdom | 22 | United Arab Emirates | 5 |
| Australia | 18 | Brazil | 4 |
| Turkey | 15 | Italy | 4 |
| India | 12 | Saudi Arabia | 4 |
| Netherlands | 10 | Austria | 3 |
| France | 8 | South Korea | 3 |
| Keyword | Frequency | Word in Title | Frequency |
|---|---|---|---|
| Blood supply chain | 75 | Blood | 228 |
| Inventory management | 22 | Supply | 116 |
| Robust optimization | 22 | Chain | 90 |
| Simulation | 17 | Inventory | 48 |
| Uncertainty | 16 | Network | 44 |
| Optimization | 12 | Model | 40 |
| Supply chain | 11 | Management | 37 |
| Perishable inventory | 10 | Platelet | 31 |
| Disaster | 9 | Approach | 30 |
| Platelets | 8 | Robust | 29 |
| Blood bank | 8 | Optimization | 28 |
| Blood products | 7 | Under | 26 |
| Supply chain management | 7 | Design | 24 |
| Perishable inventory management | 7 | Case | 22 |
| Perishable product | 7 | Demand | 22 |
| Healthcare | 7 | Study | 21 |
| Stochastic programming | 7 | Stochastic | 21 |
| Vehicle routing | 6 | Problem | 21 |
| Supply chain network design | 6 | Red | 20 |
| Multi-objective optimization | 6 | Collection | 19 |
| Article | Citation | Article | Citation | ||
|---|---|---|---|---|---|
| Local | Global | Local | Global | ||
| Jabbarzadeh et al. [7] | 74 | 204 | Hosseinifard and Abbasi [42] | 45 | 63 |
| Gunpinar and Centeno [39] | 66 | 88 | Zhou et al. [44] | 43 | 87 |
| Haijema et al. [41] | 64 | 139 | Ghandforoush and Sen [47] | 41 | 71 |
| Fahimnia et al. [3] | 61 | 132 | Haijema et al. [48] | 39 | 75 |
| Zahiri and Pishvaee [12] | 62 | 99 | Katsaliaki and Brailsford [34] | 38 | 113 |
| Dillon et al. [36] | 58 | 107 | Samani et al. [11] | 38 | 67 |
| Duan and Liao [37] | 53 | 82 | Zahiri et al. [49] | 34 | 99 |
| Ramezanian and Behboodi [38] | 47 | 75 | Abdulwahab and Wahab [50] | 33 | 47 |
| Van Dijk et al. [40] | 47 | 84 | Hemmelmayr et al. [35] | 31 | 77 |
| Şahin et al. [6] | 46 | 99 | Salehi et al. [51] | 31 | 69 |
| Publication | PageRank | Publication | PageRank |
|---|---|---|---|
| Beliën and Forcé [1] | 0.02229 | Nahmias [46] | 0.01148 |
| Osorio et al. [2] | 0.01472 | Duan and Liao [37] | 0.01093 |
| Jabbarzadeh et al. [7] | 0.01466 | Ramezanian and Behboodi [38] | 0.01009 |
| Gunpinar and Centeno [39] | 0.01371 | Zhou et al. [44] | 0.00976 |
| Zahiri and Pishvaee [12] | 0.01262 | van Dijk et al. [40] | 0.00959 |
| Fahimnia et al. [3] | 0.01259 | Şahin et al. [6] | 0.00921 |
| Nagurney et al. [43] | 0.01194 | Hosseinifard and Abbasi [42] | 0.00898 |
| Haijema et al. [41] | 0.01189 | Ghandforoush and Sen [47] | 0.00867 |
| Dillon et al. [36] | 0.01186 | Sha and Huang [45] | 0.00854 |
| Prastacos [5] | 0.01161 | Haijema et al. [48] | 0.00849 |
| Cluster 1 | Cluster 2 | Cluster 3 | Cluster 4 |
|---|---|---|---|
| Gunpinar and Centeno [39] | Haijema et al. [41] | Beliën and Forcé [1] | Ghandforoush and Sen [47] |
| Osorio et al. [2] | Nahmias [46] | Pierskalla [20] | Dehghani and Abbasi [59] |
| Jabbarzadeh et al. [7] | Van Dijk et al. [40] | Hemmelmayr et al. [35] | Wang and Ma [60] |
| Nagurney et al. [43] | Zhou et al. [44] | Katsaliaki and Brailsford [34] | Rajendran and Ravindran [61] |
| Dillon et al. [36] | Prastacos [5] | Katsaliaki [62] | Clay et al. [63] |
| Duan and Liao [37] | Haijema et al. [48] | Rytile and Spens [64] | Rajendran and Ravindran [65] |
| Zahiri and Pishvaee [12] | Karaesmen et al. [66] | Hemmelmayr et al. [67] | Abbasi and Hosseinifard [68] |
| Hosseinifard and Abbasi [42] | Civelek et al. [69] | Kopach et al. [70] | Abbasi et al. [71] |
| Şahin et al. [6] | Duan and Liao [72] | Delen et al. [73] | Sarhangian et al. [74] |
| Fahimnia et al. [3] | Pierskalla and Roach [75] | Brodheim et al. [76] | Rajendran and Srinivas [77] |
Disclaimer/Publisher’s Note: The statements, opinions and data contained in all publications are solely those of the individual author(s) and contributor(s) and not of MDPI and/or the editor(s). MDPI and/or the editor(s) disclaim responsibility for any injury to people or property resulting from any ideas, methods, instructions or products referred to in the content. |
© 2023 by the authors. Licensee MDPI, Basel, Switzerland. This article is an open access article distributed under the terms and conditions of the Creative Commons Attribution (CC BY) license (https://creativecommons.org/licenses/by/4.0/).
Share and Cite
Imamoglu, G.; Topcu, Y.I.; Aydin, N. A Systematic Literature Review of the Blood Supply Chain through Bibliometric Analysis and Taxonomy. Systems 2023, 11, 124. https://doi.org/10.3390/systems11030124
Imamoglu G, Topcu YI, Aydin N. A Systematic Literature Review of the Blood Supply Chain through Bibliometric Analysis and Taxonomy. Systems. 2023; 11(3):124. https://doi.org/10.3390/systems11030124
Chicago/Turabian StyleImamoglu, Gul, Y. Ilker Topcu, and Nezir Aydin. 2023. "A Systematic Literature Review of the Blood Supply Chain through Bibliometric Analysis and Taxonomy" Systems 11, no. 3: 124. https://doi.org/10.3390/systems11030124
APA StyleImamoglu, G., Topcu, Y. I., & Aydin, N. (2023). A Systematic Literature Review of the Blood Supply Chain through Bibliometric Analysis and Taxonomy. Systems, 11(3), 124. https://doi.org/10.3390/systems11030124