Article

Measuring the Development Capability of the Innovation Ecosystem from a Quadruple Helix Perspective—An Empirical Analysis Based on Panel Data for Chinese High-Tech Industries

School of Economics and Management, Harbin Engineering University, Harbin 150001, China
*
Author to whom correspondence should be addressed.
Systems 2023, 11(7), 338; https://doi.org/10.3390/systems11070338
Submission received: 20 April 2023 / Revised: 5 June 2023 / Accepted: 10 June 2023 / Published: 2 July 2023
(This article belongs to the Special Issue Service Ecosystems: Resilience and Sustainability)

Abstract

:
With the rapid development of high-tech industries, the research perspective of industrial innovation has gradually evolved from the innovation system to innovation ecosystem. Whether the innovation ecosystem of China’s high-tech industry can achieve the benign evolution and development of the system under the new global pattern has become a real issue. Based on the perspective of the four-helix innovation model, in this study we construct an index system of the industrial innovation ecosystem development and designs a framework system of the industrial innovation ecosystem development capability, including the coordinated development capability, evolutionary development capability, and sustainable development capability at three levels. We construct measurement models of different capability dimensions and multi-dimensionally analyses of the regional development differences and change trends of each capability dimension of the system. The results show that the coordinated development capability of China’s high-tech industrial innovation ecosystem is poor, which inhibits the comprehensive capability of the system’s development to a certain extent. Although the evolutionary and sustainable development capabilities fluctuate greatly and have significant regional differences, they are measured at a better level and thereby contribute to the development of the system.

1. Introduction

With the evolution of the new generation of global innovation paradigms, developed countries have been actively constructing science and technology innovation ecosystems to consolidate their science and technology innovation status. Especially with the prevalence of counter-globalization and the huge impact of the new crown epidemic, the development of industrial innovation ecosystems in various countries is facing new challenges [1]. Under the complex and changing global landscape, China has accelerated its innovation development strategy to build and improve the national innovation ecosystem. High-tech industries, as the core industries of China’s innovation-driven strategy, are the main driving force promoting the optimization and upgrading of industrial structure, advance of supply-side reform, and development of important positions in international economic and technological competition [2]. Therefore, the core of improving the national innovation ecosystem is centered on guaranteeing the benign evolution and development of the innovation ecosystem of high-tech industries and achieving the healthy and sustainable development of the system. The method for achieving this requires a comprehensive measurement and evaluation of the development capacity of the system and the identification of the regional differences and changing trends of the system’s development to provide a reference for solving the practical problems in the process of development.
The early triple helix model is one of the most important analytical frameworks for innovation systems, which was proposed by Etzkowitz [3] and Leydesdorff [4,5] based on the university–industry–government relationship. From the perspective of the innovation system, Ranga and Etzkowitz [6] clearly defined the specific system structure and function of the triple helix model for the first time. With the development and evolution of the knowledge production model, the four-helix innovation indexes with public participation have been incorporated into the evaluation system of the innovation ecosystem of high-tech industry, and the innovation and optimization of the system based on the four-helix perspective can better reflect the comprehensive level of system synergy and sustainable development [7]. At the earliest, the ‘public’ was incorporated into the innovation model as the fourth helix, and the mutual promotion of multiple subjects formed the four-helix dynamic mechanism [8], and then the user-oriented innovation theory was generated, which marked the inevitable trend of the four-helix model becoming the innovation model [9]. Beyond the ‘triple helix’, on the basis of democracy and ecology, the ‘quadruple helix’ emphasizes the importance of the media and public perspective [10,11,12]. At present, the ‘quadruple helix’ has been gradually incorporated into the study of regional innovation systems [13,14,15,16,17], and some scholars have studied the social innovation ecosystem based on the ‘quadruple helix’ to realize the innovation of social business models [18]. In recent years, academics have been focusing on research related to high-tech industrial innovation ecosystems and have achieved certain results, although most scholars singularly use quantitative models to analyze the synergy, evolutionary level, or health of the system and rarely analyze the system development capability from multiple dimensions. This analysis approach especially lacks the construction of a research framework for the comprehensive development capability of the system, which incorporates different dimensional capabilities of system development into one analytical framework. Therefore, based on the static and dynamic perspectives, this study attempts to construct a diversified measurement model including the measurement of the system’s development status, speed, and trend, so as to measure the development capability of the high-tech industrial innovation ecosystem from multiple dimensions, so as to enrich the existing research results and provide a theoretical basis for systematically and comprehensively measuring the development capability of high-tech industrial innovation ecosystems. At the same time, based on the four-helix theory, this study establishes an evaluation system of high-tech industry innovation ecosystems, and compares and analyzes the coordinated development level, evolutionary development ability, and sustainable development level of different regional systems in different periods, which has important theoretical and practical significance for promoting the stable development and orderly evolution of the high-tech industry innovation ecosystem.
This study designs a framework system of industrial innovation ecosystem development capacity, including the coordinated development capacity, evolutionary development capacity, and sustainable development capacity. It constructs an evaluation index system of industrial innovation ecosystem development capacity based on the perspective of the four-helix innovation model, builds an evaluation model of three dimensions of capacity, and analyzes the development capacity of the system from different dimensions of measurement. Finally, a comprehensive measurement model of system development is constructed to comprehensively measure the regional differences and change trends of system development. Therefore, this study provides direction and strategy for improving the comprehensive development ability of the high-tech industry innovation ecosystem.
The rest of this paper is organized as follows. In Section 2, the relevant literature on innovation ecosystems and industrial innovation ecosystems is summarized. In Section 3, the research framework of this study is designed, the research problems and hypotheses are clarified, and a measurement model of the system’s capabilities in different dimensions is constructed. Section 4 provides an empirical analysis and discussion. Finally, the conclusions and future prospects are stated in Section 5.

2. Literature Review

2.1. Innovation Ecosystem

Early scholars defined the connotations of the innovation ecosystem from an ecological perspective and studied its evolution and synergistic mechanism [19]. In recent years, scholars have gradually defined the meaning of the innovation ecosystem at the enterprise level from the perspective of the system structure, innovation network, and business ecology [20]. Especially, the important players, elemental composition, and operational mechanisms of the system are studied [21,22,23]. The innovation ecosystem is an emerging concept that provides a new perspective on the strategic positioning of enterprises [24], where different players of the innovation ecosystem are born at different times, providing corresponding management measures for the sustainable development of the system by studying the impact of the synergy of the system elements on the innovation performance and economic efficiency of the system [25]. Some scholars have constructed a coordination mechanism model of innovation ecosystem value co-creation behavior based on the evolutionary game theory to study its evolutionary process [26]. Achieving diversity for innovation ecosystem participants helps support innovation in the system value co-creation process [27]. In the context of the gradual spread of AI, how the participants in an AI innovation ecosystem achieve value co-creation has also become a new research direction [28]. In the platform-based innovation ecosystem, the symbiotic evolution and interactions among the participating actors are of great concern, and it is particularly important to study the synergistic innovation between platform enterprises and different complementary enterprises and their impact on the innovation ecosystem performance [29]. In the regional innovation ecosystem, the sustainable development capacity of different regional innovation ecosystems and its constraints are studied [30]. With the development of sustainable smart products, it is equally important to explore the innovation performance and sustainability brought about by supply chain innovation in their innovation ecosystems [31], where the collaborative performance of the innovation ecosystems depends on the open interaction among ecosystem members [32]. The emergence of open innovation has contributed to the development of innovation ecosystems, and open innovation ecosystems are gaining attention [33,34]. In addition, digital innovation ecosystems have become a new research area [35], and complex networks have become an important tool used to analyze the framework of digital innovation ecosystems [36]. Ecological collaboration for digital innovation has become the main form to achieve innovation output. The evolution trend of the digital innovation ecosystem is studied, and the system governance mechanism under different evolution trends is explored [37]. Moreover, disruptive innovation in ecosystems typified by 3D printing is worth exploring [38].

2.2. Industrial Innovation Ecosystem

The concept of the ‘business ecosystem’ was first proposed by Moore in 1993 and the industrial innovation ecosystem was born [39]. Subsequently, Dhanaraj et al. [40] identified the main coordinators of an industrial innovation network and value acquisition, and Fransman [41] analyzed the components of the industrial innovation ecosystem by building an information communication industry ecological model. Ritala et al. [42] analyzed the value acquisition mechanism of the industrial innovation ecosystem and the influence of each mechanism on the development of the industrial innovation ecosystem. Leong et al. [43] explored the cooperation network structure of core enterprises within the industrial ecosystem, so as to analyze the interaction of the internal mechanism of the system. Ander et al. [21] verified the promoting effect of the industrial innovation ecosystem on the formation of inter-industry linkages, thereby promoting technological innovation and industrial development and realizing the process of value creation. Dougherty et al. [44] proposed that the establishment of an innovation ecosystem can provide a breeding environment for cooperation, and cooperative innovation is conducive to the coordinated development of various industries. Some scholars study the relationships between innovation entities in the industrial innovation ecosystem [45,46] and the context division in the interaction process of the entities, including bilateral relationships, the industrial background, and the whole industrial ecosystem at different levels [47,48]. In recent years, studies on the construction, evolution mechanism, and coordinated development stability of industrial innovation ecosystems have gradually emerged, and some scholars have proposed the concept of architects [49] and studied how the change of the framework and the evolution of its strategic behavior promote the formation and evolution of the industrial innovation ecosystem [1]; solved the contradiction between economic development, energy shortages, and environmental deterioration by constructing and exploring the evolution mechanism of the industrial innovation ecosystem in resource-based cities [50]; and studied the spatiotemporal evolution of the coupling coordination degree of the industrial innovation ecosystem in order to achieve green development [51]. From the perspective of the industrial innovation ecosystem, on study also analyzed how the solar photovoltaic industry obtains competitive advantages through the construction of industrial innovation ecosystems and the maintenance of industrial innovation ecological relationships [52]. The 3D printing industry has been taken as an example to build a multi-layered linkage emerging industry innovation ecosystem [53], and the new energy automobile industry has been taken as an example to explore the formation mechanism of the comprehensive advantages of the emerging industry innovation ecosystem [54]. Here, we evaluate the stability level of the innovation ecosystem of regional strategic emerging industries [55]. The high-tech industrial innovation ecosystem is also a part of industrial ecosystem research, and the research on the high-tech industrial innovation ecosystem has gradually emerged to study the system structure, mechanism, and evolution from a system theory perspective [56,57,58,59,60] or to analyze the system’s synergistic development [7,61], healthy operation [62,63,64], sustainable development mechanism [65], and organicity [7] using quantitative models. Some scholars proposed a classification evaluation system of regional high-tech industrial innovation ecosystem synergy to measure the level of system synergy [61] and evaluated the level of system health sustainability [62,63]. Some studies constructed an ecological niche suitability model to evaluate the system evolution and evolutionary space [66], evaluated the overall system synergy and dynamic sustainability [7], and evaluated the system construction level from three dimensions: the overall dynamic evolutionary capacity, sustainable development capacity, and openness [67].

3. Research Design

In the research design section, this paper first designs the research framework, mainly through the construction of an industrial four-helix innovation ecosystem and the design of a development capability framework of the innovation ecosystem, to obtain the four-helix theoretical model of China’s high-tech industry innovation ecosystem, and through preliminary screening and combination screening methods to obtain the index system for measuring the innovation ecosystem of high-tech industry. Secondly, the research problems and assumptions are expounded. Finally, the model is constructed based on the assumptions, and different measurement models are constructed to explore the level and change trend of the coordinated development ability, evolutionary development ability, sustainable development ability, and system development ability of the high-tech industry innovation ecosystem. In addition, this section also introduces the data sources studied in this paper.

3.1. Research Framework

3.1.1. Industry Quadruple Helix Innovation Ecosystem

According to the research on innovation ecosystems by related scholars [61,62,63,66,68,69,70], based on the four-helix perspective, this study divides the innovation ecosystem of high-tech industry into five subsystems,—enterprise operation, research and development, intermediary service, government drive, and social participation—and constructs a four-helix theoretical model of the innovation ecosystem of high-tech industry, as shown in Figure 1. Among them, the enterprise operation subsystem adopts the high-tech enterprises as the main body, which creates valuable science and technology products or services under the guidance of government policies and ensures the orderly implementation of innovation activities. The research and development subsystem is based on universities, research institutes, and other R&D (Research and development) institutions, which create basic innovative knowledge and cutting-edge professional technology through research projects, continuously delivering talent and innovative achievements. The intermediary service subsystem realizes the flow of resources and interactive sharing of knowledge among innovation subjects through investment institutions, technology business incubators, and intermediary platforms, so as to form diversified innovation services. The government-driven subsystem refers to the government as the innovator of the system, providing R&D performance and risk avoidance for innovation activities through financial support and policy assistance. The social participation subsystem is composed of the social public as the experiencers of innovation products, who participate in communication and interaction through online and offline means, not only to realize the sharing of scientific and technological cognition and demand feedback but also to realize knowledge exchange and interaction with each innovation subject. It can be seen that each subsystem of the high-tech industrial innovation ecosystem has its different functions and roles but they are an organic whole of synergistic development, jointly promoting the healthy and sustainable development of a high-tech industrial innovation ecosystem.

3.1.2. Innovation Ecosystem Development Capacity

This study designs a framework of industrial innovation ecosystem development capabilities based on complex systems theory, synergetic theory, and self-organization theory, including three dimensions: the coordinated development capacity, evolutionary development capacity, and sustainable development capacity.
(1)
Coordinated development capacity
The coordinated development capacity is the synergistic development among the innovation subjects in the system, and the system promotes the synergistic development and continuous optimization of the system as a whole through self-organized adjustment and adaptation. The interdependence, mutual communication, and mutual promotion among the participating subjects in the system promote the process of system value creation. In other words, the coordinated interactions among system members facilitates value co-creation, and the formation of the innovation ecosystem and the maintenance and development of interdependence in the system depend on the coordinated development capability possessed by the whole system [7,35,61,63].
(2)
Evolutionary development capacity
The innovation ecosystem is in the process of evolutionary change; that is, the innovation ecosystem development is a dynamic process in which the elements in the system evolve and adapt to each other in a synergistic manner. During the evolutionary development of an innovation ecosystem, various innovation factors such as talent, technologies, information, and capital flow continuously among innovation subjects and between the system and the external environment to realize the allocation and optimization of resources and the promotion and application of technologies [58,62,63,67]. The evolutionary development capability is expressed as the flow of innovation elements within the system, which is conducive to the communication and interaction among the subjects within the system, thereby also promoting the synergistic development and dynamic evolution of the whole system.
(3)
Sustainable development capacity
The sustainable development capacity is mainly reflected in the healthy and sustainable development of the system. The system innovation subjects influence each other, promote each other, and develop symbiotically, gradually adapting to the external environment and developing in an orderly manner along a specific direction. As regional differences and other factors change, the trends associated with the healthy development of the system’s ecological niche will also change. Under the joint influence of external resources and environmental differences, the system responds to external shocks and perturbations according to its own resource endowment advantages to realise the dynamic sustainable development of the system [7,67]. In order to ensure the healthy and sustainable development of the system, the system will break through the boundaries of regions and industries and integrate knowledge and technology from outside the system. In this process, information flow and knowledge flow will be formed to realize the orderly flow of resources and talent, constantly improve the innovation and adaptability of the system, and promote the sustainable development of the whole system [30].
This study follows the principles of scientificity, systematization, and accessibility; draws on existing research results [7,61,62,63,66,71,72]; and fully considers major factors such as the enterprise operation and market liquidity, R&D innovation capability, R&D investment capital, innovation platform support, government financial support, and public online and offline participation. Through comparison and induction, the evaluation index system of the high-tech industrial innovation ecosystem under the quadruple helix mode was preliminarily established. Using the group decision feature root method and Pearson correlation coefficient combination screening method, 15 relevant experts and senior managers in the field of high-tech industry and innovation ecosystems were invited to score the primary indicators. MATLAB software (R2018 a version) was used to calculate the maximum feature root and the correlation results of the index system. Indexes with key values less than 0.45 and correlations less than 0.75 were eliminated, and an order parameter index system consisting of 20 representative indexes was finally screened out, as shown in Table 1.

3.2. Research Problems and Assumptions

The high-tech industrial innovation ecosystem is an organism composed of multiple elements and agents, and through their synergies, each element and agent in the system constantly exchanges and interacts with each other in terms of information, technology and energy. Each subject in the system influences and supplements each other, and the coordinated development of each subject will promote the comprehensive development of the system. Therefore, the formation of the system and the interdependence between the systems cannot be separated from the coordinated development ability of the system [7,35,61,63]. At the same time, the high-tech industry innovation ecosystem is in the process of constant development and change. The flow of innovation factors among various main elements, and between internal and external elements of the system, allows the update and allocation of system resources, and the evolutionary development ability of the system affects the comprehensive development ability of the system to some extent [58,62,63,67]. However, in the process of evolution and development, whether the system can develop in a healthy and orderly direction also becomes a dimension and standard to measure the comprehensive development ability of the system, which is reflected in the sustainable development ability [7,30,67]. Therefore, the sustainable development ability of the system also plays an important role in the comprehensive development ability of the system. Specifically, when the main elements of the high-tech industry innovation ecosystem are interdependent and promote each other, the coordinated development ability is better, which is conducive to the sharing and absorption of information, technology, and energy within the system and between the system and the outside, and the comprehensive development ability of the system will be enhanced. In order to realize the benign evolution and development of the system, sufficient capital flow, technology flow, and information flow should be ensured during the flow of capital, technology, information, and other elements of the system, so as to promote the optimization and allocation of resources to improve the comprehensive development ability of the system. Based on the coordinated and dynamic development of the system, regional differences, resource endowment, and other factors will have different impacts on the sustainable development of the system’s ecological niche. Improving the dynamic and sustainable development ability of the system and creating good resource and external environments are conducive to improving the comprehensive development ability of the system.
Based on the above analysis, this study proposes the following assumptions: (1) The comprehensive development capability of the high-tech industry innovation ecosystem can be divided into three dimensions: the coordinated development capability, evolutionary development capability and sustainable development capability. (2) The coordinated development ability, evolutionary development ability, and sustainable development ability of the high-tech industry innovation ecosystem show obvious spatiotemporal differences. (3) The comprehensive development capacity levels of high-tech industrial innovation ecosystems in different regions in different periods are also significantly different. Based on the above assumptions, this paper constructs different measurement models to measure the three capacity dimensions of the high-tech industrial innovation ecosystem; analyzes the coordinated development capacity, evolutionary development capacity, and sustainable development capacity of the system; and on this basis explores the comprehensive development capacity level of the system affected by the three capacity dimensions and the change trend.

3.3. Model Construction

3.3.1. Coordinated Development Capacity Measurement Model

Based on some scholar’s research [73], a model for measuring the coordinated development capability of the high-tech industrial innovation ecosystem is constructed. The innovation ecosystem of high-tech industry is divided into five subsystems, including enterprise operation, academic research and development, and intermediary service, denoted as S i = ( i = 1 , 2 , , 5 ) ; the subsystem order parameters are x i = ( x i 1 , x i 2 , , x i n ) , j = 1 , 2 , , n , which means that the i t h subsystem has n order parameters and satisfies α i j x i j β i j ; β i j and α i j represent the upper and lower limits of the order parameter component x i j , respectfully. The order degree of the order parameters can be calculated as:
u i ( x i j ) = x i j α i j β i j α i j , j = 1 , 2 , , l i β i j x i j β i j α i j , j = l i + 1 , l i + 2 , , n i
In Formula (1), u i ( x i j ) 0 , 1 , and there is a positive relationship between u i ( x i j ) and the subsystem order degree; that is, the larger the value, the higher the subsystem order degree, otherwise the order degree of the subsystem is lower. In this study, a linear weighting method is adopted to integrate the order degree of order parameters of each subsystem of the high-tech industrial innovation ecosystem, and the formula for calculating the subsystem order degree is as follows:
u i ( x i ) = j = 1 n i λ i j u i ( x i j ) , i = 1 , 2 , , 5
In Formula (2), λ i j represents the weight value of the j t h order parameter of the i t h innovation ecological subsystem, and λ i j 0 , 1 ; u i ( x i ) represents the order degree of the i t h innovation ecological subsystem, and u i ( x i ) 0 , 1 . The larger u i ( x i ) is, the more ideal the orderly development of the subsystem.
Suppose that the order degree of the subsystem at the initial moment t 0 is u i 0 ( x i ) and the order degree at the moment t k is u i k ( x i ) , then the overall synergy degree formula of the innovation ecosystem of high-tech industry at the moment t k is:
C k = min i u i k ( x i ) u i 0 ( x i ) 0 min i u i k ( x i ) u i 0 ( x i ) 0 i = 1 5 u i k ( x i ) u i 0 ( x i ) 5 , i = 1 , 2 , , 5
In Formula (3), if C k 1 , 1 , the larger the C k value, the higher the level of synergy among the subsystems of the high-tech industrial innovation ecosystem and the stronger the system’s coordinated development capability; in contrast, the lower the level of synergy, the weaker the system’s coordinated development capability.

3.3.2. Evolutionary Development Capacity Measurement Model

This study introduces a dynamic comprehensive evaluation model with speed characteristics [74] to measure the level and trend of the evolutionary development capacity of the high-tech industrial innovation ecosystem. It helps objectively reflect on the flow among the elements of each subsystem and the ability of the system to adjust and recover in response to external environmental changes to ensure the normal and orderly operation of the system.
If the change rate of the innovation elements in each subsystem of the high-tech industry innovation ecosystem in period t r , t r + 1 is V i r , then:
V ir = ( x i , r + 1 x ir ) / t r + 1 t r ,   i = 1 , 2 , 5 ; r = 1 , 2 , , n
When V i r > 0 , the subsystem innovation elements are in an increasing state; when V i r < 0 , they are in a declining state; when V i r = 0 , they are stagnant. Combined with the principle of F = κ m a , the measurement model of the dynamic change speed of the innovation elements in each subsystem of the high-tech industrial innovation ecosystem at time [ t r , t r + 1 ] can be obtained:
Y i V = κ × S i V ( t r , t r + 1 ) × ρ ( θ r )
where Y i V stands for the evolutionary development levels; the coefficient κ is set to 1; S i V ( t r , t r + 1 ) is the change speed state of the system innovation elements; ρ ( θ r ) is the trend of the change rate of the system innovation factors, ρ ( θ r ) = 2 1 + e θ r ; θ i r is the linear growth rate of the change rate of the subsystem innovation factors within t r , t r + 1 . The evolutionary development levels of innovation elements of innovation ecosystem of high-tech industry in period t r , t r + 1 are as follows:
Y i V = S i V ( t r , t r + 1 ) × ρ ( θ r ) = ρ ( θ r ) × t r t r + 1 [ V i r + ( t t r ) × V i , r + 1 V i r t r + 1 t r ] d t
In Formula (6), when the state S i V ( t r , t r + 1 ) of the change velocity is constant, the evolutionary development level Y i V usually has a positive relationship with the trend ρ ( θ r ) of the change velocity.

3.3.3. Sustainable Development Capacity Measurement Model

Referring to the ecological niche suitability model of the innovation ecosystem [75], we improve the ecological niche suitability model here to evaluate the closeness between the real ecological niche and the most suitable ecological niche [76,77]. We construct the TOPSIS ecological niche grey correlation projection model to measure the dynamic sustainability of the development of the innovation ecosystem of high-tech industries. The specific methodological steps are as follows.
Set in t k = ( 1 , 2 , , N ) time series, the realistic niche value of the j t h ( j = 1 , 2 , , n ) ecological factor index of the i t h ( j = 1 , 2 , , m ) evaluated object is x i j ( t k ) .
(1) We determine the original reality ecological niche index value matrix X ( t k ) = ( x i j ( t k ) ) m × n .
(2) The extreme value method is adopted for standardization processing, where the standardization matrix is Y ( t k ) = ( y i j ( t k ) ) m × n and the standardization formula is:
y i j ( t k ) = x i j ( t k ) min i x i j ( t k ) max i x i j ( t k ) min i x i j ( t k )
The ideal niche is determined based on positive and negative ideal solutions. Set at time t k , the maximum value of each evaluation object of the i t h ecological niche indicator is taken as the positive ideal niche, while the minimum value is the negative ideal niche, which can be expressed as:
Y + ( t k ) = y 01 + ( t k ) , , y 0 n + ( t k ) , y 0 j + ( t k ) = max i ( y i j ( t ) ) ( t )
Y ( t k ) = y 01 ( t k ) , , y 0 n ( t k ) , y 0 j ( t k ) = min i ( y i j ( t ) ) ( t )
(3) We determine the niche index weight w j ( t k ) .
Owing to the different influence degree of each ecological factor on the system, the weight value assigned to it is also different. The entropy method is adopted in this study to calculate the weight of each ecological factor at time t k , and the formula is as follows:
w j ( t k ) = 1 e j ( t k ) j = 1 n ( 1 e j ( t k ) )
Among them, e j ( t k ) = 1 ln m i = 1 m y i j ( t k ) i = 1 m y i j ( t k ) ln y i j ( t k ) i = 1 m y i j ( t k )
(4) The ideal niche weighted grey correlation is based on the niche fitness model.
If the ideal niche Y * ( t k ) = y 01 * ( t k ) , , y 0 n * ( t k ) is set, the grey correlation coefficient between the realistic niche and the ideal niche is:
ξ i j ( t k ) = min i min j y o j * ( t k ) y i j ( t k ) + ρ max i max j y o j * ( t k ) y i j ( t k ) y o j * ( t k ) y i j ( t k ) + ρ max i max j y o j * ( t k ) y i j ( t k )
where ρ is the model coefficient, ρ 0 , 1 , and usually ρ = 0.5 . The ideal niche is decomposed into positive and negative ideal niches, so the grey correlation coefficient matrix of the positive ideal niche is E + ( t k ) = ξ i j + ( t k ) m × n , and the grey correlation coefficient matrix of the negative ideal niche is E ( t k ) = ξ i j ( t k ) m × n . Combined with the niche index weight w j ( t k ) , the positive and negative ideal niche weighted grey correlation matrix F + ( t k ) and F ( t k ) were obtained. Thus, the positive and negative ideal ecotone grey correlation projection values are:
D i ± ( t k ) = j = 1 m ξ i j ± ( t k ) ω ^ j ( t k ) , ( i = 1 , 2 , , n ; k = 1 , 2 , , N )
The progress of obtaining the niche grey association projection paste is:
R i ( t k ) = ( D i + ( t k ) ) 2 , ( D i + ( t k ) ) 2 + ( D i ( t k ) ) 2 , ( i = 1 , 2 , , n ; k = 1 , 2 , , N )
The greater the grey correlation projection closeness R i of the ecological niche, the closer it is to the positive ideal ecological niche and the better the sustainable development capability of the innovation ecosystem of high-tech industry; in contrast, the smaller the grey correlation projection closeness R i of the ecological niche, the worse the sustainable development capability of the innovation ecosystem of high-tech industry.

3.3.4. Development Capacity Measurement Model

Since the comprehensive development capacity of the innovation ecosystem involves the organic integration of the coordinated development capacity, evolutionary development capacity, and sustainable development capacity, a comprehensive measurement model of the system’s development capacity is constructed with the following formula:
P = i = 1 3 θ i × D i
Here, let D 1 = C , D 2 = Y , D 3 = R , C be the system capacity measure, Y be the evolutionary capacity measure, R be the sustainability capacity measure, and P be the combined level of the three dimensions, with θ i being the coefficient to be determined, θ 1 + θ 2 + θ 3 = 1 . In this study, all three dimensions are considered equally important, θ 1 = θ 2 = θ 3 = 1 / 3 . Here, P is the innovation ecosystem capacity measure; the larger P is, the stronger the system capacity.

3.4. Data Sources

In order to ensure the availability, continuity, and integrity of the data, this study takes the high-tech industry innovation ecosystem of 30 provincial administrative regions (except the Tibet Autonomous Region, Hong Kong and Macao Special Administrative Regions, and Taiwan Province) as the research object, and obtains the relevant data for each province from 2013 to 2021 from the China Statistical Yearbook of High-Tech Industries, China Statistical Yearbook of Science and Technology, and China Torch Statistical Yearbook. We collected the data online using keywords. The daily average value of the Baidu search index for the keyword ‘high technology’ was collected online.

4. Empirical Analysis and Discussion

4.1. Empirical Results and Analysis

4.1.1. Measurement Results and Analysis of Coordinated Development Capacity

The raw data for each province and city were obtained for dimensionless quantification, and the synergy degrees of the system in different regions from 2013 to 2021 were derived from Equations (1)–(3), as shown in Table 2.
From Table 2, it can be seen that most of the synergy degrees of the system of provinces and cities in 2012–2021 were negative, and the level of system synergy was generally low. In addition, the change trends of system synergy among the provinces and cities vary significantly, with most provinces and cities showing an overall upward trend in the level of synergy but with sharp fluctuations from year to year and significant instability, indicating that the coordinated development capability of China’s high-tech industrial innovation ecosystem is poor. The reasons for this development are as follows. First, China’s high-tech industry innovation development momentum is insufficient, and the basic resources are weak and unevenly distributed. Second, the lack of information exchange and interaction between innovation subjects, the mismatch between the level of social participation and awareness, and the level of industrial development affect the promotion of scientific and technological achievements and the industrialization process. This makes coordinated development difficult. This is consistent with the results for systematic synergy studied by Wu et al. [7], who found that the four-helix innovation synergy of China’s high-tech industry has significant regional differences, with a generally low synergy degree and large fluctuation range. Secondly, He et al. [61] found that the development level of the production and operation subsystem, R&D and innovation activities, and fixed asset investment of the high-tech industrial innovation ecosystem in 31 provinces and cities in China is unbalanced. From the perspective of the development level, there are a few provinces and cities in the eastern part of the country that are in the high level of the high-tech industrial innovation ecosystem, while more provinces and cities in the west are in the low level. This is generally consistent with the results of this study.

4.1.2. Measurement Results and an Analysis of the Evolution and Development Capacity

The data for the measurement indicators were standardized, and the measurement results for the evolutionary development capacity of each indicator from 2013 to 2021 were calculated according to Equations (4)–(6) and multiplied by the corresponding indicator weights to sum up the results for each provincial and municipal system’s evolutionary development capacity, as shown in Table 3.
As can be seen from Table 3, during the period 2013–2021, most provinces and cities showed a fluctuating upward trend, except for Shanxi, Shaanxi, and Gansu, where the system evolution development level showed a fluctuating downward trend. In addition, except for Beijing, Tianjin, and Guangdong, other provinces and cities reached the lowest values for the system evolutionary development level during 2015–2016, which was mainly because China was actively promoting the transformation and upgrading of the industrial structure at this stage and the innovation input factors had changed. This resulted in the internal system, between subsystems and between the system and the external environment, failing to meet requirements. The components that needed upgrades included capital, technology, information, and other various factors to address the poor mobility, low speed of the system element flow, and low level of evolutionary development. In contrast, during the period 2016–2021, most provinces and municipalities showed an increasing trend for the level of the system’s evolution and development, mainly due to the new development concept, and all provinces and cities actively responded to it and were guided by the new development concept to actively promote the green development and coordinated development of the innovation ecology, so as to guarantee China’s economic development. This is similar to the research results of Liu et al. [67], who found that the dynamic evolution capacity of the innovation ecosystem of high-tech industry was slightly increased but the synergy of innovation populations in the innovation ecosystem was still lacking power.

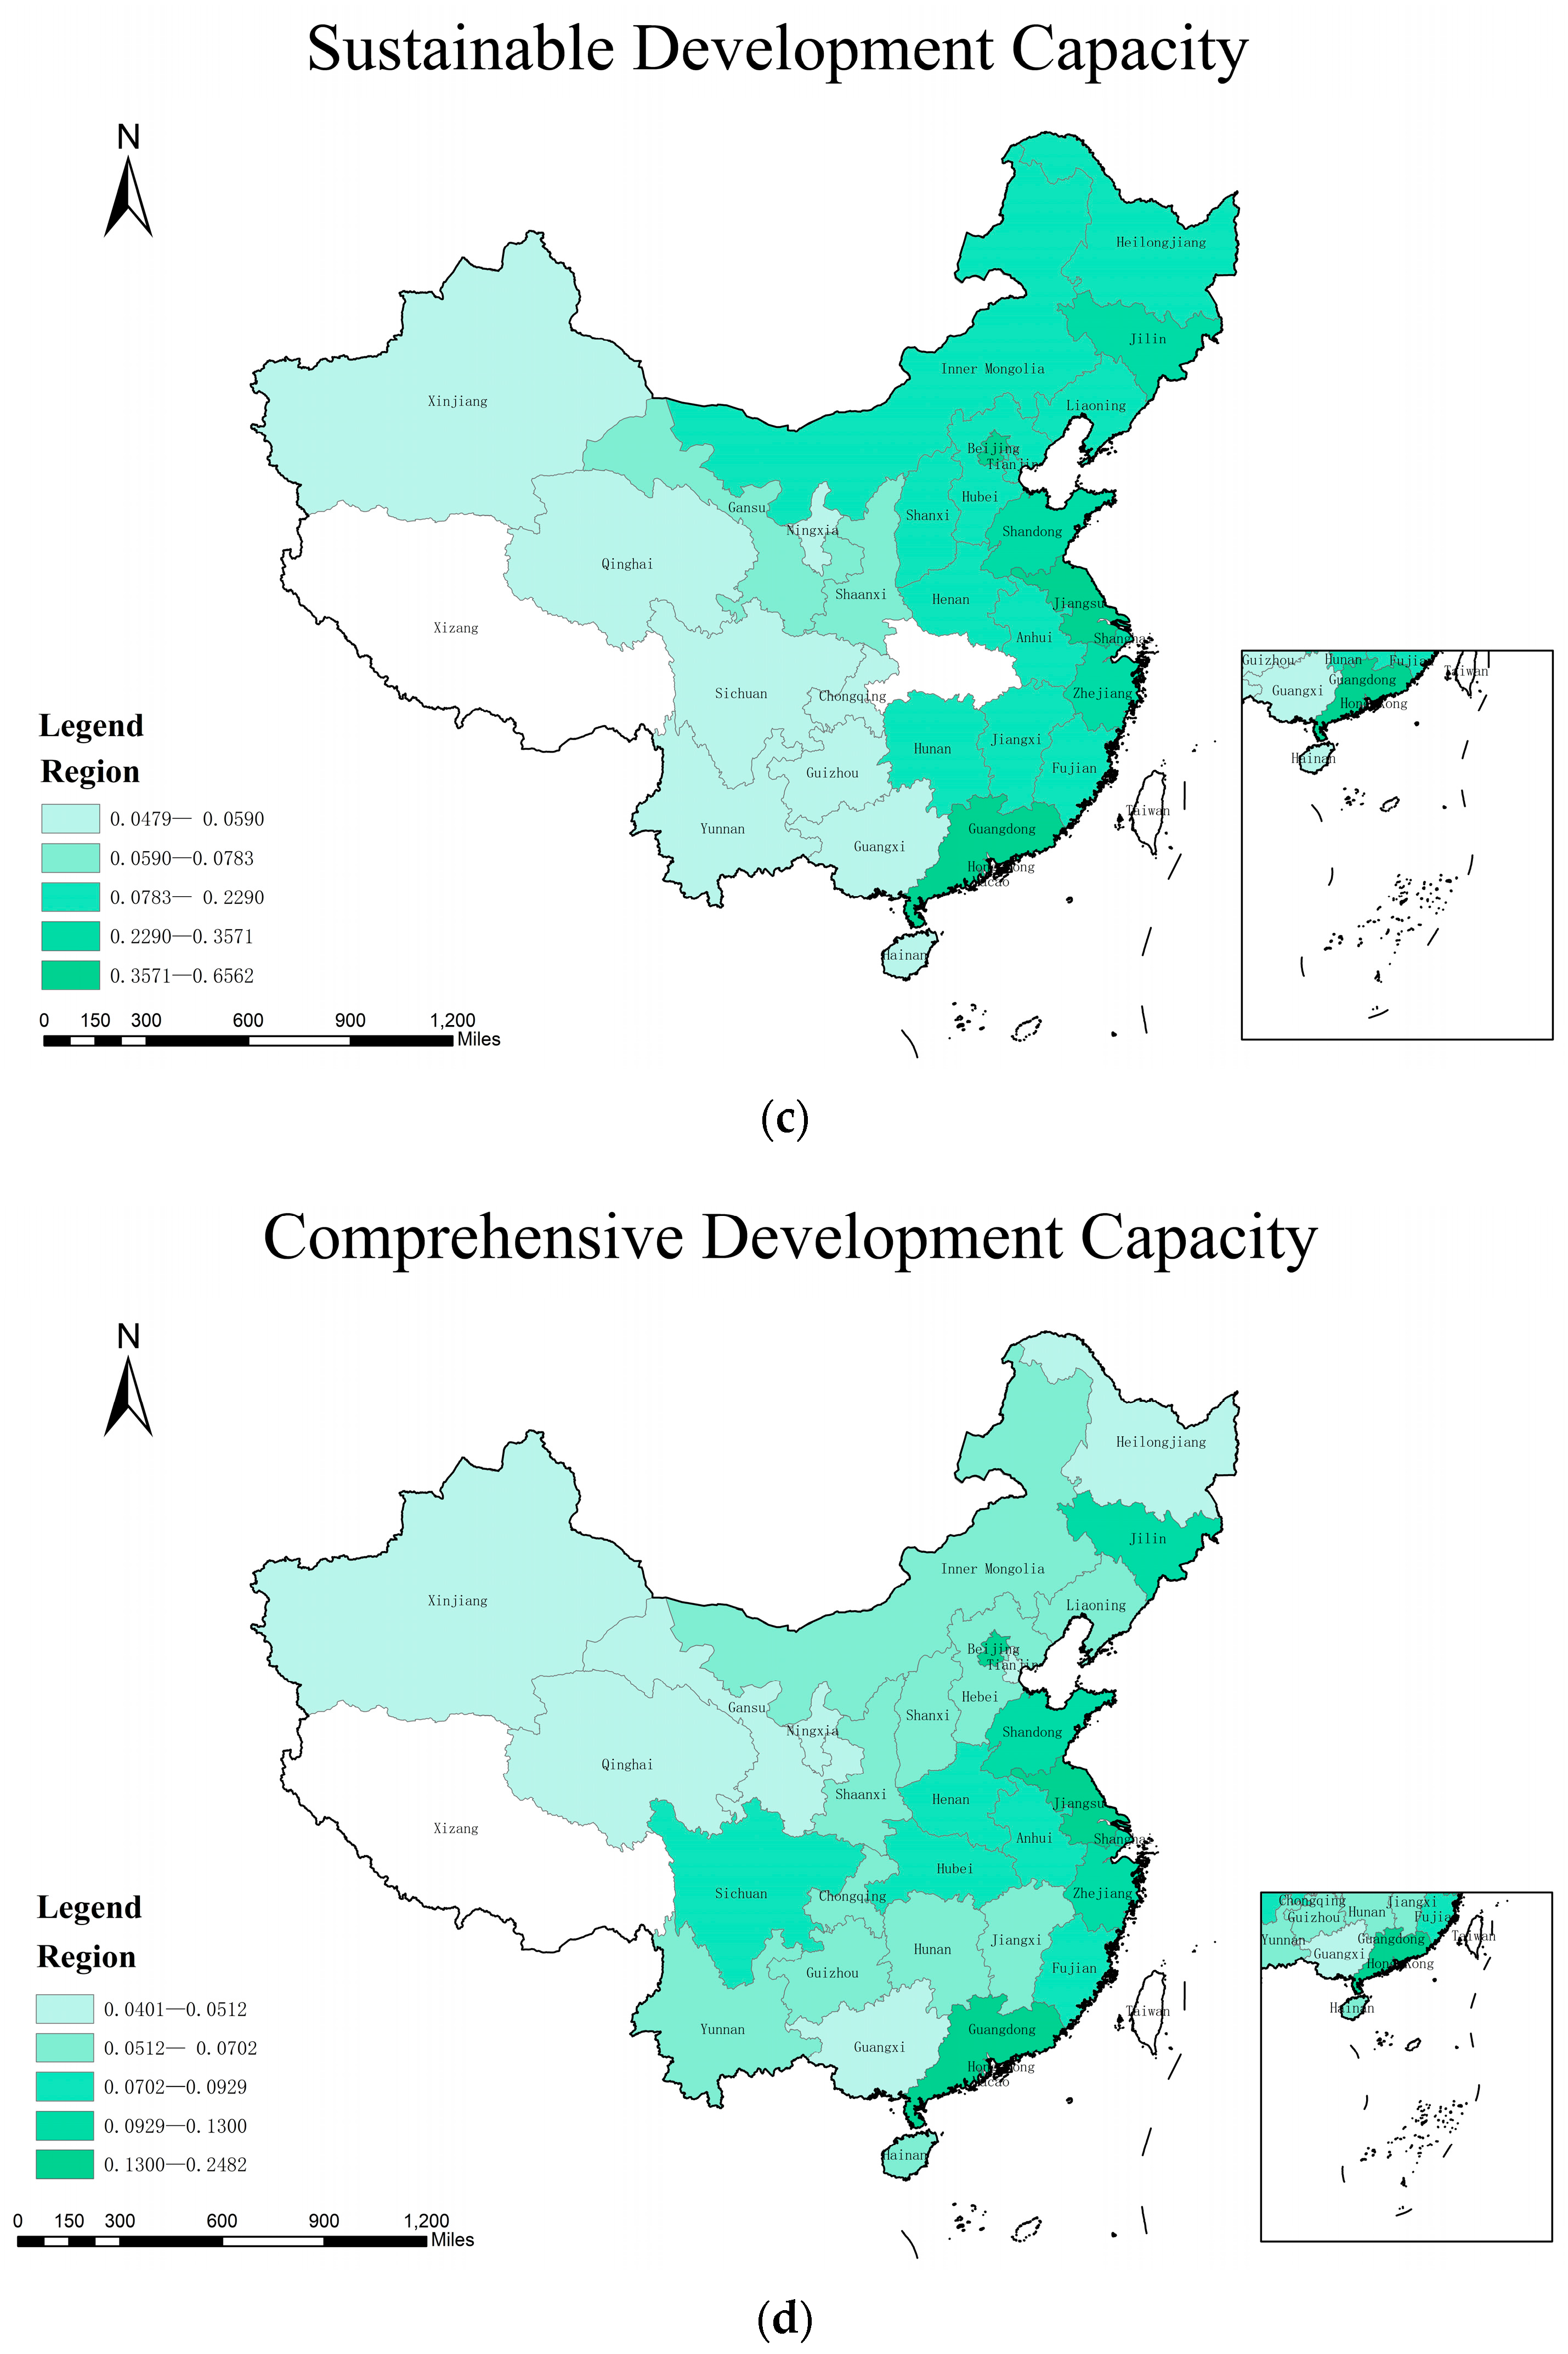
4.1.3. Measurement Results and an Analysis of the Sustainable Development Capacity

The results of the system sustainability measurements of 30 provinces and cities in China from 2012 to 2021 were obtained according to Equations (7)–(13), as shown in Table 4.
As can be seen in Table 4, during the period 2012–2021, the sustainability levels of innovation ecosystems in Jiangsu, Beijing, and Guangdong were leading the country, and the sustainability of the innovation ecosystems in most provinces and cities was evolving steadily. The spatial layout of the system’s sustainable development capacity showed a more obvious ‘high in the east and low in the west’ trend, with greater development capacity mainly concentrated in the developed eastern regions such as Jiangsu, Guangdong, and Zhejiang, while the development capacity of the innovation ecosystems in the central and western regions was lower. This was because the eastern regions are relatively resource-rich in terms of capital, technology, and talent and have a higher capacity for public participation. The system is more capable of self-regulation internally and can adapt and adjust in a timely manner when the external environment changes, so the system has a stronger capacity for dynamic and sustainable development. In contrast, the lack of basic resources and insufficient innovation capacity in the western region, as well as the disadvantage of the location, to a certain extent restricted the dynamic and sustainable development of the system. This result is consistent with the research results of Wu et al. [7], who found that the four-helix niche suitability showed significant regional differences, with higher areas mainly distributed in the eastern coastal areas, with Jiangsu and Guangdong being more prominent and Shandong and Beijing also showing a higher level, and with many western provinces basically at a lower level. In addition, Liu et al. [67] found that in recent years, the sustainable innovation input of the high-tech industry innovation ecosystem is not proportional to the sustainable innovation output, high sustainable innovation input does not lead to high sustainable output, and the sustainable development capacity of the system is insufficient.

4.1.4. Measurement Results and Analysis of System Development Capability

The dynamic composite measure of each dimension and its ranking were obtained by a quadratic weighting calculation of each dimension through the temporal degree model [78], based on which the dynamic composite value of each dimension was brought into Equation (14) to obtain the comprehensive development capability measure and ranking of the innovation ecosystem, as shown in Table 5 and Figure 2.
As can be seen from Table 5 and Figure 2, the distribution of the dynamic composite measure values and ranking of each dimension is basically consistent with the changing trend of each dimension itself. As can be seen from Table 5 and Figure 2a, the spatial distribution of the system coordination and development capability shows significant regional differences, with Yunnan and Guangdong showing relatively strong levels of system synergy, while Beijing and Qinghai show less satisfactory levels. According to Table 5 and Figure 2b, we can see that the spatial distribution of the system’s evolutionary development capacity also shows significant regional differences, and the liquidity of system innovation elements in Guangdong and Guizhou is relatively strong, while the liquidity of system innovation elements in Tianjin and Heilongjiang is relatively weak. From Table 5 and Figure 2c, we can see that the spatial distribution of the system’s sustainability is not significantly different, showing a high level in the east and a low level in the west, among which the system sustainability level is relatively high in Jiangsu and Beijing and low in Xinjiang and Qinghai. It can be seen that in terms of spatial distribution, the regional differentiation of the system’s coordinated development capacity and evolutionary development capacity is more significant than that of the sustainable development capacity, while the spatial layout of the system’s sustainable development capacity tends to be consistent with the comprehensive development capacity of the system. As can be seen from Figure 2d, under the interaction of the three dimensions of development capability, the comprehensive development capability of the system in each region also shows a ‘high in the east and low in the west’ layout. The system development capacity of the eastern region, represented by Guangdong Province, Beijing, and Jiangsu Province, is stronger, followed by Shandong, Zhejiang, and Shanghai; the system development capacity of Qinghai, Gansu, and Ningxia is weaker.

4.2. Sensitivity Analysis

The dynamic composite values of each dimension, brought into Equation (14) separately, were used to conduct a sensitivity analysis of the composite measure values and a ranking of the development capacity of each provincial and municipal system through the differential assignment of preference parameters. Due to space constraints, only some of the parameters were selected for a comparative analysis of the combined ranking values of the system, as shown in Figure 3.
As seen from Figure 3, when the parameters take different values, the trend of change in the comprehensive ranking of the most provincial and municipal systems is not significant, and some provinces and cities have significant differences in the comprehensive ranking values of the system, while the ranking differences for Guangdong, Shanghai, Jiangsu, Zhejiang, and Beijing, where the system has strong development capability, are not significant. From the ranking difference results, the comprehensive measurement results of the system’s development capacity, calculated by using the preferred parameter sensitivity method, are more stable, and when the parameters take different values, this has little impact on the comprehensive ranking results of the development capacity of the system.

5. Conclusions and Future Prospects

5.1. Conclusions

Based on the four-spiral perspective, the development capability framework of the industrial innovation ecosystem was designed, which includes three dimensions: the coordinated development capability, evolutionary development capability, and sustainable development capability. The composite system synergy degree model, speed incentive model, and TOPSIS niche projection model were respectively used to measure the different dimensions of the system capability. On this basis, a measurement model of the system’s comprehensive development ability was constructed. The results of this study are as follows: (1) The synergy degree of high-tech industrial innovation ecosystems in various provinces and cities is mostly negative, and the level of system synergy degree is generally low, indicating that the coordinated development capability of the high-tech industrial innovation ecosystems is poor. (2) Except for Shanxi, Shaanxi, and Gansu, where the level of system evolutionary development tends to fluctuate downwards, most provinces and cities show a fluctuating but generally upward trend, indicating that the level of evolutionary development of system innovation factors is high. (3) The sustainability of the system in Jiangsu, Beijing, and Guangdong has been in the leading position nationwide, and the sustainability of the system in most provinces and cities shows a stable evolutionary trend. The sustainability capacity of the system shows a more obvious spatial layout of ‘high in the east and low in the west’. (4) The dynamic comprehensive measurement values and ranking distribution of each dimension are basically consistent with the changing trend of each dimension itself, with the central region’s coordinated development capability and evolutionary development capability being relatively satisfactory, while the eastern region’s sustainable development capability is more satisfactory. The comprehensive development capacity of the innovation ecosystem of high-tech industries in each region also shows some regional differences, showing a layout of ‘high in the east and low in the west’. (5) The generally low level of coordinated development capability of the system inhibits the comprehensive level of the system’s development capability to a certain extent; the level of evolutionary development capability and sustainable development capability of the system is more desirable, thereby promoting the development of the system.

5.2. Implications for Theory and Practice

This study measures the development ability of the high-tech industrial innovation ecosystem from different dimensions and analyzes the comprehensive development ability of the system, which has important theoretical and practical significance for promoting the coordinated and sustainable development and orderly evolution of the system.
This study has important theoretical significance. Compared with the previous single research methods, this study innovatively assessed the development capability of the innovation ecosystem via a framework system of three dimensions, including the coordinated development capability, the evolutionary development capability, and the sustainable development capability. In this paper, the collaborative degree model, the velocity incentive model, and the niche projection model based on TOPSIS were adopted to empirically study the coordinated development ability, evolutionary development ability, and sustainable development ability of the system. The TOPSIS niche projection model was constructed by combining the TOPSIS, grey correlation projection, and niche models, through which the sustainable development ability of the system was analyzed.
This study also has important practical significance. This study aimed to improve the methodology of the research framework system of the innovation ecosystem and provide direction and strategies for improving the comprehensive development ability of the industrial innovation ecosystem.
In addition, this study also contains some lessons, as follows. (1) From the perspective of the coordinated development ability, we should give consideration to the multiple innovation factor inputs, promote the coordinated development of innovation factors, and prevent the “weak board effect” and system “imbalance” in the face of the objective reality of the low synergy degree of the high-tech industry innovation ecosystem in our country and the disparity between the east and west. At the same time, the efficiency of the utilization and transformation of innovation resources should be improved, and the public should be encouraged to participate actively so as to create an open and shared ecological environment for industrial innovation. (2) From the perspective of the evolutionary development capacity, it is necessary to establish and improve the network platform for innovation resource development and sharing; realize the interconnection of the regional resource input, transformation, and output; expand the market opening; promote the full opening of overseas investment, high-tech parks, and economic free trade zones; and make use of emerging technologies such as big data and artificial intelligence to realize the co-construction and sharing of infrastructure and public services, as well as to foster a sound environment for regional innovation. (3) From the perspective of the sustainable development ability, government departments should increase their financial support and policy support for technological innovation, formulate strategies suitable for regional high-tech industry development according to regional resource advantages, develop technologies suitable for regional factor endowment and the industrial structure according to local conditions, form their own industrial characteristics and competitive advantages, and narrow the regional development gap.

5.3. Limitations

There are some limitations to this study, which need to be further improved in future studies. First of all, the sample size of the study is small. Considering the availability and effectiveness of the data, there are limitations to the regional selection and sample size. Future studies may further optimize the index construction and selection process, including different regional sample sizes. Secondly, regarding the three dimensions of innovation ecosystem development capability designed in this paper, whether there is a correlation between each dimension, the coupling effect of the different dimensions on the overall development capability of the system still needs to be further discussed. Third, how to optimize the comprehensive development ability of the innovation ecosystem has not been deeply analyzed, and further studies are needed.

Author Contributions

Conceptualization, M.L. and J.L.; methodology, M.L. and J.L.; software, M.L. and Y.L.; validation, H.C. and J.L.; writing—original draft preparation, M.L., J.L. and Y.L.; writing—review and editing, M.L. and H.C.; All authors have read and agreed to the published version of the manuscript.

Funding

This paper was supported by the Social Science Foundation of Heilongjiang Province (grant number 20JYC156), Natural Science Foundation of Heilongjiang Province (grant number YQ2021G003), Soft science Project of Ministry of Industry and Information Technology of China (grant number GXZK2023-07), Industry-university Cooperative Education Project of the Ministry of Education of China (grant number 220601590230314), Undergraduate Teaching Reform Project of Harbin Engineering University (grant number JG2022B0906).

Data Availability Statement

The data presented in this study are available on request from the first author.

Conflicts of Interest

The authors declare no conflict of interest.

References

  1. Tan, J.S.; Song, J.; Chen, X.H. The formation and evolution of industrial innovation ecosystem: ‘Architect’ transition and the evolution of its strategic behavior. Manag. World 2021, 37, 167–191. [Google Scholar] [CrossRef]
  2. Chen, Z.T.; MENG, F.R.; Wang, H. The research on the impact of government support on innovation efficiency of high—Technological industries. Stud. Sci. Sci. 2020, 38, 1782–1790. [Google Scholar] [CrossRef]
  3. Etzkowitz, H. Technology transfer: The second academic revolution. Technol. Access Rep. 1993, 6, 7–9. [Google Scholar]
  4. Etzkowitz, H.; Leydesdorff, L. The triple helix-University-Industry-Government relations: A laboratory for knowledge based economic development. EASST Rev. 1995, 14, 14–19. [Google Scholar]
  5. Etzkowitz, H.; Leydesdorff, L. The endless transition: A "triple helix" of university-industry-government relations: Introduction. Minerva 1998, 36, 203–208. [Google Scholar] [CrossRef]
  6. Ranga, M.; Etzkowitz, H. Triple Helix systems: An analytical framework for innovation policy and practice in the knowledge society. Ind. High. Educ. 2013, 27, 237–262. [Google Scholar] [CrossRef] [Green Version]
  7. Wu, F.F.; Tong, Y.M.; Huang, L.C. Organic evaluation of innovation ecosystem of China’s high-tech industry-from the perspective of innovation quadruple helix. Sci. Technol. Prog. Countermeas. 2020, 37, 67–76. [Google Scholar]
  8. Leydesdorff, L.; Etzkowitz, H. Can ‘The Public’ be considered as a fourth helix in university-industry-government relations? Report of the fourth triple helix conference. Sci. Public Policy 2003, 30, 55–61. [Google Scholar] [CrossRef]
  9. Von HIPPEL, E. Democratizing Innovation; The MIT Press: Cambridge, MA, USA, 2006. [Google Scholar] [CrossRef] [Green Version]
  10. Carayannis, E.G.; Campbell, D.F.J. ‘Mode 3’ and ‘Quadruple Helix’: Toward a 21st century fractal innovation ecosystem. Int. J. Technol. Manag. 2009, 46, 201–234. [Google Scholar] [CrossRef] [Green Version]
  11. McAdam, M.; Debackere, K. Beyond ‘triple helix’ toward ‘quadruple helix’ models in regional innovation systems: Implications for theory and practice. R D Manag. 2018, 48, 3–6. [Google Scholar] [CrossRef]
  12. Carayannis, E.G.; Campbell, D.F.J.; Grigoroudis, E. Helix trilogy: The triple, quadruple, and quintuple innovation helices from a theory, policy, and practice set of perspectives. J. Knowl. Econ. 2022, 13, 2272–2301. [Google Scholar] [CrossRef]
  13. Carayannis, E.G.; Grigoroudis, E.; Goletsis, Y. A multilevel and multistage efficiency evaluation of innovation systems: A multi-objective DEA approach. Expert Syst. Appl. 2016, 62, 63–80. [Google Scholar] [CrossRef]
  14. Roman, M. Smart specialization as a strategy to develop early-stage regional innovation systems. Eur. Plan. Stud. 2018, 26, 2125–2146. [Google Scholar] [CrossRef]
  15. Lew, Y.K.; Khan, Z.; Cozzio, S. Gravitating toward the quadruple helix: International connections for the enhancement of a regional innovation system in Northeast Italy. RD Manag. 2018, 48, 44–59. [Google Scholar] [CrossRef]
  16. Roman, M.; Varga, H.; Cvijanovic, V.; Reid, A. Quadruple helix models for sustainable regional innovation: Engaging and facilitating civil society participation. Economies 2020, 8, 48. [Google Scholar] [CrossRef]
  17. Malik, A.; Sharma, P.; Pereira, V.; Temouri, Y. From regional innovation systems to global innovation hubs: Evidence of a Quadruple Helix from an emerging economy. J. Bus. Res. 2021, 128, 587–598. [Google Scholar] [CrossRef]
  18. Carayannis, E.G.; Grigoroudis, E.; Stamati, D.; Valvi, T. Social business model innovation: A quadruple/quintuple helix-based social innovation ecosystem. IEEE Trans. Eng. Manag. 2021, 62, 235–248. [Google Scholar] [CrossRef]
  19. Adner, R. Match your innovation strategy to your innovation ecosystem. Harv. Bus. Rev. 2006, 84, 98–107. [Google Scholar] [PubMed]
  20. Adner, R. Ecosystem as structure: An actionable construct for strategy. J. Manag. 2017, 43, 39–58. [Google Scholar] [CrossRef]
  21. Adner, R.; Kapoor, R. Value creation in innovation ecosystems: How the structure of technological interdependence affects firm performance in new technology generations. Strateg. Manag. J. 2010, 31, 306–333. [Google Scholar] [CrossRef]
  22. Dedehayir, O.; Makinen, S.J.; Ortt, J.R. Roles during innovation ecosystem genesis: A literature review. Technol. Forecast. Soc. Change 2016, 136, 18–29. [Google Scholar] [CrossRef] [Green Version]
  23. Granstrand, O.; Holgersson, M. Innovation ecosystems: A conceptual review and a new definition. Technovation. 2020, 90–91, 1–12. [Google Scholar] [CrossRef]
  24. Su, Y.S.; Zheng, Z.X.; Chen, J. A multi-platform collaboration innovation ecosystem: The case of China. Manag. Decis. 2018, 56, 125–142. [Google Scholar] [CrossRef]
  25. Yan, R.X.; Lv, J.L.; Meng, Q.S. Sustainable development of the innovation ecosystem from the perspective of T-O-V. J. Math. 2021, 3419175. [Google Scholar] [CrossRef]
  26. Wang, F.M.; Zhu, M.J. A research on the value co-creation behavior coordination mechanism of the innovation ecosystem. Sci. Res. Manag. 2019, 40, 71–79. [Google Scholar] [CrossRef]
  27. Ketonen, O.S.; Valkokari, K. Innovation ecosystems as structures for value co-creation. Technol. Innov. Manag. Rev. 2019, 9, 25–35. [Google Scholar] [CrossRef] [Green Version]
  28. Sun, Y.; Xu, X.B.; Yu, H.Q.; Wang, H.C. Impact of value co-creation in the artificial intelligence innovation ecosystem on competitive advantage and innovation intelligibility. Syst. Res. Behav. Sci. 2022, 39, 474–488. [Google Scholar] [CrossRef]
  29. Tang, F.C.; Qian, Z.Q. Leveraging interdependencies among platform and complementors in innovation ecosystem. PLoS ONE. 2020, 15, e0239972. [Google Scholar] [CrossRef]
  30. Zhang, Z.; Zeng, G. Evaluation of regional innovation ecosystem sustainable development ability in China. J. Ind. Technol. Econ. 2021, 40, 38–43. [Google Scholar]
  31. Yin, D.; Ming, X.G.; Zhang, X.Y. Sustainable and smart product innovation ecosystem: An integrative status review and future perspectives. J. Clean. Prod. 2020, 274, 123005. [Google Scholar] [CrossRef]
  32. Song, J. Innovation ecosystem: Impact of interactive patterns, member location and member heterogeneity on cooperative innovation performance. Innov. Manag. Policy Pract. 2016, 18, 13–29. [Google Scholar] [CrossRef]
  33. Radziwon, A.; Bogers, M. Open innovation in SMEs: Exploring inter-organizational relationships in an ecosystem. Technol. Forecast. Soc. Change. 2019, 146, 573–587. [Google Scholar] [CrossRef]
  34. Xie, X.M.; Wang, H.W. How can open innovation ecosystem modes push product innovation forward? An fsQCA analysis. J. Bus. Res. 2020, 108, 29–41. [Google Scholar] [CrossRef]
  35. Helfat, C.E.; Raubitschek, R.S. Dynamic and integrative capabilities for profiting from innovation in digital platform-based ecosystems. Res. Policy. 2018, 47, 1391–1399. [Google Scholar] [CrossRef]
  36. Chae, B.K. A general framework for studying the evolution of the digital innovation ecosystem: The case of big data. Int. J. Inf. Manag. 2019, 45, 83–94. [Google Scholar] [CrossRef]
  37. Sun, Y.L.; Zhu, R.J.; Song, J. Research on the evolution and governance of digital innovation ecosystem. Stud. Sci. Sci. 2023, 41, 325–334. [Google Scholar] [CrossRef]
  38. Beltagui, A.; Rosli, A.; Candi, M. Exaptation in a digital innovation ecosystem: The disruptive impacts of 3D printing. Res. Policy. 2020, 49, 103833. [Google Scholar] [CrossRef]
  39. Moore, J.F. Predators and prey: A new ecology of competition. Harv. Bus. Rev. 1993, 71, 75–86. [Google Scholar]
  40. Dhanasai, C.; Parkhe, A. Orchestrating innovation networks. Acad. Manag. Rev. 2006, 31, 659–669. [Google Scholar]
  41. Fransman, M. Innovation in the new ICT ecosystem. Commun. Strateg. 2008, 68, 89–109. [Google Scholar]
  42. Ritala, P.; Armila, L.; Blomqvist, K. Innovation orchestration capability—Defining the organizational and individual level determinants. Int. J. Innov. Manag. 2009, 13, 569–591. [Google Scholar] [CrossRef]
  43. Leong, Y.Y. Combining resource-based and evolutionary theory to explain the genesis of bio-networks. Ind. Innov. 2008, 15, 669–686. [Google Scholar]
  44. Dougherty, D.; Danielle, D.D. Organizing ecologies of complex innovation. Organ. Sci. 2011, 22, 1214–1223. [Google Scholar] [CrossRef]
  45. Brandenburger, A.M.; Stuart, H.W. Value-based business strategy. J. Econ. Manag. Strategy. 1996, 5, 5–24. [Google Scholar] [CrossRef]
  46. Afuah, A. How much do your co-opetitors’ capabilities matter in the face of technological change? Strateg. Manag. J. 2000, 21, 397–404. [Google Scholar] [CrossRef]
  47. Jacobides, M.G.; Knudsen, T.; Augier, M. Benefiting from innovation: Value creation, value appropriation and the role of industry architectures. Res. Policy. 2006, 35, 1200–1221. [Google Scholar] [CrossRef]
  48. Pisano, G.P.; Teece, D.J. How to capture value from innovation: Shaping intellectual property and industry architecture. Calif. Manag. Rev. 2007, 50, 278–296. [Google Scholar] [CrossRef] [Green Version]
  49. Gulati, R.; Puranam, P.; Tushman, M. Meta-organization design: Rethinking design in interorganizational and community contexts. Strateg. Manag. J. 2012, 33, 571–586. [Google Scholar] [CrossRef]
  50. Yao, J.; Li, H.J.; Shang, D.; Ding, L.Y. Evolution of the industrial innovation ecosystem of resource-based cities (RBCs): A case study of Shanxi province, China. Sustainability. 2021, 13, 11350. [Google Scholar] [CrossRef]
  51. Yu, X.H.; Qi, Y.; Yu, L.Z.; He, Y.Y. Temporal and spatial evolution of coupling coordination degree of industrial innovation ecosystem-from the perspective of green transformation. Sustainability. 2022, 14, 4111. [Google Scholar] [CrossRef]
  52. Ge, S.; Liu, X.L. Catch-up in solar PV industry of China: A perspective of industrial innovation ecosystem. Int. J. Innov. Technol. Manag. 2022, 19, 2250016. [Google Scholar] [CrossRef]
  53. Xu, G.N.; Zhou, Y.; Wu, X.B. Building multi-layered innovation ecosystems in emerging industries: Theoretical framework and empirical study. Sci. Sci. Manag. S. & T. 2020, 41, 98–115. [Google Scholar]
  54. Zhao, T.Y.; Wang, H.Q.; Li, Y.; Deng, Q.Y. Formation mechanism of the comprehensive advantage of emerging industry innovation ecosystem: A case study of new energy vehicle industry. Stud. Sci. Sci. 2023. [Google Scholar] [CrossRef]
  55. Wang, H.Q.; Liu, M.; Wu, C.; Wu, J.L. Research on the evalution of the stability level of regional strategic emerging industry innovation ecosystem. Sci. Technol. Prog. Policy 2020, 37, 118–125. [Google Scholar]
  56. Shan, W.; Chen, R.C. The characteristics, structure and operational mechanism of high-tech enterprise innovation ecosystem. In Proceedings of the 22nd International Conference on Management Science and Engineering, Dubai, United Arab Emirates, 30 September–1 October 2015; pp. 1496–1504. [Google Scholar]
  57. Yang, J.Z.; Li, X.D. The operating mechanism of high-tech industry innovation ecosystem. Acad. Exch. 2016, 8, 134–139. [Google Scholar]
  58. Yan, J.D.; Yu, X.; Liu, P.C.; Zhang, Q. High-tech service platform ecosystem evolution: A simulation analysis using Lotka-Volterra model. Tech. Gaz. 2020, 27, 1509–1518. [Google Scholar] [CrossRef]
  59. Zhang, Y.S. Research on coupling strategy of high-tech industry innovation ecosystem. China Soft Sci. 2009, 134–143. [Google Scholar]
  60. Zhang, L.F. The asymmetric coupling mechanisms of technology populations of innovation ecosyste. Stud. Sci. Sci. 2015, 33, 1100–1108. [Google Scholar] [CrossRef]
  61. He, X.W.; Zhou, W.Y. A classified evaluation of innovation ecosystem cooperativity of regional hi-tech industries. Stud. Sci. Sci. 2018, 36, 541–549. [Google Scholar] [CrossRef]
  62. Fan, D.C.; Gu, X.M. Health evaluation and key influencing factors of technological innovation ecosystem in high-tech industry: An empirical study based on improved entropy-Dematel-ISM combination method. Oper. Res. Manag. 2021, 30, 167–174. [Google Scholar]
  63. Song, H.; Chen, S.J. How to build a healthy innovation ecosystem in high-tech industry: Based on the view of core competence. Manag. Rev. 2021, 33, 76–84. [Google Scholar] [CrossRef]
  64. Zou, H.; Qin, H.; He, D.Y.; Sun, J. Research on an enterprise green innovation ecosystem from the vulnerability perspective: Evolutionary game and simulation. IEEE Access. 2021, 9, 140809–140823. [Google Scholar] [CrossRef]
  65. Su, Y.; Liu, M. Research on sustainable development mechanism and evaluation of high-tech enterprise innovation ecosystem. Guizhou Soc. Sci. 2018, 5, 105–113. [Google Scholar] [CrossRef]
  66. Lei, Y.Y.; Chen, G.J.; Liu, Q.L. Innovation niche suitability and evolution of high-tech industry innovation ecosystem. Syst. Eng. 2018, 36, 103–111. [Google Scholar]
  67. Liu, L.J.; Xiang, L.L.; Xia, Q. Research on innovation ecosystem evaluation of high-tech industry based on innovation policy. Sci. Res. Manag. 2020, 41, 1–9. [Google Scholar] [CrossRef]
  68. Huang, L.C. The characteristics of regional technology innovation ecosystem. China Sci. Technol. 2003, 1, 23–26. [Google Scholar] [CrossRef]
  69. Li, W.; Chang, J.; Wang, M.J.; Zhu, X.Y.; Jin, A.M. Innovation 3.0 and innovation ecosystem. Stud. Sci. Sci. 2014, 32, 1761–1770. [Google Scholar] [CrossRef]
  70. Yang, R. The definition, characteristics and its construction of innovation ecosystem. Sci. Technol. Innov. 2014, 34, 12–17. [Google Scholar]
  71. Li, X.D.; Zhang, X.Y. Research on the influence of government boundary and government—Enterprise distance on enterprise innovation. Stud. Sci. Sci. 2019, 37, 909–918+939. [Google Scholar] [CrossRef]
  72. Ogink, T.; Dong, J.Q. Stimulating innovation by user feedback on social media: The case of an online user Innovation community. Technol. Forecast. Soc. Change. 2017, 114, 295–302. [Google Scholar] [CrossRef]
  73. Meng, Q.S.; Han, W.X. Study on coordination degree model of composite system. J. Tianjin Univ. 2000, 444–446. [Google Scholar]
  74. Liu, W.W.; Shi, C.S.; Zhao, S.B. Dynamic comprehensive evaluation model with velocity characteristics. Syst. Eng. -Theory Pract. 2013, 33, 705–710. [Google Scholar]
  75. Li, X.D.; Zhang, X.Y.; Yin, S. An observation of regional innovation ecosystem development in China from the perspective of symbiosis: An analysis of temporal and spatial characteristics based on TOPSIS niche assessment projection Model. Oper. Res. Manag. 2020, 29, 198–209. [Google Scholar]
  76. Li, Z.Z.; Han, X.Z.; Li, W.L. Evolutionary dynamics model of population with niche construction and its application. Appl. Math. Mech. 2006, 27, 293–299. [Google Scholar] [CrossRef]
  77. Wu, F.M.; Li, M.J.; Xu, L.M.; Bi, J.L. Research on dynamic evaluation method and its application based on ideal solution and grey relational degree. China Manag. Sci. 2019, 12, 136–142. [Google Scholar] [CrossRef]
  78. Yager, R.R. On ordered weighted averaging aggregation operators in multi-criteria decision making. IEEE Trans. Syst. Man Cybern. 1988, 18, 183–190. [Google Scholar] [CrossRef]
Figure 1. Four-helix theoretical model of China’s high-tech industrial innovation ecosystem.
Systems 11 00338 g001
Figure 2. (a). Spatial distribution of measured values of coordinated development capacity. (b) Spatial distribution of measured values of evolutionary development capacity. (c) Spatial distribution of measured sustainable development capacity. (d) Spatial distribution of measured comprehensive development capacity.
Systems 11 00338 g002aSystems 11 00338 g002b
Figure 3. System composite ranking values of provinces and cities under different parameter values.
Systems 11 00338 g003
Table 1. Index system for measuring the innovation ecosystem of high-tech industry.
The System StructureThe Dominant FactorOrder Parameter/Measure Factor/Niche IndexSymbolUnit
Enterprise operation subsystemEnterprise operation capabilityNumber of enterprises with R&D activitiesX11piece
Revenue from new product salesX12Ten thousand Yuan
Market liquidityImport and export volumeX13Millions of US Dollars
Amount of technology contract inflowX14One hundred million Yuan
Amount of technology contract outflowX15One hundred million Yuan
Research and development subsystemR&D innovation abilityNumber of R&D institutionsX21piece
R&D personnel equivalent to full-timeX22One year
Number of green invention patent applicationsX23piece
Proportion of R&D projects in new product development projectsX24%
R&D investmentR&D investment intensityX25%
Expenditure for technological improvement and upgradingX26Ten thousand Yuan
Mediation service subsystemInnovative talents supportNumber of incubated business mentorsX31People
Platform financial supportTotal investment in public technology platform of science and technology business incubatorX32One thousand Yuan
Accumulated venture capital investment of incubated enterprisesX33One thousand Yuan
Government-driven subsystemR&D financial inputR&D is funded by the governmentX41Ten thousand Yuan
Science and technology funds of higher education and government fundsX42Ten thousand Yuan
Financial input for platform innovationFinancial support for productivity promotion centreX43One thousand Yuan
Social participation subsystemPublic offline participationThe number of visitors to science museums that yearX51Thousands of people
Number of participants in popular science activitiesX52Thousands of people
Public online participationHigh-tech Baidu search index overall daily averageX53——
Table 2. Measurement results for the coordinated development capacity of the system in China.
ProvincesYear
201320142015201620172018201920202021
Beijing−0.0366−0.0210−0.0229−0.0159−0.0209−0.0359−0.0342−0.0353−0.0296
Tianjin−0.0266−0.0213−0.0171−0.0134−0.0142−0.0115−0.0122−0.0135−0.0131
Hebei−0.0148−0.0159−0.0211−0.01020.0175−0.0142−0.0139−0.0145−0.0153
Shanxi0.01900.0158−0.03240.0147−0.0359−0.0221−0.0234−0.0316−0.0292
Inner Mongolia−0.0371−0.0181−0.0288−0.0069−0.00420.02620.02760.01950.0234
Liaoning−0.0078−0.0196−0.0273−0.0100−0.0039−0.0039−0.0023−0.0027−0.0013
Jilin0.0167−0.0212−0.0265−0.0127−0.0163−0.0105−0.0112−0.0135−0.0109
Heilongjiang0.0304−0.0151−0.0158−0.0137−0.0114−0.0185−0.0145−0.0132−0.0126
Shanghai−0.0279−0.0220−0.0375−0.0092−0.01310.01230.01580.01340.0149
Jiangsu0.0245−0.0106−0.0230−0.0095−0.01120.00890.00710.00770.0081
Zhejiang−0.0248−0.0124−0.0175−0.01130.0108−0.0233−0.0198−0.0205−0.0182
Anhui0.0260−0.0196−0.0142−0.00410.0186−0.0170−0.0169−0.0188−0.0178
Fujian0.0196−0.0162−0.0183−0.0165−0.0096−0.0048−0.0036−0.0031−0.0027
Jiangxi0.0125−0.0136−0.0363−0.0074−0.01690.02420.02310.03240.0339
Shandong0.02960.0213−0.0290−0.0119−0.0100−0.0125−0.0127−0.0119−0.0106
Henan0.0283−0.0189−0.0207−0.0077−0.0130−0.0188−0.0193−0.0181−0.0174
Hubei−0.00960.0231−0.0237−0.0260−0.01640.01890.01730.01860.0191
Hunan0.01930.0167−0.0344−0.0199−0.0192−0.0246−0.0252−0.0199−0.0187
Guangdong0.0253−0.0092−0.0319−0.01160.00550.02010.01970.01880.0207
Guangxi−0.0348−0.0130−0.0172−0.0152−0.0157−0.0193−0.0201−0.0216−0.0199
Hainan−0.0122−0.0113−0.0246−0.0032−0.00570.01670.01580.01630.0174
Chongqing−0.0208−0.0331−0.0390−0.0110−0.0095−0.0232−0.0218−0.0224−0.0213
Sichuan0.0183−0.0217−0.0217−0.0116−0.0349−0.0168−0.0228−0.0174−0.0165
Guizhou−0.00590.0324−0.0203−0.0092−0.03270.00310.00250.00330.0042
Yunnan0.01690.0031−0.0430−0.00490.00590.02450.01320.01070.0228
Shaanxi0.02400.0325−0.0438−0.0150−0.0179−0.0059−0.0036−0.0043−0.0021
Gansu−0.02050.0205−0.0277−0.0203−0.01350.00770.00590.00370.0048
Qinghai0.0195−0.0181−0.0275−0.0513−0.0277−0.0053−0.0036−0.0043−0.0021
Ningxia0.01090.0095−0.0140−0.0208−0.0418−0.0073−0.0085−0.0054−0.0027
Xinjiang−0.01130.0111−0.0297−0.0211−0.0024−0.0026−0.0031−0.0049−0.0011
Table 3. Measurement results for the evolvement capacity of the system in China.
ProvincesYear
2013–20142014–20152015–20162016–20172017–20182018–20192019–20202020–2021
Beijing0.08980.07930.06660.03960.07040.05270.03980.0769
Tianjin0.12160.2222−0.0048−0.1605−0.0546−0.0331−0.02490.0154
Hebei0.1559−0.0103−0.15080.08390.14860.20380.31250.3964
Shanxi0.1740−0.0564−0.16320.14510.10240.12470.16520.1524
Inner Mongolia0.1306−0.0093−0.14400.01940.07380.08020.08510.0873
Liaoning0.2447−0.0089−0.27740.06230.07890.07940.08050.0856
Jilin0.1503−0.0441−0.15750.09280.10820.11060.13220.1539
Heilongjiang0.2690−0.0450−0.28440.02940.03990.04030.04520.0586
Shanghai0.0454−0.0927−0.09360.01730.08550.08960.09140.0983
Jiangsu0.1882−0.0477−0.23560.05620.08670.08780.08990.0932
Zhejiang0.0494−0.0610−0.10410.08930.13270.15790.16240.1735
Anhui0.2322−0.0043−0.17310.08830.14690.15230.16670.1691
Fujian0.18670.0092−0.11690.09120.08700.08820.09080.0967
Jiangxi0.1099−0.0407−0.05710.04120.12610.13250.15470.1926
Shandong0.28840.0213−0.24420.03900.06510.06750.07120.0733
Henan0.20640.0171−0.16650.07600.16270.16380.17240.1773
Hubei0.23900.0318−0.14680.05650.07030.08210.08860.0937
Hunan0.22350.0136−0.15750.08680.08190.09060.09320.0978
Guangdong0.0756−0.0966−0.01980.12600.15390.15970.17830.1976
Guangxi0.1289−0.0400−0.17610.05350.11070.13240.14250.1687
Hainan0.0883−0.0761−0.07640.07360.15750.23160.25370.3041
Chongqing0.20060.0474−0.11220.04520.07780.07840.08310.0869
Sichuan0.1473−0.0294−0.08570.10250.07970.08160.08640.0913
Guizhou0.23450.0378−0.18910.12250.14210.17340.18970.2165
Yunnan0.23460.0319−0.21300.06730.12400.13640.15290.1857
Shaanxi0.2703−0.0147−0.23350.09060.03790.05970.08340.0743
Gansu0.2046−0.0115−0.12320.06940.05830.06370.09260.0751
Qinghai0.1421−0.00160.00890.10370.06060.07180.08520.0762
Ningxia0.25140.0288−0.11930.13120.05420.07490.06730.0515
Xinjiang0.14690.0815−0.12870.02190.04830.05260.06310.0645
Table 4. Measurements of the sustainable development capacity of the system in China.
ProvincesYear
2012201320142015201620172018201920202021
Beijing0.56480.64040.65980.62010.60560.60660.62310.63890.65970.6834
Tianjin0.16140.19700.20420.22170.17950.16820.14740.15350.16780.1864
Hebei0.16400.14710.14450.15250.14590.15690.15380.15580.15790.1585
Shanxi0.12720.12290.12970.11870.12180.12880.12560.12830.12960.1305
Inner Mongolia0.12740.16130.16020.16310.14530.14780.14310.14450.14970.1673
Liaoning0.21680.15630.17990.17780.15630.16140.14920.15490.16670.1795
Jilin0.33390.37390.37480.34480.34790.36400.35680.36280.37540.3783
Heilongjiang0.14090.14120.14170.14700.13960.14680.14230.14570.14720.1489
Shanghai0.31240.32210.28850.36010.32030.33610.32300.34160.35380.3772
Jiangsu0.67190.64220.66890.71470.62320.63500.58910.60320.67540.6983
Zhejiang0.33010.24170.21980.27420.25960.29970.28000.29250.31570.3985
Anhui0.15630.15980.16200.17480.15970.18960.18270.18350.18590.1892
Fujian0.17420.20350.21590.21980.23190.27450.21450.23480.24080.2712
Jiangxi0.13160.15290.13700.15120.13050.13290.13480.13560.13690.1437
Shandong0.28330.32240.38080.36940.30730.34080.33440.35240.37360.3815
Henan0.15540.15260.15830.16930.16180.17860.19490.18030.18640.1932
Hubei0.21750.20760.22450.22830.26260.23940.25820.26310.24970.2525
Hunan0.16210.15400.16320.16710.16520.16980.15420.16370.16610.1689
Guangdong0.40230.53600.42060.57020.59900.74330.77910.75360.78310.7992
Guangxi0.13710.15070.15820.14640.13060.13370.13580.13050.13490.1458
Hainan0.11320.11390.11770.11200.12210.10940.10890.11150.10990.1216
Chongqing0.15970.15800.15470.15940.15950.15550.16980.17060.17580.1784
Sichuan0.18110.20030.24960.29760.23210.23230.22700.23050.24870.2839
Guizhou0.13020.12780.14510.13700.11690.12930.12920.12850.12990.1327
Yunnan0.13960.13200.13170.14170.12230.13010.14320.13850.13970.1439
Shaanxi0.20160.20690.21880.20500.18800.21040.19790.20190.21340.2249
Gansu0.11970.11530.11860.12640.11870.12600.12560.12720.12530.1281
Qinghai0.11200.11630.11360.11130.10960.11860.10630.10970.11240.1187
Ningxia0.10860.10790.10920.11110.11460.12010.10990.11370.11580.1183
Xinjiang0.12540.11900.11860.13150.11680.13390.11930.12050.13420.1375
Table 5. Dynamic comprehensive measure value and ranking of system development capability.
ProvincesDynamic Composite Values
Coordinated Development CapacityRankingEvolutionary Development CapacityRankingSustainable Development CapacityRankingComprehensive Development CapacityRanking
Beijing−0.0276300.065670.617830.21852
Tianjin−0.014922−0.0330300.1743140.042829
Hebei−0.0070100.066460.1523180.070213
Shanxi−0.0156230.058790.1251250.055623
Inner Mongolia0.000430.0199230.1487190.055822
Liaoning−0.0089170.0171260.1624150.056921
Jilin−0.0137210.0486160.357140.13004
Heilongjiang−0.013020−0.0102290.1432200.040130
Shanghai−0.0081120.0159280.326460.11146
Jiangsu−0.003470.0179250.633120.21583
Zhejiang−0.0116190.0557110.275370.10627
Anhui−0.004080.068140.1753130.079812
Fujian−0.0088160.0532130.2290100.09099
Jiangxi−0.001350.0545120.1368220.063218
Shandong−0.0086150.0182240.336550.11515
Henan−0.0078110.076730.1755120.080411
Hubei−0.003060.0419190.243580.09298
Hunan−0.0181260.0471170.1621160.063317
Guangdong0.003520.085610.656210.24821
Guangxi−0.0180250.0409210.0534210.051224
Hainan−0.000340.067350.0545290.059620
Chongqing−0.0203280.0442180.0557170.061319
Sichuan−0.0195270.0509150.057290.089010
Guizhou−0.0085140.079820.0565240.066015
Yunnan0.005710.0518140.059230.063716
Shaanxi−0.0105180.0169270.0783110.069714
Gansu−0.006990.0394200.0686270.050027
Qinghai−0.0207290.063880.0479300.051125
Ningxia−0.0164240.0566100.0557280.050926
Xinjiang−0.0083130.0315220.0573260.046128
Disclaimer/Publisher’s Note: The statements, opinions and data contained in all publications are solely those of the individual author(s) and contributor(s) and not of MDPI and/or the editor(s). MDPI and/or the editor(s) disclaim responsibility for any injury to people or property resulting from any ideas, methods, instructions or products referred to in the content.

