Article

System Dynamics Modeling: Technological Solution to Evaluating Cold-Chain Meat Packaging Scenarios

by
Ernesto A. Lagarda-Leyva
,
Luis E. Hernández-Valdez
and
Alfredo Bueno-Solano
*
Industrial Engineering Department, Instituto Tecnológico de Sonora, Ciudad Obregón 85000, Mexico
*
Author to whom correspondence should be addressed.
Systems 2024, 12(11), 503; https://doi.org/10.3390/systems12110503
Submission received: 27 August 2024 / Revised: 7 November 2024 / Accepted: 9 November 2024 / Published: 19 November 2024
(This article belongs to the Special Issue The Systems Thinking Approach to Strategic Management)

Abstract

:
A cold-chain meat packaging project was developed for a meat product company in northwestern Mexico that moves high volumes of fresh meat into national and international markets. The objective of the present research is to evaluate the supply process for three types of thermo-shrinkable polyethylene bags to provide a technological solution for high-volume meat packaging based on a graphical user interface. A system dynamics (SD) methodology is developed in seven stages to generate a technological solution: (1) system mapping; (2) causal diagram construction; (3) stock, flow modeling, and equations; (4) model simulation; (5) model validation; (6) scenarios and multicriteria analysis; and (7) graphical user interface development. The main result for the company was a technological solution that could communicate with decision-makers and the proposed graphical user interface. Future optimistic and pessimistic scenarios were self-evaluated based on the current situation related to three thermo-shrinkable bags used for selling high volumes of fresh meat. In these solutions, previously simulated costs and savings can be implemented in a real situation. Quantitative graphical user interface data can be observed to adequately manage box and bag inventories and minimize costs. Using SD enables the development of technological solutions in complex environments with robust simulations and models that offer data to people interested in the system under study.

1. Introduction

The decision-making process in organizations should be more flexible and transparent for those who perform diverse data-related tasks. In this sense, the present research study takes the example of an agrifood enterprise sector to apply a robust methodology developed by different authors [1,2,3,4]. The company in the study belongs to the commercial meat product packaging industry and is focused on distributing different cattle cuts and products on the meat market. This company comprises three business units. The first is in charge of sowing grains, forage, and oilseed products; the second is dedicated to the livestock fattening process; and the third, the unit under study, is in charge of slaughtering, deboning, and the marketing processes of animal derivatives.
In the first group, all activities related to cattle breeding and feeding are managed by agriculture and livestock groups, from caring and sowing to land and fertilizer use. Qualified staff, such as veterinary doctors, examine cattle feed and are involved with distribution. These staff members are necessary to deliver quality products to the third group, which then carries out slaughtering and deboning. This last step involves achieving a meat product that is packaged and scheduled for distribution and sale through the production process. All products and services reach clients directly from the production plant and are provided to restaurant owners and international exports for sale, as well as participating provider sectors within the supply chain. Figure 1 shows the company in a cluster comprising different business units, forming part of a system.
Organizational environments are affected by different internal and external factors. A company may not be able to control exogenous variables, but endogenous ones can be controlled. Three process types and categories are considered for this purpose: (1) strategic processes, which indicate the relationship between the mission and vision proposed by the company, defining the policies and strategic objectives to follow and be applied; (2) key processes, which involve all activities that generate a direct value to the customer; and (3) support processes, which contribute resources that influence the achievement and adequate development of equipment, infrastructure, systems, furniture, and so on [5].
The main contributions offered by this proposal are the following: (a) a technological solution based on a user interface for responsible decision-makers to manage inputs necessary for fresh meat packaging, such as boxes and bags; (b) quantitative and relative data related to purchasing different types of bags and boxes for the fresh meat demands of external and local clients, income for the company, and associated costs; and (c) an empirical study for the scientific and technological community based on a DS food company.

1.1. Case Study

The case study of this business unit was developed from a previous mapping. The purchasing department does not currently have an adequate system that can adjust to the company’s needs regarding the three types of bags used for high volumes of fresh meat in national and international sales. Thus, the purchase process is performed manually. First, a requisition is made in a specific paper format for the user and taken to the purchasing department. Then, the input is searched, and a budget request is sent by airmail or telephone. After that, the purchasing order is placed in the system, which is subsequently printed to be passed around for signatures in the area, depending on who applied for it. Subsequently, the signatures have to be autographed. Once approved, the administrative and general managers scan these orders and finally send them to the provider. The process is generally slow and depends on the buyer; the speed at which the order is approved—in case of any setbacks—may affect the process, causing delays that may directly affect the user of the required input or service. Likewise, all orders are generated using Excel, version 16.89. A registry account is developed manually for materials or supplies when new articles are to be discharged, which allows users to perform an input control regarding what has been purchased. The same system applies to the suppliers’ records.
Despite having more than 500 local suppliers, the plant cannot typically meet the required provisions. Urgent purchases are generated by different departments, risking production in addition to the other work performed within the organization. Among the main problems analyzed and presented in the last months of the study were urgent shopping orders for different parts of the business unit that were not followed correctly. This situation generates anticipated purchases or confirms services without previous authorization from the responsible employees. Table 1 is a record of urgent orders performed from September to October 2023.
These data in the table show why the purchasing process was not followed and urgent requisitions were generated. The reasons and numbers represent orders and frequency, respectively, in September and October 2023. Figure 2 shows a Pareto chart classifying the most frequent causes that occurred in the last months of the study.
Our analysis of the causes shows that the problem does not lie in the acquisition department’s delay in generating the purchase order, although this influences other departments. Rather, urgent orders have increased by 15% because the company has grown, forcing it to supply and schedule more services according to demand. Nevertheless, this is not a solid justification for undertaking a purchase process without previous authorization. Likewise, the business unit should have anticipated the urgent thermos shrinkable bag requisition given that it does not have total supply control.
The main causes of delay in sales orders were analyzed, as well as the reasons why these orders became urgent over a two-month period. All causes were found to derive from a non-systemized empirical process within the organization, where the usual process is not followed due to urgency, triggering chaos whenever an order requires attention.
Therefore, this study will investigate the causes of these issues in depth. We will demonstrate the importance of counting with quantitative tools, facilitating more control over urgent orders. Demand forecasts help to generate future orders at the correct time, thus respecting lead times, minimum order quantities (MOQs), and shutdown times.
The Pareto diagram depicts the frequency of each case in the last two months of the study. The most frequent causes were urgent material purchases, occurring 12 times between September and October 2023. This demonstrates that by empirically performing these processes (that is, through trial and error), purchases cannot be adequately scheduled. Thus, it is necessary to have appropriate tools to avoid urgent purchases.
The costs associated with reducing urgent orders are indirect; thus, having a technological solution facilitates decision-making and control over inventories, deliveries, purchase orders, and requirements. Figure 2 shows that such a solution can reduce urgencies to 30%, given that the majority are due to a lack of control over purchases and inventories. Consequently, expediting material or extra hours are reduced.
This raises the following research question: What are the main causes of input delays in the sales department for the three types of thermo-shrinkable bags used in fresh meat packaging? The main objective deriving from this question is to develop a technological solution that generates data related to variables that influence these delays. To solve this problem, the new procedure consisted of seven stages in logical order, with a total length of 15 weeks for its development.

1.2. Literature Review

We performed a systematic literature review, emphasizing methodological precursors of system dynamics; subsequently, we have drawn on empirical studies where the foundations of their methodological stages can be used by organizations. The system dynamics methodology uses a series of developed stages [3], starting with an organization mapping process and ending with a graphical user interface developed using Stella® Architect (Stella Architect®, 2023, Version 3.3, Isee Systems Inc., Lebanon, NH, USA).
The proposed methodology was developed by different authors. Jay Forrester [1] originated this methodology at the Massachusetts Institute of Technology (MIT) in the 1960s, developing the first application for administration problems; notably, simulation was used for production and sales planning to determine how parameter changes affect decision-making processes in an organization.
Sterman [2] established that administrators and public policy developers require clarity in a dynamic world, particularly when facing acceleration and system complexity due to economic, technological, social, and environmental changes; in this way, systemic thought is supported by tools that help to understand these complex structures. System dynamics is a rigorously modeled method that uses simulation with computer support. Aracil and Gordillo [4] agree about using models for decision-making based on data. System dynamics (SD) modeling allows organizations to simulate different scenarios [6]. Causal models based on systemic thought theory focus on complex system relationships and produce causal effect archetypes between exogenous and endogenous variables, including input data. These data are transferred to a computer language for simulation and analysis [7].
The literature notes that SD modeling construction inverse methodologies most commonly comprise the following stages: (1) system mapping; (2) causal diagram construction; (3) stock and flow diagram construction and equations; (4) model simulation; (5) model validation; and (6) scenario selection and construction. Few methodologies have developed scenario selection using multicriteria methods—those that have developed solutions integrating all of these steps, as well as those that have developed a solution integrating them with a graphical user interphase (GUI), are minimal.
In this sense, the first stage related to system mapping is developing diverse tools. Some of the most important tools are a flow diagram process [8]; value stream mapping techniques [9]; and suppliers, inputs, processes, outputs, and customers (SIPOC) diagrams (Antony et al. [10]). With these visual supports, cause–effect relationships can be analyzed from a concrete perspective, and quantitative data variables can be associated with the supply chain under study.
Causal diagrams can analyze cause–effect relationships between the values that comprise a model [10]. This shows direct, simple, or complex relationship behaviors, with elements denominating them as positive reinforcement (R) or those that maintain equilibrium (B). These relationships generate different loops connected in different logistic ways that help us understand the complexity of a system [11,12]. Karunakaran et al. [13] studied the specific circular short-circuit characteristics of a supply chain design, accounting for products at the end of their useful life. Their research proposes using a model that considers materials and component recovery.
Stocks, flows, and equations are used to develop dynamic simulations and integrate the results in a graphical user interface for the causal diagram construction stage. This involves using a simulator, such as Vensim® PLE Plus [14,15] or Stella® Architect [16,17,18]. Both simulators use numerical methods such as Euler and Runge–Kutta to generate solutions [19]. The model validation process starts with results generated via simulation according to Barlas and Carpenter’s proposals [20]. They developed a relative error percentage validation method that creates a relationship based on simulation values compared with real system values evaluated in terms of their absolute value.
The sensitivity analysis used to develop different scenarios can solve administrative problems, such as planning and the logistics of demands in terms of time horizon variables, generating different quantitative scenarios for decision-making in uncertain situations [21,22]. In this sense, behaviors—such as changes caused by an organization’s policies—should be considered for selection, considering that they may have pessimistic or optimistic effects in the current scenario. Thus, decision models are considered where multiple criteria are defined in a model [23].
During scenario selection, multicriteria analysis techniques—such as the technique to order preferences by similarity and ideal solution (TOPSIS) and Faire Un Choix Adéquat (FUCA)—are used to select the best scenario based on different decision criteria [24,25]. Er Kara [26] discusses these methods, applying a system dynamics model supported by multiple scenarios to evaluate climate change implications in a supply chain yield. The results indicated a significant reduction in natural/raw material resource availability and capacity, inventory cost, and bottleneck, disrupting provision functions, manufacturing, and logistics.
Graphical user interface construction is represented by different control buttons for simulation, such as pause and stop. Likewise, charts can show different trends; some figures are related to the company, and tables go along with data to support decision-making. Instructions and information are also used to present the desired message [27,28].
From a theoretical point of view, this investigation offers an empirical contribution founded on system dynamics. Thus, FUCA and TOPSIS are used for scenario selection, allowing us to integrate two methods in the scenario treatment procedure. From a practical point of view, the organization will have a technological solution that allows users to interact simply and practically without necessarily being experts on the methodologies involved. Our graphical interface is designed to be fed with data, and it can modify the most sensitive parameters for decision-makers.

2. Method

In the present study, a methodology [3] using seven stages was considered. This method uses organization mapping as a complex system to develop a graphical user interface for the process of packaging fresh meat in bags and subsequently placing it in boxes for export to two external clients and one internal client of the company in the study. Figure 3 shows the procedure used in this case study, exhibiting seven stages according to the proposal [3].
Each stage, as well as the length of its development, is described as follows based on the procedure described above:
(1)
System mapping: System mapping conceptualizes the system’s complexity, involving all the exogenous and endogenous variables, as well as information on all the known parameters. This stage was performed over 2 weeks.
(2)
Causal diagram construction: By considering the variables and data of greatest interest, complex relationships are constructed, where type reinforcement (+) and balance (−) loops are linked to observe how one variable influences another. For this purpose, Vensim® PLE Plus (Version 9.4.2, Ventana System Inc., Harvard, MA, USA, 2019) was used. This stage was performed over a 2-week period.
(3)
Developing stock and flow diagrams and equations: A flux and level diagram was constructed with loop interaction logistics, and with it, the input and output fluxes were generated. These are connected to levels, conveyors, ovens, or queues. The parameters activate fluxes and assign initial conditions. The equations emerge from each dynamic relationship, considering the time variable in such a way that they are constructed as second-order equations using the Runge–Kutta and Euler integration methods. This stage was performed over a 5-week period.
(4)
Simulation model: In its initial version, Stella® Architect, 2023 (Version 3.3, Isee Systems Inc., Lebanon, NH, USA) was used with the initial data provided by the company; the generated information was then concentrated to validate the model. This stage was performed over 1 week.
(5)
Validation model: This model used three techniques for validation: (a) unit consistency; (b) extreme proofing; and (c) error proofing. This stage was performed over a 1-week period.
(6)
Scenario evaluation: Two multicriteria analysis methods, FUCA and TOPSIS, were used to evaluate three scenarios, making the best-ranked scenario selections. This stage was performed over a 2-week period.
(7)
Developing GUI: This stage is the last in the procedure. The efforts of the six previous stages were concentrated in a user-friendly and graphical environment for the users of the company in the study. Based on policies, it simulates meat purchasing, production, and sales under an environment of certainty before the company performs these tasks in reality. This stage was performed over a 2-week period.

3. Results

The main results are shown below; the procedure is considered for each of the seven stages comprising the process.

3.1. System Mapping

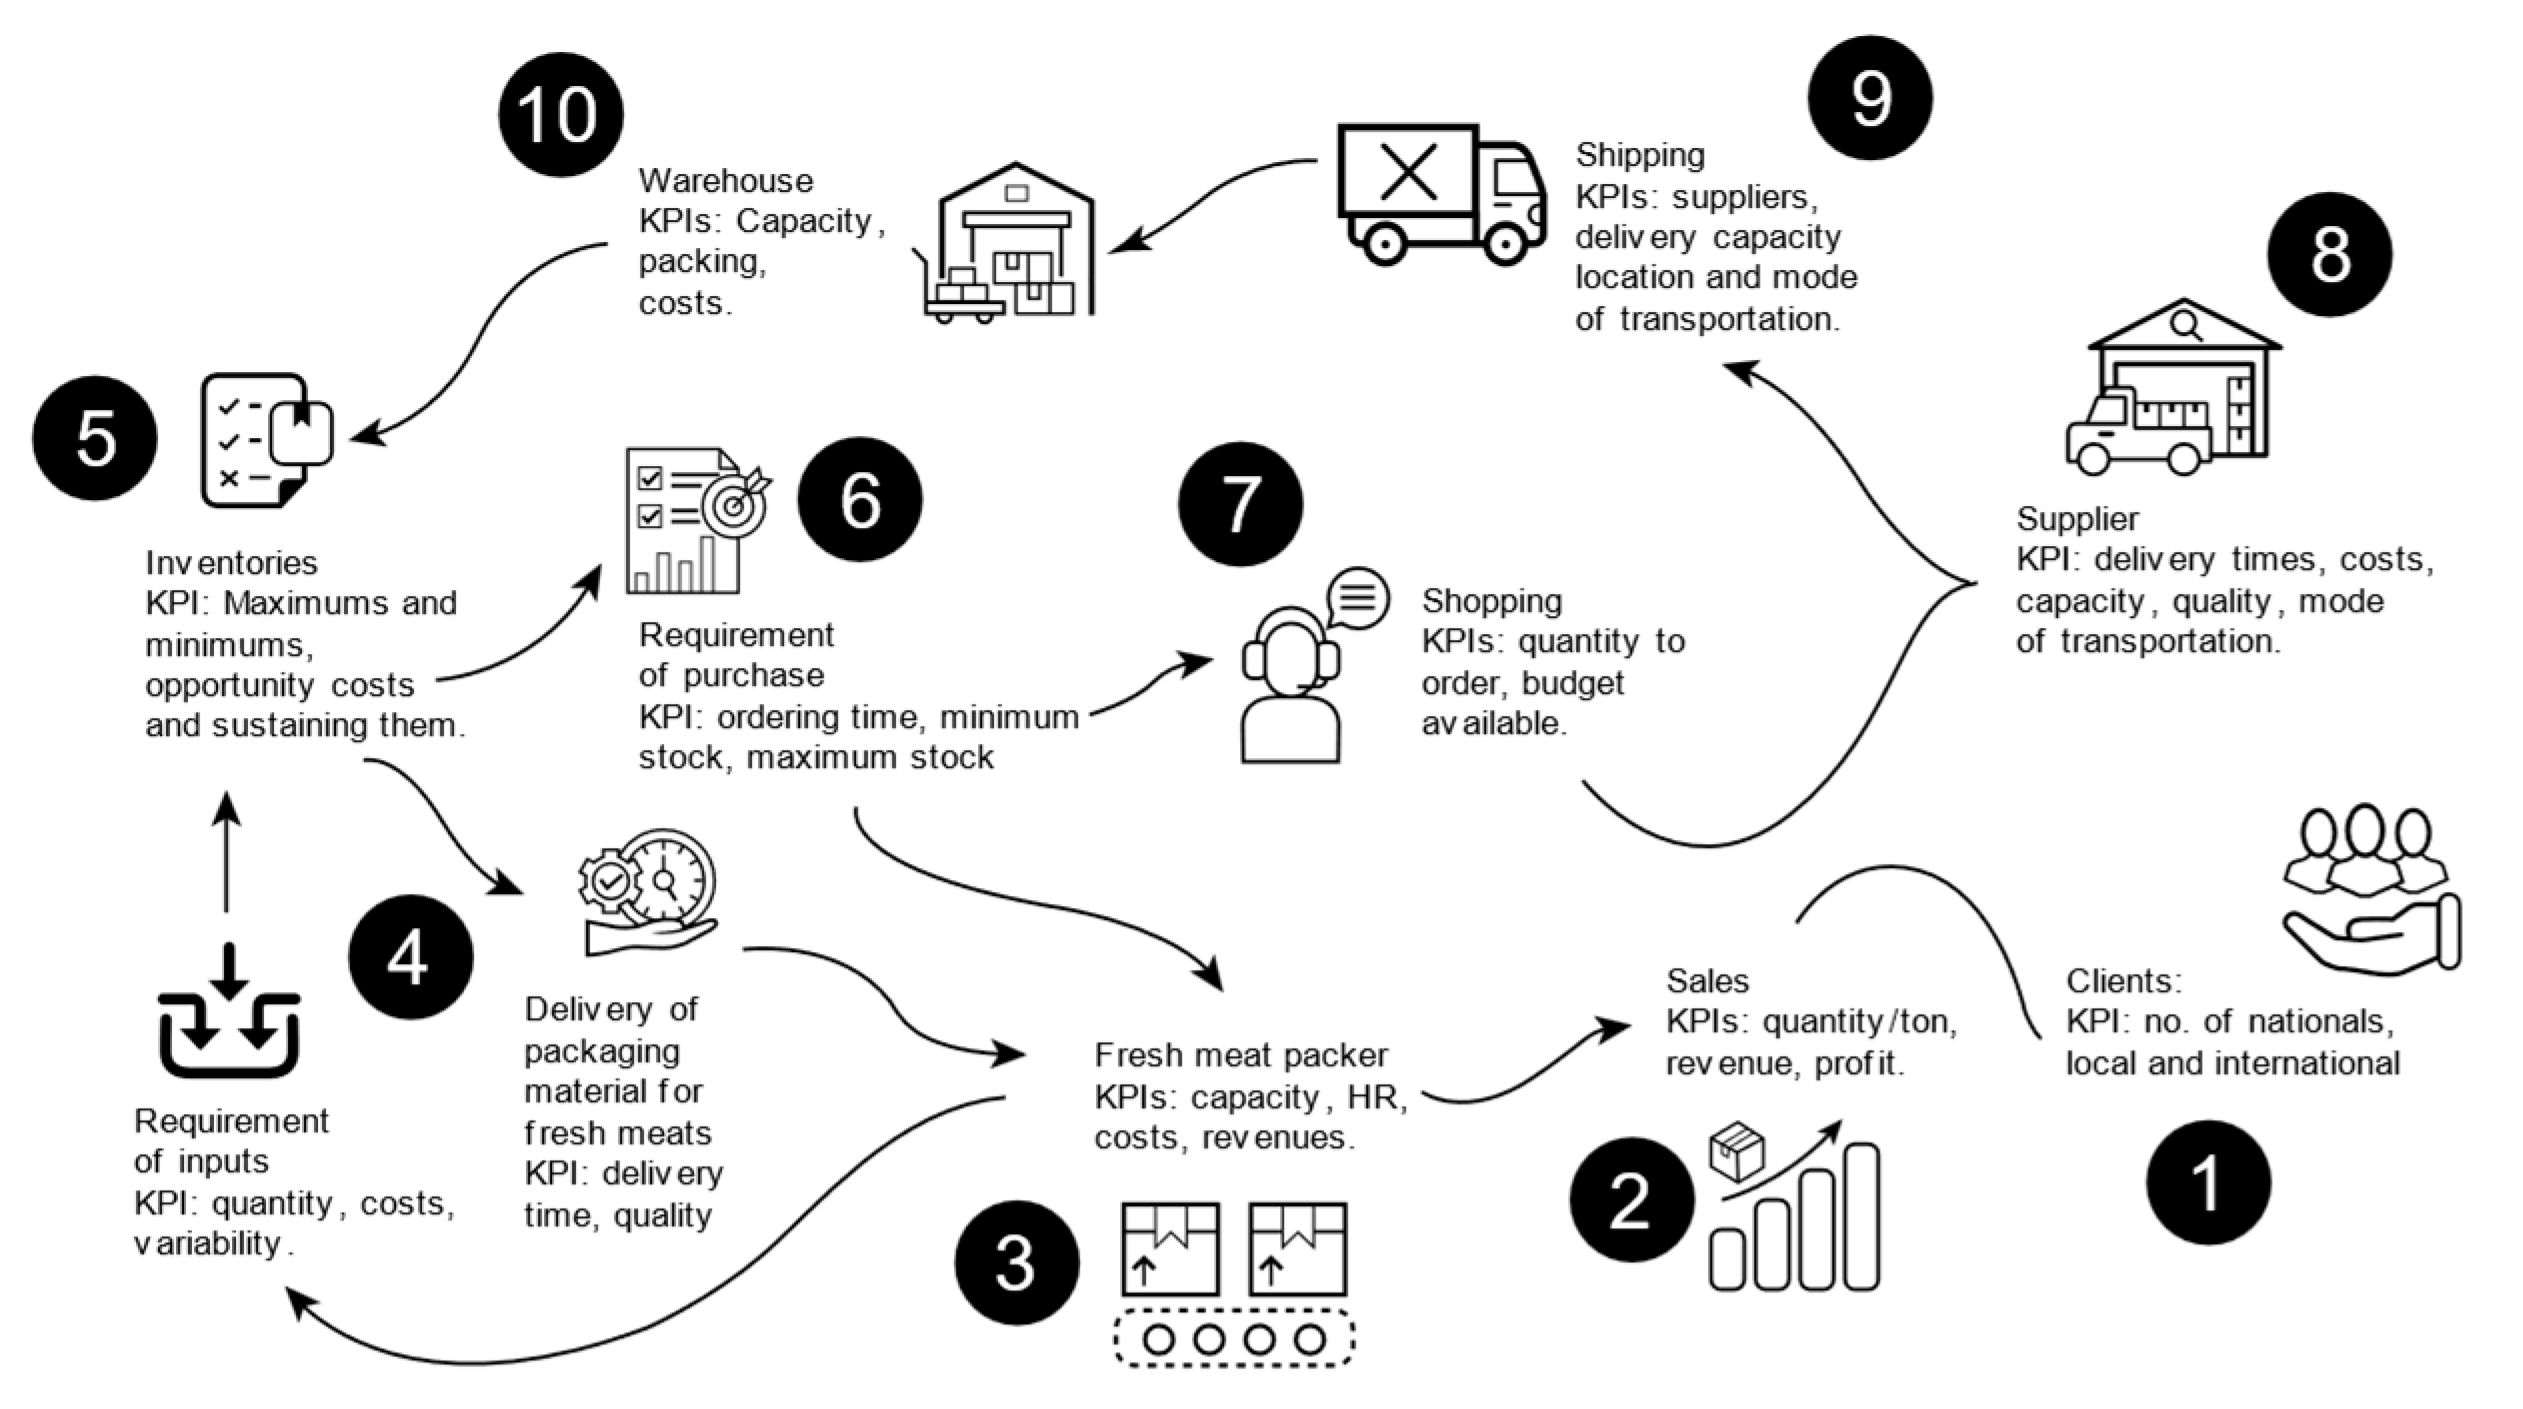
A system map is represented in Figure 4. It sets up the supply process and demonstrates its dependence on other areas of the organization, including the supply, production, distribution, and sales of fresh meat packaging in the supply chain for national, local, and international customers, including key performance indicators (KPIs).
The process is defined as follows: In each stage, the main KPIs are considered to evaluate their performance. Based on demand, requirements are applied to supply inventories; then, the supply process starts. At the same time, the inventory control and purchase processes proceed to purchase supplies. After fulfilling this requirement, spaces and controls in the warehouse are determined. A requisition is then made considering the final client demand. First, client demand is accounted for based on forecasting sales; once sales are obtained, costs are reviewed in order to begin production. Second, the process requires inputs for production, where packaging delivery and input requirements go hand in hand to avoid a bottleneck. Finally, the inventory and shopping requirements proceed, with suppliers awaiting shipping and arrival at the warehouse.
The importance of system mapping was established by Lim et al. [29] (2014), who used mapping to document the production system design process (PSDP). Mapping allows the participants to see flux activities and information from a higher level. The methodological issues that must be solved when undertaking a PSDP include defining reach, the level of mapping detail, content errors, a lack of data, and mapping overlap.

3.2. Constructing the Causal Diagram

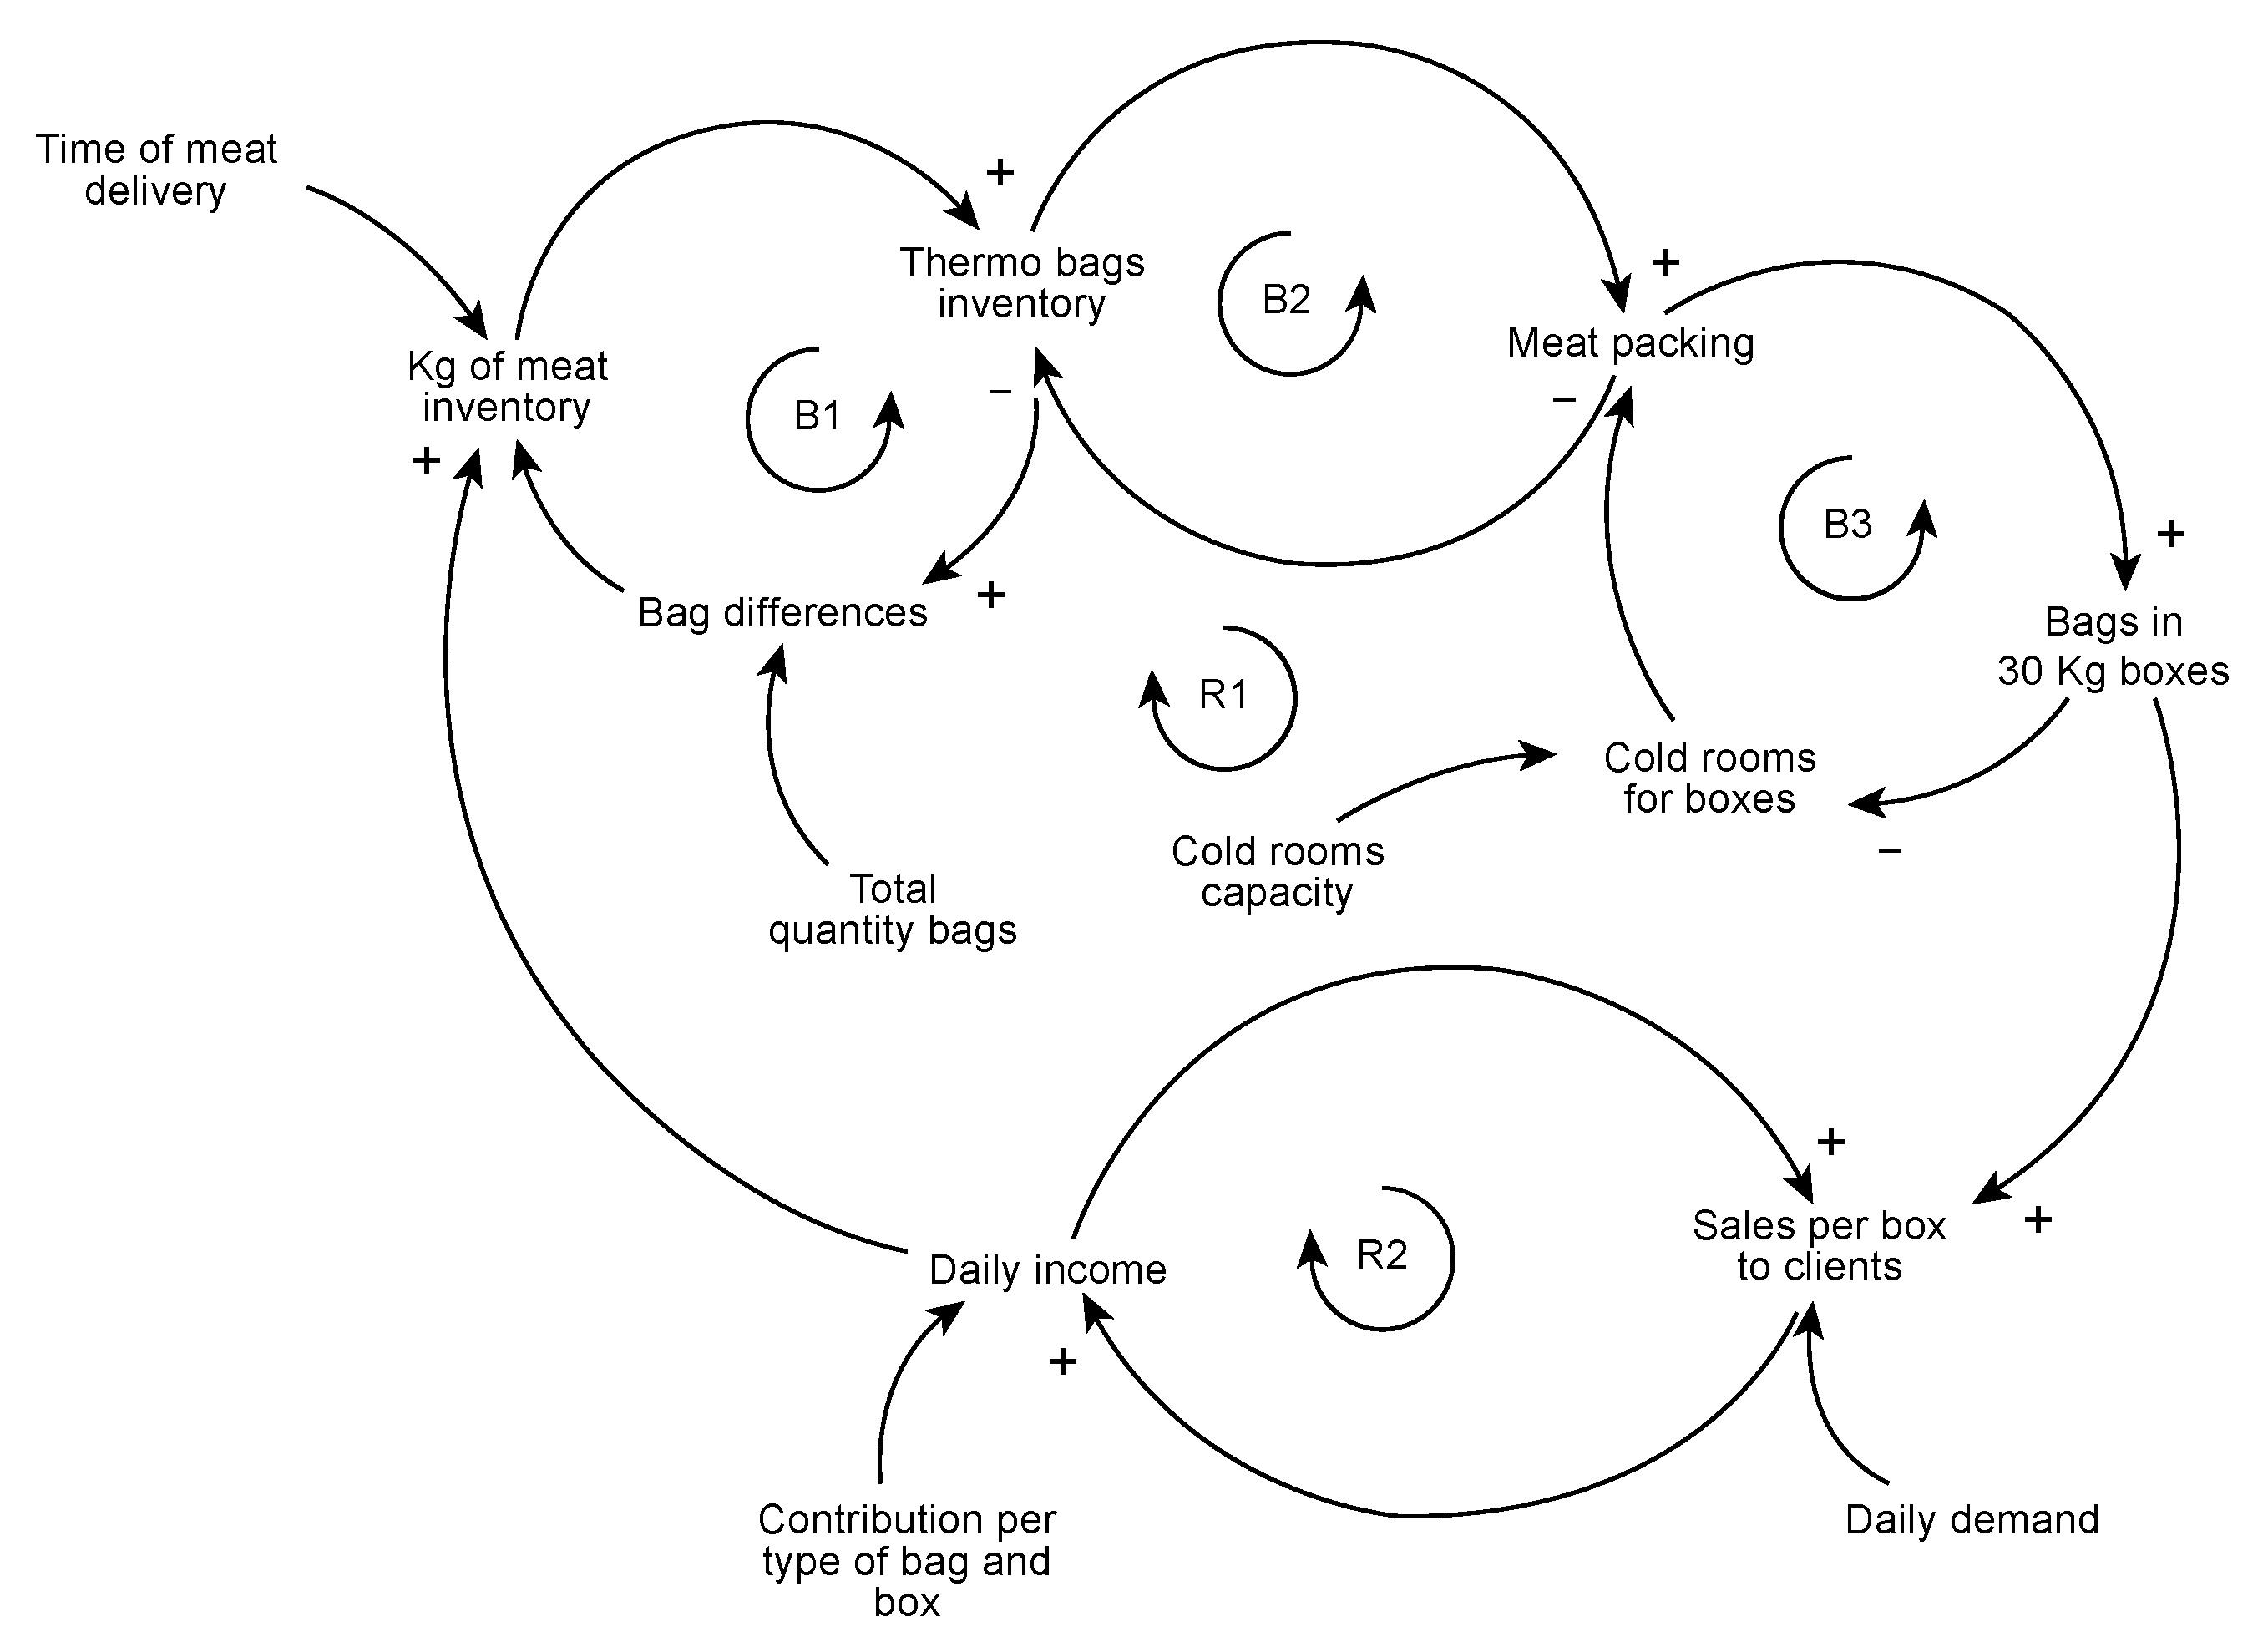
Vensim® PLE Plus was used to develop a causal diagram considering variables that can analyze cause–effect relationships between parameters and variables that comprise the SD model, with behaviors referred to as balance (B) and reinforcement (R). These dynamics jointly demonstrate interconnected loops in order to understand the complexity and relationships of the model, as shown in Figure 5.
The following dynamic hypotheses were considered:
H1: 
The model works with different demand percentages for each scenario;
H2: 
Only three types of bags and one type of box are considered;
H3: 
Income generated by packaging represents 30% of that invested in materials (bags and boxes);
H4: 
The capacity of cold rooms is proportional to the boxes that can be accommodated.
The dynamics of each B and R loop are as follows:
B1: As the amount of meat in kilograms increases, the bag inventory grows, reducing the number of bags used based on availability; when the bags run out, the meat-per-kilogram income stops based on the use of bags at that time.
B2: As the bag inventory increases, the product’s packaging increases, but at the same time, it tends to decrease if the bag inventory goes down.
B3: As meat packaging increases, the number of bags kept in 30 kg boxes increases; however, the warehouse cold room capacity decreases.
R1: This relationship reinforces the other loops, wherein the number of bags and the cold room capacity demonstrate the growth of these variables.
R2: As sales per box increase, income increases, motivating the company to maintain constant inventories, starting from their administration logistics.
These diagrams are widely used to understand system processes. For example, Yang et al. [30] analyzed recovery options for electronic products using DS in the automobile industry supply chain sector. Using structures to show R and B relationships reveals how variables are related to each other [31,32].

3.3. Developing Stock and Flow Diagrams and Their Equations

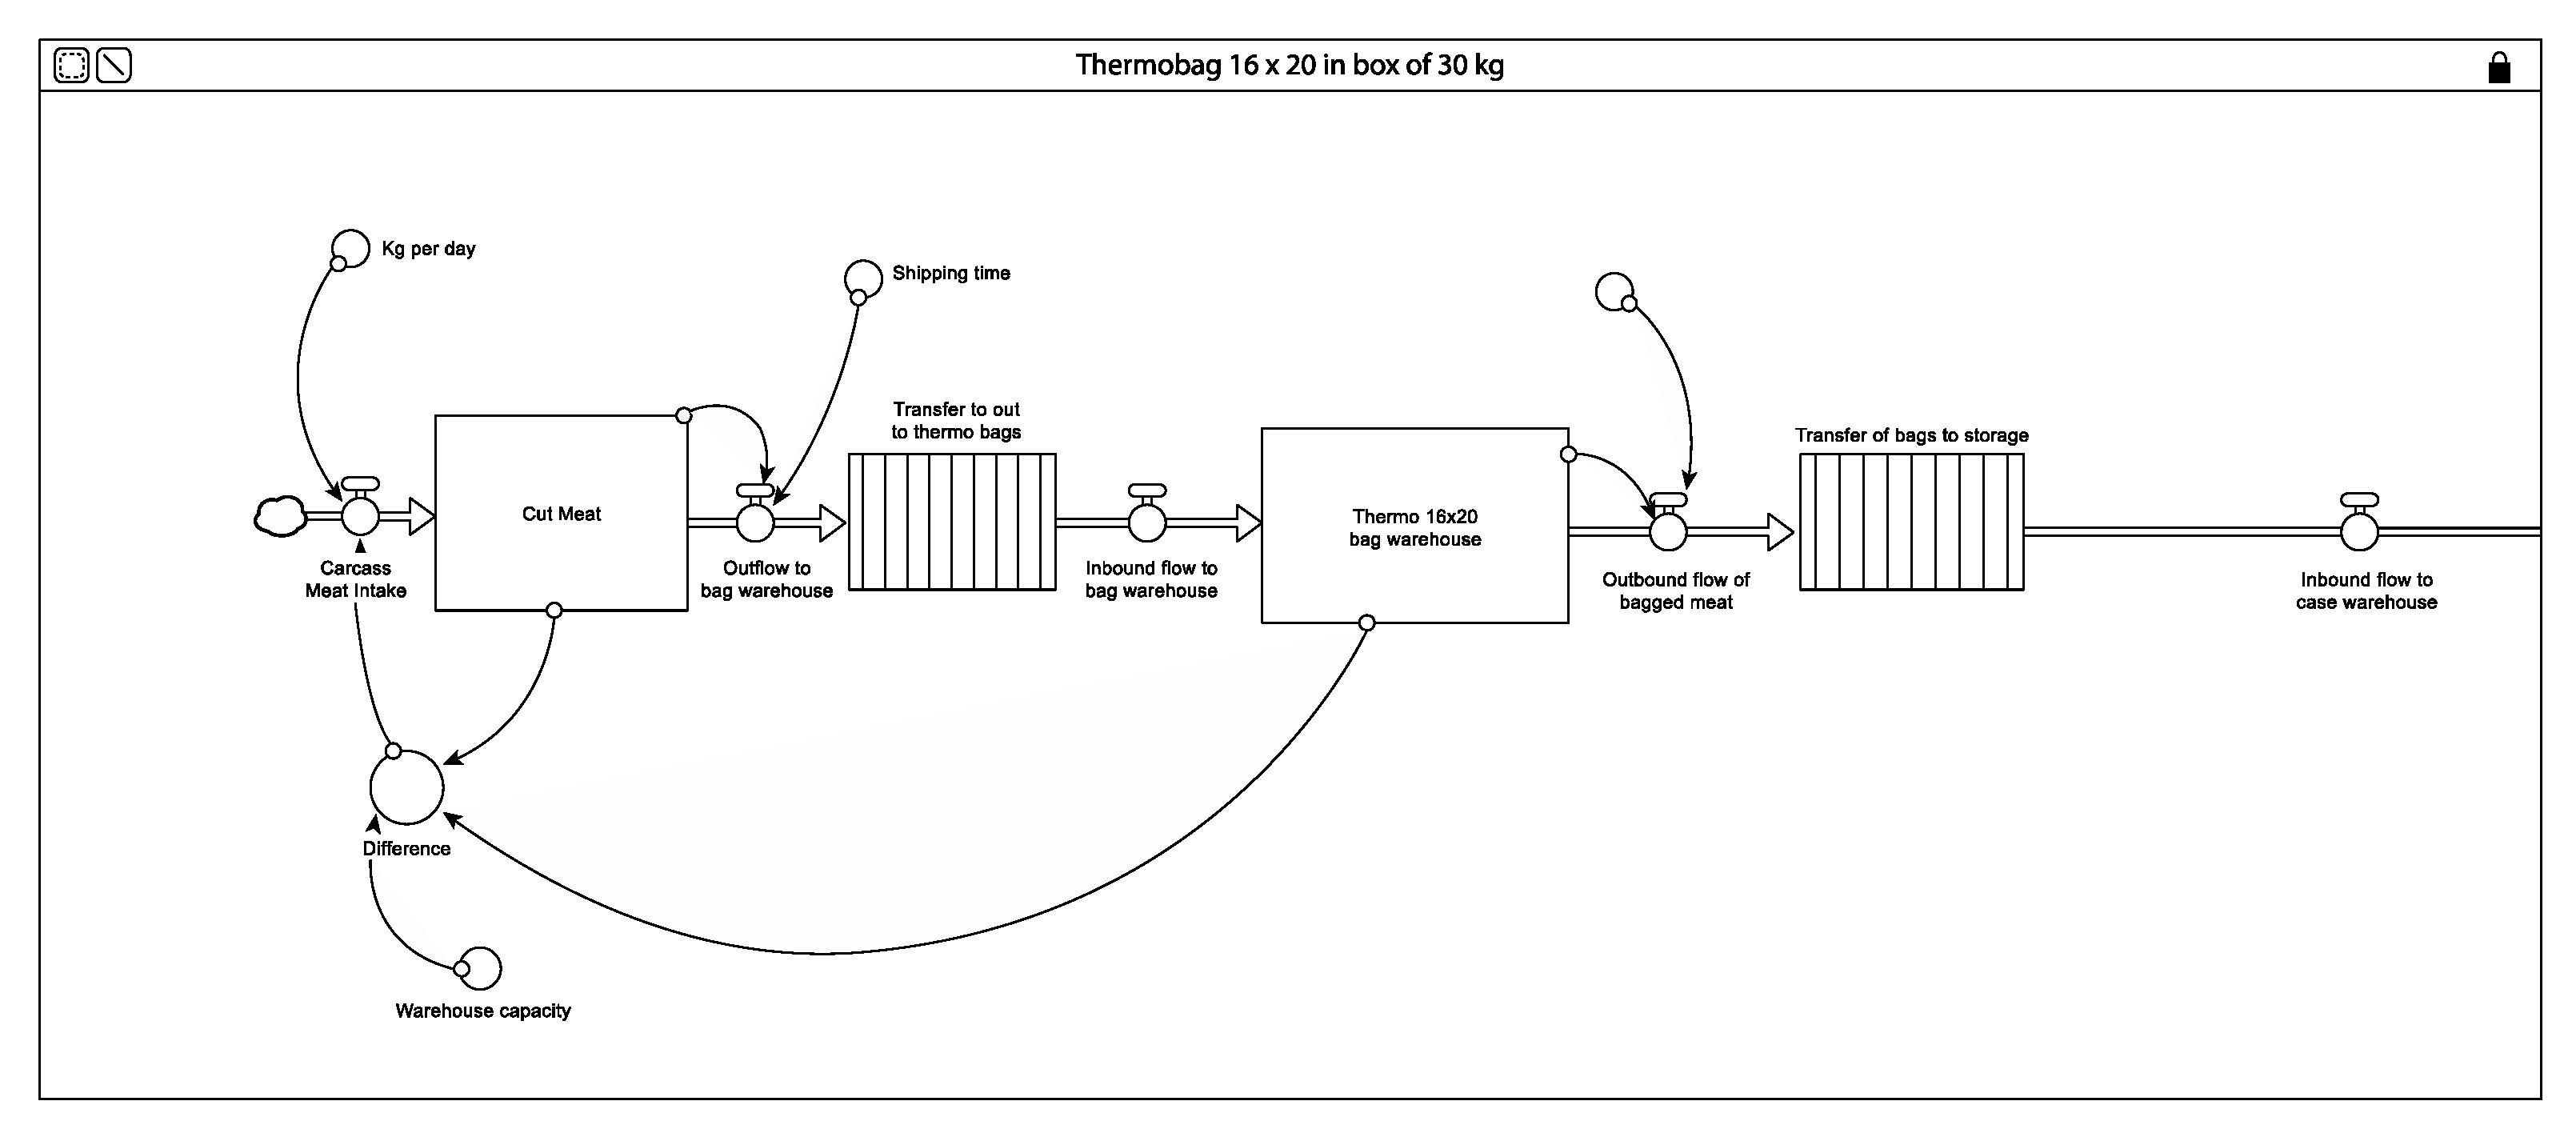
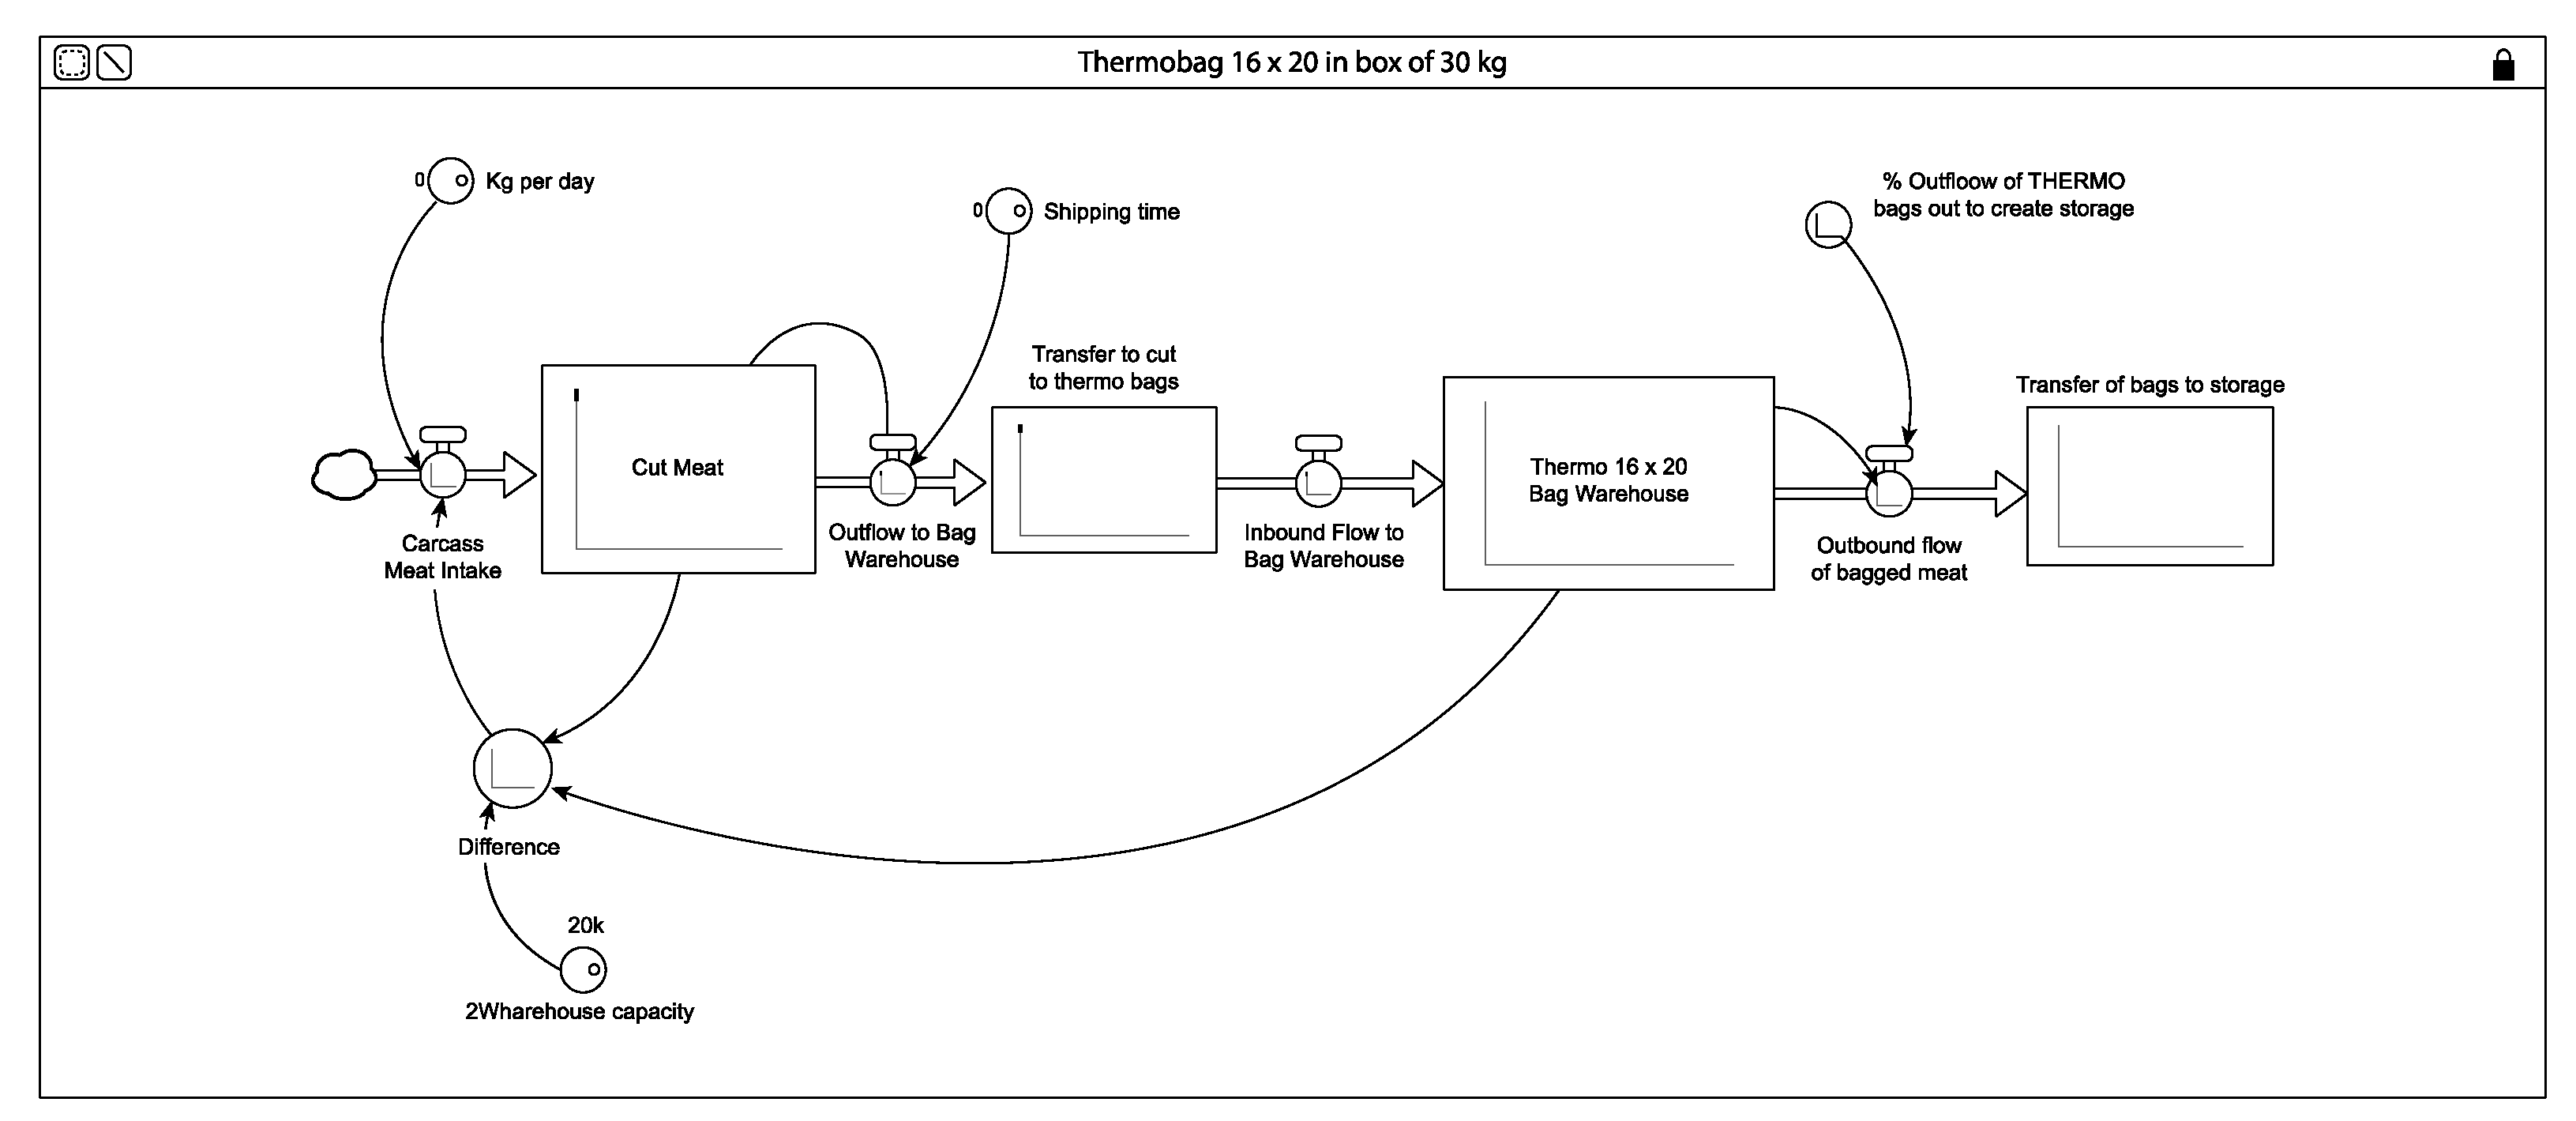
To obtain good inventory control, the number of thermo-shrinkable bags and boxes to be used was determined according to the sales demands of three kinds of clients. Figure 6 shows the stock and flow model structure type for 16 × 20 thermo-shrinkable bags with their equation components. The same logistics were applied to the two types of bags analyzed.
The model uses the amount of raw meat as an input. The meat subsequently goes through the cutting process and then passes directly to the thermo-shrinkable process. At this stage, each product carries its own nomenclature, as defined below:
16 × 20 thermo-shrinkable bags: 6 kg meat capacity/bag, 5 bags/box;
12 × 27 thermo-shrinkable bags: 3 kg meat capacity/bag, 10 bags/box;
18 × 28 thermo-shrinkable bags: 15 kg meat capacity/bag, 2 bags/box.
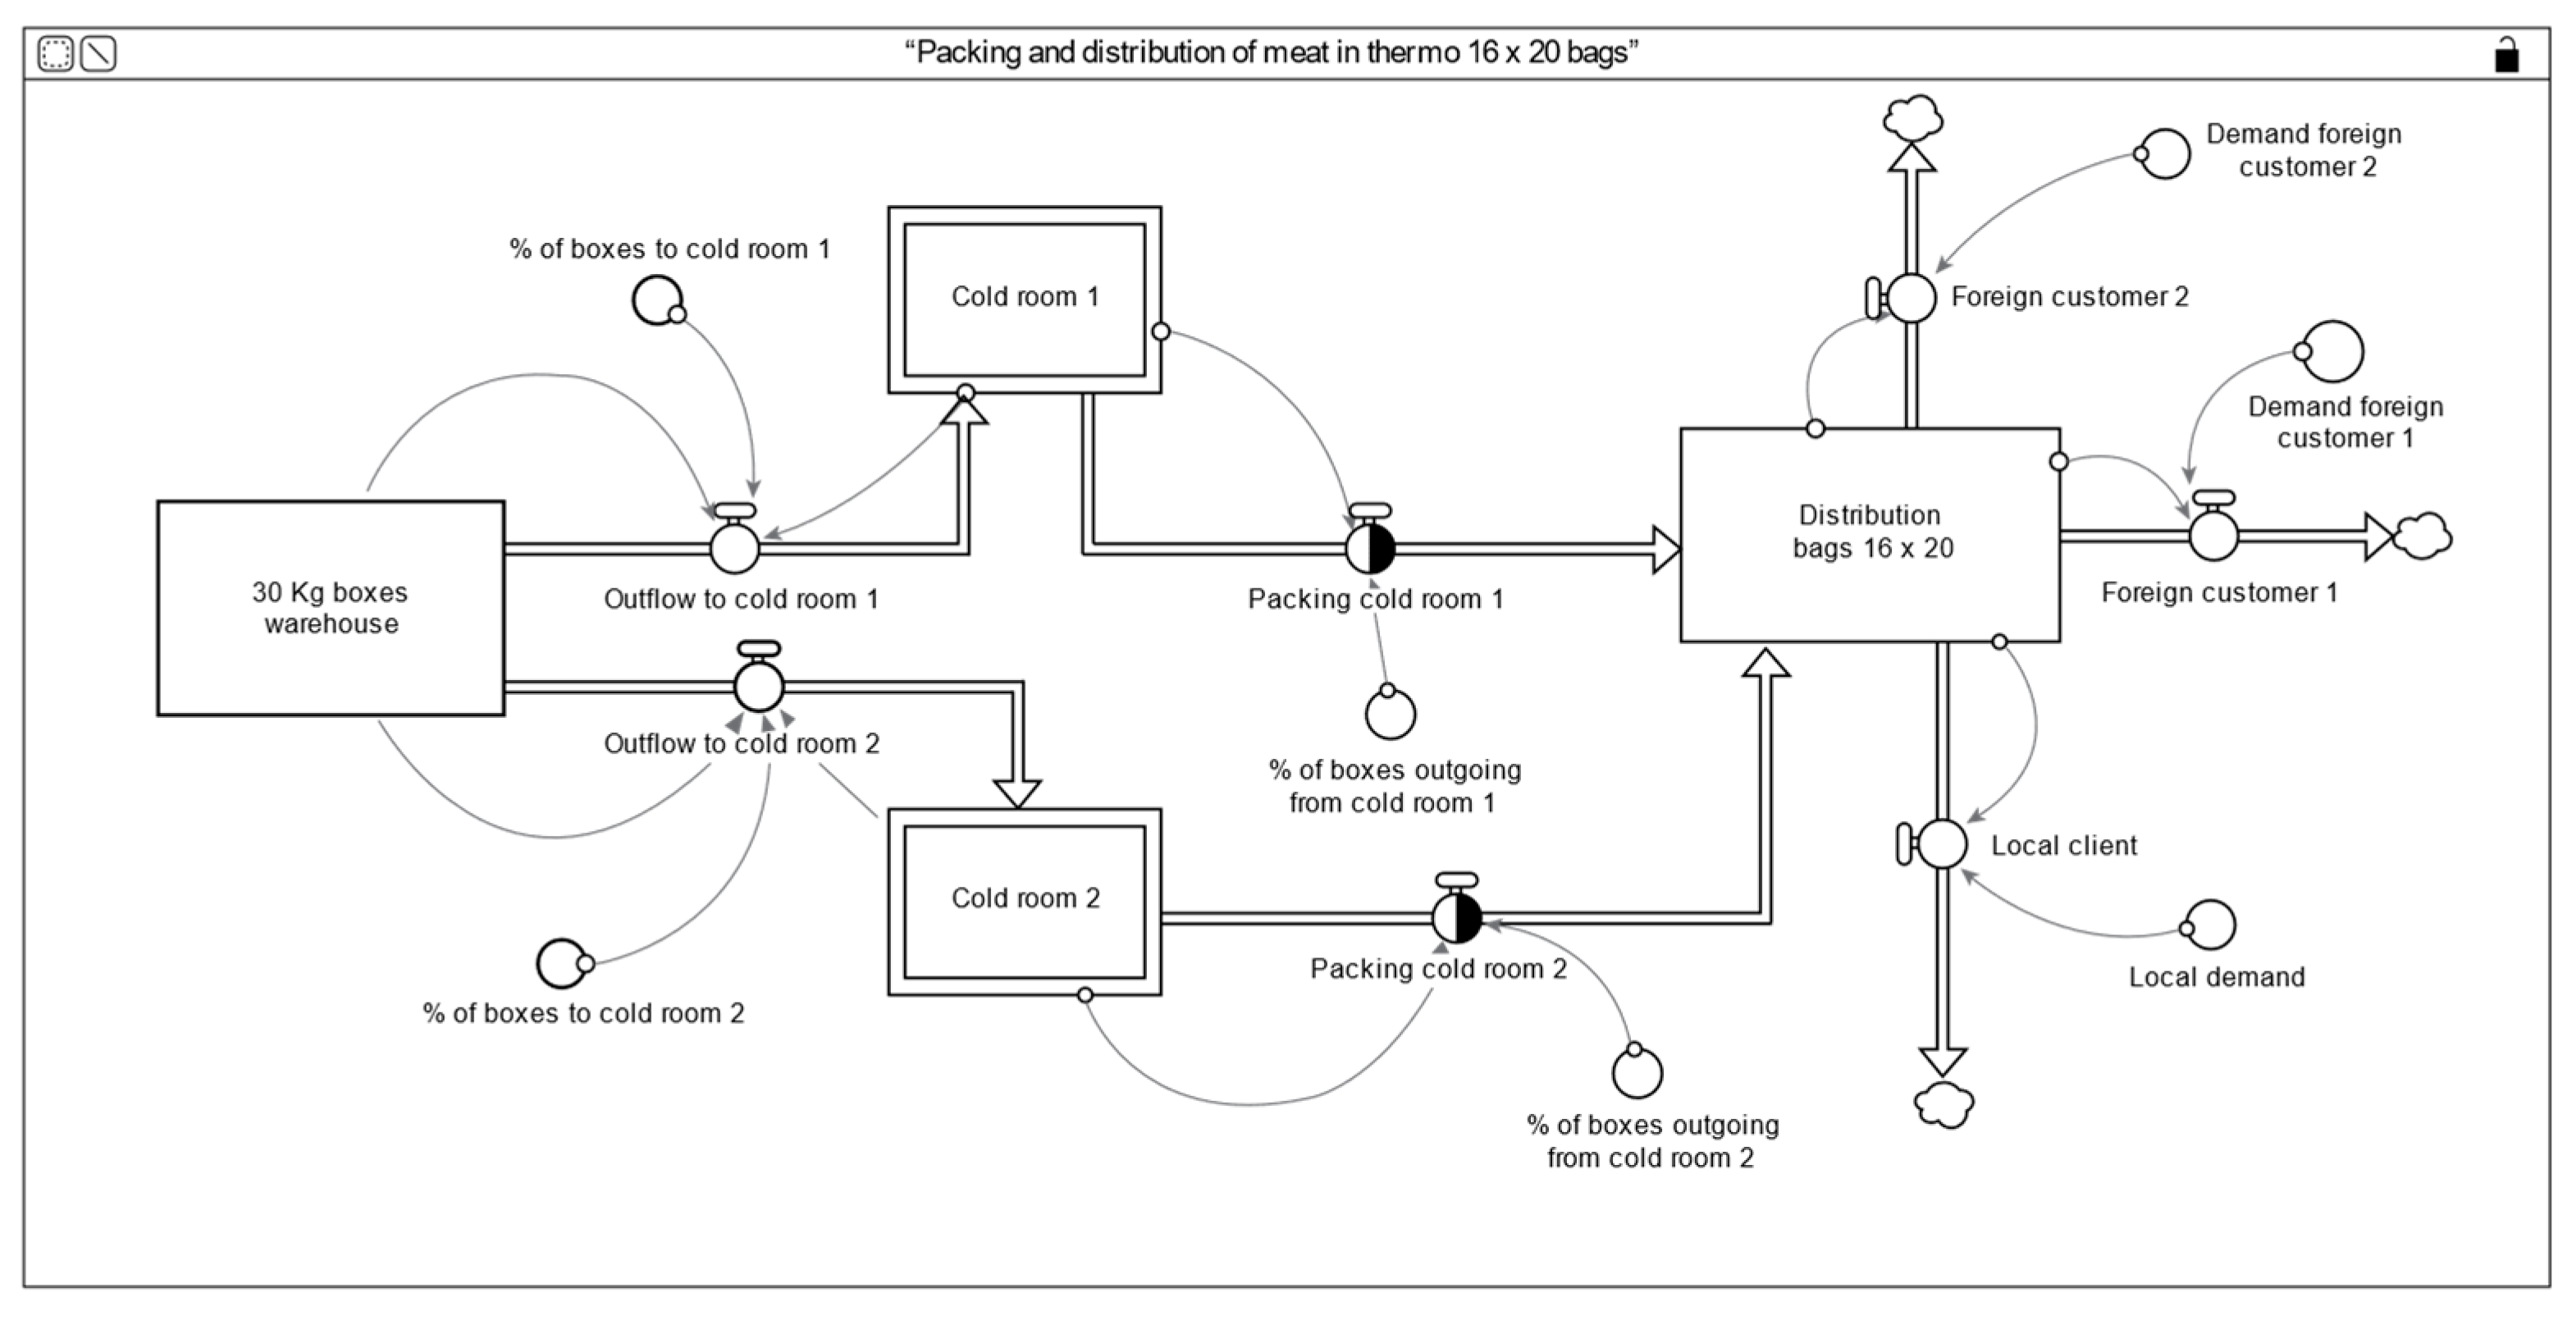
Figure 7 shows the sections related to the intermediate processes and stages through which the product passes to be packaged, protected, and distributed to the final client.
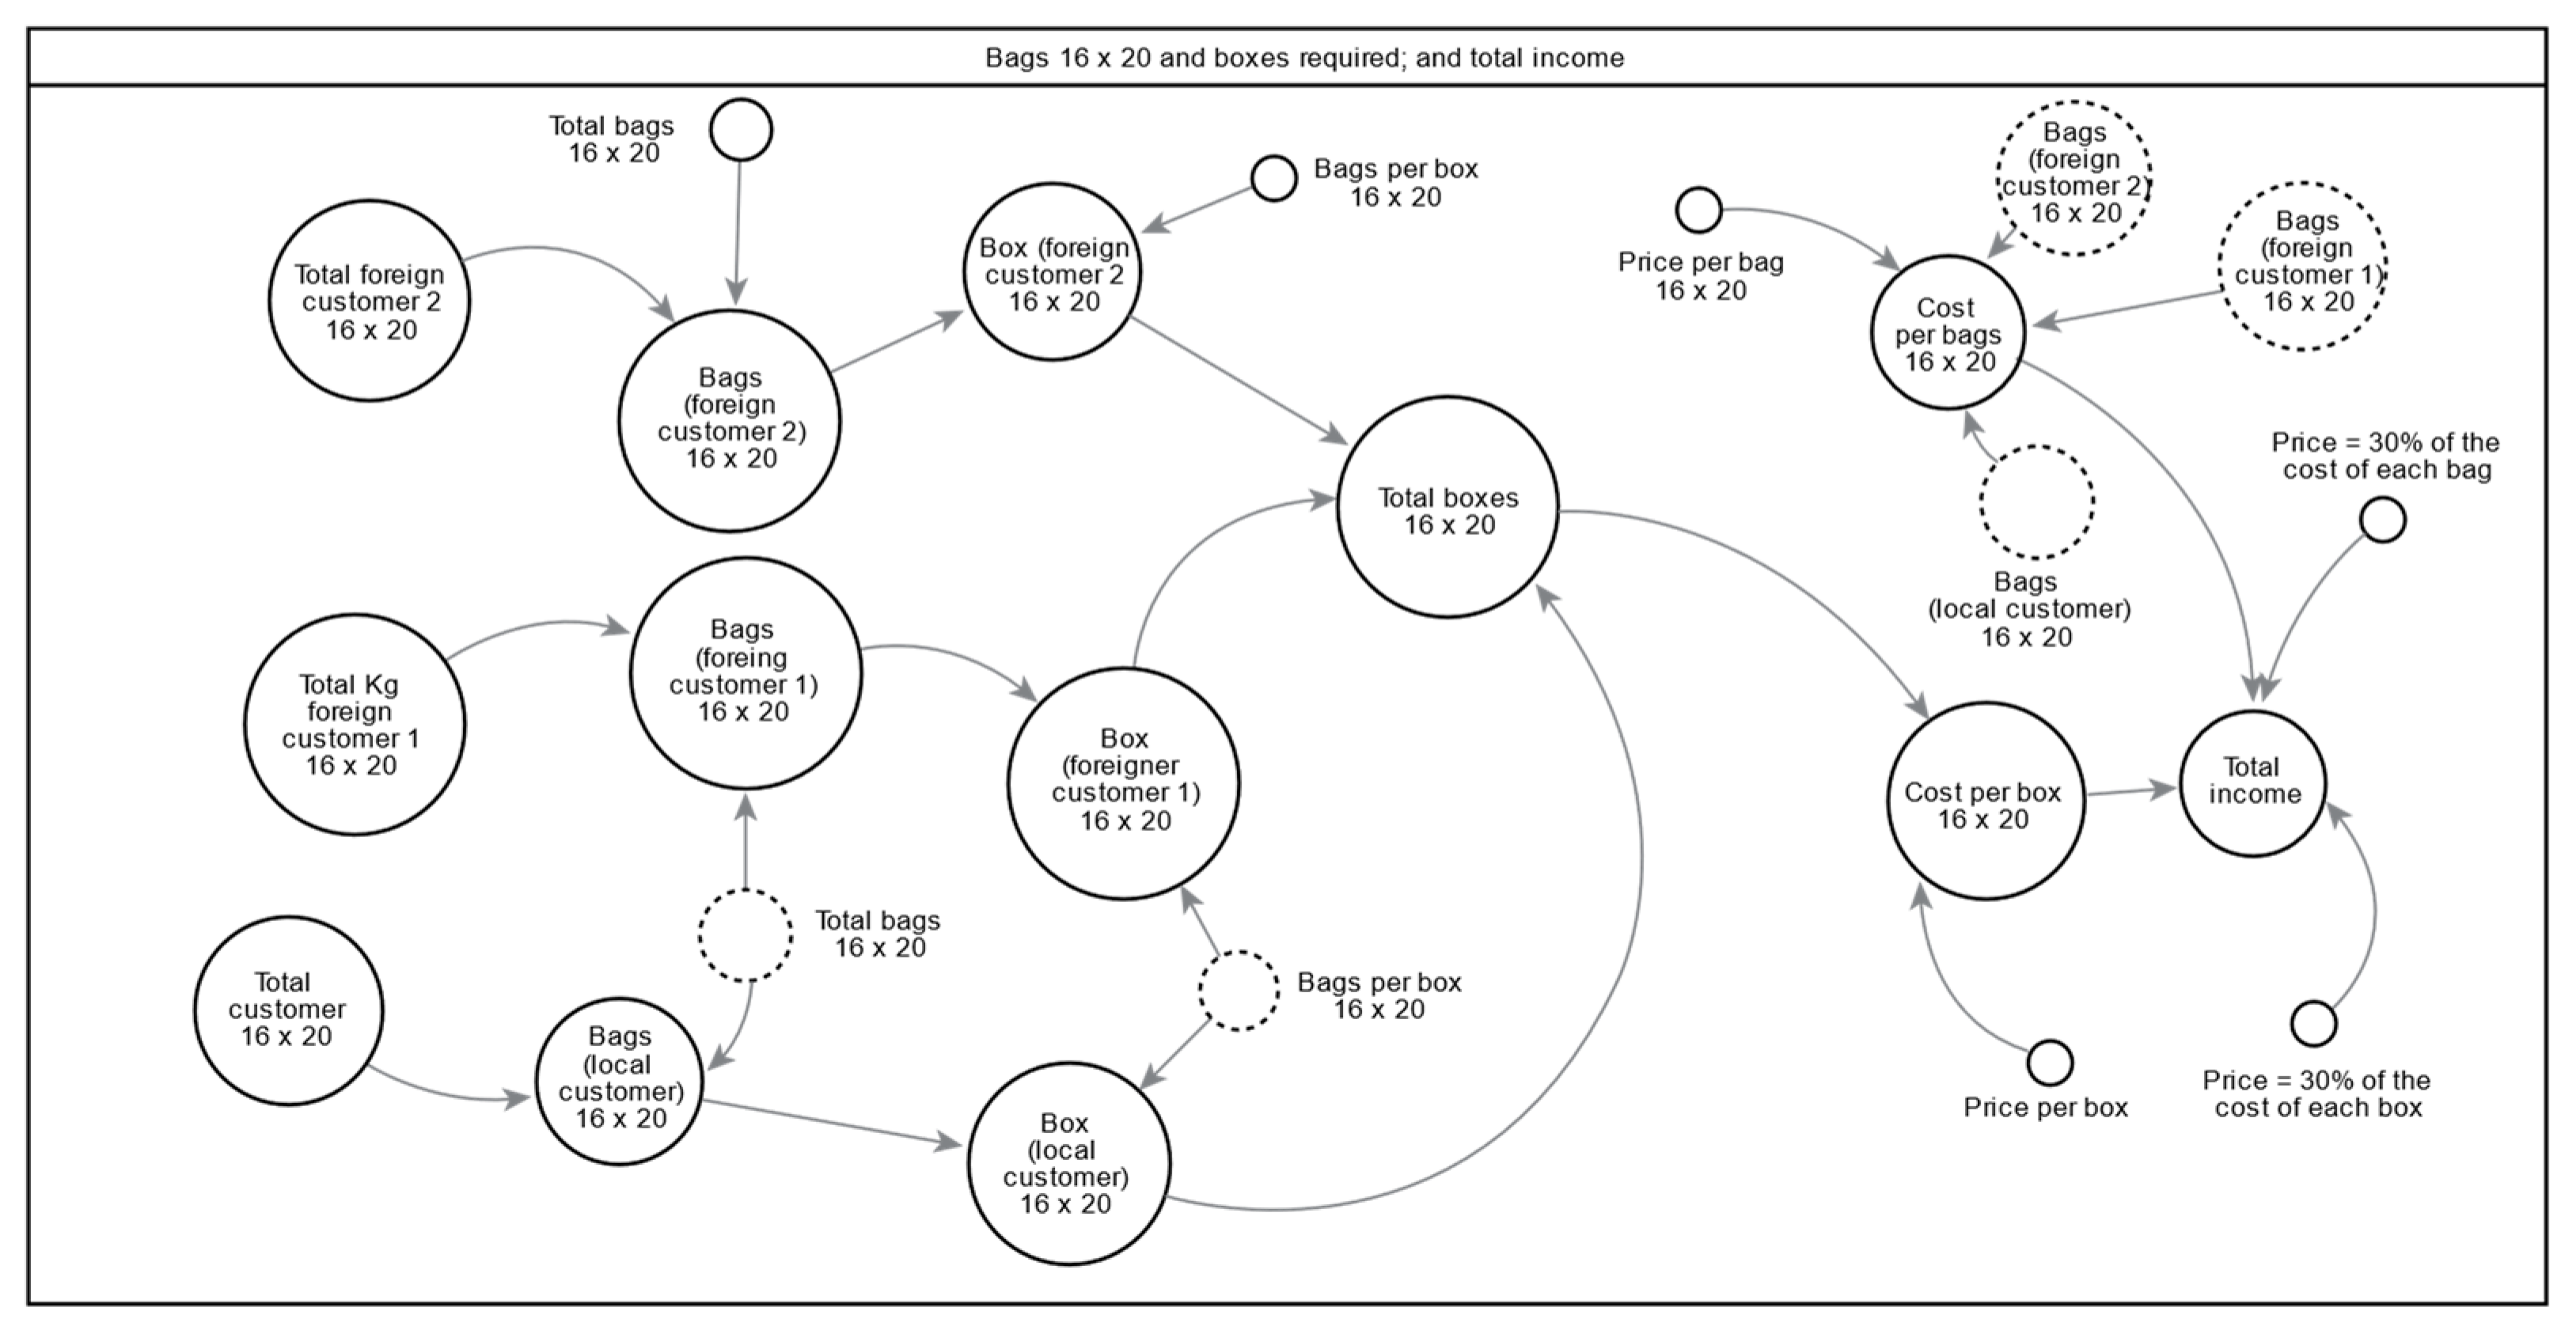
The 30 kg bag boxes in the warehouse are variables that displace the finished product by placing materials in this variable. The product is stored in a cold room for adequate protection and is considered an output flux for each cold room. Thus, the distribution process takes place, and the demand passes to foreign clients “1”, foreign clients “2”, and local clients. The model determined how many 16 × 20 thermo-shrinkable bags and 30 kg boxes were needed depending on meat quantity in kilograms, as required for each client’s demand. Figure 8 shows the third stage of the model, which determines the scenario for each bag. The process shows inputs based on the required investment in 16 × 20 thermo-shrinkable bags and 30 kg boxes.
The company’s investment is made in USD per type of thermo-shrinkable bag and 30 kg box:
16 × 20 bag = USD 0.45162;
12 × 27 bag = USD 0.62239;
14 × 22 bag = USD 0.4814;
30 kg box = USD 1.93546.
The 30% income generated by packaging is considered in the model’s total investment.
The model uses stocks, flows, auxiliary conveyors, oven equations, and other parameters. Equations are shown to exemplify each type:
Stocks:
30 kg boxes warehouse =
30 kg boxes warehouse (t − dt) − (Outflow to Cold Room1 + Outflow to Cold Room1) × dt
where
  • Cold Room1 = cold room number 1, where fresh meat is kept for a period of time;
  • Outflow to Cold Room1 = fresh meat exits the inventory into 30 kg boxes;
  • Outflow to Cold Room2 = fresh meat exits the inventory into 30-kg boxes;
  • t = time of simulation;
  • dt = time difference in simulation.
Cut Meat =
Cut Meat (t − dt) + (Carcass Meat Intake − Outflow to Bag Warehouse) × dt
where
  • Cut Meat = cut meat inventory;
  • Carcass Meat Intake = entry into daily meat cut inventory;
  • Outflow to Bag Warehouse = daily meat cuts output;
  • t = time of simulation.
  • dt = time difference in simulation.
Flows:
Outflow to Cold Room1 =
IF Cold room1 > 6000 THEN 0 ELSE Boxes Warehouse 30kg × % of Boxes to Cold Room1
where
  • Cold Room1 = cold room number 1, where fresh meat is kept for a period of time;
  • Boxes Warehouse 30Kg = fresh meat inventory in 30 kg boxes;
  • %Boxes to Cold Room1 = percentage of boxes considered for output toward cold room number 1;
  • t = time of simulation;
  • dt = difference of time in simulation.
Conveyors:
Transfer of bags to storage (t − dt) =
Transfer of bags to storage (t − dt) + (Outbound flow of bagged meat − Inbound Flow to Case Warehouse) × dt
where
  • Transfer of bags to storage = transfer of 16 × 20 thermo-bags containing meat cuts;
  • Outbound flow of bagged meat = output of fresh meat from the 16 × 20 thermo-bag inventory;
  • Inbound flow to case warehouse = input of fresh meat from the inventory to the 16 × 20 thermo-bags;
  • t = time of simulation;
  • dt = time difference in simulation.
Ovens:
Cold room1(t) =
Cold room1(t − dt) + (Outflow to Cold Room1 − Packing cold room 1) × dt.
where
  • Cold Room1 = cold room number 1, where fresh meat is kept for a period of time.
  • Outflow to Cold Room1 = fresh meat outflow from the 30 kg box inventory;
  • Packing cold room 1 = meat packaging process placing meat in 16 × 20 bags;
  • t = time of simulation;
  • dt = time difference in simulation.
Auxiliary:
Total Income =
(Price = 30% of the cost of each bag × Cost per bags 16 × 20 − Cost per bags16 × 20) + (Price =30% of the cost of each box × cost per box 16 × 20 − cost per box 16 × 20)
where
  • Total income = the total income for each type of bag sold;
  • Price = 30% = 30% gain for each meat bag sale;
  • Cost per bags16 × 20 = production cost associated with each 16 × 20 bag.
The previous results are compared with empirical studies that use flux and level diagrams to create formal logical structures [33,34]. The importance of developing these models is established using Vensim PLE Plus®, version 9.4.2, and the Power Sim®, version 8.0, specialized software.

3.4. Model Simulation

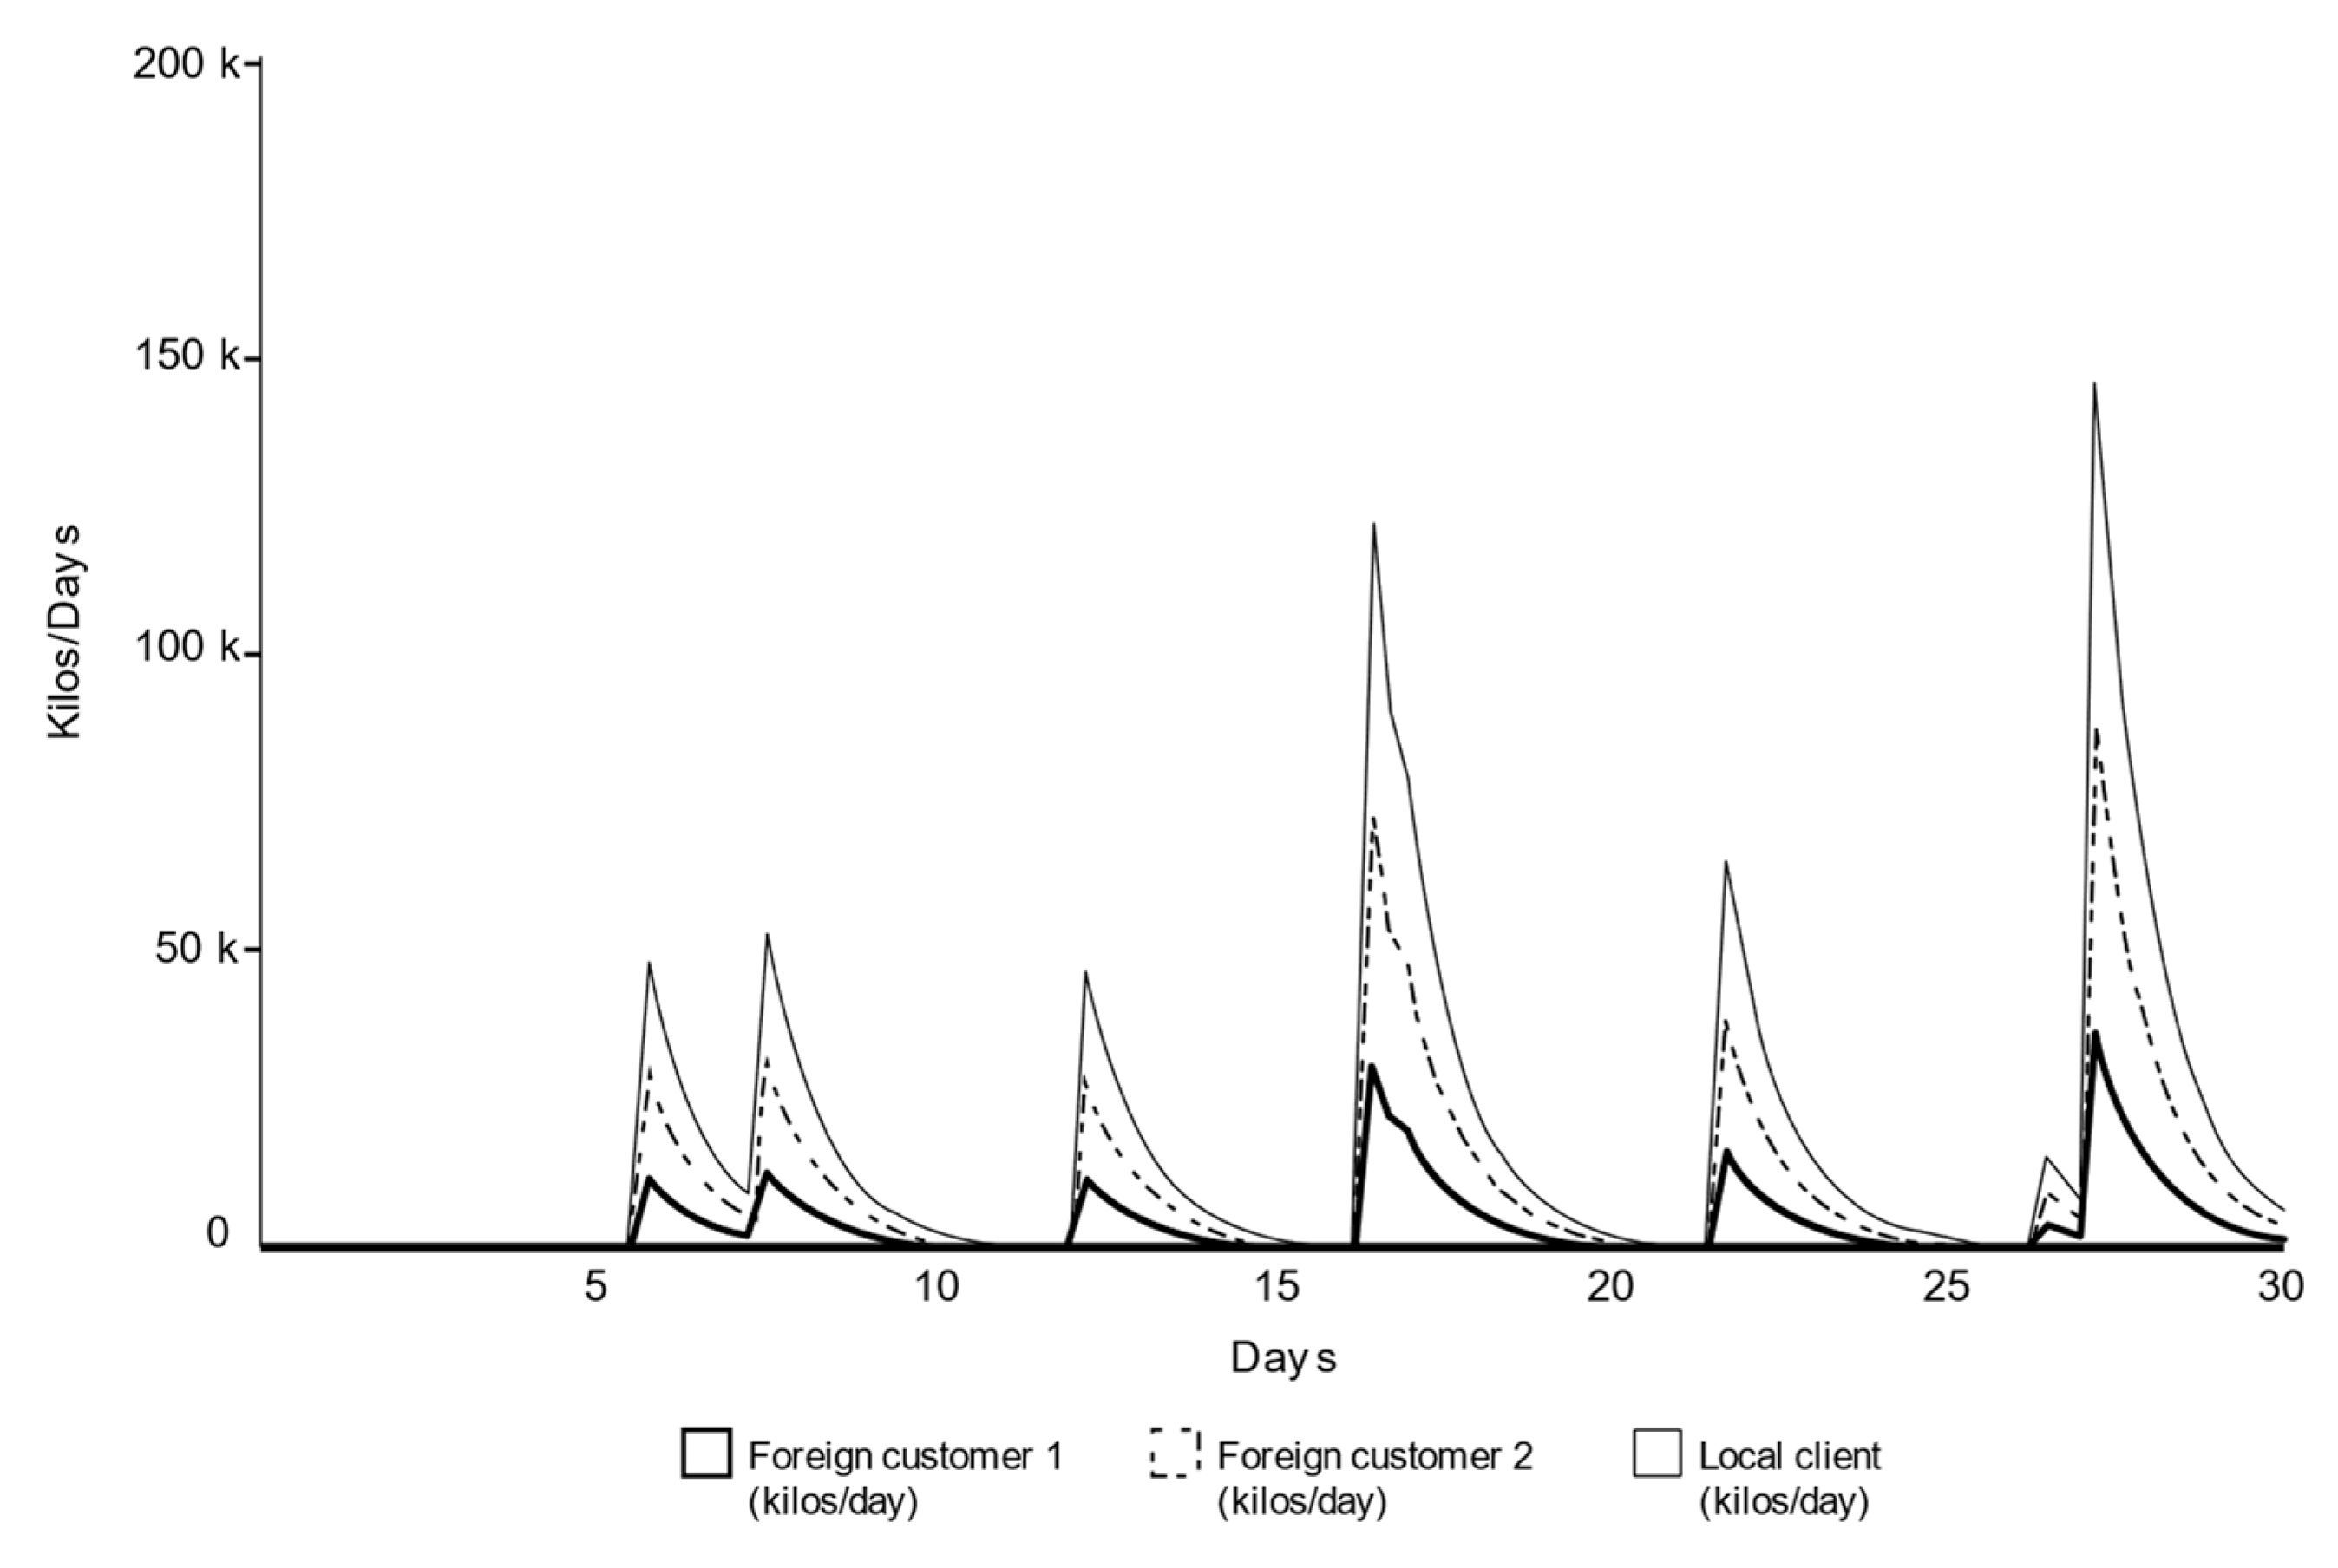
Once the model equations are built, SD is used to generate the behavior of the most important variables for the company. Figure 9 shows a delivery simulation for foreign client types 1 and 2 and local clients.
The chart shows that at the end of the month, deliveries behave similarly in terms of tendencies, with better responses for 30 kg bags and boxes.

3.5. Model Validation

Three methods [2,20] were used to validate the model.
Unit consistency: The model complies with the requirement that the units are 100% consistent when making a detailed review of each equation [3].
For this purpose, the consistency of the units should be reviewed one by one to achieve a consistent model. For example, when performing mathematical operations, the left-side units of the equation should be equal to those of the right-hand side. Thus, when all the data are subjected to the proposed model, consistency errors exist, and a box with variables with errors appears. One example is the message the software displays when the following inconsistency is found, that is, when the model logic is lost:
“Bags (Foreign Customer 1) 16 × 20” shows unit “bas/days”, but the equation suggests “boxes” units. The message says “Unit Warning”.
Once all the units are corrected, a screen is displayed indicating that no warning units exist; thus, the model complies with unit consistency.
Extreme proofing: Extreme proofing involves subjecting the model to zero-model demand, i.e., the model does not generate results when it runs. See Figure 10.
When a value of zero is applied to kg per day, the simulation does not generate any behavior, which is logical because there are no entries in the prime matter. In this sense, the entire process generates zero values henceforth.
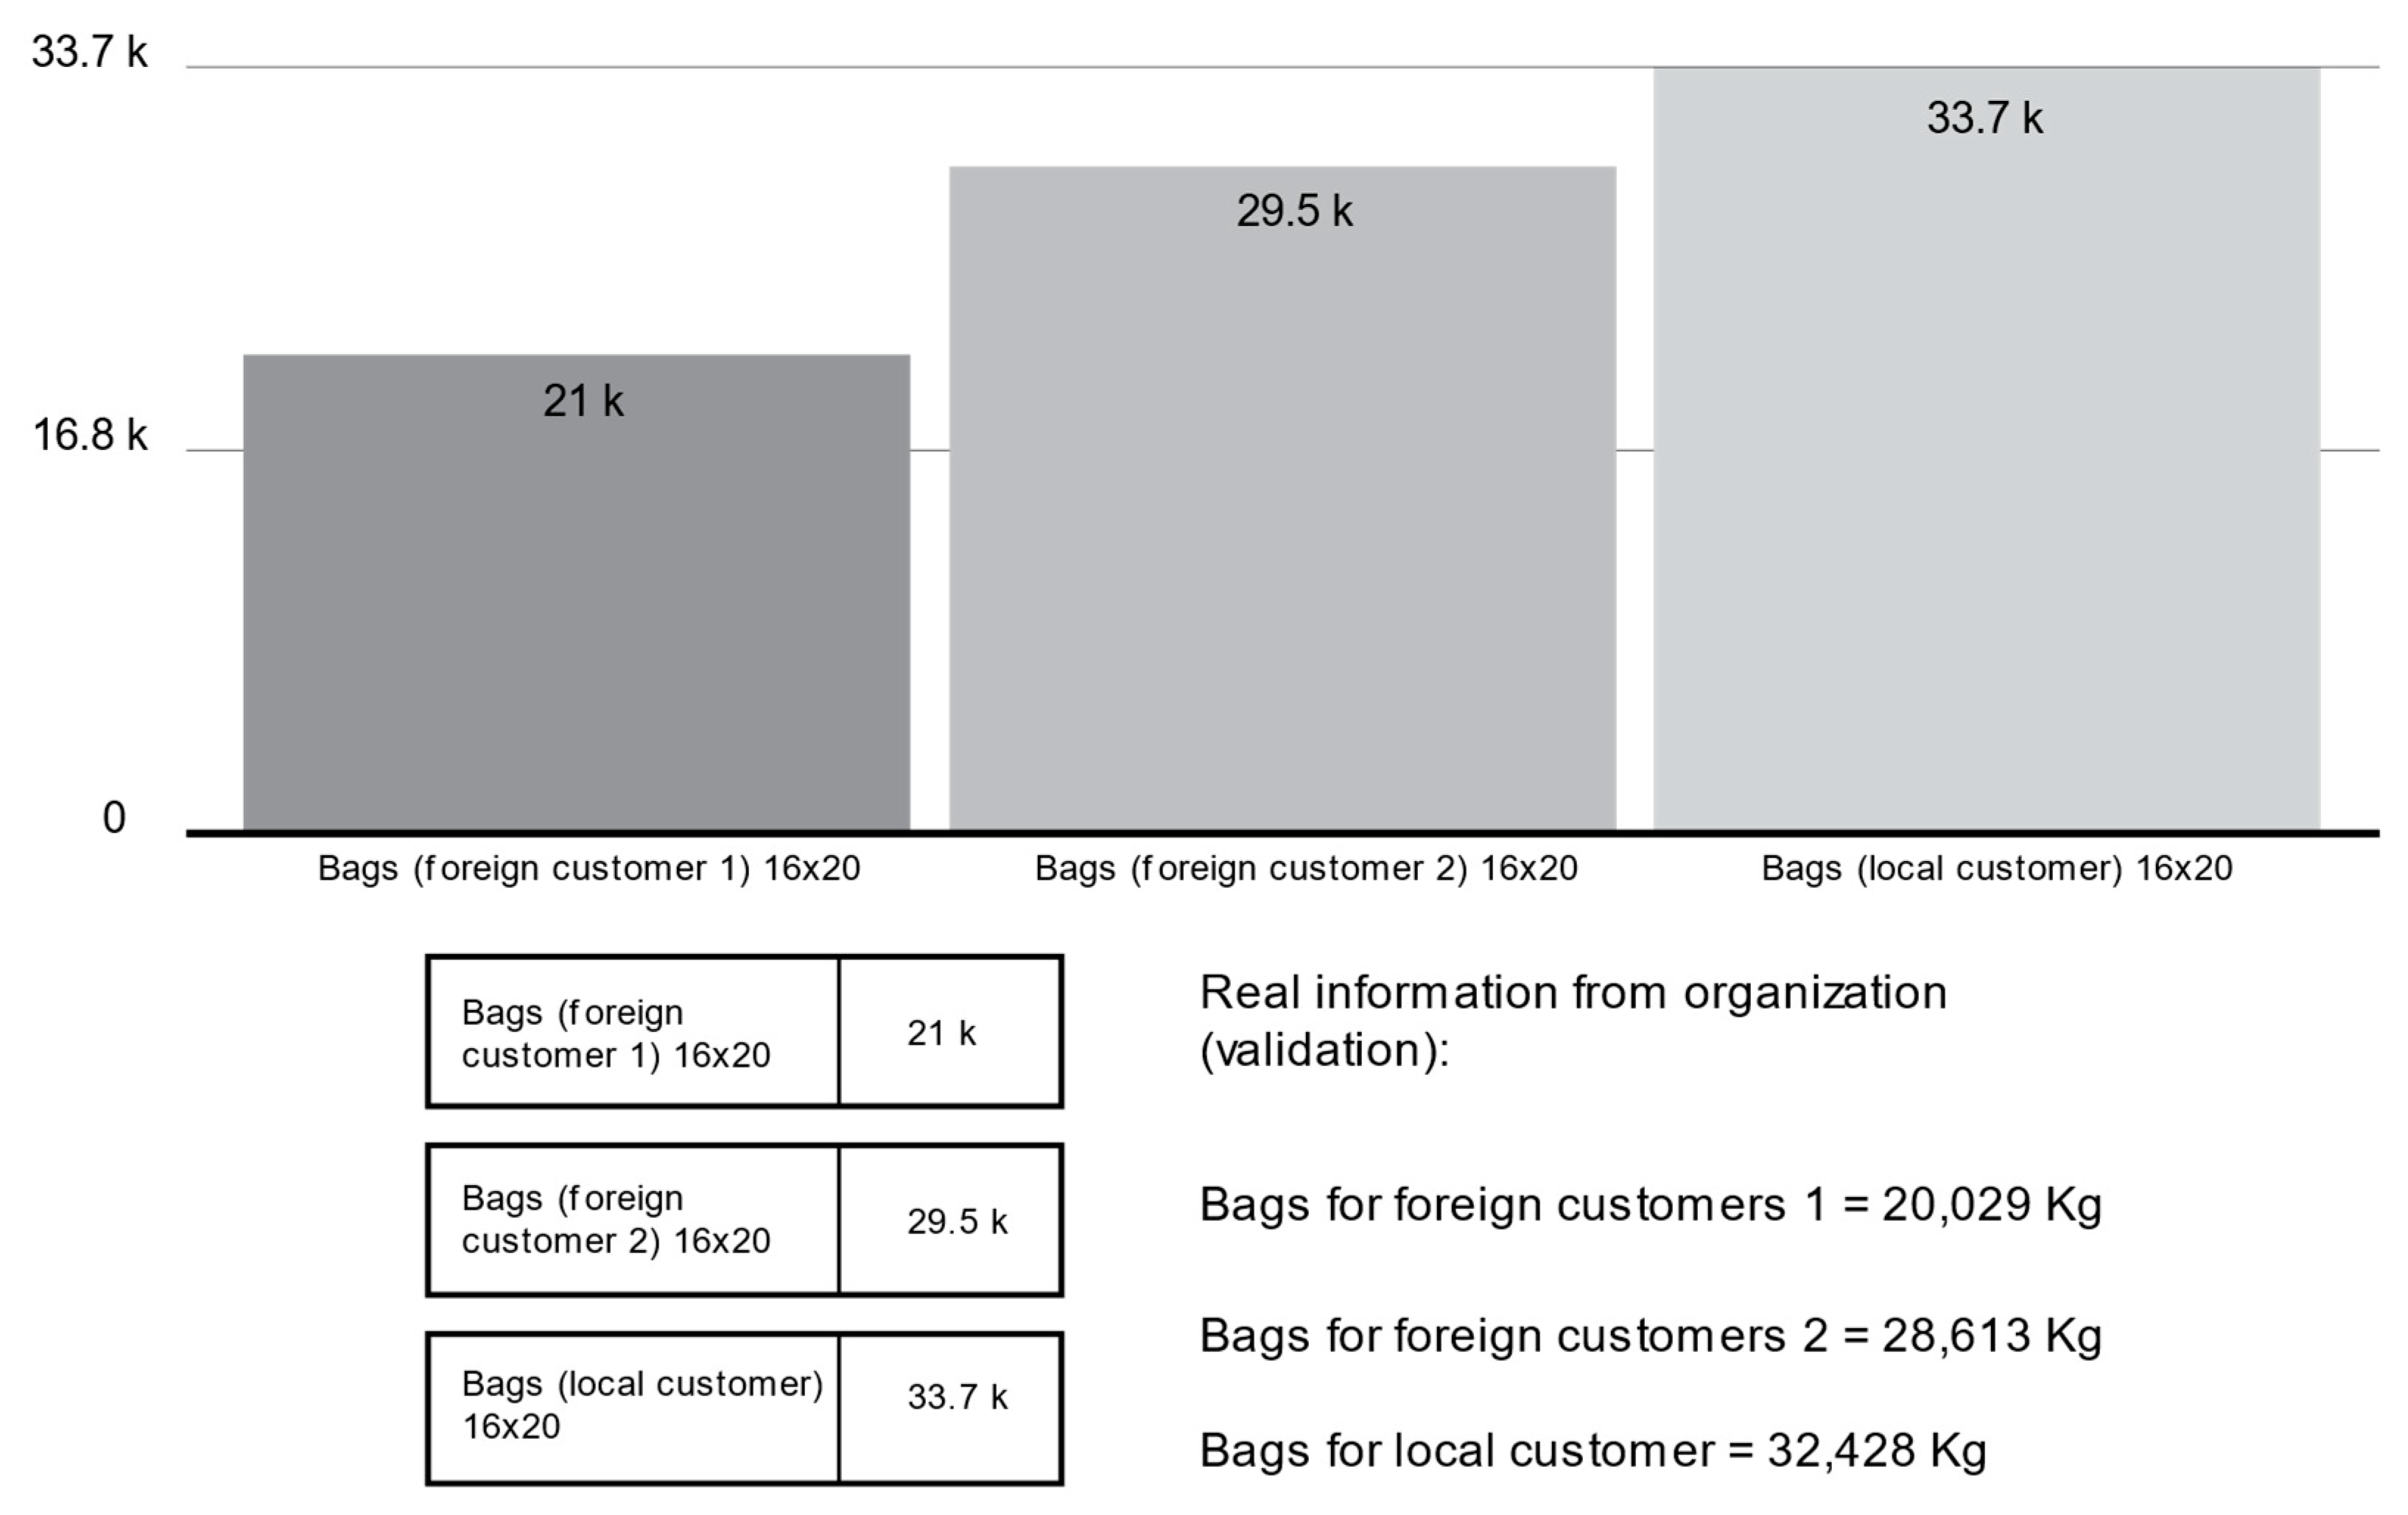
Percentage (%) error proofing: This technique involves analyzing the generated error percentage from the real-data thermo-bags for each type of client against the simulated data, divided between the real data in absolute values. The model is validated and reliable if the error rate is smaller or equal to 5%. Figure 11 compares the company data recorded in Excel with those provided by the simulation.
Errors for this thermo-shrinkable bag model are associated with each type of client.
The following equation and data were used for this test:
%REi = |(Simulated dataj − Real datak)/Real datak| × 100%
where
  • RE = relative error;
  • i = type of client;
  • j = 16 × 20 thermo-shrinkable bags based on simulated client type;
  • k = 16 × 20 real-type thermo-shrinkable bags;
By calculating the percentage of the relative error/each type of client error, the following information is obtained:
  • Foreign client 1 (FC1):
    % relative error =
    (21,000 − 20,029)/20,029 × 100% = 4.85% ≤ 5%, complies with validation criteria
  • Foreign client 2 (FC2):
    % relative error =
    (29,500 − 28,613)/28,613 × 100% = 3.10% ≤ 5%, complies with validation criteria
  • Local client (LC):
    % relative error =
    (33,000 − 32,428)/32,428 × 100% = 1.76% ≤ 5%, complies with validation criteria
In conclusion, the three types of customers that receive meat in 16 × 20 thermo-shrinkable bags comply with the relative error proofing and thus confirm that the model is realistic.

3.6. Scenario Evaluation with TOPSIS and FUCA Multicriteria Analyses

The TOPSIS and FUCA were used for scenario selection. The following data show the six variables considered for the multicriteria analysis related to the 16 × 20 bags and 30 kg boxes of meat. In this comparison, the six variables (markers) were used to apply Max or Min criteria (Table 2).
Eighteen scenarios were simulated under these conditions. Six current scenarios were compared with six pessimistic and six optimistic scenarios using TOPSIS and FUCA.
Table 3 shows the scenario simulation applying the two multicriteria methods to select the best scenario. Using both techniques is especially important with multiple objectives that converge in a complex system and require simultaneous validation for better decision-making. The cited works discuss where these two methods are used in order to compare them [34,35].
Finally, in this scenario selection, optimistic scenario 2 achieved rank 1 using the two multicriteria analysis methods: (1) TOPSIS: The higher the general value is 0.688727. (2) FUCA: The lower the generated value is (7.3), the better the scenario is.
Based on the previous analysis, the scenarios were analyzed from a strategic perspective to generate value for the organization, enabled by using SD. This showed the cause-and-effect relationships and supported the company’s strategy, achieving a leadership position [36,37] by reducing costs and the quality of its products. Kunk [38] offers an interesting option for strategic analysis with SD in two ways: (1) developing scenarios using SD modeling; and (2) supporting scenarios built using intuitive logic with SD modeling.

3.7. Developing the Graphical User Interface

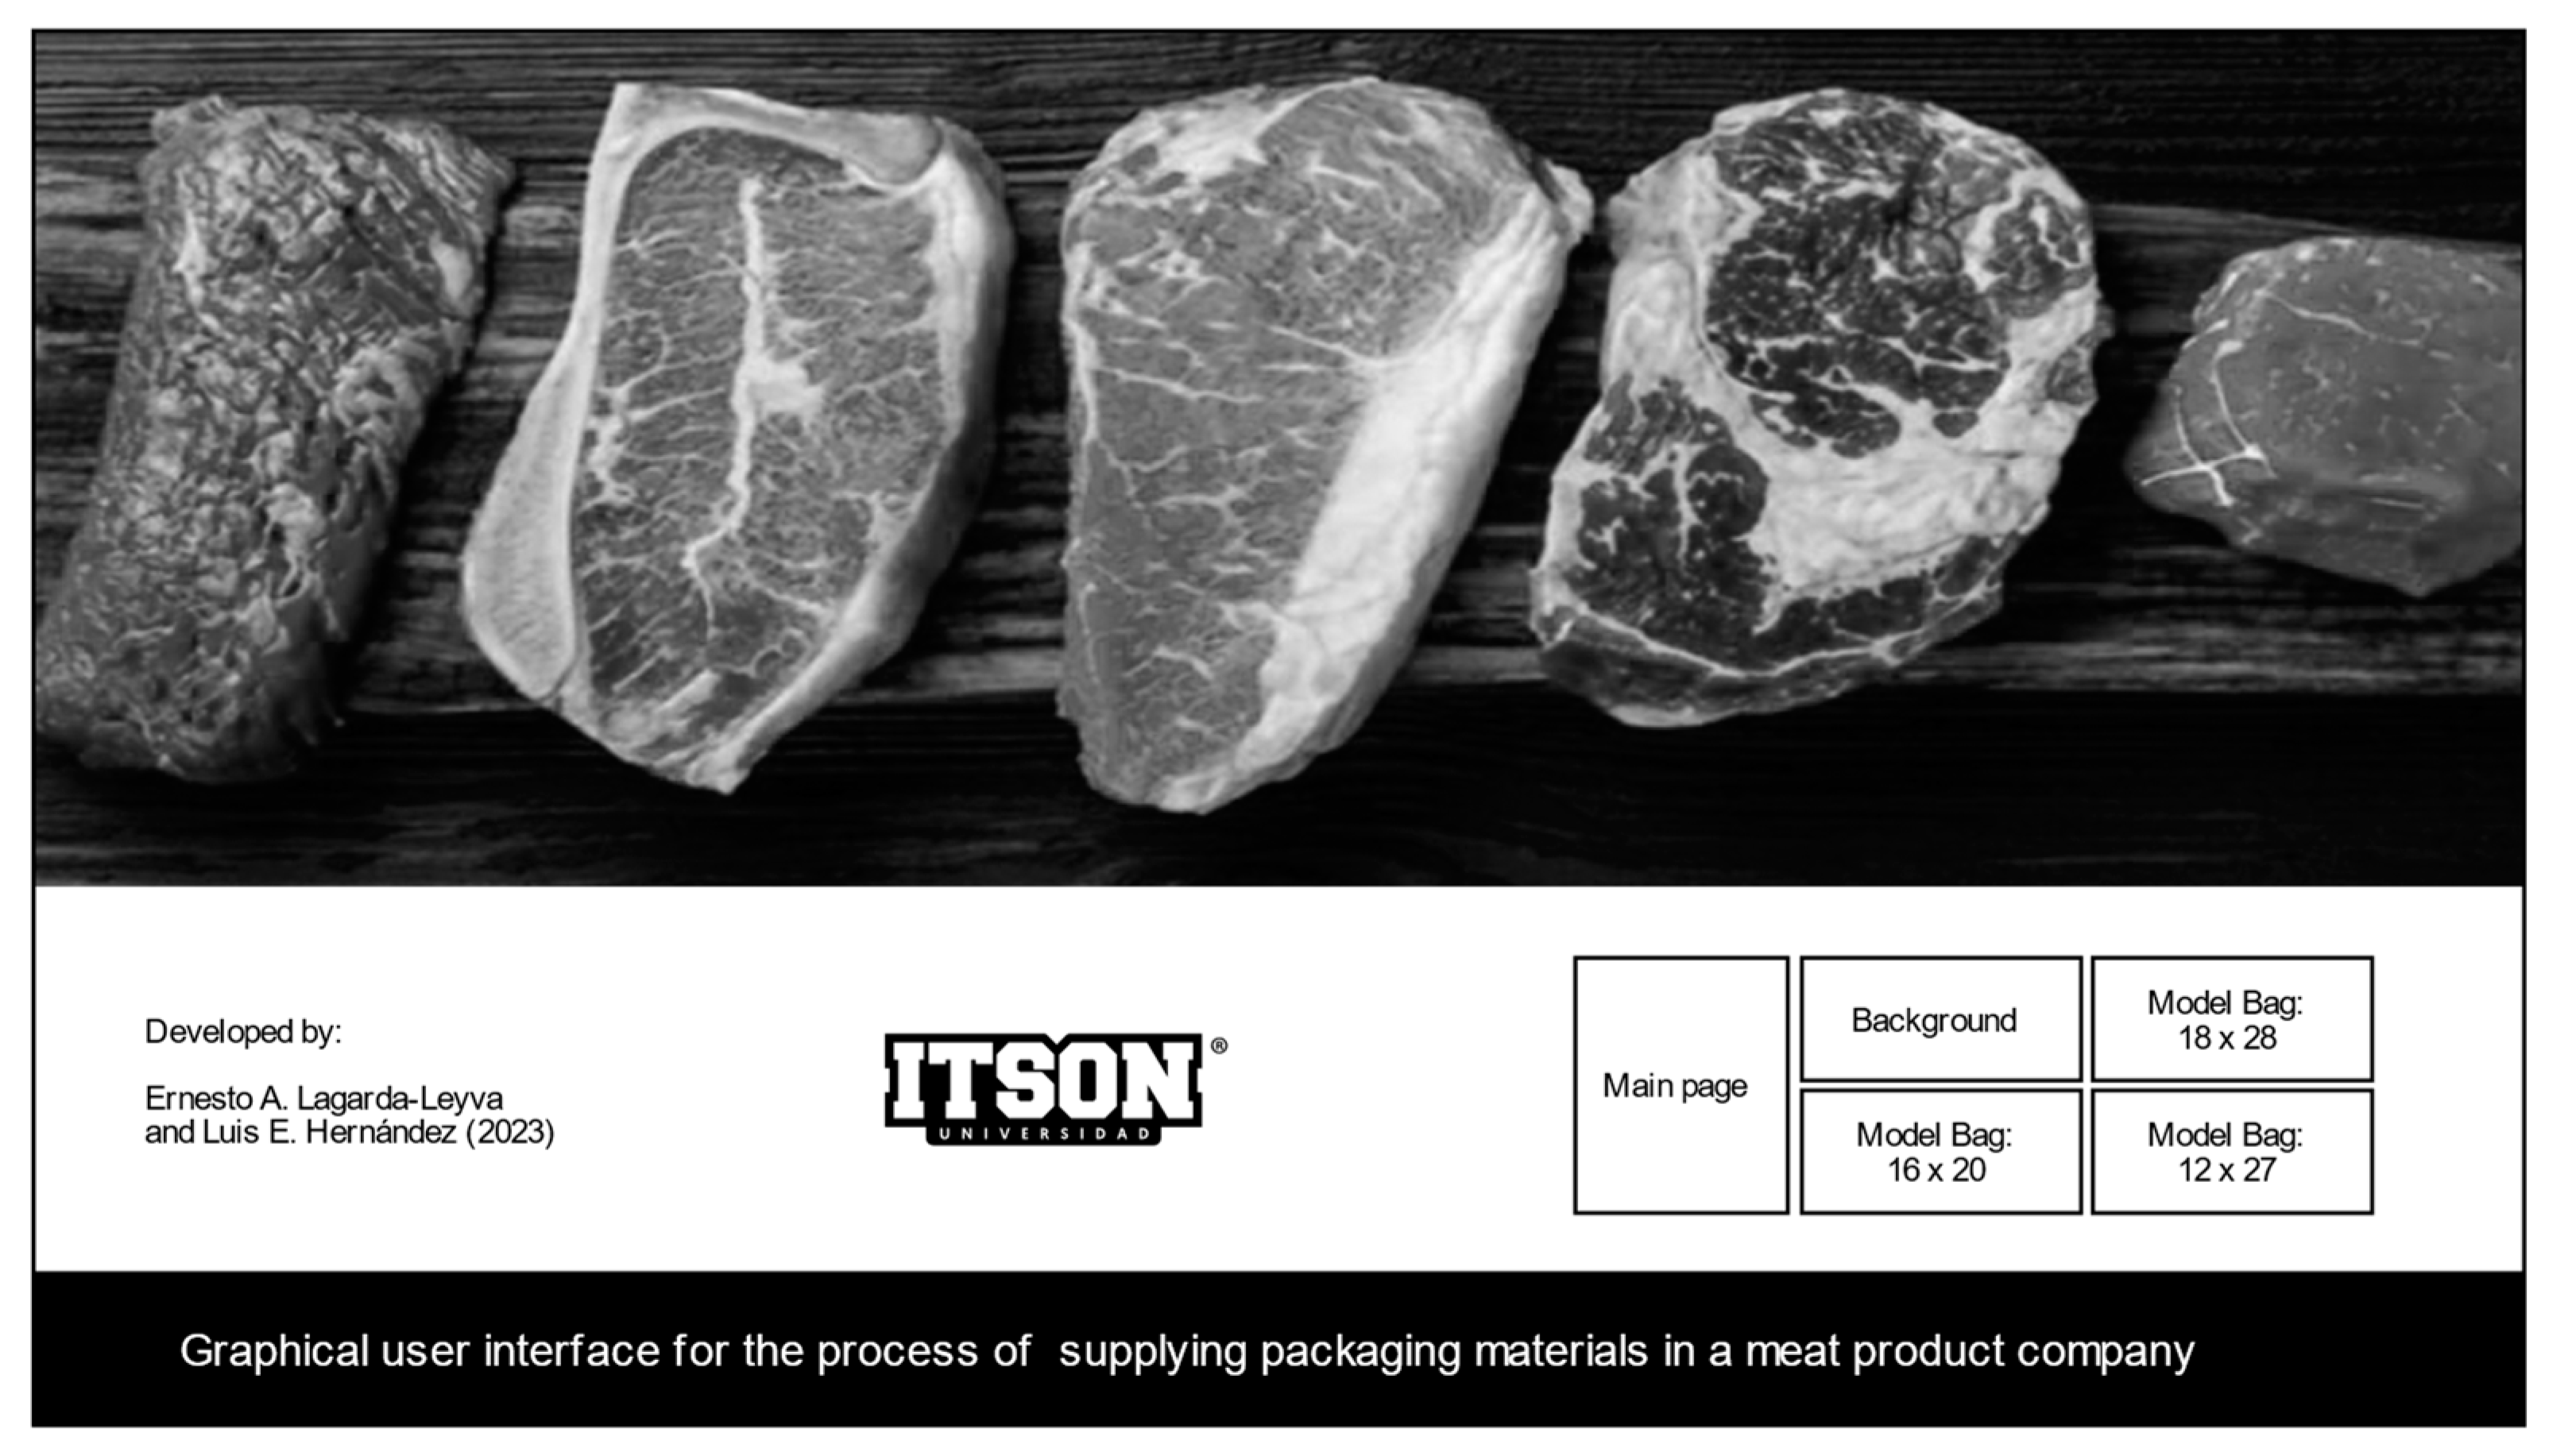
The graphical user interface enables better communication and development using Stella® Architect. Figure 12 shows the first screen, which contains navigation instructions within the different sections of the interface. The company background is also shown.
This interface is very simple, with five buttons found on the first screen: (1) Main menu, containing the main navigation buttons; (2) Background, offering a perspective on the project background and its objectives; and (3) Model bag, offering three buttons showing direct information on each of the models associated with the types of bags (16 × 20, 18 × 28, and 12 × 27).
The second screen shows a section of the organization to provide the user with more context on the organization and the interface objective.
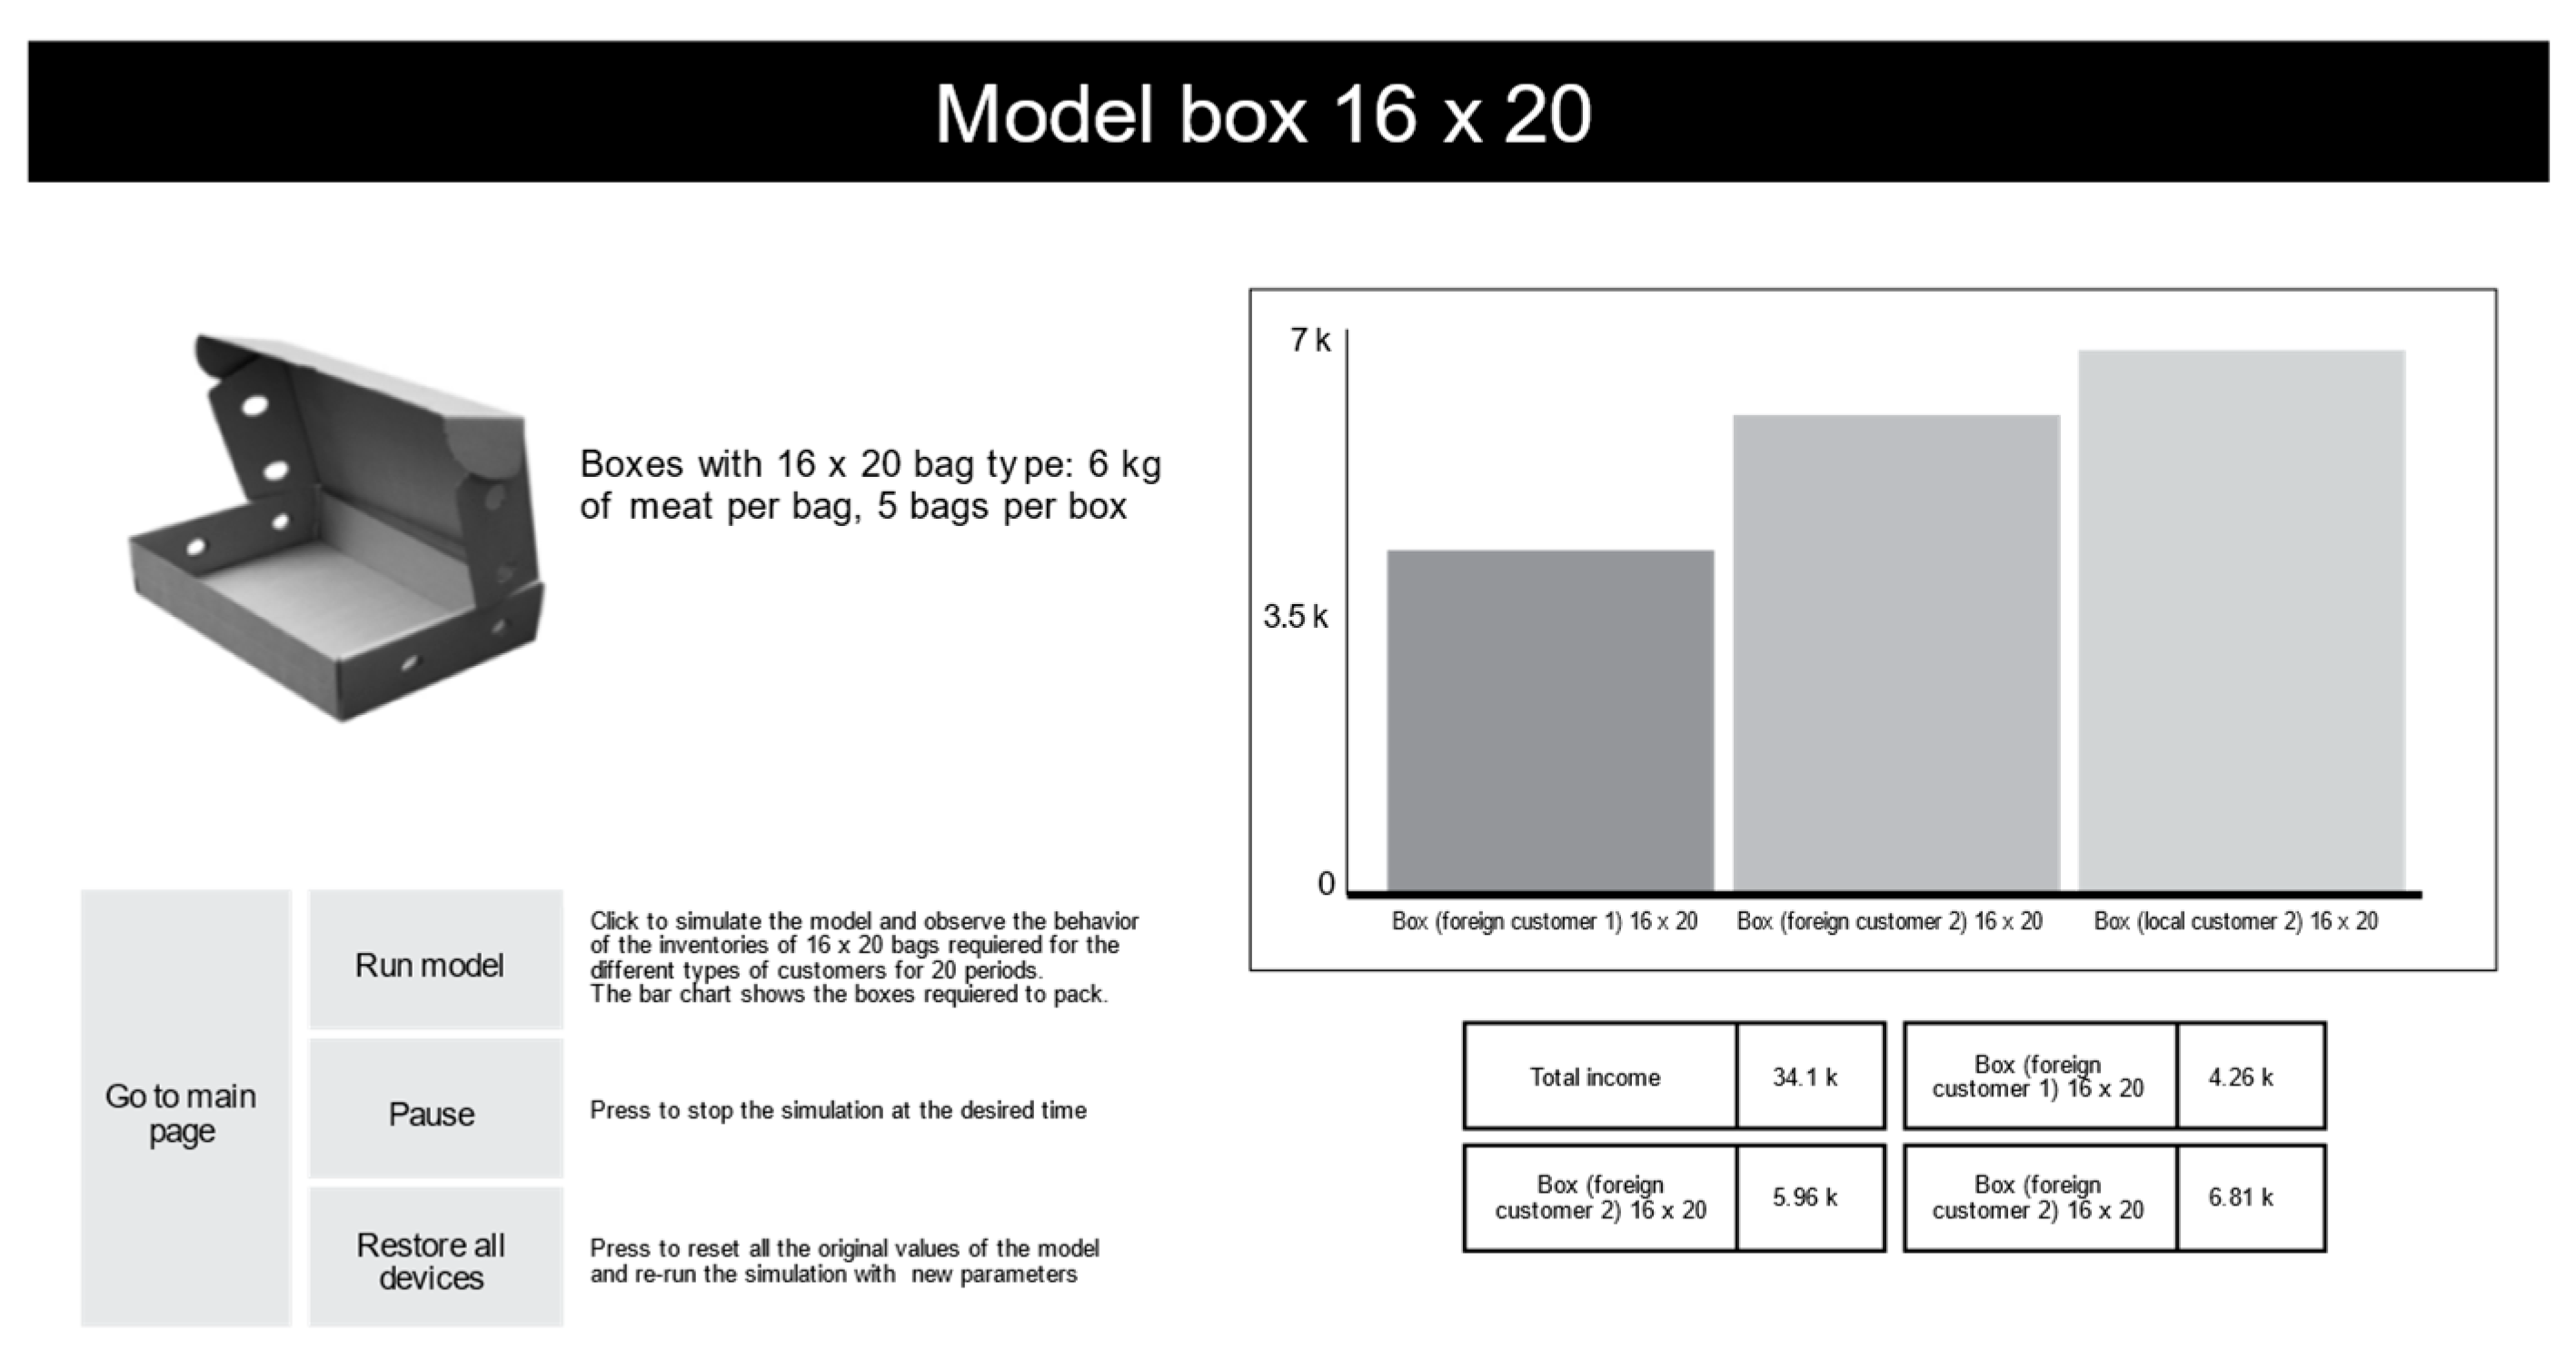
Figure 13 and Figure 14 show the buttons corresponding to 16 × 20 bags.
This part of the interface allows the users to obtain the number of bags for the three types of simulated clients. This situation simulates the model and demonstrates the behavior of the 16 × 20 thermo-shrinkable bags required for the different clients during a 30-day period. The bar chart shows the bags required during the 30 days.
A response capacity was observed for the 16 × 20 bags used for different clients: foreign customer 1 = 21,300 bags; foreign customer 2: 29,800 bags; and local clients: 34,100 bags. The image shows that each quantity was subjected to the demand of each client type at the time the model simulation was developed. The user can observe these graphical behaviors to determine better tendencies under these scenarios.
The associated costs for the organization are as follows for the 16 × 20 thermo-shrinkable bags/types of clients:
Foreign customer 1 = (21,300 bags) × (USD 0.45162/bag) = USD 9619.50;
Foreign customer 2 = (29,800 bags) × (USD 0.45162/bag) = USD 13,458.27;
Local customers = (34,100 bags) × (USD 0.45162/bag) = USD 15,400.24.
The total cost associated with the bags is USD 38,478.01 while also adding the required bags for the three client types in the following manner:
Adding up all of the 16 × 20 thermo-shrinkable bags required by the three client types yields 85,200 bags.
To calculate the costs associated with the boxes, each has a capacity of 5 bags/box, which should require 17,040 boxes.
Total cost for boxes = 17,040 boxes × USD 1.93546/box = USD 32,980.23.
The total costs are the sum of the associated costs of the total bags and boxes used: USD 32,980.23 + 38,478.01 = USD 71,458.24.
Figure 14 shows that the interface allows the user to obtain the number of boxes based on the type of selected bag. This interface allows the model to simulate and show the delivery behavior of the different clients for the 30-day period. The bar chart shows the boxes required for meat packaging.
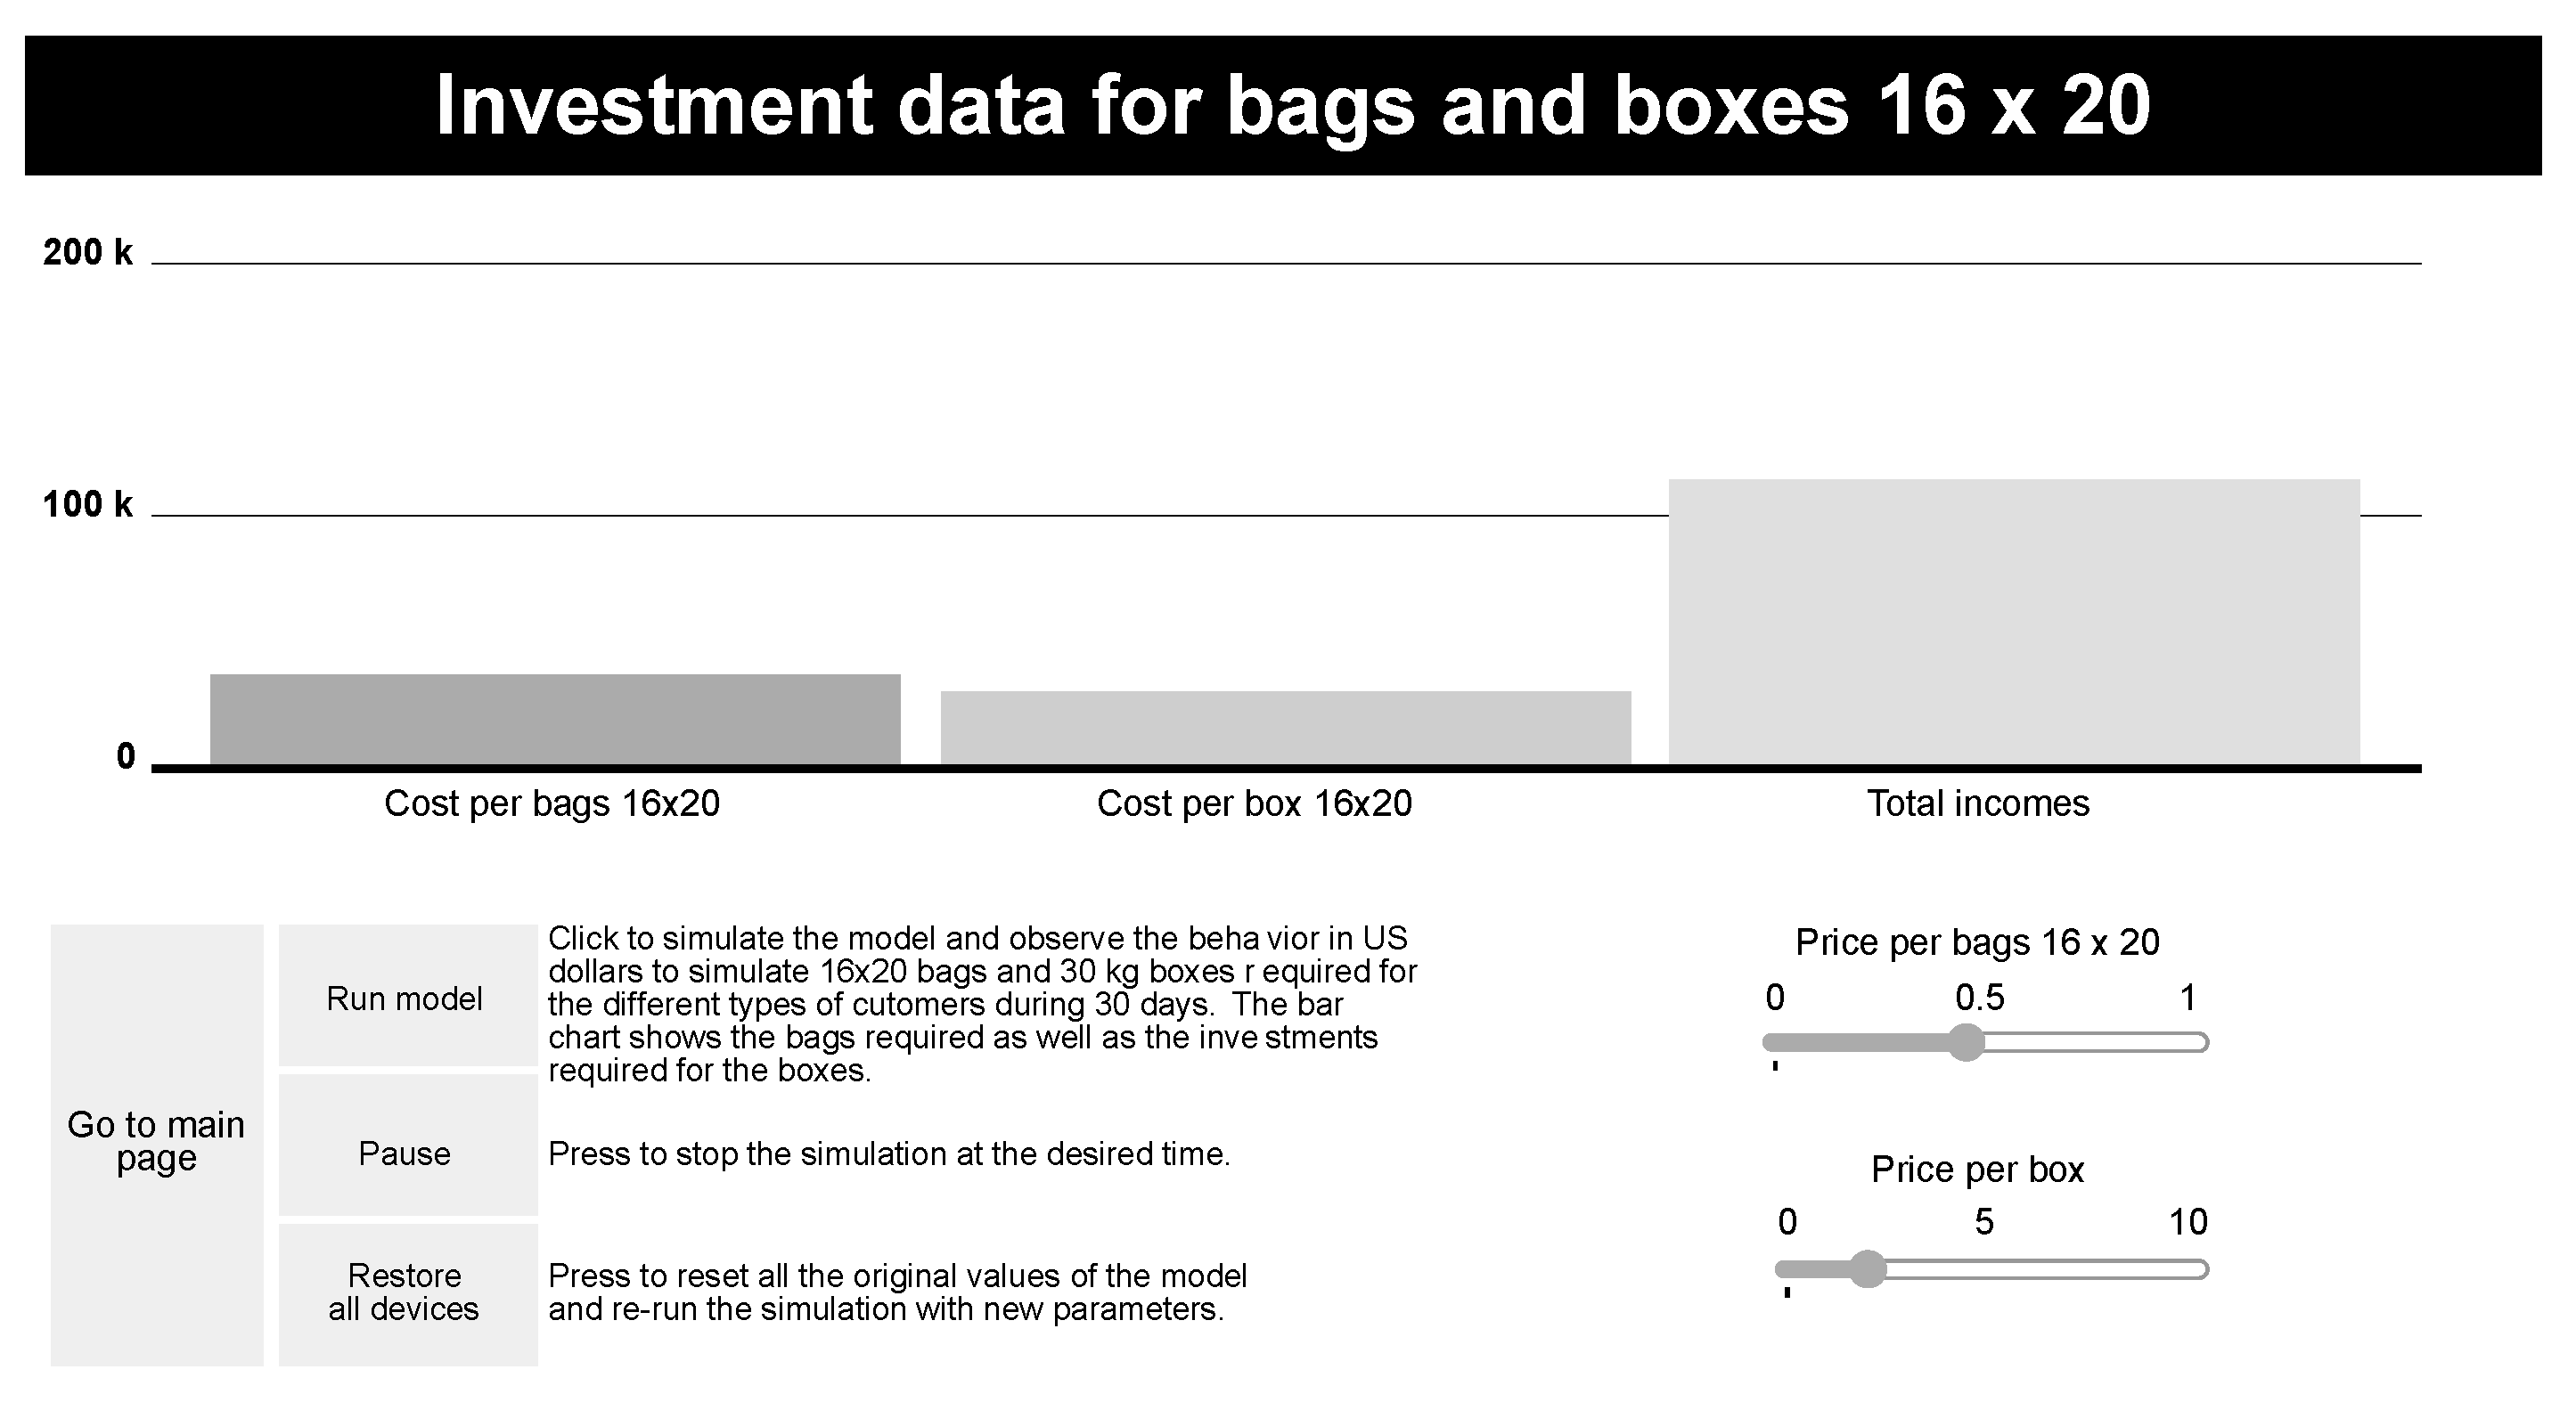
The data presented in Figure 15 allow us to obtain the amount invested based on the selected box and bag. This tab allows the model to simulate and show the behavior associated with investing USD in 16 × 20 thermo-shrinkable bags and 30 kg required boxes for different types of clients during 30 periods. The bar chart shows the bags required for 30 days.
The costs associated with 16 × 20 thermo-bags and boxes are fixed by external providers; one of the ways in which costs can be reduced could be by making shorter processes controlled by the organization, thus increasing income.
On the other hand, new providers may be redefined. They may offer a better price on the box and bag market, maintaining normativity and product packaging quality.
Technological solutions have been developed considering graphical user interfaces with diverse methods since 1991, with more than 230 published articles indicating the relevance of this solution as a support for decision-makers in organizations [39].
Our main recommendations are as follows:
(a)
Companies should control their available bag and box inventories to comply with monthly demands;
(b)
A GUI offers information before urgent shopping and generates maintenance costs for inventories;
(c)
Companies should generate better production programs by identifying the most likely scenarios for production based on the most likely scenarios according to the tendencies of fresh beef market consumers.
Two important contributions exist regarding this proposal: (1) The first is empirical, where system dynamics is used to develop graphical user interfaces for fresh-food sector users. The literature is very limited regarding articles in databases; thus, conducting studies such as this one is valuable for the academic community. (2) The second is a tool that facilitates decision-making in the field using GUI such that knowledge of DS among staff is not required. Nevertheless, users should be clear on the necessary indicators and relationships in order to load information into the required GUI sections, obtaining different scenarios for decision-making before undertaking real-life applications.

4. Discussion

Cold chains require on-time delivery and analyses of their packaging logistics in optimal conditions based on transportation needs and the different ways they manage their products. The process developed for the company in the study offers a technological solution as a visual support based on data for one of its packaging products [40,41,42].
Companies use different tools for decision-making based on data. To reduce costs, simulating processes to observe behavioral modes before investing or, in this case, implementing policies is recommended. These techniques have been documented by Thomy et al. [43].
Using systems dynamics in companies that manage supply chains has been of high interest in the field of efficient decision-making based on quantitative scenarios for perishable products, such as meat. Abbasi-Tavallali et al. [44] conducted a related study, using system dynamics to evaluate scenarios in a cross-docking process to minimize risk to perishable products, resulting in many cases of cost and inventory reduction [45].
Multicriteria analysis techniques are useful for selecting the best options in a set of objectives. In the current study, six criteria were analyzed to determine the best scenario for the company; similar studies have also used the FUCA and TOPSIS multicriteria analysis techniques in the supply chain [46,47].
Decision-making focuses on different visual supports, such as using graphical interfaces [48,49]. The most relevant information can be provided to those who manage supply chains. By supplying real-time results, executive summaries reduce analysis times for efficient users and, thus, their responses—for example, this might involve buying supplies or, in this case, delivering products to final clients and the resulting income, as in the present project.
While reviewing other works on decision-making, Zhan et al. [50] stood out. They studied an omnichannel model for sales services, mainly examining queuing theory to analyze online and offline client behavior and the impact of waiting time. Moreover, the business capacity was characterized by the rate in the queuing model. The authors showed that—independent of the queuing delivery mode—omnichannel sales may offer greater benefits to businesses by integrating demand.
One of the main findings of Yuan et al. [51] is related to the present study. They tried to obtain optimal decisions and policies with system dynamics in order to assign capacities to services with a policy of reactive capacity. They performed this to better understand the role of decisions in complex management systems.
Other studies of DS in complex environments with offer and demand models have examined products such as meat for decision-making based on different policies. For example, Odoemena et al. [52] examined meat consumption work in Nigeria. Similarly, Anaking and Suryani [53] focused on beef meat, the demand for which increases proportionally or according to population increases, rent per national capital, and raw materials for the food industry.
Future work for this project will be related to implementing other two-bag models used in packaging fresh meat, which may apply to the solution for 16 × 20 bags developed in this study.

5. Conclusions

When producing a project for an organization, it is important to know the company’s internal processes and to determine the opportunity areas in departments where improvements are required.
The following are the main conclusions from applying a technological solution in the present study: (1) Demand visibility in an organization must be accounted for, representing significant savings in organizational processes; (2) excess and waste must be avoided, as they are the main implementation obstacles in system dynamics; and (3) the correct control in forecasting the necessary supply of products should be implemented considering demand.
System dynamics can solve complex problems but requires knowledge and systemic thinking abilities. Thus, having the correct focus and adequate data is important for finding solutions in organizations considering different restrictions and policies.
From a theoretical perspective, the main contribution of the present study is a robust methodology for evaluating scenarios, using multicriteria decision analysis techniques to select the most favorable scenarios. The main practical contributions are production and food delivery services for companies in this sector using a user-friendly solution based on the theory of complex analysis systems.
The innovative solution provided to the company in the study integrates system dynamics and multicriteria methodologies. It also provides a design that can create an integrated technological solution with a graphical interface for decision-makers using familiar information environments integrated into performance metrics relationships and known data, enabling them to evaluate diverse scenarios.
The present research is limited to three essential products for the meat packaging and sale processes of the company in the study. The information is limited to the content of the elements comprising the designed graphical interphase, with the most relevant information distilled for decision-makers.
Using robust methodologies that facilitate decision-making processes based on quantitative data, the present study offers user-friendly technological solutions to organizations that produce high-volume products.
Thus, the benefits of using a solution with a graphical user interface (GUI) are as follows:
(1)
It offers information on products used for three kinds of fresh meat packaging, evaluating bag costs based on the different demands in different scenarios. Thus, advanced purchases can be foreseen and bag inventories reduced, as shown in the following bag and box cost analysis:
   16 × 20 bag = USD 0.45162;
   12 × 27 bag = USD 0.62239;
   14 × 22 bag = USD 0.4814;
   30 kg box = USD 1.93546.
(2)
It allows the users to analyze the number of 30 kg capacity boxes needed for the different thermo-bags used. Thus, adequate inventories can be obtained based on the processed bags for each type:
   16 × 20 thermo-shrinkable bags: 6 kg meat capacity/bag, 5 bags/box;
   12 × 27 thermo-shrinkable bags: 3 kg meat capacity/bag, 10 bags/box;
   18 × 28 thermo-shrinkable bags: 15 kg meat capacity/bag, 2 bags/box.
(3)
It uses a total cost analysis of the high-volume meat demand through its GUI, with 39 scenarios similar to the screen displayed in Figure 13. The total costs are USD 71,450.24 after adding the total cost for boxes (17,040 boxes × USD 1.93546/box = USD 32,980.23) and the total cost associated with the organization in terms of three bag types (USD 38,478.01).
(4)
Finally, it provides decisions based on quantitative data. On the one hand, all data are selected based on three scenarios (optimistic, pessimistic, and normal). On the other hand, the data are based on the costs of the two prime matters analyzed (three types of bags and boxes for 30 kg of fresh meat).
(5)
This study can be used by the academic community. It uses a real-life application of the SD methodology, following a systematic approach to solve complex problems.
(6)
For organizations, it represents a technological contribution that facilitates decision-making limited to current restrictions and possible scenarios.
Future investigations may involve complex system analyses by those who have knowledge of mapping processes, system theories, and system dynamics methodology management, as well as multicriterial analyses for scenario evaluations detached from model simulations.

Author Contributions

Conceptualization, E.A.L.-L. and L.E.H.-V.; methodology, E.A.L.-L.; software, E.A.L.-L.; validation, E.A.L.-L., L.E.H.-V., and A.B.-S.; formal analysis, E.A.L.-L. and L.E.H.-V.; investigation, L.E.H.-V.; resources, E.A.L.-L.; data curation, E.A.L.-L.; writing—original draft preparation, E.A.L.-L.; writing—review and editing, E.A.L.-L.; visualization, E.A.L.-L.; supervision, A.B.-S.; project administration, E.A.L.-L. All authors have read and agreed to the published version of the manuscript.

Funding

This research received no external funding.

Institutional Review Board Statement

Not applicable.

Informed Consent Statement

Not applicable.

Data Availability Statement

The data are contained within the article.

Acknowledgments

E.A.L.-L.; L.E.H., and A.B.-S. are grateful to ITSON (Instituto Tecnológico de Sonora) for its support through the CA 23-Cadenas Productivas project (PROFAPI 2024); CONAHCYT (Consejo Nacional de Humanidades, Ciencias y Tecnologías) for its support of the ITSON National Laboratory for Transportation Systems and Logistics; and Diana Fischer for translating and editing the manuscript.

Conflicts of Interest

The authors declare no conflicts of interest.

References

  1. Forrester, J. Dinámica Industrial, 2nd ed.; El Ateneo: Buenos Aires, Argentina, 1981. [Google Scholar]
  2. Sterman, J.D. Business Dynamics, Systems Thinking and Modeling for a Complex World; McGraw Hill: New York, NY, USA, 2000. [Google Scholar]
  3. Lagarda-Leyva, E.A.; Ruiz, A.; Morales-Mendoza, L.F. A System Dynamics Approach to Valorize Overripe Figs in the Brewing of Artisanal Beer. Sustainability 2024, 16, 1627. [Google Scholar] [CrossRef]
  4. Aracil, J.; Gordillo, F. Dinámica de Sistemas; Alianza: Madrid, Spain, 1997. [Google Scholar]
  5. Arellano González, A.; Carballo Mendivil, B.; Ríos Vazquez, N. Análisis y Diseño de Procesos: Una Metodología con Enfoque de Madurez Organizacional; Pearson: Ciudad de México, Mexico, 2017. [Google Scholar]
  6. Richardson, G.; Pugh, A., III. Introduction to System Dynamics Modeling with Dynamo. J. Oper. Res. Soc. 1997, 48, 1146. [Google Scholar] [CrossRef]
  7. Senge, P. La Quinta Disciplina, 2nd ed.; Granica: Buenos Aires, Argentina, 2005. [Google Scholar]
  8. Merck, A.W.; Grieger, K.D.; Deviney, A.; Marshall, A.-M. Using a Phosphorus Flow Diagram as a Boundary Object to Inform Stakeholder Engagement. Sustainability 2023, 15, 11496. [Google Scholar] [CrossRef]
  9. Poswa, F.; Adenuga, O.T.; Mpofu, K. Productivity Improvement Using Simulated Value Stream Mapping: A Case Study of the Truck Manufacturing Industry. Processes 2022, 10, 1884. [Google Scholar] [CrossRef]
  10. Antony, J.; Scheumann, T.; Sunder, M.V.; Cudney, E.; Rodgers, B.; Grigg, N.P. Using Six Sigma DMAIC for Lean project management in education: A case study in a German kindergarten. Total Qual. Manag. Bus. Excell. 2021, 33, 1489–1509. [Google Scholar] [CrossRef]
  11. Kleijnen, J. Verification and validation of simulation models. Eur. J. Oper. Res. 1995, 82, 145–162. [Google Scholar] [CrossRef]
  12. Crabolu, G.; Font, X.; Eker, S. Evaluating policy complexity with Causal Loop Diagrams. Ann. Tour. Res. 2023, 100, 103572. [Google Scholar] [CrossRef]
  13. Karunakaran, S.K.; Ramasamy, N.; Anand, M.D.; Santhi, N. Factor analysis of environmental effects in circular closed-loop supply chain network design and modeling under uncertainty in the manufacturing industry. Environ. Qual. Manag. 2024, 34, e22229. [Google Scholar] [CrossRef]
  14. Ong, J.; Musa, S.N.; Mahmood, N.Z. System Dynamic Modeling for Plastic Supply Chain in Klang Valley, Malaysia. Pol. J. Environ. Stud. 2022, 31, 1257–1269. [Google Scholar] [CrossRef]
  15. Hajbabaie, M.; Jozi, S.A.; Farsad, F.; Kiadaliri, H.; Gharagozlou, A. Model of ecological resilience in Hyrcanian forests that combines the decision-making trial and evaluation method (DEMATEL) and system dynamics. Environ. Monit. Assess. 2023, 195, 448. [Google Scholar] [CrossRef]
  16. Richmond, B. Introduction to System Thinking; STELLA®; Isse Systems: Lebanon, NH, USA, 2013; ISBN 100970492111. [Google Scholar]
  17. Calicioglu, O.; Sengul, M.Y.; Femeena, P.V.; Brennan, R.A. Duckweed growth model for large-scale applications: Optimizing harvesting regime and intrinsic growth rate via machine learning to maximize biomass yields. J. Clean. Prod. 2021, 324, 129120. [Google Scholar] [CrossRef]
  18. Bokhari, H.H.; Najafi, E.; Dawidowicz, J.; Wuchen, L.; Maxfield, N.; Vörösmarty, C.J.; Fekete, B.M.; Corsi, F.; Sanyal, S.; Lin, T.-S.; et al. Simulating basin-scale linkages of the food-energywater nexus with reduced complexity modeling. Front. Environ. Sci. 2023, 11, 1077181. [Google Scholar] [CrossRef]
  19. Chapra, S.; Canale, R. Numerical Methods for Engineers, 7th ed.; Mc Graw Hill Education: New York, NY, USA, 2015. [Google Scholar]
  20. Barlas, Y.; Carpenter, S. Philosophical roots of model validation: Two paradigms. Syst. Dyn. Rev. 1990, 6, 148–166. [Google Scholar] [CrossRef]
  21. Campuzano-Bolarín, F.; Mula, J.; Díaz-Madroñero, M.; Legaz-Aparicio, Á.-G. A rolling horizon simulation approach for managing demand with lead time variability. Int. J. Prod. Res. 2020, 58, 3800–3820. [Google Scholar] [CrossRef]
  22. Correa Hackenhaar, I.; Babí Almenar, J.; Elliot, T.; Rugani, B. A spatio temporally differentiated product system modeling framework for consequential life cycle assessment. J. Clean. Prod. 2022, 333, 130127. [Google Scholar] [CrossRef]
  23. Enjolras, M.; Galvez, D.; Camargo, M. Knowledge Management in the Supply Chain. In Decision-Making Tools to Support Innovation; Enjolras, M., Galvez, D., Camargo, M., Eds.; ISTE Ltd.: London, UK, 2023. [Google Scholar] [CrossRef]
  24. Fernando, M.M.L.; Escobedo, J.L.P.; Azzaro-Pantel, C.; Pibouleau, L.; Domenech, S.; Aguilar-Lasserre, A. Selecting the best portfolio alternative from a hybrid multi objective GA-MCDM approach for New Product Development in the pharmaceutical industry. In Proceedings of the IEEE Symposium on Computational Intelligence in Multicriteria Decision-Making (MDCM), Paris, France, 11–15 April 2011; pp. 159–166. [Google Scholar]
  25. Wang, Z.; Rangaiah, G.P. Application and Analysis of Methods for Selecting an Optimal Solution from the Pareto-Optimal Front obtained by Multi-objective Optimization. Ind. Eng. Chem. Res. 2016, 56, 560–574. [Google Scholar] [CrossRef]
  26. Er Kara, M.; Ghadge, A.; Bititci, U.S. Modelling the impact of climate change risk on supply chain performance. Int. J. Prod. Res. 2021, 59, 7317–7335. [Google Scholar] [CrossRef]
  27. Saha, S.; Sarkar, B.; Sarkar, M. Application of improved meta heuristic algorithms for green preservation technology management to optimize dynamical investments and replenishment strategies. Math. Comput. I Simul. 2023, 209, 426–450. [Google Scholar] [CrossRef]
  28. Yorozu, Y.; Hirano, M.; Oka, K.; Tagawa, Y. Electron spectroscopy studies on magneto-optical media and plastic substrate interface. IEEE Transl. J. Magn. Jpn. 1987, 2, 740–741. [Google Scholar] [CrossRef]
  29. Lim, A.; Village, J.; Salustri, F.; Neumann, W. Process mapping as a tool for participative integration of human factors into work system design. Eur. J. Ind. Eng. 2014, 8, 273–290. [Google Scholar] [CrossRef]
  30. Yang, Y.; Lin, J.; Hedenstierna, C.P.T.; Zhou, L. The more the better? The impact of the number and location of product recovery options on the system dynamics in a closed-loop supply chain. Transp. Res. Part E Logist. Transp. Rev. 2023, 175, 103150. [Google Scholar] [CrossRef]
  31. Coletta, V.R.; Pagano, A.; Pluchinotta, I.; Zimmermann, N.; Davies, M.; Butler, A.; Fratino, U.; Giordano, R. Participatory causal loop diagrams building for supporting decision-makers integrating flood risk management in an urban regeneration process. Earth’s Future 2024, 12, e2023EF003659. [Google Scholar] [CrossRef] [PubMed]
  32. Newberry, P.; Carhart, N. Constructing causal loop diagrams from large interview data sets. Syst. Dyn. Rev. 2024, 40, e1745. [Google Scholar] [CrossRef]
  33. Park, T.-H.; Kim, R.-Y.; Lim, S.-K. Two-Level Excitation Current Driver to Reduce the Driving Power of an Electromagnetic Contactor. Electronics 2024, 13, 916. [Google Scholar] [CrossRef]
  34. Thinh, H.X.; Mai, N.T. Comparison of two methods in multi-criteria decision-making: Application in transmission rod material selection. EUREKA Phys. Eng. 2023, 6, 59–68. [Google Scholar] [CrossRef]
  35. Kaya, A.; Pamucar, D.; Gürler, H.E.; Ozcalici, M. Determining the financial performance of the firms in the Borsa Istanbul sustainability index: Integrating multi criteria decision making methods with simulation. Financ. Innov. 2024, 10, 21. [Google Scholar] [CrossRef]
  36. Torres, J.P.; Kunc, M.; O’brien, F. Supporting strategy using system dynamics. Eur. J. Oper. Res. 2017, 260, 1081–1094. [Google Scholar] [CrossRef]
  37. Porter, M. What is strategy? Harv. Bus. Rev. 1996, 74, 61–78. [Google Scholar]
  38. Kunc, M. Integrating system dynamics and scenarios: A framework based on personal experience. Futures Foresight Sci. 2024, 6, e174. [Google Scholar] [CrossRef]
  39. Banerjee, I.; Nguyen, B.; Garousi, V.; Memon, A. Graphical user interface (GUI) testing: Systematic mapping and repository. Inf. Softw. Technol. 2013, 55, 1679–1694. [Google Scholar] [CrossRef]
  40. Bhardwaj, M.; Venaik, A.; Garg, P.S. Visualizing perishable product supply chain using petri net modeling. In Proceedings of the Transfer, Diffusion and Adoption of Next-Generation Digital Technologies, International Working Conference on Transfer and Diffusion of IT, Nagpur, India, 15–16 December 2023; Springer Nature: Cham, Switzerland, 2023; pp. 252–262. [Google Scholar]
  41. Baruffaldi, G.; Accorsi, R.; Santi, D.; Manzini, R.; Pilati, F. The storage of perishable products: A decision-support tool to manage temperature-sensitive products warehouses. In Sustainable Food Supply Chains; Academic Press: Cambridge, MA, USA, 2019; pp. 131–143. [Google Scholar]
  42. Maheshwari, P.; Kamble, S.; Pundir, A.; Belhadi, A.; Ndubisi, N.O.; Tiwari, S. Internet of things for perishable inventory management systems: An application and managerial insights for micro, small and medium enterprises. Ann. Oper. Res. 2021, 1, 1–29. [Google Scholar] [CrossRef] [PubMed]
  43. Saputro, T.E.; Figueira, G.; Almada-Lobo, B. Hybrid MCDM and simulation-optimization for strategic supplier selection. Expert Syst. Appl. 2023, 219, 119624. [Google Scholar] [CrossRef]
  44. Abbasi-Tavallali, P.; Feylizadeh, M.R.; Amindoust, A. A System Dynamics Model for Routing and Scheduling of Cross-dock and Transportation in Reverse Logistics Network of Perishable Goods. J. Intell. Fuzzy Syst. 2021, 40, 10417–10433. [Google Scholar] [CrossRef]
  45. Liu, P.; Hendalianpour, A.; Razmi, J.; Sangari, M.S. A solution algorithm for integrated production-inventory-routing of perishable goods with transshipment and uncertain demand. Complex Intell. Syst. 2021, 7, 1349–1365. [Google Scholar] [CrossRef]
  46. Wang, H.; Ju, Y.; Dong, P.; Wang, A.; Cabrerizo, F. Preference-based regret three-way decision method on multiple decision information systems with linguistic Z-numbers. Inf. Sci. 2024, 654, 119861. [Google Scholar] [CrossRef]
  47. Baydas, M.; Elma, O.; Pamucar, D. Exploring the Specific Capacity of Different Multi Criteria Decision Making Approaches under Uncertainty using Data from Financial Markets. Expert Syst. Appl. 2022, 197, 116755. [Google Scholar] [CrossRef]
  48. Nie, L.; Said, K.S.; Ma, L.; Zheng, Y.; Zhao, Y. A systematic mapping study for graphical user interface testing on mobile apps. IET Softw. 2023, 17, 249–267. [Google Scholar] [CrossRef]
  49. de Abreu Santos, V.Á.; van der Borg, J. Cultural Mapping Tools and Co-Design Process: A Content Analysis to Layering Perspectives on the Creative Production of Space. Sustainability 2023, 15, 5335. [Google Scholar] [CrossRef]
  50. Zhan, W.; Jiang, M.; Wang, X. The optimal capacity decision of the catering merchant in omnichannel—Service, production and delivery capacity. Kybernetes 2024, 53, 1958–1986. [Google Scholar] [CrossRef]
  51. Yuan, X.; Hwarng, H. Examining the dynamics of reactive capacity allocation through a chaos lens. Eur. J. Oper. Res. 2023, 308, 912–928. [Google Scholar] [CrossRef]
  52. Odoemena, K.G.; Walters, J.P.; Kleemann, H.M. A System Dynamics Model of Supply-Side Issues Influencing Beef Consumption in Nigeria. Sustainability 2020, 12, 3241. [Google Scholar] [CrossRef]
  53. Anaking, P.; Suryani, E. Beef supply chain analysis to improve availability and supply chain value using system dynamics methodology. IPTEK J. Proc. Ser. 2021, 6, 229–234. [Google Scholar] [CrossRef]
Figure 1. Cluster and supply chain map of meat product company. Source: Own production.
Systems 12 00503 g001
Figure 2. Frequency of urgent purchase orders for thermo-shrinkable bags. Source: Own production.
Systems 12 00503 g002
Figure 3. Procedure for developing graphical user interface with dynamic simulations. Source: Own production.
Systems 12 00503 g003
Figure 4. Flow diagram of the process under study. Source: Own production.
Systems 12 00503 g004
Figure 5. Causal diagram. Source: Own production.
Systems 12 00503 g005
Figure 6. First stage for 16 × 20 30 kg bags. Source: Own production.
Systems 12 00503 g006
Figure 7. Packaging and distribution model for three types of clients. Source: Own production.
Systems 12 00503 g007
Figure 8. Third stage. Investment in thermo-shrinkable 16 × 20 bags. Source: Own production.
Systems 12 00503 g008
Figure 9. Daily kilograms delivered in one month for the three types of clients (foreign clients 1 and 2 and local clients). Source: Own production.
Systems 12 00503 g009
Figure 10. Extreme proofing model. Source: Own production.
Systems 12 00503 g010
Figure 11. Model validation comparing real data against simulated data for the 16 × 20 thermo-shrinkable bags. Source: Own production.
Systems 12 00503 g011
Figure 12. Background screen. Source: Own production.
Systems 12 00503 g012
Figure 13. Bag graphics screen. Source: Own production.
Systems 12 00503 g013
Figure 14. Box chart screen. Source: Own production.
Systems 12 00503 g014
Figure 15. Investment data for 16 × 20 bags and boxes. Source: Own production.
Systems 12 00503 g015
Table 1. Record of urgent orders performed from September to October 2023.
No.Cause: Urgent Purchase OrderFrequency
1Non-compliance from the main provider regarding service or input in terms of time and form;9
2Urgent purchases are performed due to lack of material in the warehouse;12
3Local provider offers better conditions than the one already established (the order is urgently sent to the first provider without a comparison);3
4The selected provider does not offer quality services;6
5Services are generated without a purchase order;4
6The point-of-sales (POS) generates purchases without a purchase order; 3
7Urgent material purchases have to be performed.14
Source: Own production.
Table 2. Maximum and minimum markers and criteria with assigned values.
LC 16 × 20FC1 16 × 20FC2 16 × 2016 × 20 Bag Investment30 kg Box InvestmentTotal Income (USD)
MaxMaxMaxMinMinMax
0.150.150.150.10.20.25
Source: Own production using weights assigned by the company. Notes: LC = local clients; FC1 = foreign client type 1; FC2 = foreign client type 2.
Table 3. FUCA TOPSIS analyses for the best scenario selection.
ValuesRanking
FUCA
Ranking
TOPIS
WeightScenarios
7.70380.617016Current 1
11.0516120.483711Current 2
10.1012110.518319Current 3
8.405100.601121Current 4
7.40270.625224Current 5
8.00490.60587Current 6
9.359130.403607Pessimist 1
11.4517140.402921Pessimist 2
10.9015150.387706Pessimist 3
8.707160.359073Pessimist 4
12.7518170.326039Pessimist 5
10.513180.289069Pessimist 6
9.451040.671303Optimist 1
7.30110.688727Optimist 2
8.90830.675773Optimist 3
8.55620.680659Optimist 4
9.851150.670341Optimist 5
10.601460.630274Optimist 6
Source: Own production.
Disclaimer/Publisher’s Note: The statements, opinions and data contained in all publications are solely those of the individual author(s) and contributor(s) and not of MDPI and/or the editor(s). MDPI and/or the editor(s) disclaim responsibility for any injury to people or property resulting from any ideas, methods, instructions or products referred to in the content.