Article

Spatial Effects of Service Industry’s Heterogeneous Agglomeration on Industrial Structure Optimization: Evidence from China

Research Institute of Resource-Based Economic Transformation and Development, Shanxi University of Finance and Economics, Taiyuan 030006, China
*
Author to whom correspondence should be addressed.
Systems 2024, 12(3), 85; https://doi.org/10.3390/systems12030085
Submission received: 10 January 2024 / Revised: 29 February 2024 / Accepted: 3 March 2024 / Published: 6 March 2024

Abstract

:
Elucidating the impacts of service industry’s agglomeration on the optimization of industrial structures holds paramount significance in advancing urban economic growth and fostering the coordinated and sustainable development of city economies. This study leverages panel data encompassing 251 prefecture-level cities spanning from 2003 to 2019, employing a spatial Dubin model to scrutinize the influence of distinct types of service industry agglomeration on industrial structure optimization. The results show that specialized agglomeration within the service sector significantly inhibits the rationalization of industrial structures and their underlying fundamentals. Conversely, heightened levels of agglomeration in diversified service industries facilitate the rationalization of industrial structure, predominantly driven by regional spatial spillover effects. Further analysis reveals heterogeneity in service industry agglomeration across cities of varying sizes concerning industrial structure optimization, notably accentuating underutilized spatial spillover effects in smaller cities. In light of these insights, this paper advocates for cities to capitalize on the agglomeration and spillover effects between the service industry and other sectors, strategically selecting optimal service industry agglomeration modes to propel industrial structure optimization.

1. Introduction

Presently, China’s economy has transitioned from a phase of “structural acceleration” driven by industrialization to a phase of “structural deceleration” attributed to urbanization, thereby entering a “new normal” characterized by overlapping developmental stages [1,2]. Concurrently, the pursuit of energy conservation and emission reduction has spurred a transformation in China’s economic landscape, shifting from a reliance on energy-intensive and emission-intensive manufacturing to the ascendancy of knowledge-intensive and service-oriented industries [3,4]. With the continuous expansion of the service sector’s contribution to regional GDP, it is progressively supplanting traditional industries as the primary driver of urban economic development (such as the financial industry, accommodation and catering industry, and the education sector, among others). Consequently, the trajectory of city economic advancement hinges significantly upon the swift expansion of the service industry [5,6]. Distinguished by its reliance on local markets and robust stronger spatial agglomeration effects, the service sector has emerged as a focal point for numerous nations and regions seeking to bolster their economic landscapes through strategic agglomeration initiatives [7,8]. Aligned with the directives outlined in the frameworks in China, various regions are actively cultivating service industry agglomeration zones as a means to optimize industrial structures and bolster cities’ economic growth.
However, in practice, local administrations frequently emulate the industrial agglomeration zone development model without due consideration for local contexts, often leading to an inequitable industrial structure layout and impeding economic progress [9,10,11]. Industrial structure optimization entails the rationalization and upgrading of a city’s industrial frameworks by adjusting sectoral compositions, fostering the coordinated growth of diverse industries, attaining sophisticated city industrial structures, and establishing balanced proportional relationships to facilitate unified development, thereby fostering sustainable economic growth within the region [12].
Against the backdrop of decelerating economic growth and the ongoing urbanization transformation, the following imperative arises: how can cities select appropriate service industry development models, harness the full potential of service industry agglomeration effects, and revamp city development patterns? Furthermore, how can cities mitigate spatial element mismatches, galvanize the latent potential for industrial structure optimization, mitigate the “crowding effect” of service industry agglomeration, amplify the positive impact of industrial structure optimization on economic growth, and forestall “efficiency loss”? Thorough investigation into these queries bears profound theoretical implications for governments at all administrative tiers in crafting service industry development policies, advancing supply side structural reforms, and optimizing the spatial distribution of urban resources, thereby fortifying industrial chains’ resilience.
The rapid advancement of urbanization has intricately interwoven the industrial landscape of cities. Within scholarly discourse, the concept of industrial agglomeration, particularly within the service sector, has become a focal point. This section aims to summarize and organize existing research literature from three perspectives: the measurement of service industry agglomeration, its characteristics and evolutionary trends, and the factors influencing service industry agglomeration. (1) Measurement Service Industry Agglomeration: Measurement methods for industrial agglomeration, based on diverse perspectives, primarily fall into two categories. The first type assesses the overall level of industrial agglomeration, employing metrics such as the Herfindahl–Hirschman Index (HHI), Spatial Gini Coefficient (G), Industrial Concentration (CR), EG Index, and Location Entropy (LG) [13,14]. The second type is based on distance metrics and is exemplified by the density-based index (DBI) [15]. (2) Impact of Service Industry Agglomeration: Existing research underscores the multifaceted impact of industrial agglomeration, especially within the service sector, on various aspects, including land use patterns, regional innovation, and tax disparities. Industrial agglomeration actively contributes to the optimization of land use patterns [16], as indicated by empirical data from China. Specifically, industrial specialization agglomeration exhibits a positive influence on regional innovation, while industrial diversification agglomeration shows less significant effects [17]. Furthermore, industrial agglomeration plays a pivotal role in mitigating the impacts of tax disparities on corporate migration, particularly in regions characterized by lower financial market efficiency [18].
The optimization of industrial structures stands as a prerequisite for the economic development of cities, a notion widely endorsed by scholars who recognize its pivotal role in fostering economic growth, prosperity, and sustainability [19]. Industrial structure rationalization entails enhancing the capacity for inter-industry and intra-industry conversions [20], while industrial structure upgrading involves a dynamic process aimed at improving overall efficiency and quality, progressing from lower to higher levels [21]. However, prevailing research predominantly centers on the agglomeration of productive service industries, leaving a dearth of literature on the impact of service industry agglomeration on industrial structure adjustment and resulting in inconclusive findings. Industrial agglomeration exerts influence on industrial structure optimization through various mechanisms, including input–output linkages, labor pools, and knowledge spillovers [22]. Firstly, service industry agglomeration facilitates optimal resource utilization by fostering the sharing of financial capital, professional talent, and knowledge inputs [23]—through input and output linkages—thereby reducing waste and redundant construction and promoting industrial structure optimization.
Secondly, service industry agglomeration enhances innovation capacity, as companies within agglomerated regions collaborate, facilitating exchanges of talent and technology and driving innovative activities, thus advancing the industrial structure towards higher technological sophistication and added value [24]. Thirdly, service industry agglomeration generates scale effects by clustering companies in the same pool, thereby reducing production costs, purchasing costs, and enhancing market competitiveness [25], all of which contribute to industrial structure optimization. Finally, service industry agglomeration fosters the gathering and training of talent, as companies within agglomerated areas form a talent market and training system [26], attracting a greater influx of professional talent, technical workers, and R&D personnel, thereby providing robust support for industrial structure optimization.
Currently, the academic community lacks a comprehensive theoretical framework concerning the impact of service industry agglomeration on urban industrial structure optimization. Given the diverse organizational structures of service industry agglomerations, their external effects may vary, leading to distinct impacts on industrial structure optimization. Thus, this paper initiates an exploration of the interactive relationship between service industry agglomeration and industrial structure optimization. Guided by the objective of optimizing industrial structures and drawing on the theory of agglomeration externalities, this paper integrates existing research [27] to examine the impact mechanisms and effects of different types of service industry agglomerations on industrial structure optimization.
The notable contributions of this paper are twofold: Firstly, it categorizes service industry agglomeration into specialized agglomeration and diversified agglomeration, elucidating the impact mechanisms of each type on the rationalization and sophistication of industrial structure in prefecture-level cities. Secondly, by considering spatial spillover effects, it employs the spatial Durbin model with panel data from 251 Chinese prefecture-level cities spanning 2003–2019 to empirically test the spatial spillover effects of heterogeneous service industry agglomerations on urban industrial structure optimization.
The paper’s structure is organized as follows: The second section analyzes theoretical mechanisms and proposes research hypotheses. The third section outlines model construction, variable selection, and data sources. The fourth section presents an analysis of empirical results. The fifth section presents a discussion, followed by the conclusion and suggestions.

2. Mechanism Analysis and Research Hypotheses

2.1. Specialization Agglomeration in the Service Industry and Industrial Structure Optimization

Specialization agglomeration within the service industry refers to the spatial concentration of the same type of service industry [28]. Marshall identified three sources driving industrial agglomeration: input–output linkages, labor pools, and knowledge and technological spillovers [29]. At the micro level, agglomeration economies operate through sharing, matching, and learning mechanisms [30]. Specialization agglomeration in the service industry facilitates the realization of economies of scale for enterprises and the spillover effects of knowledge and technology, thus promoting the rationalization and upgrading of local and neighboring city industrial structures.
However, specialization agglomeration in the service sector entails negative externalities. On one hand, due to factors like technology and institutional constraints, local governments may neglect technological advancement and market innovation, leading to industrial path dependence [31], inhibiting industrial structure rationalization and upgrading. On the other hand, as specialization agglomeration increases, it brings about congestion effects such as traffic congestion, rising housing prices, and environmental degradation, alongside phenomena of resource allocation and economic structure mismatch [32], further impeding industrial structure rationalization and upgrading.
When congestion effects outweigh productivity gains from spillover effects [33,34], the positive externalities of agglomeration may not sufficiently offset these adverse effects, hindering urban industrial transformation and economic development. Moreover, compared to manufacturing, the negative externalities of specialization agglomeration in the service sector are more pronounced. During industry decline, high levels of specialization agglomeration may lock cities into value chains dominated by resource development and processing, while enterprises with lower levels of agglomeration have greater flexibility in adapting to changing production activities [35]. This tendency to transfer polluting industries to neighboring cities is detrimental to the rationalization of industrial structures in neighboring cities, further exacerbating competitive pressures between cities. Based on these observations, this paper proposes the following hypotheses:
Hypothesis 1a. 
Specialization agglomeration in the service industry suppresses the rationalization of the industrial structure in the local city.
Hypothesis 1b. 
Specialization agglomeration in the service industry poses certain obstacles to the rationalization of the industrial structure in neighboring cities.
Hypothesis 2a. 
Specialization agglomeration in the service industry supports the upgrading of the industrial structure in the local city.
Hypothesis 2b. 
Specialization agglomeration in the service industry hinders the upgrading of the industrial structure in neighboring cities.

2.2. Diversification Agglomeration in the Service Industry and Optimization of Industrial Structure

Diversification agglomeration in the service industry involves the spatial distribution of different but interrelated service sectors in the same area [36]. According to Jacobs’ theory [37], diversification agglomeration promotes technological innovation and industrial structure optimization more effectively than specialization agglomeration. Diversification agglomeration generates economies of scale and knowledge and technology spillover effects [38], thereby enhancing the rationalization and sophistication of industrial structures in local and adjacent cities.
Firstly, diversification agglomeration expands market demand, diversifies service sub-industries, and enlarges the economic scale of the service industry. By aligning the production factors between service sub-industries, the specialization in the service industry extends the industrial value chain towards higher precision and enhances the sophistication level of local industrial structures. Moreover, diversification agglomeration promotes technological progress and reduces transaction costs through price and differentiation competition effects [39], further enhancing the sophistication level of local industrial structures.
Secondly, diversification agglomeration facilitates factor mobility, resource reorganization, and knowledge exchange, strengthening the economic and technological links between industries and fostering collaboration along industrial chains [40]. It enhances input–output linkages, fosters contractual relationships between industries, and improves interdepartmental collaboration efficiency [41], promoting industrial structure rationalization in local and neighboring cities.
Lastly, diversification agglomeration attracts talent, facilitating knowledge integration and technological innovation, thereby advancing industrial structure rationalization and sophistication in local and adjacent cities. However, reaching a critical level of diversification agglomeration may induce congestion effects. Unlike specialization agglomeration, diversification agglomeration experiences weaker competition intensity and congestion effects in intermediate product markets as it utilizes different intermediate inputs [42,43]. Based on these observations, this paper proposes the following hypotheses:
Hypothesis 3. 
Diversification agglomeration in the service industry promotes the rationalization of industrial structures in the local city and adjacent cities.
Hypothesis 4. 
Diversification agglomeration in the service industry enhances the sophistication of industrial structures in the local city and adjacent cities.

3. Model Construction, Variable Selection, and Data Sources

3.1. Econometric Model Construction

The spatial Durbin model (SDM) offers a comprehensive approach for analyzing spatial correlation among explained variables in neighboring areas and examining spatial spillover effects of explanatory variables in adjacent regions [44]. By incorporating these elements, the SDM provides a more robust and scientifically grounded method for assessing global spatial spillover effects. Hence, this paper adopts the spatial Durbin model to construct the following framework:
S T R U i t = ρ W S T R U i t + β X + δ W X + μ i t X = L Q i j ( T V i j ) + l r e i j + l f d r i j + l exp r i j + l p f s e t i j + l h u m i j + l p r o a d i j + l i n o s u i j
In Formula (1), i represents the city, t represents the year, S T R U represents the relevant indicators reflecting the level of industrial structure optimization, W X represents the impact of city explanatory variables on the explained variables in neighboring cities, and μ i t represents the random error term. W is the spatial weight matrix, which adopts the economic distance spatial weight matrix, set according to the reciprocal of the per capita GDP difference between two cities. Since the development of industries is closely related to the level of economic development, the economic distance spatial weight matrix is more realistic when discussing the spatial spillover effects of service industry agglomeration and industrial structure optimization.

3.2. Variable Selection

3.2.1. Dependent Variables

Industrial Structure Rationalization ( R S ). This paper follows the theory of resource allocation, drawing on existing research [45], and uses the coupling degree of factor input and output structure to measure the level of industrial structure rationalization. The calculation formula is as follows:
R S = i = 1 n Y i / Y ln Y i / Y / L i / L
In Formula (2), Y represents output, L denotes labor input, i refers to the i industrial sector, and n is the total number of industrial sectors. When the R S value is 0, Y i / Y = L i / L indicates that the productivity levels among various sectors are the same, and the economy is in a balanced state. At this point, the industrial structure is rational. The further R S deviates from 0 the higher the degree of irrationality of the industrial structure, making it a negative indicator.
Industrial Structure Upgrading ( O S ). In practice, this is manifested as a country or region’s industrial structure transitioning from being dominated by the primary industry to the secondary and tertiary industries. This includes shifting the focus of industrial development from low-end to high-end industries, transforming the industrial structure from labor-intensive to capital and technology-intensive, and changing the product form from predominantly low-end to predominantly high-end [46]. This is a dynamic process of continuous optimization of the industrial proportion relationships. In empirical analysis, it is mainly measured by the product of industrial proportion relationships, the proportion of partial industrial output, and labor productivity. This paper refers to existing studies and adopts an improved weighted multidimensional vector angle method to measure the level of industrial structure upgrading [47]. First, industries are ranked from low to high levels based on the three-sector division standard, and a three-dimensional spatial vector e t = ( e t 1 , e t 2 , e t 3 ) of the industrial structure for period ( t ) is constructed using the proportion of each industry’s value added to GDP. Next, assuming there is a theoretical lower limit to the level of industrial structure upgrading, where the economy is entirely based on the primary sector, the three-dimensional spatial vector of the industrial structure e 0 in this scenario is taken as the only constant reference vector, e 0 1 , e 0 2 , e 0 3 = ( 1 , 0 , 0 ) . Finally, the angle formed by the vector changes in i-th is calculated. Suppose there is a new industrial structure vector e 1 e 0 1 , e t i , e 0 3 , where, except for the value of the i component in e 1 being the same as the i component in e t , the rest are consistent with e 0 , and then the angle θ 1 i between vectors e 1 and e 0 can be understood as the vector angle formed only by the change in the i-th industry. Where the vector angle of period t is θ 1 i :
θ 1 i = arccos 1 3 e t i e 0 i 1 3 e t i 2 1 3 e 0 i 2
Similarly, taking e t as the reference vector, a new vector e ˜ t = ( e t 1 , e 0 i , e t 3 ) is constructed. The angle θ 2 i between vectors e ˜ t and e t can also be understood as the vector angle formed by the change in the i industry. Here, the vector angle for the t period is θ 2 i :
θ 2 i = arccos 1 3 e t i e ˜ t i 1 3 e t i 2 1 3 e ˜ t i 2
To enhance computational accuracy, the geometric mean of the two is taken, resulting in the vector angle formed by the change in the i industry being θ :
θ i = θ 1 i θ 2 i
Ultimately, the level of industrial structure upgrading can be represented as follows:
O S = i = 1 3 i × θ i
A higher value of O S indicates a higher level of industrial structure upgrading, and vice versa.

3.2.2. Core Explanatory Variables

Specialization Agglomeration of the Service Industry ( L Q ). To reflect the agglomeration level of various cities in the segmented industries of the service sector, this paper uses the specialization index constructed by Ezcurra [48] for measurement, with the calculation formula as follows:
L Q i j = i = 1 n L i j L j L i k j L k j
In Formula (7), L i j / L j represents the proportion of employees in the service sector’s sub-industry i in the city to the total number of employees in the service sector, and L i k j / L k j represents the proportion of employees in the sub-industry j of the service sector in other cities.
For the diversity agglomeration of the service industry ( T V ), this paper categorizes the service industry into three major types: productive, consumer, and public services. Drawing on existing research [49,50], this paper uses the entropy method to measure the level of diversified agglomeration in the service industry with the following formula:
T V = j n p j ln 1 / p j
Here, T V represents the level of diversity in the service sector; the larger it is, the higher the level of diversified agglomeration in the service industry. j refers to the sub-industries of the service sector, n represents the number of all sub-industries in the service sector, and p j denotes the proportion of employees in each sub-industry of the service sector.

3.2.3. Control Variables

Resource Endowment ( l r e ). According to the theory of comparative advantage, cities will prioritize the development of industries in which they have a comparative advantage, based on the abundance of their natural resources. This largely determines the industrial structure of the region. This paper uses the ratio of mining industry employees to sum up the population at the end of the year to characterize city resource endowment.
Level of Openness to Foreign Investment ( l f d r ). Foreign investment brings certain technological spillover effects, and the scale at which a city utilizes foreign capital can significantly influence the development of its local service industry. This paper uses the ratio of actual foreign investment utilized to the city gross domestic product (GDP) to reflect the city’s level of openness to foreign investment.
Fixed Asset Investment ( l p f s e t ). The scale of fixed asset investment plays an important role in the development of a city’s industry. The scale and direction of investment directly affect the direction of local industrial development. This paper uses the ratio of city’s fixed asset investment to city GDP to reflect the scale of the city’s fixed asset investment.
Human Capital ( l h u m ). Currently, knowledge and technology-intensive industries occupy an increasingly important position in the service industry. The quality of human capital significantly impacts the development of the city’s service industry. Considering the current average education level in China and the available statistical data, this paper uses the ratio of the number of students enrolled in regular higher education institutions to the city’s total end-year population to reflect human capital.
Infrastructure Development ( l p r o a d ). Convenient infrastructure facilitates the flow of technology, talent, and capital between cities, thereby promoting cross-industry and cross-city knowledge spillover, influencing the direction of city industrial development, and enhancing the optimization level of urban industrial structures. This paper uses the per capita road area in the city to reflect the level of infrastructure development.
Technological Innovation ( l i n o s u ). Technological innovation is an endogenous driving force for optimizing industrial structure, enabling resources to shift from low-efficiency sectors to high-efficiency production departments, optimizing resource allocation, and thus driving the optimization and upgrading of city industrial structures. However, its inherent characteristics of high risk, high reward, spillover effects, and uncertainty also make the impacts of technological innovation on industrial structure optimization uncertain. This paper uses the China Innovation and Entrepreneurship City Index [51] to measure the level of city technological innovation.

3.3. Data Source

Considering the availability of data, this paper adopts the prefecture-level city as the unit of analysis. Prefecture-level cities, compared to provinces, offer a smaller scale with a larger sample size, and, compared to counties, provide a more comprehensive set of statistical indicators at the urban scale. This paper excludes a number of samples with significant data gaps from all Chinese cities and ultimately selects 251 prefecture-level cities as the subjects of study, with the research period defined from 2003 to 2019. The data involved in this paper are all derived from the ‘China City Statistical Yearbook’ (2004–2020), the statistical yearbooks of various cities over the years, the China Regional Economic Database, and the EPS database. For some missing data, interpolation is used to fill in the gaps, and all price-related indicators are converted into comparable prices for the year 2000.

4. Results

4.1. Spatial Characteristics of Service Industry Agglomeration

To characterize the spatial features of the service industry’s specialization and diversification agglomeration levels, the spatial distribution of the years 2003 and 2019 was selected for analysis. As depicted in Figure 1, which illustrates the spatial characteristics of service industry specialization agglomeration, there is a significant heterogeneity and imbalance in the spatial distribution of specialized agglomeration in China’s service industry. Compared to 2003, the level of specialization agglomeration in most cities has improved by 2019. In 2003, the cities with the highest and lowest degree of specialization agglomeration were Xinyu and Fuzhou, respectively. The per capita GDP for Fuzhou and Xinyu was CNY 17,700 and CNY 9900, respectively, while the population densities were 505 people/km2 and 347 people/km2, respectively. By 2019, Kunming and Lu’an emerged as the cities with the highest and lowest specialization agglomeration. The approximate per capita GDP for Kunming and Lu’an was CNY 79,800 and CNY 36,600, respectively. The population densities for these cities were 322 people/km2 and 285 people/km2, respectively.
Similarly, Figure 1, which represents the spatial characteristics of diversified agglomeration in the service industry, shows that there are also significant differences and imbalances in the spatial distribution of diversified agglomeration. The level of diversified agglomeration in the service industry in most cities has also seen an enhancement by 2019 compared to 2003. In 2003, Guangzhou and Lincang were identified as the cities with the highest and lowest levels of diversity agglomeration, respectively. The per capita GDP for Guangzhou and Lincang was approximately CNY 38,600 and CNY 3300, respectively, with population densities of 1308.7 people/km2 and 88.7 people/km2, respectively. By 2019, Guangzhou maintained its position as the city with the highest diversity agglomeration, while Hezhou was noted as having the lowest. The per capita GDP for Guangzhou and Hezhou was approximately 131,400 yuan and 33,700 yuan, respectively, with population densities of 2529.8 people/km2 and 177.4 people/km2, respectively. A preliminary analysis of these data suggests that cities with less developed economies and sparser populations tend to exhibit higher degrees of specialization agglomeration. Conversely, cities with more advanced economies and denser populations are characterized by a higher degree of diversity agglomeration.

4.2. Spatial Autocorrelation Test

By analyzing the mechanism through which service industry agglomeration influences the optimization of industrial structure, it was found that the agglomeration of the service industry exhibits spillover effects. In light of the potential for spatial correlation, it is necessary to examine whether there is spatial dependency in the sample data before selecting the econometric model. Spatial autocorrelation tests reflect the correlation and degree of correlation of variables in space, mainly including global spatial autocorrelation tests and local spatial autocorrelation tests. Before examining the spatial correlation of variables, an economic distance spatial weight matrix is used to analyze the spatial correlation of industrial structure optimization, with a justification for its selection based on the study’s objectives and data characteristics.
(1)
Global Spatial Autocorrelation Test
The global autocorrelation test examines the overall distribution of data in spatial extent. This paper employs global Moran’s I index to perform a global autocorrelation test on the optimization of industrial structure and the agglomeration of the service industry.
I = n i = 1 n j = 1 n w i j ( x i x ¯ ) ( x j x ¯ ) i = 1 n j = 1 n w i j i = 1 n ( x i x ¯ ) 2
In the formula, n represents the number of sample cities, and w i j is the spatial weight matrix. x i and x ¯ respectively represent the observed and average values of urban industrial structure optimization (service industry agglomeration). The index calculation results fall within the [−1, 1] interval, where values greater than 0 and less than 0 indicate positive and negative spatial correlations, respectively. A value of 0 indicates no correlation. The larger the absolute value, the higher the degree of spatial agglomeration.
Table 1 shows that, during 2003–2019, the global Moran’s index for both industrial structure optimization and service industry agglomeration is significantly greater than 0 at the 1% significance level. This indicates that there is a significant positive spatial correlation between the industrial structure optimization index and the level of service industry agglomeration among the study samples. In other words, regions with higher levels of industrial structure optimization and service industry agglomeration tend to be spatially adjacent, and this phenomenon is also observed among regions with lower levels.
(2)
Local spatial autocorrelation test
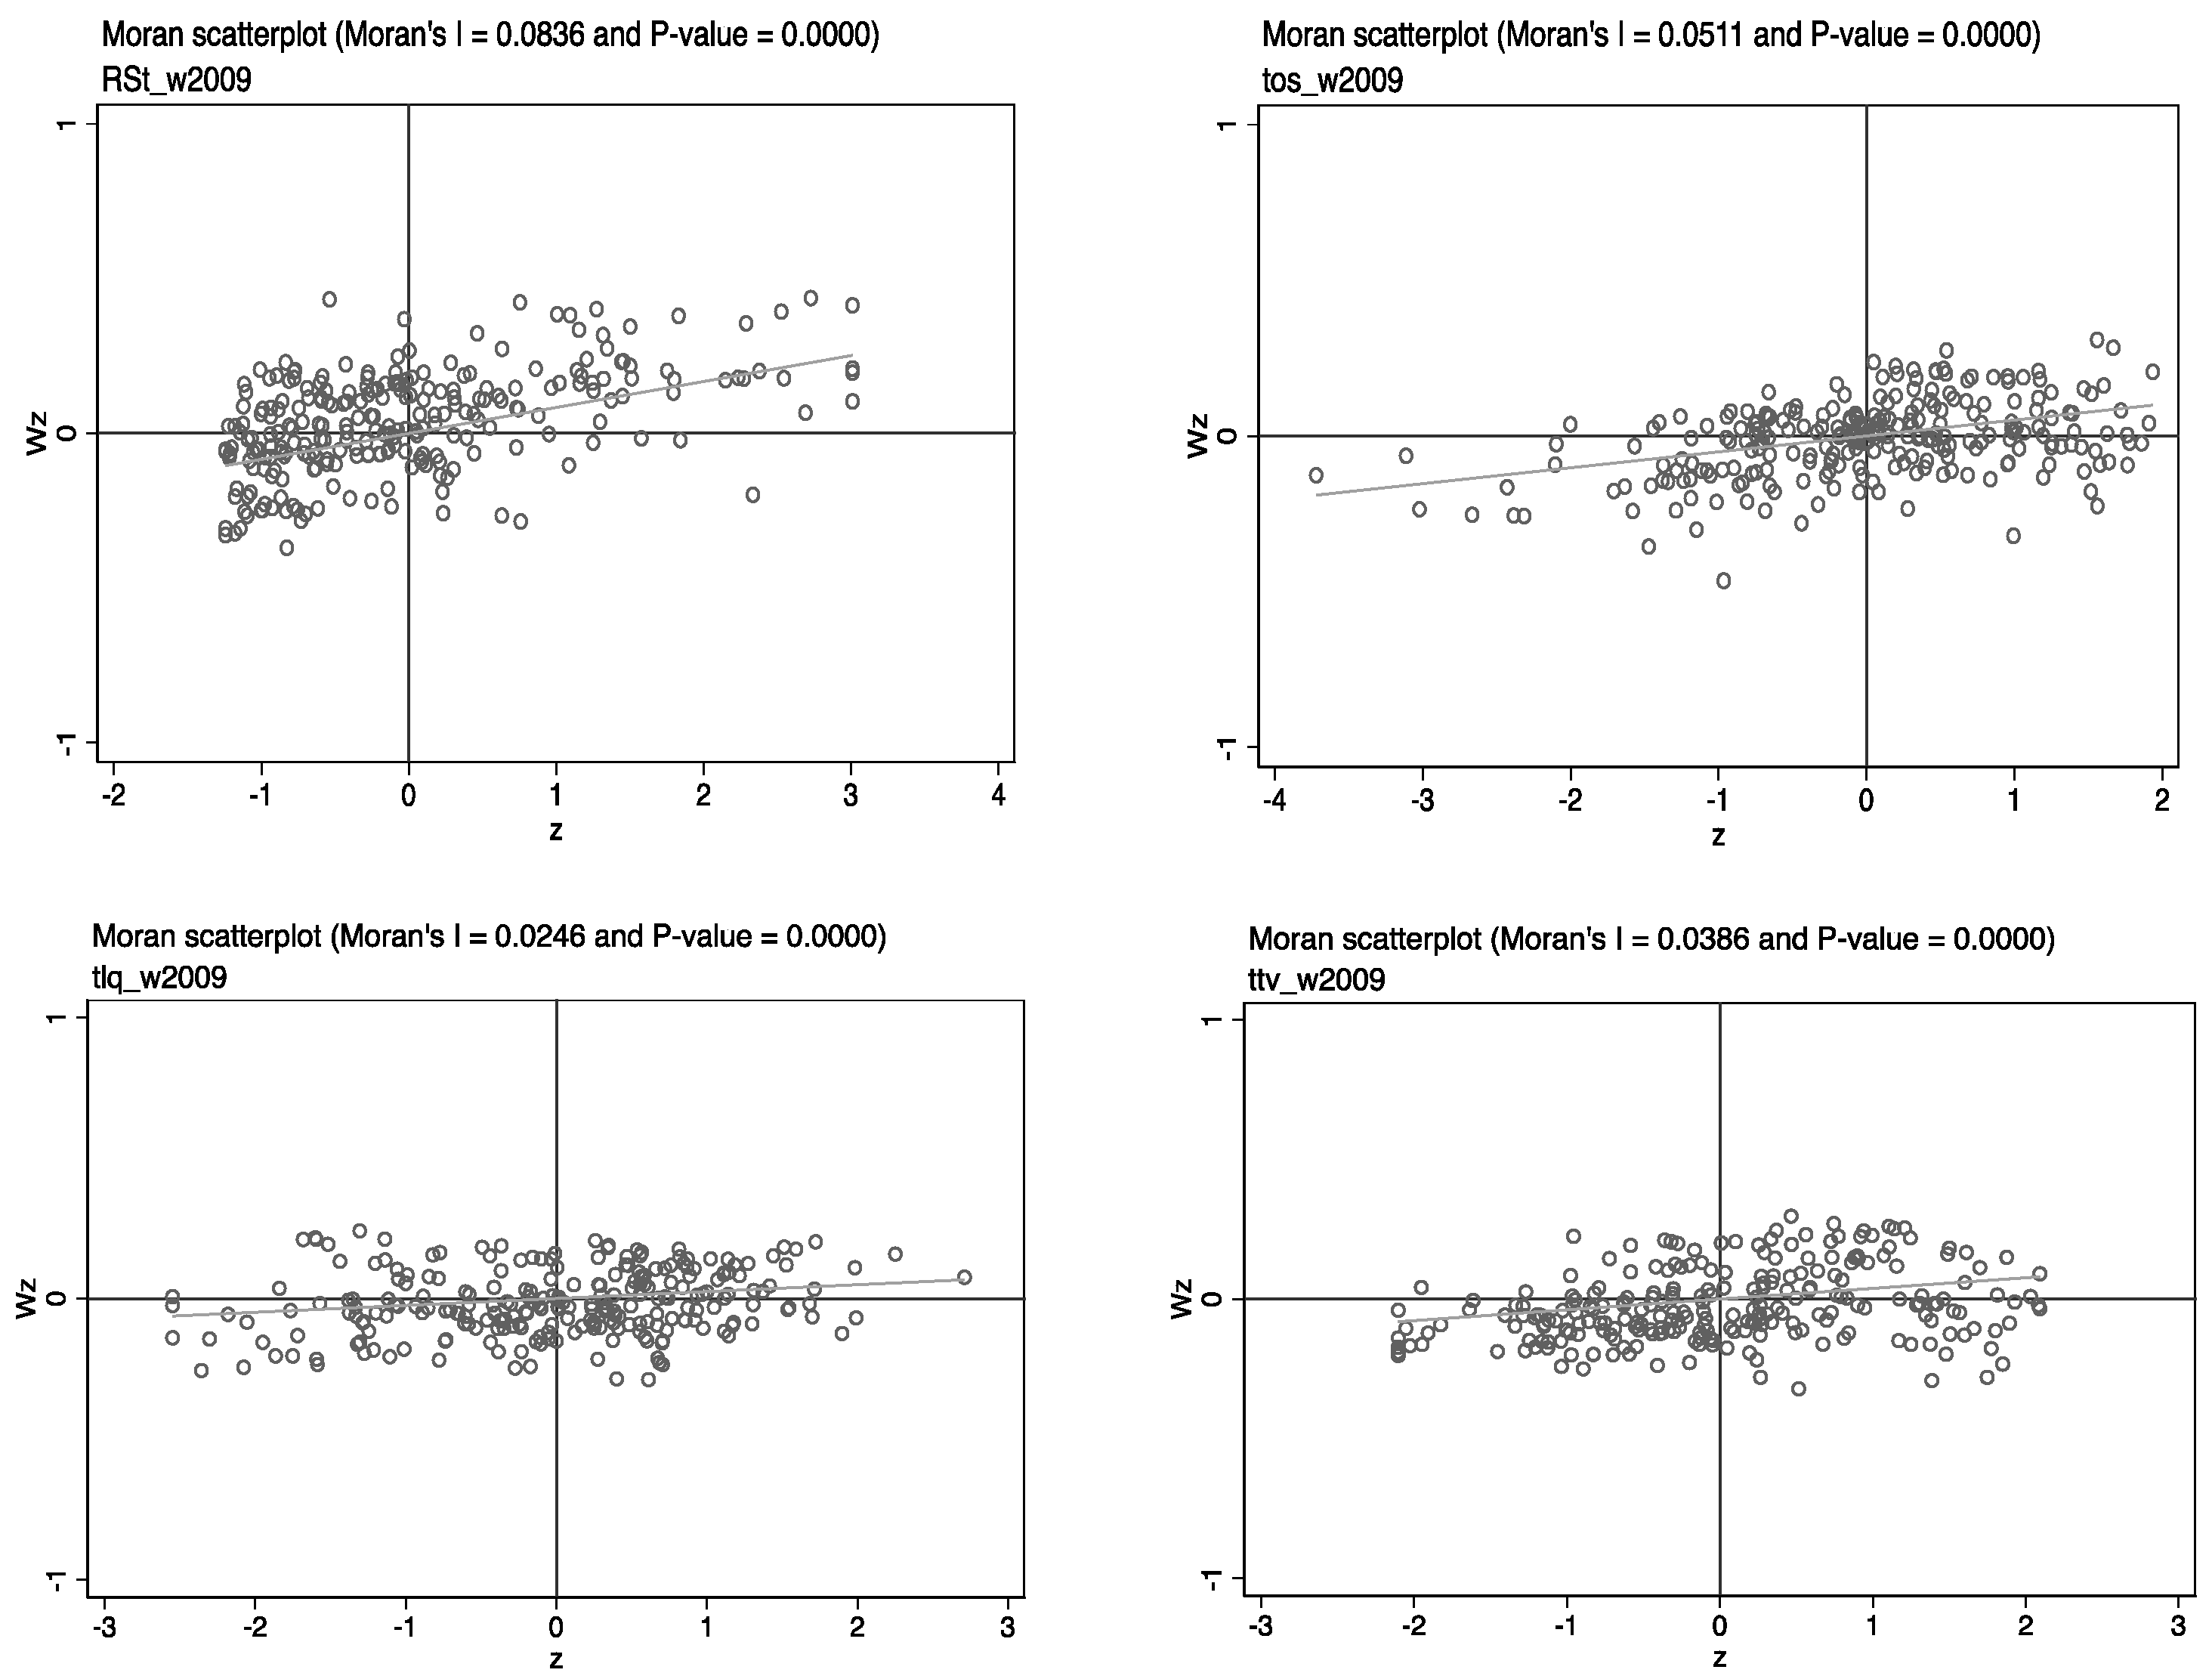
The local autocorrelation test examines the spatial correlation between research units. To further analyze the spatial autocorrelation of industrial structure optimization at the local urban level, this paper uses the scatter plot of local Moran’s I index to examine whether the optimization of urban industrial structure is spatially clustered.
I i = Z i j i n w i j Z j
In the above formula, Z i and Z j represent the standardized observations of urban industrial structure optimization, and w i j is the standardized inverse distance spatial weight matrix. A local Moran’s index greater than 0 indicates a positive spatial correlation between research units and vice versa for a negative spatial correlation.
The local Moran’s index scatter plot describes the correlation between related variables and their spatial lag vectors. As shown in Figure 2, most cities are distributed in the first and third quadrants. Cities in the first quadrant have relatively higher levels of industrial structure optimization (service industry aggregation) both in the city itself and in neighboring cities, belonging to the “high-high adjacent” category; cities in the third quadrant have relatively lower levels of industrial structure optimization (service industry aggregation), belonging to the “low-low adjacent” category. The local Moran’s index scatter plot shows that the optimization of industrial structure and service industry aggregation among prefecture-level cities in the country are mainly spatially clustered. There is a significant spatial autocorrelation between cities, which is consistent with the results of the global spatial autocorrelation test, further verifying the spatial correlation in the optimization of industrial structure and service industry aggregation among prefecture-level cities in China. It is necessary to consider spatial factors in specific analyses.

4.3. Parameter Test

Before model estimation, it is first necessary to conduct LM and Robust LM tests to determine whether the spatial correlation in the model exists in the form of spatial error terms or spatial lag terms. Subsequently, Wald and LR tests should be carried out to verify whether the SPDM can be simplified to SPLM and SPEM.
From Table 2, it can be seen that, within the framework of the economic distance spatial weight matrix, both Robust LM lag (error) tests pass the 0.01 significance test. This outcome underscores the presence of spatial dependence in the agglomeration of the service industry relative to industrial structure optimization. Moreover, both the Wald and LR statistics reject the null hypothesis at the 1% level, indicating that the SPDM effect of service industry agglomeration on industrial structure optimization cannot be simplified to SPLM and SPEM. Therefore, to ensure the consistency of the estimation results, this paper chooses the fixed-effects SPDM for estimation and analysis.
LeSage and Pace (2009) suggest that when the estimated coefficient of the spatially lagged explanatory variable is significantly non-zero, using a spatial Durbin model to measure its spatial spillover effect may introduce systematic bias [52]. Specifically, alterations in the explanatory variable within a particular region exert influence not only on the dependent variable locally but also on the explained variable in neighboring regions, thereby exerting the explained variable in the original region. Hence, by using the spatial weight matrix, further partial differential decomposition of the estimated coefficients of the explanatory variables is conducted, yielding the direct and indirect effects of service industry agglomeration.

4.4. Estimation Results and Analysis

Overall, the benchmark regression results (Table 3) show that the explained variables, whether in terms of rationalization or industrial structure upgrading, are significantly positive at the 1% level, indicating that the optimization and upgrading of a city’s industrial structure are not only constrained by local factors but also influenced by the industrial structure optimization level of neighboring cities. In terms of industrial structure rationalization regression results, the regression coefficient rho is significantly positive, suggesting that the rationalization development of the local industrial structure has an adverse spatial impact on neighboring cities. This could be due to low-end service industries being relocated to other cities as a result of city market competition when local industrial structure rationalization is improving, thus creating negative externalities for other regions. Regarding the regression results for industrial structure upgrading, the regression coefficient rho is significantly positive, indicating that the development of industrial structure upgrading in a local area positively influences neighboring cities, showing a positive spatial spillover effect of China’s urban industrial structure upgrading regionally.
Table 3 shows that, in the overall effect, the specialization aggregation of the service industry (LQ) is significantly negatively correlated with both industrial structure rationalization (RS) and industrial structure upgrading (OS). This means that an increase in the level of service industry specialization aggregation not only inhibits the development of industrial structure rationalization but also hinders the industrial structure upgrading.
In terms of direct and indirect effects, the spatial spillover effect of service industry specialization aggregation is much greater than its direct effect. The direct and indirect effects of service industry specialization aggregation on city industrial structure rationalization are significantly positive, whereas the indirect effect on industrial structure upgrading is significantly negative, and the direct effect is not significant. Based on the decomposition of effects, in terms of industrial structure rationalization regression, the inhibiting impact (“neighbor effect”) of local service industry specialization aggregation on the rationalization development of neighboring cities is much greater than its obstructing impact (“local effect”) on local industrial structure rationalization. Speaking of “local effect”, for every 1% increase in service industry specialization aggregation level, the degree of industrial structure rationalization in the area decreases by 0.0664%; for the “neighbor effect”, it decreases by 5.0058%. Hence, the findings confirm hypothesis H1a and hypothesis H1b.
In terms of the regression results for industrial structure upgrading, for every 1% increase in the level of service industry specialization aggregation, the degree of industrial structure upgrading in neighboring cities decreases by 0.1748%, indicating that the development of city service industry specialization aggregation significantly hinders the industrial structure upgrading in neighboring cities. These findings hence confirm hypothesis H2a and hypothesis H2b.
As indicated in Table 4, within the total effect, the diversification of service industry agglomeration (TV) is significantly positively correlated with both the rationalization (RS) and upgrading (OS) of industrial structures. This implies that the enhancement of service industry diversification not only promotes the rationalization of the industrial structures but also drives their upgrading. In terms of direct and indirect effects, the spatial spillover effects of service industry diversification agglomerations are much greater than their direct effects. The direct and indirect effects of service industry diversification agglomerations on cities’ industrial structure rationalization are significantly negative, while their effects on cities’ industrial structure upgrading are significantly positive.
From the regression results on industrial structure rationalization, it is evident that for every 1% increase in the level of service industry diversification agglomeration, the degree of industrial structure rationalization in that city will increase by 0.0434%; in neighboring cities, it will rise by 3.0739%. This demonstrates that the “neighbor effect” of local service industry diversification agglomeration is much greater than the “local effect”. The timely shift from specialized to diversified agglomeration in the service industry not only promotes the rationalization of the local industrial structure to a certain extent but also facilitates complementary and differentiated knowledge creation, accumulation, and diffusion through forms like “knowledge spillover” and “collective learning”, thereby driving the industrial structures rationalization in neighboring cities. These findings hence confirm hypothesis H3.
Regarding the regression results on industrial structure rationalization, for each 1% increase in the level of service industry diversification agglomeration, the degree of industrial structure upgrading in the region will increase by 0.0053%; in neighboring cities, it will rise by 0.6304%. This indicates that the externalities of diversified service industry agglomeration are not limited to a single city. Surrounding cities can also enjoy the benefits brought by agglomeration, gaining greater division of labor and scale benefits, and significantly contributing to industrial structure upgrading in both the local and neighboring cities. Therefore, hypothesis H4 is partially confirmed.

4.5. Robustness Test

To further verify the accuracy of the above regression results, and considering the number of samples and data availability, this paper uses the method of replacing the dependent variable for robustness testing. Specifically, based on the structural deviation index, the improved Thiel index [53,54] is used to measure industrial structure rationalization (LH). Moreover, according to the Perroux–Clark theory, the level of industrial structure upgrading (LG) is measured. The original spatial Durbin model is then re-estimated, with the results shown in Table 5 and Table 6.
L H = i = 1 3 Y i / Y × Y i / Y / L i / L 1 2
L G = i = 1 3 i × p i
Among them, LH is a negative indicator: the closer the value is to 0, the higher industrial structure rationalization. LG is a positive indicator: the greater the value, the higher industrial structure upgrading. Pi is the proportion of the value added of the i-th industry in GDP.
As can be seen from Table 5 and Table 6, after changing the index of the dependent variable, the regression results of the core explanatory variables on urban industrial structure optimization are basically consistent with the results of the baseline regression in the previous text. Although the significance of some variables has changed, it does not affect the basic judgment on the main research question of this paper.

4.6. Heterogeneity Analysis

Drawing on existing research, this paper posits that there are differences in the agglomeration of productive service industries in cities of different sizes, and assumes heterogeneity in service industry agglomeration. To reveal the heterogeneous effects of service industry agglomeration on industrial structure optimization in cities of different sizes, this study conducts a heterogeneity analysis. The criteria for classifying city size reference the standards set by the State Council of China in November 2014, which combines megacities and large cities into one category, while retaining medium and small cities. The regression results are shown in Table 7 and Table 8.
As shown in Table 7, in terms of rationalizing industrial structure, specialized agglomeration in small cities helps promote industrial structure rationalization in those cities, but this is not significant in cities of other sizes. Specialized agglomeration in medium cities promotes the rationalization of industrial structure in neighboring cities. In terms of industrial structure upgrading, specialized agglomeration in medium and small cities inhibits this upgrading, while the impact in large cities is not significant. Specialized agglomeration in all three types of cities inhibits the industrial structure upgrading in neighboring cities. This implies that small cities are in a development phase of service industry agglomeration, with a relatively singular industrial structure, and specialized agglomeration promotes industry structure rationalization.
Table 8 shows that in terms of rationalizing industrial structure, diversified agglomeration in large cities promotes industrial structure rationalization locally; in medium and small cities, it significantly inhibits the rationalization of local industrial structure. From the perspective of spillover effects, diversified agglomeration in large and medium cities significantly inhibits industrial structure rationalization in neighboring cities, while the spillover effect in small cities is not significant. In terms of industrial structure upgrading, diversified agglomeration in all three types of cities significantly promotes the rationalization of local industrial structures. In terms of spatial spillover effects, diversified agglomeration in large and medium cities significantly promotes industrial structure upgrading in neighboring cities, while the spillover effect in small cities is not significant. This implies that the impact of diversified service industry agglomeration in small cities is only local and has not yet produced a spatial spillover effect.

5. Discussion

This study amalgamates the industrial agglomeration theory with empirical analysis to delve into the profound impacts of service industry agglomeration on industrial structure optimization. The findings underscore that specialized agglomeration within the service industry has hindered the rationalization of industrial structure both locally and in adjacent areas. This inhibition can be attributed to the persistence of a relatively low overall industrial level despite the rapid growth of China’s service sector, which has been spurred by the government’s “cage-releasing and bird-swapping” policy since 2003. Over-specialization in low-end service industries has led to significant spillover effects on the development of other local industries, impeding the positive role of service industry agglomeration’s externalities in promoting industrial rationalization [34,55]. Additionally, excessive agglomeration of low-end services not only constrains the export space of the local product market but also triggers enterprises to engage in low-price competition due to factors such as competition for production resources between regions, further hindering industrial structure rationalization in neighboring areas [56].
Furthermore, specialized agglomeration of the service industry also stifles the high-end development of industrial structures in adjacent areas. This phenomenon arises from the tendency of governments to relocate industries with high pollution, emissions, and low efficiency to neighboring regions during the development and adjustment of specialized service industry agglomerations [57,58].
In contrast, diversified agglomeration within the service industry fosters positive impacts on both the rationalization and high-end development of industrial structures. The transition from specialized to diversified agglomeration not only facilitates the rationalization of local industrial structures but also stimulates complementary and differentiated knowledge creation, accumulation, and diffusion through mechanisms such as knowledge spillover and collective learning, thereby propelling the rational development of industrial structures in adjacent areas. Moreover, as the level of diversified agglomeration within the service industry rises, the proportion of high-end service sectors increases, and the scale economic and knowledge spillover effects become more pronounced, further driving the high-end development of industrial structures [32,59].

6. Research Conclusions

6.1. Conclusions

This paper systematically expounds on the impact mechanisms of service industry specialization and diversification agglomeration on industrial structure optimization based on the theory of agglomeration economy. Furthermore, based on panel data from 251 prefecture-level cities spanning from 2003 to 2019, this study empirically tests the impact of heterogeneous agglomeration of the service industry on the rationalization and upgrading of industrial structure using the spatial Durbin model. The research findings indicate the following:
(1)
Overall, the impacts of service industry agglomeration on urban industrial structure optimization mainly come from spatial spillover effects between cities. Specifically, an increase in the level of service industry specialization agglomeration not only inhibits the rational development of industrial structure but also impedes its advanced development; in addition, an increase in the level of service industry diversification agglomeration not only promotes the rational development of industrial structure but also drives its advanced development.
(2)
From the perspective of effect decomposition, an increase in the level of service industry specialization agglomeration not only inhibits the rational development of industrial structure in the local city but also hinders the rational and advanced development of industrial structure in neighboring cities. In summary, the specialization agglomeration of China’s service industry is already insufficient to support further urban industrial structure optimization; on the other hand, further enhancing the level of service industry diversification agglomeration not only promotes industrial structure rationalization and upgrading in the local city but also significantly drives industrial structure rationalization and upgrading in neighboring cities.
(3)
From the perspective of urban scale heterogeneity, the impacts of service industry agglomeration on industrial structure optimization show significant differences across cities of different sizes. The specialization agglomeration in large cities significantly affects the advanced development of industrial structure in neighboring cities; in medium and small cities, specialization agglomeration has a significant impact on the advanced development of industrial structure both in local and neighboring cities. Diversification agglomeration in large and medium cities significantly impacts industrial structure optimization in both local and neighboring cities; however, in small cities, diversification agglomeration only significantly impacts the optimization of the local city’s industrial structure.

6.2. Recommendations

Firstly, during the process of industrial structure optimization in Chinese cities, it is essential to synergize spatial layout adjustments with the strategic reorganization of industries. A strategic focus should be placed on the robust development of supplementary industries and the nurturing of emerging sectors with competitive advantages. This approach aims to progressively diminish cities’ over-reliance on natural resources. Concurrently, there is a pressing need to recalibrate the investment structure, amplifying the intensity of fixed asset investments and the impetus for reform and opening up. Strengthening the establishment of harmonious inter-regional collaboration mechanisms with significant external economic drivers is vital. Such mechanisms will promote the optimal circulation of production factors across different cities, ensuring a synchronized economic development trajectory among cities. This comprehensive strategy is designed to steer the urban industrial structure towards a more rational and sophisticated configuration.
Secondly, formulate differentiated city policies for service industry agglomeration. As a vital driving force for urban development, service industry agglomeration should receive high attention from local governments. Cities should choose the service industry agglomeration model that best suits their scale and can best leverage their advantages. For medium and small cities, further acceleration of service industry development is necessary. On the foundation of specialized agglomeration development, orderly diversified development of the service industry should be carried out to enhance the resilience of the service industry structure and transition from specialized to diversified agglomeration. For large cities, while achieving diversified development of their own service industries, they should play a leading role and exert spillover effects to help and promote the rationalization and upgrading of the industrial structure in neighboring cities.

6.3. Research Limitations and Future Recommendations

Given the rapid pace of economic globalization and advancements in information and communication technology, service industry agglomeration emerges as a crucial avenue to alleviate energy constraints and environmental pressures, and to promote the transformation and upgrading of industrial structures, thereby fostering economic growth. Consequently, this study holds theoretical significance and practical implications for advancing the optimization of urban industrial structures, catalyzing urban transformation, and achieving sustainable development in China. However, this study acknowledges certain limitations in its research process, suggesting avenues for future exploration.
Firstly, due to data constraints, this study focused solely on service industry agglomeration in 251 prefecture-level cities in China since 2003, examining the employment structure within detailed industry categories. Acquiring additional city-level data on the output value of specific service industry sectors would enable a more accurate understanding of the current development status and trends within the urban service industry, facilitating multidimensional verification of service industry agglomeration’s impact on industrial structure optimization.
Secondly, in analyzing the mechanisms through which service industry agglomeration influences industrial structure optimization, this study only considered indicators of specialized and diversified agglomeration. Future research can delve deeper into the mechanisms by exploring the impact of related and unrelated diversified agglomeration on industrial structure optimization as the share of diversified agglomeration within the service industry continues to grow.
Thirdly, from a micro-level perspective of enterprises, geographical information systems can be utilized to obtain enterprise location information and, in conjunction with enterprise site selection, examine the intrinsic mechanisms by which service industry agglomeration influences the optimization of industrial structure. Existing scholarly research has elucidated that enterprises, when selecting a location, must meticulously evaluate a triad of critical factors: the labor market, factor conditions, and market access [60]. It is imperative for these entities to base their geographical choices on the intrinsic demands of their industrial development, rather than adhering to directives imposed by governmental entities. Additionally, due to the passage of time, the economic policies, population structures, and consumer behaviors of the cities in which enterprises are located will undergo changes, and the objectives of enterprises within the agglomeration area will also evolve. These external environmental changes and the internal changes of enterprises themselves will have an impact on industrial clusters [61,62]. Therefore, by analyzing the enterprise life cycle and the dynamics of enterprise location changes, a deeper analysis of the impact mechanisms of service industry agglomeration on the optimization of industrial structure can be conducted from a dynamic perspective.

Author Contributions

Conceptualization, L.N. and Y.W.; methodology, Y.W.; software, Y.W; validation, Y.W; formal analysis, Y.W; data curation, Y.W; writing—original draft preparation, L.N. and Y.W.; writing—review and editing, L.N.; visualization, L.N.; supervision, L.N.; project administration, L.N.; funding acquisition, L.N. All authors have read and agreed to the published version of the manuscript.

Funding

This study was supported by the Humanities and Social Science Project of Ministry of Education (grant no. 22YJAZH124), Program for the Philosophy and Social Sciences Key Research Base of Higher Education Institutions of Shanxi (grant no. 2022J019), Basic Research Program Project of Shanxi (grant no. 202203021212494), Philosophy and Social Science Planning Project of Shanxi (grant no. 2022YY099), and General Research Project on Socioeconomic Statistics of Shanxi (grant no. 2023LY037).

Data Availability Statement

The data presented in this study are available upon request.

Conflicts of Interest

The authors declare no conflicts of interest.

References

  1. Zhang, H.; Li, L.; Chen, T.; Li, V. Where will China’s real estate market go under the economy’s new normal? Cities 2016, 55, 42–48. [Google Scholar] [CrossRef]
  2. Yuan, X.; Teng, Y.; Yuan, Q.; Liu, M.; Fan, X.; Wang, Q.; Ma, Q.; Hong, J.; Zuo, J. Economic transition and industrial sulfur dioxide emissions in the Chinese economy. Sci. Total Environ. 2020, 744, 140826. [Google Scholar] [CrossRef]
  3. Yu, S.; Zheng, S.; Zhang, X.; Gong, C.; Cheng, J. Realizing China’s goals on energy saving and pollution reduction: Industrial structure multi-objective optimization approach. Energy Policy 2018, 122, 300–312. [Google Scholar] [CrossRef]
  4. Ibrahim, Y.; Al-Mohannadi, D.M. Optimization of low-carbon hydrogen supply chain networks in industrial clusters. Int. J. Hydrogen Energy 2023, 48, 13325–13342. [Google Scholar] [CrossRef]
  5. Lin, B.; Zhang, G. Energy efficiency of Chinese service sector and its regional differences. J. Clean. Prod. 2017, 168, 614–625. [Google Scholar] [CrossRef]
  6. Yang, H.; Lu, F.; Zhang, F. Exploring the effect of producer services agglomeration on China’s energy efficiency under environmental constraints. J. Clean. Prod. 2020, 263, 121320. [Google Scholar] [CrossRef]
  7. Lentnek, B.; MacPherson, A.; Phillips, D. Optimum producer-service location. Environ. Plan. A 1992, 24, 467–479. [Google Scholar] [CrossRef]
  8. Illeris, S.; Philippe, J. Introduction: The Role of Services in Regional Economic Growth. Serv. Ind. J. 1993, 13, 3–10. [Google Scholar]
  9. Zhou, M.; Chen, Q.; Cai, Y.L. Optimizing the industrial structure of a watershed in association with economic–environmental consideration: An inexact fuzzy multi-objective programming model. J. Clean. Prod. 2013, 42, 116–131. [Google Scholar] [CrossRef]
  10. Devine-Wright, P. Decarbonisation of industrial clusters: A place-based research agenda. Energy Res. Soc. Sci. 2022, 91, 102725. [Google Scholar] [CrossRef]
  11. Wu, L.; Wan, X.; Jahanger, A.; Li, M.; Murshed, M.; Balsalobre-Lorente, D. Does the digital economy reduce air pollution in China? A perspective from industrial agglomeration. Energy Rep. 2023, 9, 3625–3641. [Google Scholar] [CrossRef]
  12. Zhao, J.; Jiang, Q.; Dong, X.; Dong, K.; Jiang, H. How does industrial structure adjustment reduce CO2 emissions? Spatial and mediation effects analysis for China. Energy Econ. 2022, 105, 105704. [Google Scholar] [CrossRef]
  13. Guo, D.; Jiang, K.; Xu, C.; Yang, X. Industrial clustering, income and inequality in rural China. World Dev. 2022, 154, 105878. [Google Scholar] [CrossRef]
  14. Dai, R.; Mookherjee, D.; Quan, Y.; Zhang, X. Industrial clusters, networks and resilience to the COVID-19 shock in China. J. Econ. Behav. Organ. 2021, 183, 433–455. [Google Scholar] [CrossRef]
  15. Guo, D.; Jiang, K.; Xu, C.; Yang, X. Clustering, growth and inequality in China. J. Econ. Geogr. 2020, 20, 1207–1239. [Google Scholar] [CrossRef]
  16. Wang, D.; Gong, Z.; Yang, Z. Design of industrial clusters and optimization of land use in an airport economic zone. Land. Use Policy 2018, 77, 288–297. [Google Scholar] [CrossRef]
  17. Mo, C.; He, C.; Yang, L. Structural characteristics of industrial clusters and regional innovation. Econ. Lett. 2020, 188, 109003. [Google Scholar] [CrossRef]
  18. Yang, J.; Zhou, C. Does industrial clustering mitigate the sensitivity of firm relocation to tax differentials? The role of financing. Financ. Res. Lett. 2021, 40, 101681. [Google Scholar] [CrossRef]
  19. Dietrich, A. Does growth cause structural change, or is it the other way around? A dynamic panel data analysis for seven OECD countries. Empir. Econ. 2012, 43, 915–944. [Google Scholar] [CrossRef]
  20. Zheng, T.; Zhao, Y.; Li, J. Rising labour cost, environmental regulation and manufacturing restructuring of Chinese cities. J. Clean. Prod. 2019, 214, 583–592. [Google Scholar] [CrossRef]
  21. Zhou, X.; Pan, Z.; Shahbaz, M.; Song, M. Directed technological progress driven by diversified industrial structural change. Struct. Chang. Econ. D 2020, 54, 112–129. [Google Scholar] [CrossRef]
  22. Ellison, G.; Glaeser, E.L.; Kerr, W.R. What Causes Industry Agglomeration? Evidence from Coagglomeration Patterns. Am. Econ. Rev. 2010, 100, 1195–1213. [Google Scholar] [CrossRef]
  23. Libaers, D.; Meyer, M. Highly innovative small technology firms, industrial clusters and firm internationalization. Res. Policy 2011, 40, 1426–1437. [Google Scholar] [CrossRef]
  24. Lee, C. Do firms in clusters invest in R&D more intensively? Theory and evidence from multi-country data. Res. Policy 2009, 38, 1159–1171. [Google Scholar]
  25. Guo, D.; Jiang, K.; Xu, C.; Yang, X. Geographic clusters, regional productivity and resource reallocation across firms: Evidence from China. Res. Policy 2023, 52, 104691. [Google Scholar] [CrossRef]
  26. Liu, N.; Zhao, S.; Shao, Q.; Li, C. Reshaping Chinese rural skilled workers flow in urban industrial clusters for clean air. J. Clean. Prod. 2022, 380, 134872. [Google Scholar] [CrossRef]
  27. Ning, L.; Wang, F.; Li, J. Urban innovation, regional externalities of foreign direct investment and industrial agglomeration: Evidence from Chinese cities. Res. Policy 2016, 45, 830–843. [Google Scholar] [CrossRef]
  28. Fan, H.; Li, C.; Xue, C.; Yu, M. Clan culture and patterns of industrial specialization in China. J. Econ. Behav. Organ. 2023, 207, 457–478. [Google Scholar] [CrossRef]
  29. Marshall, A. Principles of Economics: An Introductory Volume; Macmillan: London, UK, 1890. [Google Scholar]
  30. Duranton, G. Chapter 48 Micro-foundations of urban agglomeration economies. Handb. Reg. Urban Econ. 2004, 4, 2063–2117. [Google Scholar]
  31. Xu, J.; Zhang, M.; Zhang, X.; Wang, D.; Zhang, Y. How does City-cluster high-speed rail facilitate regional integration? Evidence from the Shanghai-Nanjing corridor. Cities 2019, 85, 83–97. [Google Scholar] [CrossRef]
  32. Cai, Y.; Hu, Z. Industrial agglomeration and industrial SO2 emissions in China’s 285 cities: Evidence from multiple agglomeration types. J. Clean. Prod. 2022, 353, 131675. [Google Scholar] [CrossRef]
  33. Meijers, E.; Burger, M. Stretching the concept of ‘borrowed size’. Urban. Stud. 2017, 54, 269–291. [Google Scholar] [CrossRef]
  34. Shen, N.; Peng, H. Can industrial agglomeration achieve the emission-reduction effect? Socio-Econ. Plan. Sci. 2021, 75, 100867. [Google Scholar] [CrossRef]
  35. Combes, P. Economic Structure and Local Growth: France, 1984–1993. J. Urban Econ. 2000, 47, 329–355. [Google Scholar] [CrossRef]
  36. Liu, Y.; Zhang, X.; Pan, X.; Ma, X.; Tang, M. The spatial integration and coordinated industrial development of urban agglomerations in the Yangtze River Economic Belt, China. Cities 2020, 104, 102801. [Google Scholar] [CrossRef]
  37. Jacobs, J. The Economy of Cities; Random House: New York, NY, USA, 1969. [Google Scholar]
  38. Han, F.; Xie, R.; Lu, Y.; Fang, J.; Liu, Y. The effects of urban agglomeration economies on carbon emissions: Evidence from Chinese cities. J. Clean. Prod. 2018, 172, 1096–1110. [Google Scholar] [CrossRef]
  39. Bas, M. Does services liberalization affect manufacturing firms’ export performance? Evidence from India. J. Comp. Econ. 2014, 42, 20. [Google Scholar] [CrossRef]
  40. Vasilescu, C.; Millo, Y. Do industrial and geographic diversifications have different effects on earnings management? Evidence from UK mergers and acquisitions. Int. Rev. Financ. Anal. 2016, 46, 33–45. [Google Scholar] [CrossRef]
  41. Boschma, R.; Minondo, A.; Navarro, M. The Emergence of New Industries at the Regional Level in S pain: A Proximity Approach Based on Product Relatedness. Econ. Geogr. 2013, 89, 29–51. [Google Scholar] [CrossRef]
  42. Anas, A.; Xiong, K. Intercity trade and the industrial diversification of cities. J. Urban. Econ. 2003, 54, 258–276. [Google Scholar] [CrossRef]
  43. Lee, K.; Hooy, C.; Hooy, G. The value impact of international and industrial diversifications on public-listed firms in Malaysia. Emerg. Mark. Rev. 2012, 13, 366–380. [Google Scholar] [CrossRef]
  44. Lesage, J.P. What Regional Scientists Need to Know about Spatial Econometrics; Texas State University: San Marcos, TX, USA, 2014; Volume 44, pp. 13–32. [Google Scholar]
  45. Lu, X.; Jiang, X.; Gong, M. How land transfer marketization influence on green total factor productivity from the approach of industrial structure? Evidence from China. Land Use Policy 2020, 95, 104610. [Google Scholar] [CrossRef]
  46. Zhou, X.; Lei, K.; Meng, W.; Khu, S. Industrial structural upgrading and spatial optimization based on water environment carrying capacity. J. Clean. Prod. 2017, 165, 1462–1472. [Google Scholar] [CrossRef]
  47. Liu, J.; Hou, X.; Wang, Z.; Shen, Y. Study the effect of industrial structure optimization on urban land-use efficiency in China. Land. Use Policy 2021, 105, 105390. [Google Scholar] [CrossRef]
  48. Ezcurra, R.; Pascual, P.; Rapún, M. Regional Specialization in the European Union. Reg. Stud. 2006, 40, 601–606. [Google Scholar] [CrossRef]
  49. Safarzynska, K. The Implications of Industrial Development for Diversification of Fuels. Ecol. Econ. 2017, 137, 37–46. [Google Scholar] [CrossRef]
  50. Tan, J.; Hu, X.; Hassink, R.; Ni, J. Industrial structure or agency: What affects regional economic resilience? Evidence from resource-based cities in China. Cities 2020, 106, 102906. [Google Scholar] [CrossRef]
  51. Xiaobo, Z. China Innovation and Entrepreneurship Index; Peking University Open Research Data Platform: Beijing, China, 2019. [Google Scholar]
  52. LeSage, P.J.; Pace, K.R. Introduction to Spatial Econometrics; Chapman & Hall/CRC: Boca Raton, FL, USA, 2009. [Google Scholar]
  53. Long, R.; Ren, Y.; Wu, M. Differential decomposition of total-factor energy efficiency in Chinese coal mining cities considering environmental constraints: A dynamic and static perspective. Resour. Policy 2022, 79, 102993. [Google Scholar] [CrossRef]
  54. Xu, A.; Wang, C.; Tang, D.; Ye, W. Tourism circular economy: Identification and measurement of tourism industry ecologization. Ecol. Indic. 2022, 144, 109476. [Google Scholar] [CrossRef]
  55. Liu, Y.; Bian, J.; Li, X.; Liu, S.; Lageson, D.; Yin, Y. The optimization of regional industrial structure under the water-energy constraint: A case study on Hebei Province in China. Energy Policy 2020, 143, 111558. [Google Scholar] [CrossRef]
  56. Qin, Q.; Yu, Y.; Liu, Y.; Zhou, J.; Chen, X. Industrial agglomeration and energy efficiency: A new perspective from market integration. Energy Policy 2023, 183, 113793. [Google Scholar] [CrossRef]
  57. Zhang, F.; Deng, X.; Phillips, F.; Fang, C.; Wang, C. Impacts of industrial structure and technical progress on carbon emission intensity: Evidence from 281 cities in China. Technol. Forecast. Soc. 2020, 154, 119949. [Google Scholar] [CrossRef]
  58. Dong, B.; Ma, X.; Zhang, Z.; Zhang, H.; Chen, R.; Song, Y.; Shen, M.; Xiang, R. Carbon emissions, the industrial structure and economic growth: Evidence from heterogeneous industries in China. Environ. Pollut. 2020, 262, 114322. [Google Scholar] [CrossRef] [PubMed]
  59. Xue, Y.; Ye, X.; Zhang, W.; Zhang, J.; Liu, Y.; Wu, C.; Li, Q. Reverification of the “resource curse” hypothesis based on industrial agglomeration: Evidence from China. J. Clean. Prod. 2020, 275, 124075. [Google Scholar] [CrossRef]
  60. Munday, M.; Huggins, R.; Cai, W.; Kapitsinis, N.; Roberts, A. The transformative potential of inward investment on industrial cluster development: The case of the semiconductor industry in Wales. Eur. Plan. Stud. 2024, 2319704. [Google Scholar] [CrossRef]
  61. Harris, J.L. Rethinking cluster evolution: Actors, institutional configurations, and new path development. Prog. Hum. Geog. 2021, 45, 436–454. [Google Scholar] [CrossRef]
  62. Ozguzel, C. Agglomeration effects in a developing economy: Evidence from Turkey. J. Econ. Geogr. 2023, 23, 823–846. [Google Scholar] [CrossRef]
Figure 1. The spatial characteristics of service industry specialization agglomeration and diversified agglomeration.
Systems 12 00085 g001
Figure 2. Scatter plot of local Moran’s index for 2019.
Systems 12 00085 g002
Table 1. Global autocorrelation Moran’s I index from 2003 to 2019.
YearIndustrial Structure Rationalization (RS)Industrial Structure Upgrading (OS)Service Industry Specialization Agglomeration (LQ)Service Industry Diversification Agglomeration (TV)
20030.073 *** (13.075)0.023 *** (4.61)0.044 *** (8.201)0.054 *** (9.840)
20040.074 *** (13.389)0.025 *** (4.888)0.043 *** (7.983)0.055 *** (10.074)
20050.062 *** (11.205)0.033 *** (6.227)0.035 *** (6.641)0.047 *** (8.755)
20060.068 *** (12.321)0.024 *** (4.83)0.030 *** (5.821)0.046 *** (8.465)
20070.073 *** (13.113)0.025 *** (5.005)0.026 *** (5.134)0.039 *** (7.393)
20080.080 *** (14.384)0.031 *** (6.034)0.023 *** (4.571)0.037 *** (7.049)
20090.084 *** (15.086)0.051 *** (9.392)0.025 *** (4.863)0.039 *** (7.250)
20100.089 *** (15.850)0.05 *** (9.125)0.036 *** (6.747)0.043 *** (7.951)
20110.078 *** (13.945)0.053 *** (9.741)0.033 *** (6.237)0.040 *** (7.512)
20120.075 *** (13.543)0.059 *** (10.811)0.040 *** (7.503)0.040 *** (7.455)
20130.066 *** (12.023)0.058 *** (10.647)0.041 *** (7.598)0.047 *** (8.721)
20140.064 *** (11.550)0.065 *** (11.83)0.029 *** (5.542)0.039 *** (7.324)
20150.067 *** (12.195)0.077 *** (13.847)0.032 *** (6.110)0.043 *** (7.992)
20160.063 *** (11.469)0.073 *** (13.169)0.027 *** (5.219)0.034 *** (6.465)
20170.057 *** (10.380)0.071 *** (13.018)0.023 *** (4.647)0.033 *** (6.255)
20180.075 *** (13.532)0.073 *** (13.268)0.025 *** (4.997)0.029 *** (5.597)
20190.045 *** (8.299)0.103 *** (18.789)0.030 *** (5.842)0.036 *** (6.867)
Note: ***indicate passing the significance level tests at 1%, with z-values in parentheses.
Table 2. Test results of spatial panel models.
Test MethodRationalization of Industrial Structure (RS)Upgrading of Industrial Structure (OS)
LQTVLQTV
StatisticProbabilityStatisticProbabilityStatisticProbabilityStatisticProbability
LM-spatial lag2664.102134.201416.2014710
Robust LM-spatial lag85.90176.606.80.00912.30
LM-spatial error3021.802241.502104.502087.20
Robust LM-spatial error443.702840695.20628.50
Wald-spatial lag87.50790151.80162.10
LR-spatial lag91.7086.70159.10170.10
Wald-spatial error140.20170.80119.20138.70
LR-spatial error146.60179.30125.90146.70
Table 3. Estimation results of specialization aggregation (LQ) on industrial structure optimization.
Variable NameIndustrial Structure Rationalization (RS)Industrial Structure Upgrading (OS)
Direct EffectIndirect EffectTotal EffectDirect EffectIndirect EffectTotal Effect
LQ0.0664 ***5.0058 ***5.0722 ***−0.00003−0.1748 ***−0.1748 ***
(12.6194)(4.2414)(4.2864)(−0.1727)(−3.9775)(−3.9719)
lre−0.0581 ***−4.2759 ***−4.334 ***−0.0033 ***0.0180.0147
(−7.1018)(−2.7486)(−2.7812)(−10.1418)(0.3716)(0.3031)
lhum−0.0207 ***−0.8685 ***−0.8893 ***0.0013 ***−0.0273 ***−0.0261 **
(−13.8123)(−3.0193)(−3.0867)(19.4256)(−2.6375)(−2.5125)
llproad−0.0194 ***−1.8979 ***−1.9172 ***0.0011 ***−0.0833 ***−0.0823 ***
(−7.1891)(−3.4346)(−3.4628)(9.5056)(−4.0165)(−3.9622)
lfdr−0.0849 ***−4.5381−4.6231−0.00060.3162 ***0.3156 ***
(−6.1443)(−1.4928)(−1.5167)(−1.1966)(2.7406)(2.7308)
lpfset0.0171 ***3.0191 ***3.0361 ***0.0003 ***0.0381 *0.0384 *
(5.8169)(4.268)(4.2759)(3.8485)(1.8354)(1.8447)
linosu0.0086 ***2.8429 ***2.8515 ***0.0004 ***0.0662 ***0.0666 ***
(2.8318)(4.5917)(4.5926)(4.2059)(3.4663)(3.4862)
rho0.9713 ***0.9621 ***
(209.7324)(154.7457)
Individual effectYESYES
Time effectYESYES
R20.53760.5181
Observations42674267
Number of cities251251
Note: ***, **, and * indicate passing the significance level tests at 1%, 5%, and 10%, respectively, with z-values in parentheses.
Table 4. Estimation results of diversification agglomeration (TV) on industrial structure optimization.
Variable NameIndustrial Structure Rationalization (RS)Industrial Structure Upgrading (OS)
Direct EffectIndirect EffectTotal EffectDirect EffectIndirect EffectTotal Effect
TV−0.0434 ***−3.0739 ***−3.1173 ***0.0053 ***0.6304 ***0.6358 ***
(−16.2495)(−5.0205)(−5.08)(7.8854)(4.3383)(4.3597)
lre−0.0557 ***−3.8375 ***−3.8932 ***−0.0033 ***0.05030.0471
(−7.4858)(−2.9644)(−3.0048)(−9.3582)(0.9182)(0.8584)
lhum−0.0076 ***0.1650.15740.001 ***−0.0535 ***−0.0524 ***
(−4.4967)(0.6068)(0.5781)(13.0958)(−3.8538)(−3.771)
llproad−0.0042 *−0.8619 *−0.8661 *0.0009 ***−0.1159 ***−0.115 ***
(−1.6903)(−1.9475)(−1.9544)(6.3209)(−4.4031)(−4.3586)
lfdr−0.0713 ***−1.3479−1.4193−0.00050.3174 **0.3168 **
(−6.0173)(−0.5276)(−0.5543)(−0.8484)(2.5224)(2.5108)
lpfset0.011 ***1.395 **1.4059 **0.0005 ***0.069 ***0.0695 ***
(4.8557)(2.5475)(2.5584)(4.6424)(2.8917)(2.9014)
linosu0.00251.5268 ***1.5293 ***0.0006 ***0.1122 ***0.1128 ***
(1.0403)(3.4153)(3.4146)(4.3722)(4.6809)(4.6921)
rho0.9666 ***0.9638 ***
(181.8994)(163.6824)
Individual effectYESYES
Time effectYESYES
R20.55850.5111
Observations42674267
Number of cities251251
Note: ***, **, and * indicate passing the significance level tests at 1%, 5%, and 10%, respectively.
Table 5. Robustness test of specialization agglomeration.
Variable NameIndustrial Structure Rationalization (LH)Industrial Structure Upgrading (LG)
Direct EffectIndirect EffectTotal EffectDirect EffectIndirect EffectTotal Effect
LQ0.0081 ***0.3593 ***0.3675 ***−0.00003−0.0247 ***−0.0248 ***
(11.6555)(2.7555)(2.8081)(−1.0786)(−3.9032)(−3.8973)
rho0.9713 ***0.9703 ***
(205.067)(206.8133)
Individual effectYESYES
Time effectYESYES
Control variablesYESYES
R20.49990.6570
Observations42674267
Number of cities251251
Note: *** indicate passing the significance level tests at 1%.
Table 6. Robustness test of diversification agglomeration.
Variable NameIndustrial Structure Rationalization (LH)Industrial Structure Upgrading (LG)
Direct EffectIndirect EffectTotal EffectDirect EffectIndirect EffectTotal Effect
TV−0.0032 ***−0.3676 ***−0.3708 ***0.0002 ***0.0057 ***0.006 ***
(−9.0689)(−5.2528)(−5.2846)(20.3833)(2.7515)(2.8642)
rho0.9632 ***0.9667 ***
(159.6244)(188.6874)
Individual effectYESYES
Time effectYESYES
Control variablesYESYES
R20.49740.6890
Observations42674267
Number of cities251251
Note: *** indicate passing the significance level tests at 1%.
Table 7. Heterogeneity analysis of specialized agglomeration on industrial structure optimization.
Variable Name RS OS
Large CityMedium CitySmall CityLarge CityMedium CitySmall City
Direct effect−0.00450.02060.1160 ***0.0010−0.0266 ***−0.0128 **
LQ(−0.5840)(1.3032)(7.0744)(0.4427)(−7.6245)(−3.2363)
Indirect effect−0.02620.1652 *−0.0062−0.0532 ***−0.0358 *−0.0828 ***
LQ(−0.5419)(1.9871)(−0.0611)(−3.3277)(−2.1404)(−4.1227)
Individual effectYESYESYESYESYESYES
Time effectYESYESYESYESYESYES
Control variablesYESYESYESYESYESYES
Observations132612921649132612921649
Number of cities787697787697
Note: ***, **, and * indicate passing the significance level tests at 1%, 5%, and 10%, respectively.
Table 8. Heterogeneity analysis of diversified agglomeration on industrial structure optimization.
Variable Name RS OS
Large CityMedium CitySmall CityLarge CityMedium CitySmall City
Direct effect0.0255 ***−0.0272 **−0.0524 ***0.0038 *0.0143 ***0.0150 ***
TV(4.4159)(−3.1180)(−7.0091)(2.2173)(7.5057)(8.4852)
Indirect effect−0.1062 ***−0.1174 **−0.00610.0209 *0.0367 ***0.0190
TV(−3.3332)(−2.6447)(−0.1122)(2.2978)(4.1795)(1.7804)
Individual effectYESYESYESYESYESYES
Time effectYESYESYESYESYESYES
Control variablesYESYESYESYESYESYES
Observations132612921649132612921649
Number of cities787697787697
Note: ***, **, and * indicate passing the significance level tests at 1%, 5%, and 10%, respectively.
Disclaimer/Publisher’s Note: The statements, opinions and data contained in all publications are solely those of the individual author(s) and contributor(s) and not of MDPI and/or the editor(s). MDPI and/or the editor(s) disclaim responsibility for any injury to people or property resulting from any ideas, methods, instructions or products referred to in the content.

