

Research on the Decision Making of Value Chain Reconstruction of Chinese Port Enterprises under the Background of Free Trade Zone Policy

1
School of Maritime Economics and Management, Dalian Maritime University, Dalian 116000, China
2
Collaborative Innovation Center for Transport Studies, Dalian Maritime University, Dalian 116000, China
*
Author to whom correspondence should be addressed.
Systems 2024, 12(3), 91; https://doi.org/10.3390/systems12030091
Submission received: 26 December 2023
/
Revised: 9 March 2024
/
Accepted: 11 March 2024
/
Published: 12 March 2024
Abstract
:This paper aims to solve the decision-making problem of value chain reconstruction of Chinese port enterprises under the background of the Free Trade Zone policy. Based on value chain theory and system dynamics method, this paper constructs a simulation model that can simulate the value-added change process of port enterprises under different combination input conditions. Furthermore, it conducts simulation case studies. The research indicates that the Free Trade Zone policy has a significant promoting effect on the restructuring of port enterprise value chains and the transformation and upgrading of enterprises. Moreover, considering the impact of the Free Trade Zone policy and limited resources, the overall benefits to port enterprises from combined investments are superior to those from single-factor investments. According to the value chain theory, the business segments of a port are decomposed into ancillary value activities, basic value activities, and external value activities. The investments in these three types of value activities play roles, respectively, in enhancing the operational efficiency of port enterprises, expanding the business scope of port enterprises, and strengthening the core competitiveness of port enterprises. From the overall perspective of the system, Shanghai Port can obtain the maximum operating profit when the endogenous factor input rate is 13%, the basic factor input rate is 4%, and the exogenous factor input rate is 13%. The findings of this research provide a decision-making reference for Chinese port enterprises to realize value reconstruction, transformation, and upgrading in the context of the Free Trade Zone policy.
1. Introduction
In recent years, with the increasing investment in shipping infrastructure, China’s port throughput has been greatly enhanced. However, the main business of port enterprises is still based on traditional port services such as loading, unloading, warehousing, and tally. There is a certain gap between the development level of shipping ancillary services such as agency, ship supply, and repair, and shipping derivatives services such as shipping finance, shipping insurance, and shipping information compared with international leading port companies [1]. Under the current situation of increasingly serious homogenized competition among regional port enterprises, pure disorderly competition leads to waste of resources, excessive construction, and idle capacity, which in turn affects the long-term development of enterprises [2]. In view of this, many enterprises have entered the high-end field of the port shipping value chain through upstream and downstream expansion and cross-border operations, and the value chain reconstruction has become an important way for port enterprises to transform and upgrade [3].
The Free Trade Zone gains advantages by means of free trade of goods and free circulation of finance. As a functional node of trade in goods, the port is the core carrier for the trade of goods in the Free Trade Zone. The establishment of Free Trade Zones and the implementation of a number of innovative policies have an important impact on the economic development of port enterprises [4]. At present, the impact of the Free Trade Zone policy on port enterprises mainly focuses on the qualitative research of goods trade facilitation, freedom of movement of people, and degree of financial openness [5]. Therefore, studying the choice of countermeasures for the reconstruction of port enterprises’ value chain under the Free Trade Zone policy environment will help to optimize the enterprise value structure, improve the operational efficiency of the port value chain, and provide a feasible path for port enterprises to achieve transformation and upgrading.
We analyze the mapping relationship between the influencing factors of Free Trade Zone policies and the value chain of ports and construct a system dynamics simulation model for the investment decision-making behavior of port enterprises in selecting value chain components, based on the perspective of profit maximization. We analyze the impact of different input combinations on the operating profit of port enterprises under certain resource constraints, providing quantitative analysis basis for the value chain reconstruction of port enterprises. We analyze the impact of different input combinations on the operating profit of port enterprises under certain resource constraints, providing quantitative analysis basis for the value chain reconstruction of port enterprises. Furthermore, we propose strategic recommendations to facilitate the transformation and upgrading of port enterprises.
2. Literature Review
2.1. Port Enterprise Value Chain
In 1985, Michael Porter proposed the value chain theory in his book “Competitive Advantage” [6]. Subsequently, scholars from various countries applied value chain theory to the study of the port industry [7]. Robinson [8] believes that the port is not only the main body that provides basic loading and unloading services, but also the core element in the entire transportation service value drive chain system. Hoa et al. [9] studied the mechanism by which port logistics services enhance the country’s export commodity value chain, and pointed out that innovative integrated logistics service models and the application of advanced technological means can significantly improve the quality and efficiency of port logistics services. Poulsen et al. [10] studied from the perspective of global value chain and concluded that ports can play an important role in the green development of global shipping, and identified low “tool implementation complexity” and high “problem visibility” as key driving factors for environmental upgrading. Liu et al. [11] studied the improvement path of the cruise industry value chain in Shenzhen Shekou Port and believed that strengthening the construction of cruise home ports, cultivating cruise culture, increasing marketing efforts for the elderly and children, and improving passenger satisfaction are the keys to achieving a healthy and sustainable cruise industry.
According to the value chain theory, the port enterprise value chain includes two types: internal value chain and external value chain; among them, the internal value chain includes ancillary activities and basic activities [12]. The ancillary activities consist of enterprise infrastructure construction, technology research and development, human resource management, and production materials. Procurement consists of basic activities including collection and distribution, loading and unloading, processing and packaging, warehousing, shipping services, etc. [13]. The external value chain of a port enterprise refers to a collection of value activities centered on the port’s own business that expands upward to the downstream, including booking space, customs declaration and inspection, crew services, fuel refueling, taxation, finance, big data services, and other value activity stages, introducing values such as ship operations, marketing, comprehensive logistics services, financial services, and information platform services into the external value chain through cross-border operations [14,15].
2.2. Free Trade Zone Policy
The concept of the Free Trade Zone was first proposed in the Kyoto Convention that came into effect in 1974. With the development of global economic integration, two concepts and development models of Free Trade Area and Free Trade Zone have emerged [16,17]. Scholars from various countries conduct research on Free Trade Zone policies from economic, political, environmental, and other perspectives. Keshavarzian [18] studied the interaction between the construction of the Free Trade Zone in countries in the Middle East and geopolitics. Pak et al. [19] studied the issues of integrated coastal management of the Free Trade Zone in the Persian Gulf region. Aloise et al. [20] conducted a study on ecological innovation in developing countries, taking the Brazilian Free Trade Zone as an example. Guo [21] studied the impact of the Free Trade Zone policies of the “Belt and Road” countries on food security, e-commerce, and technological innovation.
With regard to the research status of China’s Free Trade Zone policy, Yang [22] comparatively analyzed the policy similarities and differences between the Korean Free Trade Zone and the Taiwan Free Trade Zone based on the port hinterland perspective. Meng et al. [23] studied the dynamic mechanism of the development and evolution of Tianjin Free Trade Zone in China. Notteboom et al. [24] studied the comprehensive impact of China’s Free Trade Zone policy, “Belt and Road” policy, Western development policy, Chinese enterprise modernization governance policy, and other strategies on China’s port governance since 2004. Zhang [25] took the Fujian Free Trade Zone as an example and studied the issue of coordinated development of economy and environment in the Free Trade Zone. Zhuo et al. [26] studied the impact of Free Trade Zone policies on environmental welfare. Jiang et al. [27] used the Shanghai Free Trade Zone as an example to study the net impact of Free Trade Zone policies on urban green total factor productivity.
With regard to research on the impact of Free Trade Zone policies on ports, Hu et al. [28] studied the comparative advantages of the Shanghai Free Trade Zone in building a Free Trade Port under the background of the “Belt and Road Initiative”. Li et al. [29] studied the impact of Free Trade Zone policies on the development performance of listed port companies. Guan et al. [30] studied the impact of Free Trade Zone policy on the structural upgrading of the service industry. Liu et al. [31] studied port efficiency and its influencing factors in the context of the Free Trade Zone. Fan et al. [32] studied the impact of Free Trade Zone policies on seaport development from two dimensions: port cargo throughput and total import and export trade volume of the city where the port is located. Lin et al. [33] analyzed the driving role of national policies including Free Trade Zone, “One Belt, One Road”, and other policies on port development. Jiang et al. [34] studied the direct impact of seaport capacity on export trade in coastal areas and the spatial spillover effect on neighboring cities in the context of the Free Trade Zone.
2.3. System Dynamics Applications
The system dynamics modeling method has good analytical and simulation capabilities for complex systems where multiple factors interact, and is widely used in policy simulation research. Kotir et al. [35] studied the feedback process and interaction between population, water resources, and agricultural production subsectors in the Volta River Basin in West Africa, and proposed policy recommendations for sustainable water resources management and agricultural development in the region. Kamran et al. [36] took universities as the research object and built a dynamic model of vaccine dynamic supply chain network management system around the issue of vaccine distribution in sudden epidemics. Layani et al. [37] used PMP and system dynamics simulation models to study the impact of government policy reforms on environmental sustainability. Li et al. [38] used the system dynamics method to simulate and study the impact of subsidy policies on the electric vehicle industry from the four dimensions of acquisition, research and development, static, and dynamic. Shafiee et al. [39] built a system dynamics model and simulated the investment decision-making problem of sustainable development of tourist destinations based on the development of intelligent technology. Liu et al. [40] constructed a complex system dynamics model for the low-carbon development of China’s marine fisheries and simulated the impact of different policy models on carbon emissions from marine fisheries. With regard to the application of system dynamics in port-related research, Pan et al. [41] used the system dynamics method to study the coupling relationship between the port and the city where it is located, and analyzed the mechanism of coupling interaction between the port and the city. Liu et al. [42] used system dynamics to simulate the implementation effect of container port congestion countermeasures in the context of an emergency epidemic, and pointed out that improving the intelligent level of epidemic prevention and control is the key to solving the port congestion problem.
2.4. Summary of the Reviewed Literature
Based on the above three aspects of the literature review, most of the existing literature studies the impact of Free Trade Zone policies on the port shipping industry from the industry level. From the perspective of the enterprise’s own transformation and upgrading, port enterprises need to examine the impact of Free Trade Zone policies on enterprises from the enterprise level. The specific impact on business and value links will then be used to reconstruct the enterprise value chain and achieve enterprise transformation and upgrading. In view of this, based on the value chain perspective, this paper segments the value chain of port enterprise business. By establishing mapping relationships, it extracts the endogenous factors, basic factors, and exogenous factors that affect the reconstruction of the value chain, and constructs the reconstruction of the value chain of port enterprises. The system dynamics model of decision making provides countermeasures and suggestions for port enterprises to realize corporate value appreciation under certain resource constraints.
3. Model Construction
3.1. Applicability Analysis of the Model
System dynamics is a science that closely combines system science theory with computer simulation to study the feedback structure and behavior of systems. It has been widely used in the field of transportation [43]. In general, the system being analyzed needs to meet certain conditions in order to conduct research using this method. The relationship between the value chain portfolio investment and the operating profit studied in this paper has a clear boundary and a complex causal relationship within the system. Therefore, system dynamics can be used for simulation.
3.2. Causal Relationship Model and Feedback Loop
As shown in Figure 1, on the basis of analyzing the composition of the port enterprise value chain, this article analyzes the value links of the port enterprise from a business perspective, and further analyzes the influencing factors systematically. The factors that affect the value growth of port enterprises are summarized into three types: endogenous factors, basic factors, and exogenous factors, and it is pointed out that different influencing factors have an impact on the operating efficiency, business scope, and exogenous capabilities of port enterprises.
According to the research theme, this paper mainly investigates the changes of the operating profit of enterprises under the conditions of different input rates of subsystems of endogenous, basic, and exogenous factors, and then proposes the countermeasures of value chain reconstruction. Firstly, the input of the endogenous factor subsystem is applied to the operation ability and the synergy ability. The two work together on the work efficiency, and the work efficiency affects the market share through work efficiency influence ability table function. At the same time, endogenous factor subsystem input affects the increment of operating cost. Secondly, the basic factor subsystem is invested in financial factors, trade factors, information factors, industrial production factors, and logistics factors. The five factors work together in the business scope, and the business scope affects the market share. At the same time, basic factor subsystem input affects the increment of operating cost. Finally, the input of the exogenous factors subsystem is applied to the competitiveness and customer demand satisfaction ability. With regard to the two functions on the exogenous ability, the exogenous ability affects the market share through the exogenous ability to influence table function. At the same time, the exogenous factors’ subsystem investing will act on the increase in operating cost increment.
The text categorizes all aspects of port production using the value chain theory, dividing them into auxiliary value activities, basic value activities, and external value activities. Port enterprises need to invest in these three types of value activities, resulting in corresponding costs. At the same time, these three types of value activities generate operating revenue for the enterprise, and the operating profit of the enterprise is the difference between operating revenue and costs. Based on this, the article constructs a causal relationship system dynamics model for the operating profit of port enterprises. The causal relationship model is shown in Figure 2, and the feedback loop involved is shown in Table 1.
3.3. Model Assumptions and System Flow Diagrams
We make the following basic assumptions about the system dynamics model:
- (1)
- In the endogenous factor subsystem, endogenous factors affect the work efficiency, and, thus, the work status of the whole subsystem.
- (2)
- In the basic factor subsystem, basic factor investment affects the business scope, then affects the whole subsystem operation condition.
- (3)
- In the exogenous factors subsystem, exogenous factors affect exogenous ability, and then affect the whole subsystem operation.
According to the causality model in Figure 2, combined with the above assumptions, the corresponding system flow diagram is established, as shown in Figure 3.
Equation design:
- (1)
- Business scope = Information factor + Industrial production factor + Logistics factor + Trade factor + Financial factor (units: CNY 100 million).
- (2)
- Information factor = 0.2 × basic factor subsystem input (units: CNY 100 million).
- (3)
- Logistics factors = 0.2 × basic factors subsystem input (units: CNY 100 million).
- (4)
- Trade factors = 0.2 × basic factor subsystem inputs (units: CNY 100 million).
- (5)
- Financial factors = 0.2 × basic factor subsystem inputs (units: CNY 100 million).
- (6)
- Industrial production factors = 0.2 × basic factor subsystem inputs (units: CNY 100 million).
- (7)
- Basic factor subsystem input = basic factor input rate × operating profit (units: CNY 100 million).
- (8)
- Basic factor input rate = 0.991 (units: Dmnl (dimensionless)).
- (9)
- Operation efficiency = operation ability + cooperative ability (units: CNY 100 million).
- (10)
- Operation ability = 0.5 × Endogenous factor subsystem input (units: CNY 100 million).
- (11)
- Cooperative ability = 0.5 × Endogenous factor subsystem input (units: CNY 100 million).
- (12)
- Endogenous factors subsystem input = Endogenous factor input rate * Operating profit (units: CNY 100 million).
- (13)
- Endogenous factor input rate = 0.108 (units: Dmnl (dimensionless)).
- (14)
- Exogenous ability = Competitive power + Customer demand satisfaction ability (units: CNY 100 million).
- (15)
- Competitive power = 0.5 × Exogenous factors subsystem input (units: CNY 100 million).
- (16)
- Customer demand satisfaction ability = 0.5 × Exogenous factor subsystem input (units: CNY 100 million).
- (17)
- Exogenous factors subsystem input = Exogenous factor input rate × operating profit (units: CNY 100 million).
- (18)
- Exogenous factor input rate = 0.0998 (units: Dmnl (dimensionless)).
- (19)
- Market share = Exogenous ability influence LOOKUP (Exogenous ability) + Free Trade Zone policy influence LOOKUP (Business scope) + Operational efficiency influence LOOKUP (Operation efficiency) (units: Dmnl (dimensionless)).
- (20)
- Traffic increment = Market share × Initial market size (units: CNY 100 million).
- (21)
- Initial market size = 117.67 (units: CNY 100 million).
- (22)
- Operating income increment = Traffic increment × Service price (units: CNY 100 million).
- (23)
- Service price = 50 (units: CNY/ton).
- (24)
- Operating cost increment = Endogenous factor input + Basic factor input + Exogenous factor input (units: CNY 100 million).
- (25)
- Operating profit = Operating income increment − Operating cost increment (units: CNY 100 million).
4. Simulation Analysis and Results Discussion
4.1. Model Parameter Setting
- (1)
- Initial value of state variable
The operating profit is a state variable. Taking Shanghai Port Group as the simulation object, its operating profit in 2013 is set as the initial value of the state variable. According to the annual corporate development report of Shanghai Port Group in 2013, the initial operating profit is CNY 7.148 billion.
- (2)
- Ancillary variables
The ancillary variables of the simulation model include endogenous factor input rate, basic factor input rate, and exogenous factor input rate. The endogenous factor input rate refers to the proportion of capital investment in internal-related business made by an enterprise to improve operational efficiency. The ratio is equal to the ratio of the sum of business management expenses, financial expenses, sales expenses, and research and development expenses to operating profit, as shown in Formula (1), in which t represents the year.
The basic factor input rate refers to the proportion of the enterprise’s investment to expand its business to the operating profit, as shown in Formula (2), in which t represents the year.
The exogenous factor input rate refers to the proportion of the enterprise’s investment to improve its ability to meet customer needs and to improve the competitiveness. In the model, the average value of the endogenous factor input rate and the basic factor input rate is used as the exogenous factor input rate, as shown in Formula (3).
According to Formulas (1)–(3), by analyzing the annual corporate development report of Shanghai Port Group from 2013 to 2022, the initial value of the basic factor input rate is 0.0910, the initial value of the endogenous factor input rate is 0.1086, and the initial value of the exogenous factor input rate is 0.0998.
- (3)
- Table function
The table functions in the model include the exogenous ability influence, the Free Trade Zone policy influence, and operational efficiency influence. The exogenous ability influence indicates the nonlinear function relationship between exogenous ability and market share. It presents four stages of change: high-speed growth, relatively high-speed growth, stable growth, and stabilization. The change in relationship is in line with the relationship between customer satisfaction with the services provided by the company and the company’s market share. The Free Trade Zone policy influence indicates the relationship between the business scope and market share under the FTA policy. Due to the delayed effect of policies, this changing relationship manifests itself in four stages of change: slower growth, rapid growth, stable growth, and stabilization. The operational efficiency influence indicates the function relationship between the operational efficiency and market share. Due to the immediacy of operational efficiency, this changing relationship manifests itself in four stages: high-speed growth, relatively high-speed growth, slow growth, and stabilization. Through research on various port enterprises affiliated to Liaoning Port Group, relevant data were collected and compiled to draw table functions, as shown in Figure 4.
- (4)
- Constants
In a simulation model, constants include the service price and the market scale initial value, where the service price represents the ratio of operating income to cargo throughput of Shanghai Port Group, as shown in Equation (4). As shown in Table 2, according to the operating income and cargo throughput data from 2013 to 2018, the average service price in the past six years is CNY 50/ton using Formula (4).
The initial value of the market scale constant in the model is the total volume of China’s port cargo throughput in 2013. According to the 2014 China Port Statistical Yearbook, the initial market size was 11.767 billion tons.
4.2. Subsystem Simulation Results Analysis
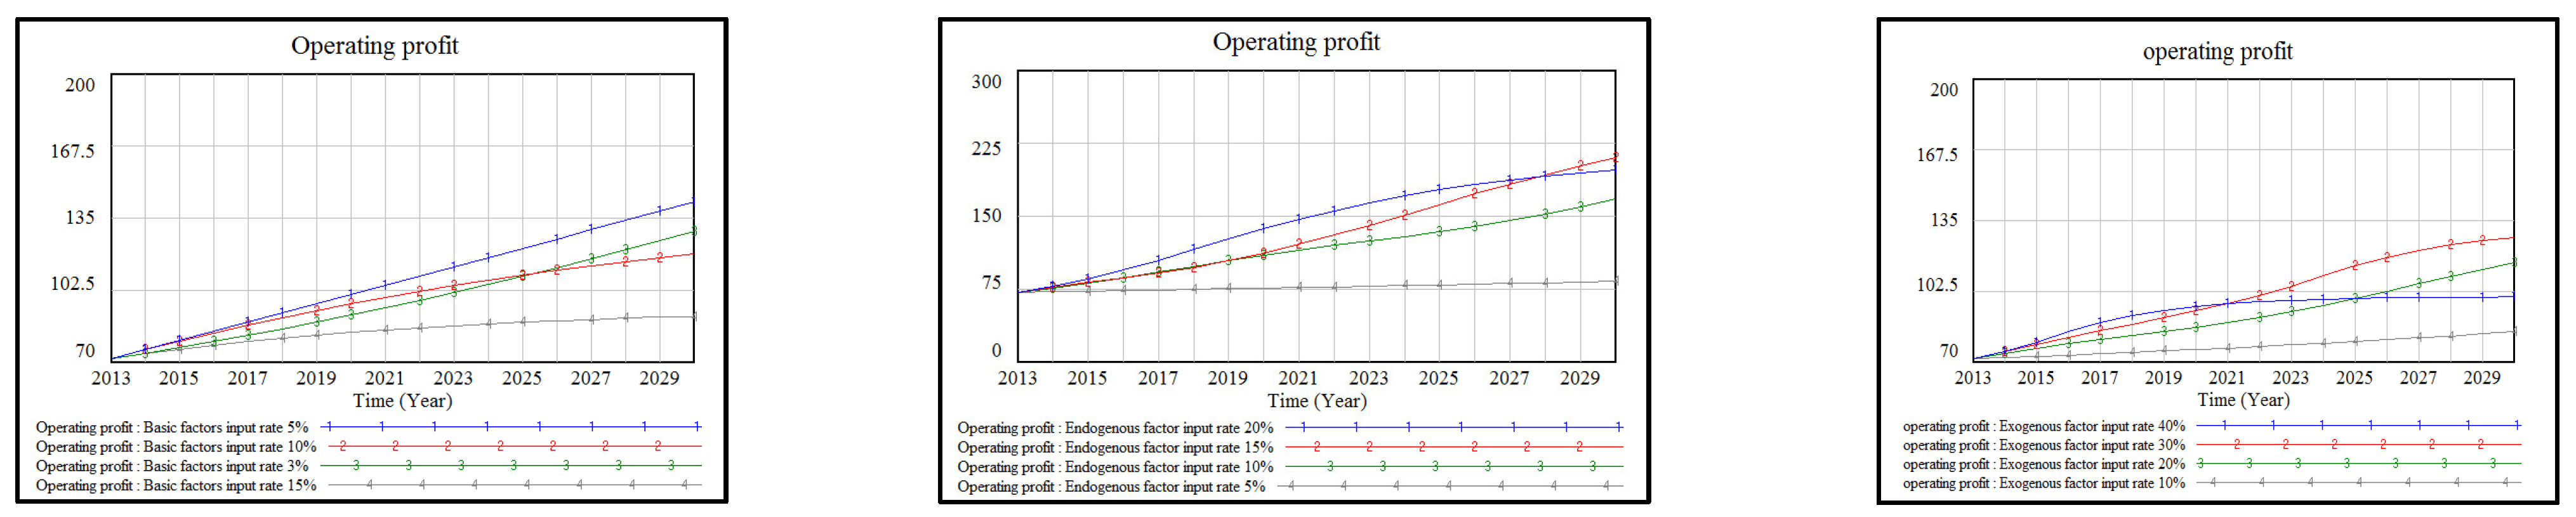
When simulating the basic factor subsystem, the endogenous factor input rate and the exogenous factor input rate are both set to 0, and then the simulation results are compared with the basic factor input rate as 3%, 5%, 10%, and 15%. When simulating the endogenous factor subsystem, the basic factor input rate and the exogenous factor input rate are both set to 0, the endogenous factor input rate is set to 5%, 10%, 15%, and 20%, and the simulation results are compared and analyzed. Similarly, when simulating the exogenous factors subsystem, the endogenous factor input rate and the basic factor input rate are both set to 0, the exogenous factor input rate is set to 10%, 20%, 30%, and 40%, and the simulation results are compared and analyzed, as shown in Figure 5.
As shown in Table 3, through the simulation analysis of each subsystem, the ranking of the different input rates of each factor on the operating profit of the enterprise is obtained, and the influence is weakened from I, II, III, and IV. The subsystem simulation results show that when the endogenous factor input rate is 15%, the endogenous factor subsystem has the strongest ability; when the basic factor input rate is 5%, the basic factor subsystem has the strongest ability; when the exogenous factor input rate is 30%, the exogenous factor subsystem has the strongest ability.
4.3. Total System Simulation Results Analysis
- (1)
- Simulation of total system input rate combination with optimal single-factor subsystem
As shown in Table 4, combination A is the input rate combination under the condition of optimal endogenous factor input rate (15%), which conforms to the upper limit constraint of overall input rate, where the basic factor input rate and exogenous factor input rate are determined to maximize the overall operating profit of the system. The overall effect is the greatest. In the same way, combination B is the input rate combination when the basic factor input rate is optimal (5%), and the input rates of endogenous factors and exogenous factors are determined according to the goal of maximizing the overall operating profit of the system. Combination C is the input rate combination when the input rate of exogenous factors is the optimal (30%). Considering the resource limitations, the upper limit of the total input rate is 30%, so the input rate both of endogenous factor and basic factor in this combination are 0. The combination “current” is a combination of various factors input rates obtained according to the actual investment situation of Shanghai Port Group in the past six years.
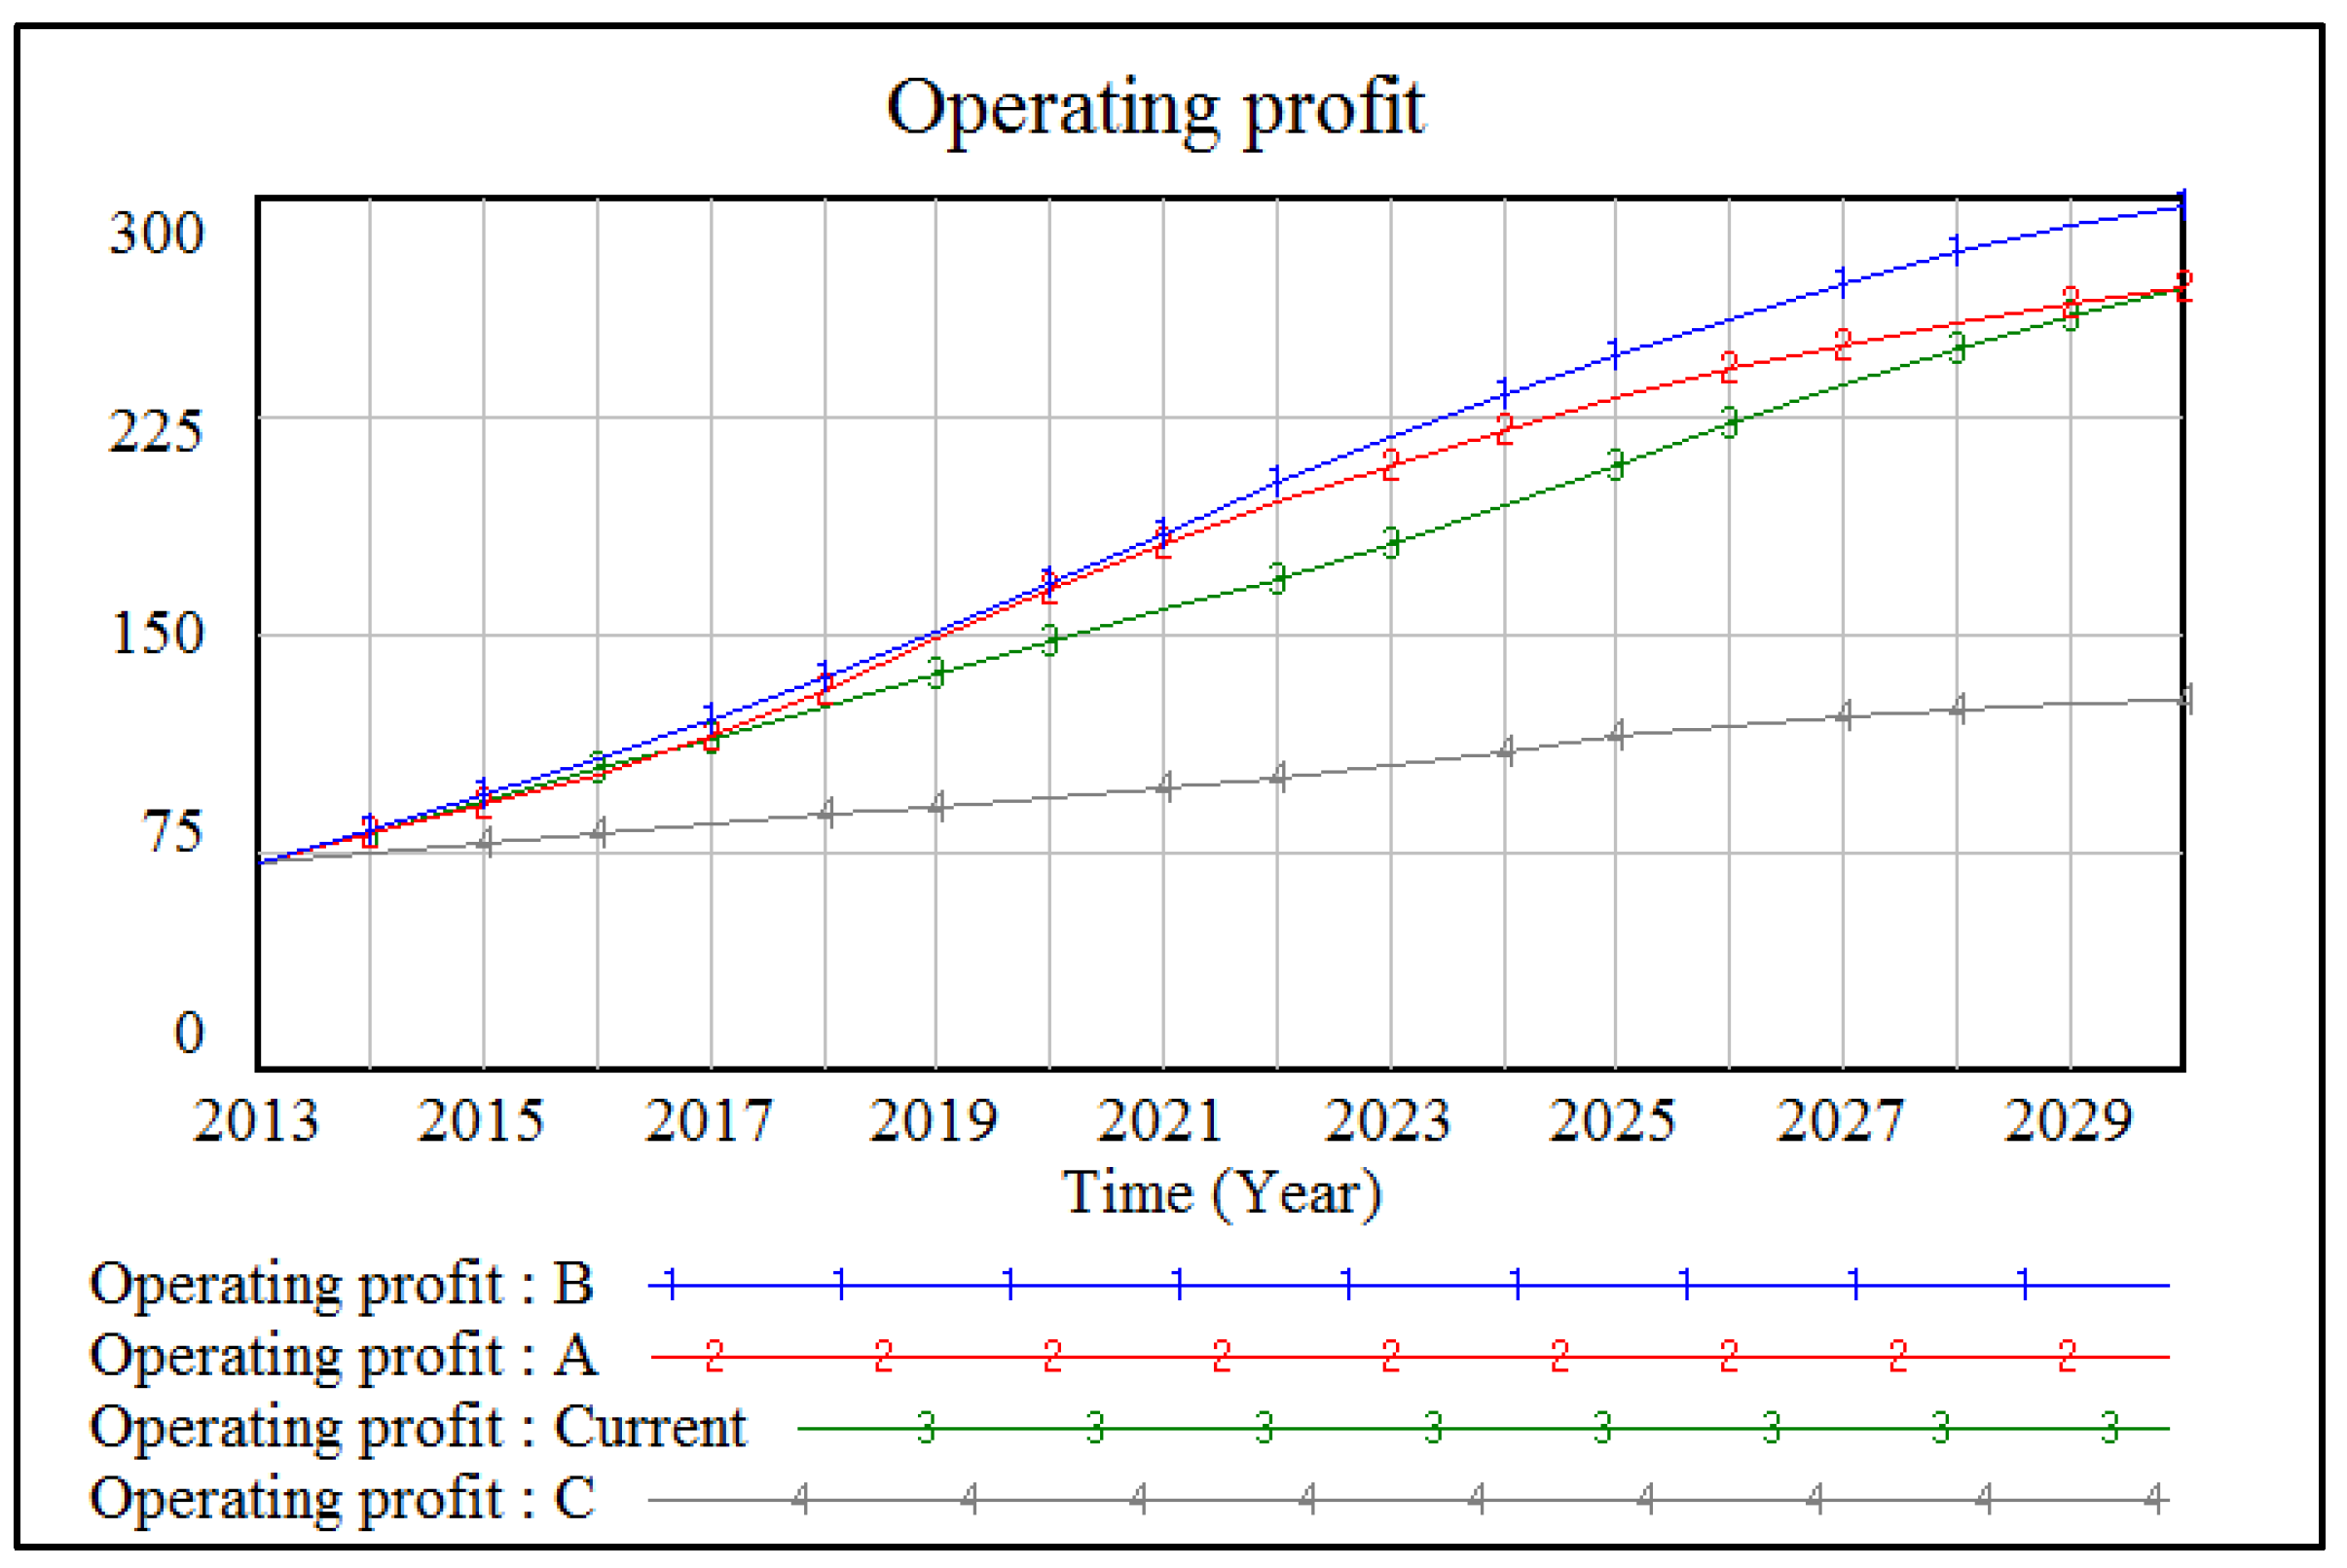
The four groups of input rate combination in Table 4 were, respectively, brought into the model for simulation, and the results are shown in Figure 6.
It can be seen from Figure 6 that combination B, represented by the blue curve No. 1, has the strongest influence on the business profit of the enterprise, and combination A, represented by the red curve No. 2, has the second strongest influence on the business profit. Moreover, both combination A and combination B have a higher influence on the operating profit of enterprises than the current combination. The gray curve No. 4 represents combination C, and its influence on the operating profit is significantly lower than the other three combinations. The reason for this may be that combination C is the single-factor input subsystem, while combination A, combination B, and the combination current are the mixed input of the three factors. Therefore, in order to explain the phenomenon, the operating profit under the condition of combination current or the input rate of optimal single-factor subsystem were simulated, and the input rates are shown in Table 5.
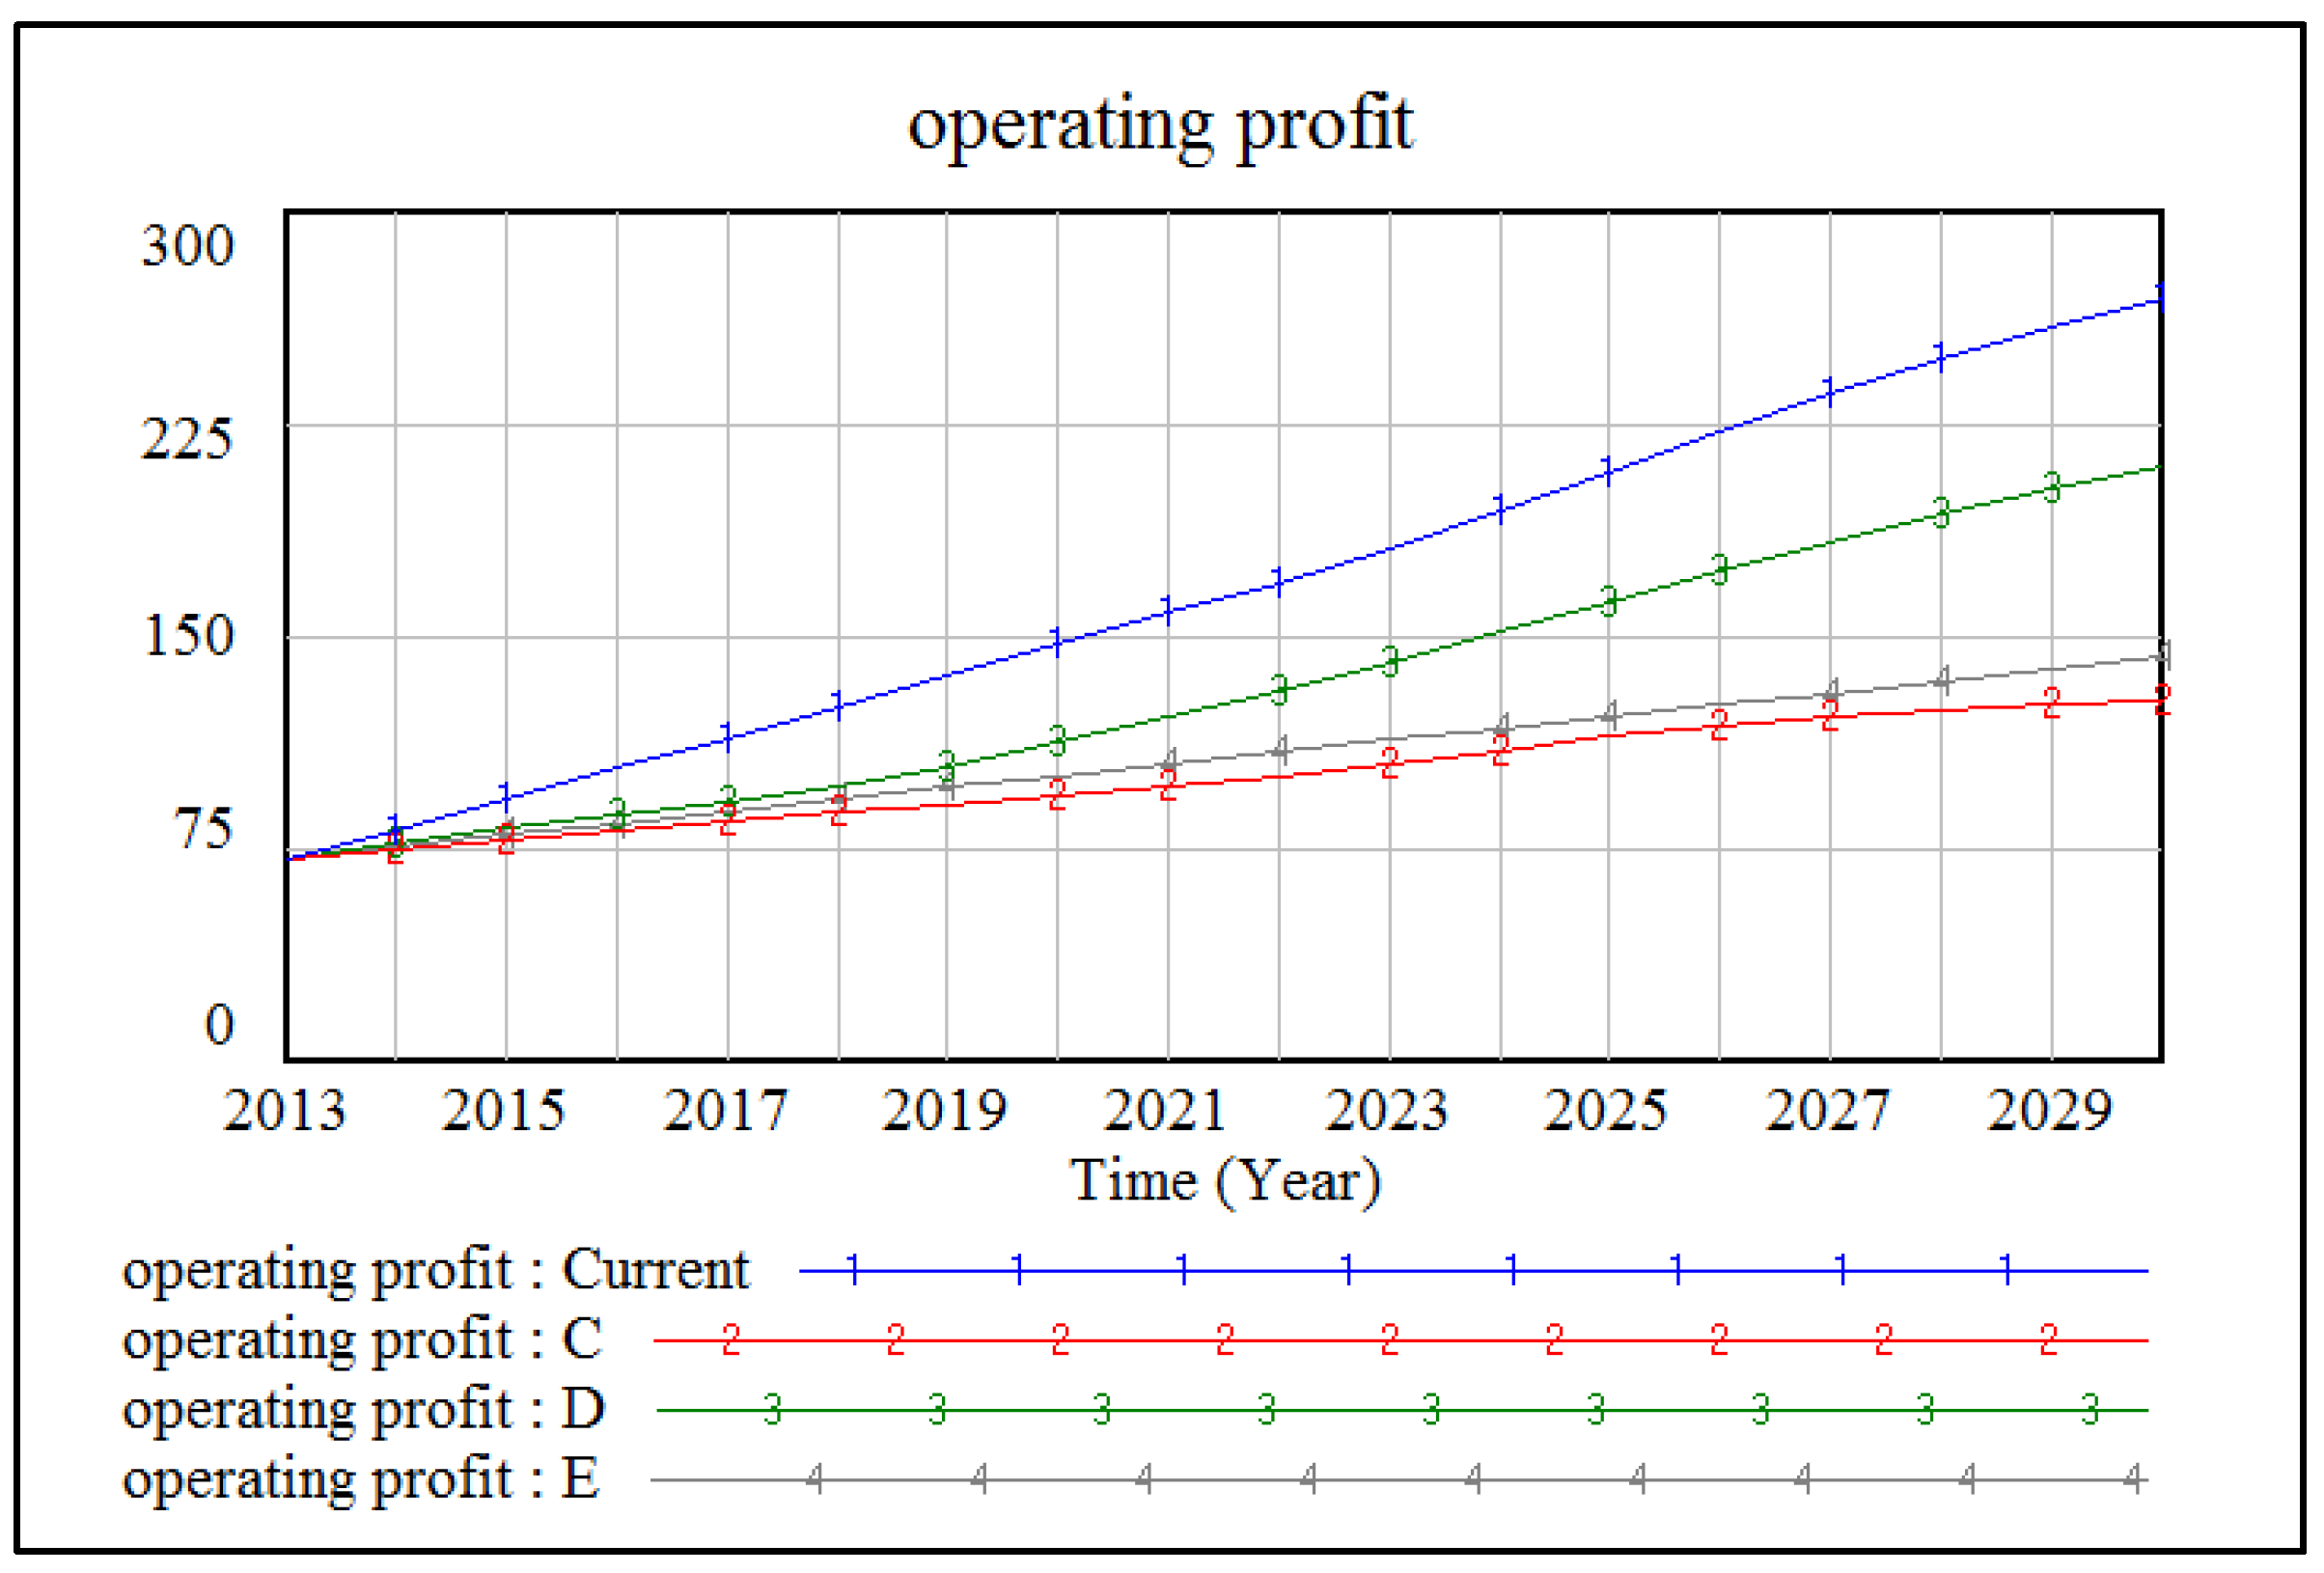
The four groups of input rate combination in Table 5 were brought into the model for simulation, and the results are shown in Figure 7.
From Figure 7, it can be seen that the operating profits under the condition of combination C, combination D, and combination E are significantly lower than that under the combined current. Combined with Figure 6, the influences of the combinations C, D, and E are obviously lower than that of combinations A and B, indicating that the influence of single-factor subsystem input on operating profit is significantly lower than that of three factors’ combined input.
Based on the above simulation analysis of total system input rate combination under the condition of optimal single-factor subsystem, it is found that the operating profit would be the largest when the optimal condition of the single-factor subsystem is combination B, that is, the endogenous factor input rate is 13%, the basic factor input rate is 5%, and the exogenous factor input rate is 12%.
- (2)
- Simulation of total system input rate combination with optimal overall perspective
Based on the above the analysis of the input rate combination under the optimal input rate of the single-factor subsystem, combined with the model constraints, this paper explores the optimal input rate combination of the total system, as shown in Table 6.
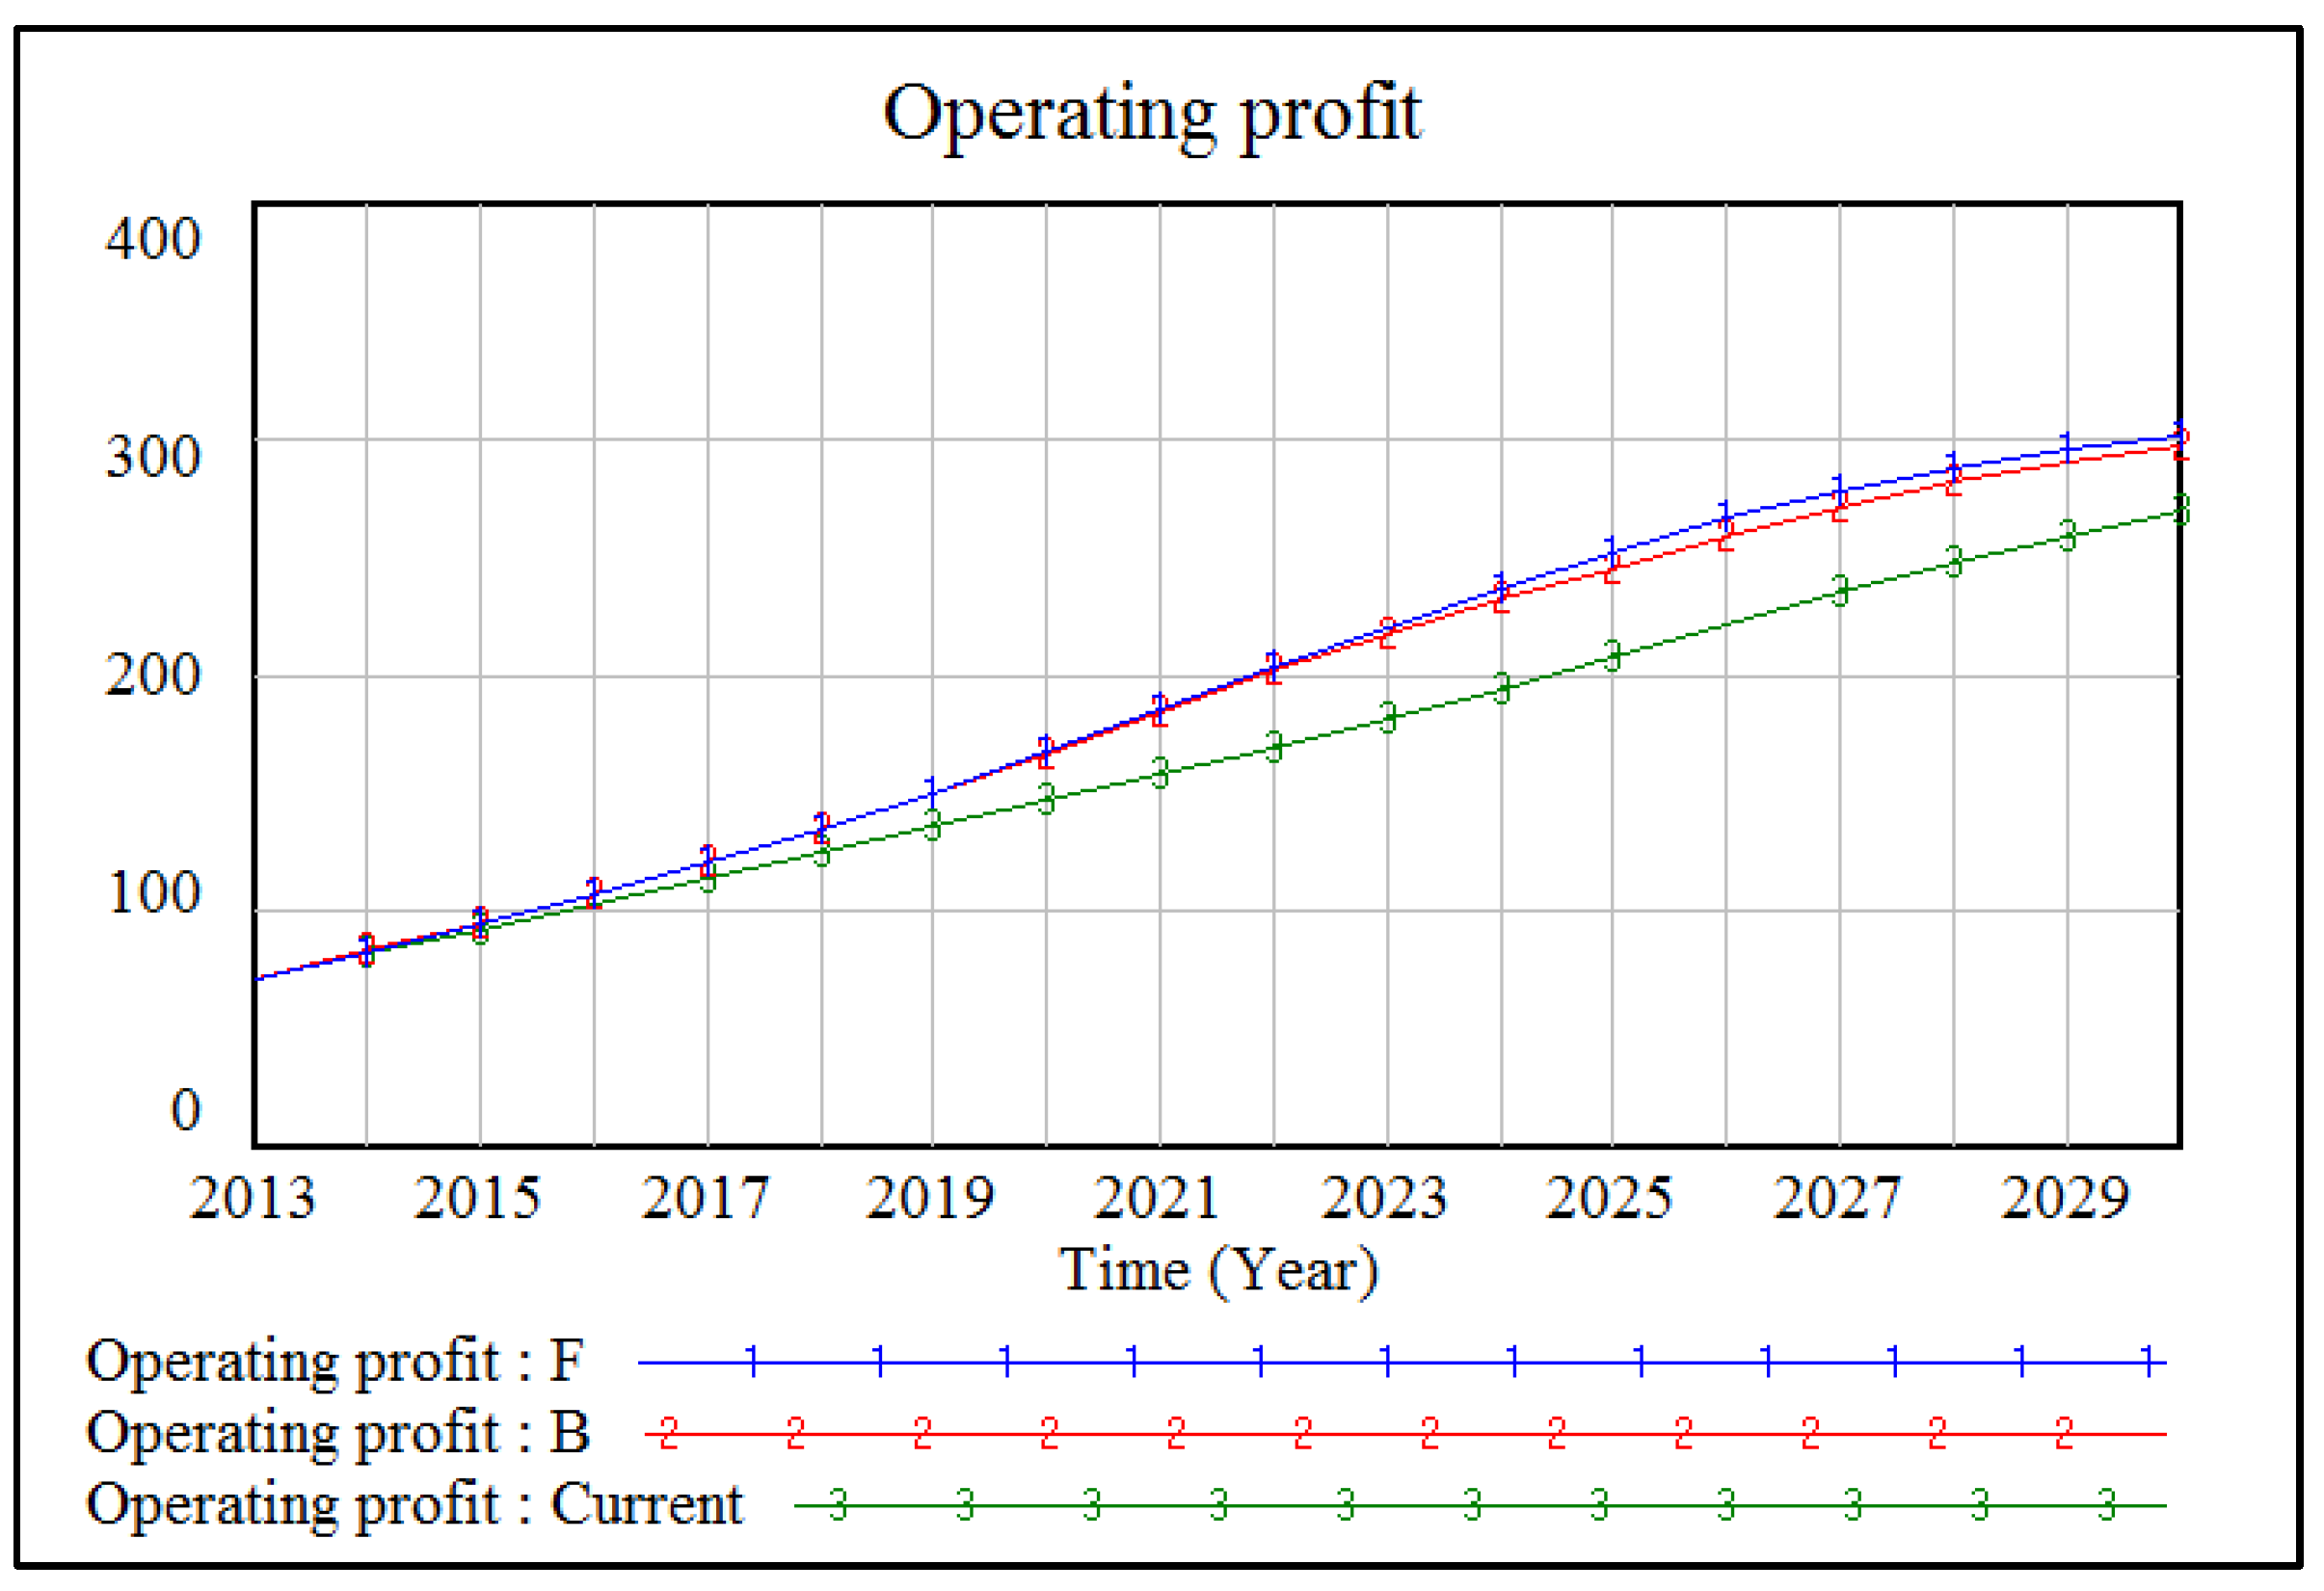
The three groups of input rates in Table 6 were brought into the model for simulation, and the results are shown in Figure 8. The influence of the input rate combination F, represented by the blue curve No. 1, on the operating profit of the enterprise is greater than that of combination B, indicating that when the factor input is distributed from the perspective of the total system, with 13% endogenous factor input, 4% basic factor input, and 13% exogenous factor input, the enterprise can obtain the maximum operating profit, and the simulation result under the combination F is better than the combination current, which represents the actual situation.
The comparative analysis of the above research results reveals that investing in various value chain segments of port enterprises can enhance their operating profits. However, there is a phenomenon of diminishing marginal returns on investment in value chain segments, and this phenomenon is more pronounced in the investment in single-factor subsystems. Compared to investment in single-factor subsystems, investing in multiple-factor subsystems can bring more profits. At the same time, in the optimal investment combination, the proportions of investment in endogenous and exogenous factor subsystems are notably higher than that in basic factor subsystems. In addition, investing in the endogenous factor subsystem can significantly improve the operating efficiency of port enterprises, investing in the basic factor subsystem can expand the business scope of port enterprises, and investing in exogenous factor subsystems can strengthen the core competitiveness of port enterprises.
5. Conclusions
At present, port enterprises in China are facing the unfavorable situation of constraints from the international high-end shipping service industry and intensified homogeneous competition in the domestic market. This article applies value chain theory and system dynamics methods to build a simulation model, providing a new perspective on how ports use Free Trade Zone policies to deal with contradictions. The introduction of the system dynamics model provides the possibility to quantitatively study the value-added effect of port enterprise value chains. The main conclusions of the study are as follows: (1) Free Trade Zone policies play a significant role in promoting the restructuring of the value chain and the transformation and upgrading of port enterprises. (2) According to the value chain theory, port business processes are decomposed into supportive value activities, foundational value activities, and external value activities. Moreover, considering the impact of Free Trade Zone policies and limited resources, the overall benefits to port enterprises from combined investments are superior to those from single-factor investments. (3) Investments in the three types of value activities contribute to improving the operational efficiency, expanding the business scope, and strengthening the core competitiveness of port enterprises. (4) Using Shanghai Port as an example, the optimal profit is achieved when the endogenous factor investment rate is 13%, basic factor investment rate is 4%, and exogenous factor investment rate is 13%. (5) The proportions of investment in the three factors also suggest that, under the backdrop of Free Trade Zone policies, it is crucial for business development to meet customer demands and enhance internal operational efficiency. Simultaneously, optimizing aspects such as information, logistics, and production is also necessary. The results of the research provide a decision-making basis for Chinese port enterprises to reconstruct the enterprise value chain in the current environment, and a feasible reference path for the transformation and upgrading of Chinese port enterprises. Additionally, the method proposed in this paper, which combines the theory of value chain with system dynamics, can effectively investigate the impact of significant policy issuance on enterprise operations management. It provides robust solutions for enterprises to clarify core value chains and investment strategies. For example, reducing greenhouse gas emissions has become a common problem for mankind around the world. Countries around the world have introduced corresponding policies to guide the operation and management of enterprises in high-emission industries. In this context, the application of the research method proposed in this article can subdivide carbon emission policies and decompose corporate production activities. Furthermore, the influence relationship between policies and production links can be established. Afterwards, the system dynamics method is used to conduct simulation analysis on different scenarios to provide countermeasures and suggestions for corporate operation management, investment decisions, transformation, upgrading, etc.
The International Shipping Center is a world-class financial and trade hub centered around ports and their host cities. Free Trade Zone policies have a significant impact on the development of ports and port cities into global shipping centers. Therefore, future research can be conducted from two aspects: Free Trade Zone policy and international shipping center construction.
Author Contributions
Conceptualization, M.W. and H.K.; methodology, M.W., H.K. and P.J.; software, M.W. and S.Z.; validation, M.W., P.J. and S.Z.; formal analysis, M.W. and P.J.; investigation, M.W., H.K., P.J. and S.Z.; resources, M.W., H.K. and P.J.; data curation, M.W. and S.Z.; writing—original draft preparation, M.W. and S.Z.; writing—review and editing, M.W., H.K., P.J. and S.Z.; visualization, M.W. and S.Z.; supervision, M.W. and H.K.; project administration, M.W. and H.K.; funding acquisition, P.J. and H.K. All authors have read and agreed to the published version of the manuscript.
Funding
The authors acknowledge the National Key Research and Development Project (Grant No. 2023YFB4302200), the National Natural Science Foundation of China (71831002, 72173013, 72174035, 72072018), Liaoning Revitalization Talents Program (NO.XLYC2008030).
Data Availability Statement
Data are contained within the article.
Conflicts of Interest
The authors declare no conflict of interest.
References
- Talley, W.K.; Ng, M.; Marsillac, E. Port service chains and port performance evaluation. Transp. Res. Part E Logist. Transp. Rev. 2014, 69, 236–247. [Google Scholar] [CrossRef]
- Yu, M.; Shan, J. Game research on competition and cooperation relationships in regional port groups. Oper. Res. Manag. 2014, 23, 93–100. [Google Scholar]
- Bing, H.; Min, W.; Tingting, H.; Fangming, L. Extending strategy of port enterprise value chain based on infra-marginal utility model. ACTA Tech. 2017, 62, 507–516. [Google Scholar]
- Chen, J.; Wan, Z.; Zhang, F.; Park, N.-K.; Zheng, A.; Zhao, J. Evaluation and comparison of the development performances of typical free trade port zones in China. Transp. Res. Part A Policy Pract. 2018, 118, 506–526. [Google Scholar] [CrossRef]
- Yu, M.; Xu, Z.; Zhu, H. The motivations and paths for the construction of free trade ports in my country under the background of counter-globalization. Jianghai Acad. J. 2018, 2, 108–113. [Google Scholar]
- Michael, P. Competitive Advantage: Creating and Sustaining Superior Performance; FreePress: New York, NY, USA, 1985. [Google Scholar]
- Vitsounis, T.K.; Pallis, A.A. Port Value Chains and the Role of Interdependencies; Song, D., Panayides, P.M., Eds.; Emerald Group Publishing Limited: Bingley, UK, 2012; pp. 155–174. [Google Scholar]
- Robinson, R. Ports as elements in value-driven chain systems: The new paradigm. Marit. Policy Manag. 2002, 29, 241–255. [Google Scholar] [CrossRef]
- Hoa, H.T.T.; Haasis, H. Improving value chain through efficient port logistics. Management 2017, 5, 321–335. [Google Scholar]
- Poulsen, R.T.; Ponte, S.; Sornn-Friese, H. Environmental upgrading in global value chains: The potential and limitations of ports in the greening of maritime transport. Geoforum 2018, 89, 83–95. [Google Scholar] [CrossRef]
- Liu, Y.; Dong, E.; Li, S.; Jie, X. Cruise tourism for sustainability: An exploration of value chain in Shenzhen Shekou Port. Sustainability 2020, 12, 3054. [Google Scholar] [CrossRef]
- Han, B.; Zhang, P.; Kuang, H.; Jia, P. Port enterprise value chain division of labor strategy based on niche selection. Syst. Eng. Theory Pract. 2018, 38, 1024–1034. [Google Scholar]
- Han, B.; Zhang, P.; Kuang, H.; Wan, M. Screening of Port Enterprise Value Chain Routines Based on Evolution Equilibrium. Wirel. Pers. Commun. 2018, 102, 861–878. [Google Scholar] [CrossRef]
- Wan, M.; Kuang, H.; Yu, Y.; Zhang, R. Evaluation of the competitiveness of the container multimodal port hub. Sci. Rep. 2022, 12, 19334. [Google Scholar] [CrossRef]
- Wan, Z.; Zhang, Y.; Wang, X.; Chen, J. Policy and politics behind Shanghai’s Free Trade Zone Program. J. Transp. Geogr. 2014, 34, 1–6. [Google Scholar] [CrossRef]
- Krugman, P. The move toward Free Trade Zones. Econ. Rev. 1991, 76, 5. [Google Scholar]
- Harahap, R.R.; Ardianto, B. Pengaturan Pengawasan Lalu Lintas Barang Pada Free Trade Zone Ditinjau Dari The Revised Kyoto Convention 1999. J. Sains Sosio Hum. 2019, 3, 228–238. [Google Scholar] [CrossRef]
- Keshavarzian, A. Geopolitics and the Genealogy of Free Trade Zones in the Persian Gulf. Geopolitics 2010, 15, 263–289. [Google Scholar] [CrossRef]
- Pak, A.; Majd, F. Integrated coastal management plan in Free Trade Zones, a case study. Ocean Coast. Manag. 2011, 54, 129–136. [Google Scholar] [CrossRef]
- Aloise, P.G.; Macke, J. Eco-innovations in developing countries: The case of Manaus Free Trade Zone (Brazil). J. Clean. Prod. 2017, 168, 30–38. [Google Scholar] [CrossRef]
- Guo, B. The impact of Free Trade Zone construction (FTZs) on food security under the. J. Inf. Syst. Eng. Manag. 2023, 8, 21645. [Google Scholar]
- Yang, Y. A comparative analysis of Free Trade Zone policies in Taiwan and Korea based on a port hinterland perspective. Asian J. Shipp. Logist. 2009, 25, 273–303. [Google Scholar] [CrossRef]
- Meng, G.; Wang, H.; Yang, S. Dynamic mechanism of development and evolution of Tianjin Pilot Free Trade Zone. Acta Geogr. Sin. 2015, 70, 1552–1565. [Google Scholar]
- Notteboom, T.; Yang, Z. Port governance in China since 2004, Institutional layering and the growing impact of broader policies. Res. Transp. Bus. Manag. 2017, 22, 184–200. [Google Scholar] [CrossRef]
- Zhang, X. Planning of the New Trade Zone and its Perspective on the Ecological Economy: Case Study Fujian. Open House Int. 2017, 42, 35–39. [Google Scholar] [CrossRef]
- Zhuo, C.; Mao, Y.; Rong, J. Policy dividend or “policy trap”? Environmental welfare of establishing Free Trade Zone in China. Sci. Total Environ. 2021, 756, 143856. [Google Scholar] [CrossRef]
- Jiang, Y.; Wang, H.; Liu, Z. The impact of the Free Trade Zone on green total factor productivity—Evidence from the shanghai pilot Free Trade Zone. Energy Policy 2021, 148, 112000. [Google Scholar] [CrossRef]
- Hu, H.; Wang, S.; He, J. Comparative advantages of free trade port construction in shanghai under the belt and road initiative. Int. J. Financ. Stud. 2020, 8, 6. [Google Scholar] [CrossRef]
- Li, S.; Liu, J.; Kong, Y. Pilot Free Trade Zones and Chinese port-listed companies performance: An empirical research based on quasi-natural experiment. Transp. Policy 2021, 111, 125–137. [Google Scholar] [CrossRef]
- Guan, C.; Huang, J.; Jiang, R.; Xu, W. The impact of pilot Free Trade Zone on service industry structure upgrading. Econ. Anal. Policy 2023, 78, 472–491. [Google Scholar] [CrossRef]
- Liu, J.; Wang, X.; Guo, J. Port efficiency and its influencing factors in the context of Pilot Free Trade Zones. Transp. Policy 2021, 105, 67–79. [Google Scholar] [CrossRef]
- Fan, G.; Xie, X.; Chen, J.; Wan, Z.; Yu, M.; Shi, J. Has China’s Free Trade Zone policy expedited port production and development? Mar. Policy 2022, 137, 104951. [Google Scholar] [CrossRef]
- Lin, F.; Xiaodong, L.; Adolf, K.Y.; Peng, J.; Haibo, K.; Xingxing, Z. Can port systems be enhanced by government promotion? The case of port cooperation along the maritime silk road. Ocean. Coast. Manag. 2023, 242, 106669. [Google Scholar]
- Jiang, M.; Zhao, S.; Jia, P. The spatial spillover effect of seaport capacity on export trade: Evidence from China pilot Free Trade Zones. Ocean. Coast. Manag. 2023, 245, 106879. [Google Scholar] [CrossRef]
- Kotir, J.H.; Smith, C.; Brown, G.; Marshall, N.; Johnstone, R. A system dynamics simulation model for sustainable water resources management and agricultural development in the Volta River Basin, Ghana. Sci. Total Environ. 2016, 573, 444–457. [Google Scholar] [CrossRef]
- Kamran, M.A.; Kia, R.; Goodarzian, F.; Ghasemi, P. A new vaccine supply chain network under COVID-19 conditions considering system dynamic: Artificial intelligence algorithms. Socio-Econ. Plan. Sci. 2023, 85, 101378. [Google Scholar] [CrossRef] [PubMed]
- Layani, G.; Mehrjou, S.; Farajzadeh, Z. Effects of government policies reform on environmental sustainability: An integrated approach of PMP and system dynamics simulation model. J. Clean. Prod. 2023, 426, 138985. [Google Scholar] [CrossRef]
- Li, Y.; Liang, C.; Ye, F.; Zhao, X. Designing government subsidy schemes to promote the electric vehicle industry: A system dynamics model perspective. Transp. Res. Part A Policy Pract. 2023, 167, 103558. [Google Scholar] [CrossRef]
- Shafiee, S.; Jahanyan, S.; Ghatari, A.R.; Hasanzadeh, A. Developing sustainable tourism destinations through smart technologies: A system dynamics approach. J. Simul. 2023, 17, 477–498. [Google Scholar] [CrossRef]
- Liu, G.; Xu, Y.; Ge, W.; Yang, X.; Su, X.; Shen, B.; Ran, Q. How can marine fishery enable low carbon development in China? Based on system dynamics simulation analysis. Ocean. Coast. Manag. 2023, 231, 106382. [Google Scholar] [CrossRef]
- Pan, J.; Yang, S.; Shen, F. Construction and simulation of port-city coupled system model based on system dynamics—Taking Lianyungang as an example. Syst. Eng. Theory Pract. 2012, 32, 2439–2446. [Google Scholar]
- Liu, J.; Wang, X.; Chen, J. Port congestion under the COVID-19 pandemic: The simulation-based countermeasures. Comput. Ind. Eng. 2023, 183, 109474. [Google Scholar] [CrossRef]
- Shepherd, S.P. A review of system dynamics models applied in transportation. Transp. B Transp. Dyn. 2014, 2, 83–105. [Google Scholar] [CrossRef]
Figure 1.
Analysis of value links and influencing factors of port enterprises.

Figure 2.
The causal-loop diagram.

Figure 3.
Total system factor flow diagram.

Figure 4.
Table functions of the exogenous ability influence, the Free Trade Zone policy influence, and operational efficiency influence.
Figure 4.
Table functions of the exogenous ability influence, the Free Trade Zone policy influence, and operational efficiency influence.

Figure 5.
Comparison of operating profit under the condition of different factor input rate.

Figure 6.
Operating profit comparison under different factor input rate combinations.

Figure 7.
Operating profit comparison under single-factor subsystem input rate.

Figure 8.
Comparison of operating profit under combined input conditions.


Table 1.
Feedback loop.
| Loop 1: Reinforcing feedback | Endogenous factors↑→Operation ability/Coordination ability↑→Operation efficiency↑→Market share↑→Traffic increment↑→Operating income increment↑→Operating profit↑→Endogenous factors↑ |
| Loop 2: Balancing feedback | Endogenous factors↑→Operating cost increment↑→Operating profit↓→Endogenous factors↑ |
| Loop 3: Reinforcing feedback | Basic factors↑→Finance/Trade/Information/Industry/Logistics↑→Business Scope↑→Market share↑→Traffic increment↑→Operating income increment↑→Operating profit↑→Basic factors↑ |
| Loop 4: Balancing feedback | Basic factors↑→Operating cost increment↑→Operating profit↓→Basic factors↑ |
| Loop 5: Reinforcing feedback | Exogenous factors↑→Competitive power/Customer demand satisfaction↑→Exogenous ability↑→Market share↑→Traffic increment↑→Operating income increment↑→Operating profit↑→Exogenous factors↑ |
| Loop 6: Balancing feedback | Exogenous factors↑→Operating cost increment↑→Operating profit↓→Exogenous factors↑ |
Table 2.
Shanghai Port Group Service Price List from 2013 to 2018.
| Years | 2013 | 2014 | 2015 | 2016 | 2017 | 2018 |
|---|---|---|---|---|---|---|
| Operating income (CNY 100 million) | 281.62 | 287.79 | 295.11 | 310.59 | 354.24 | 380.43 |
| Cargo throughput (100 million tons) | 5.87 | 5.89 | 5.98 | 5.89 | 6.89 | 7.59 |
| Service price (CNY/ton) | 47.97 | 48.86 | 49.34 | 52.73 | 51.40 | 50.01 |
Table 3.
Scale of impact on business profit of enterprises under different input rate conditions.
| Grade | Endogenous Factor | Basic Factor | Exogenous Factor |
|---|---|---|---|
| Ⅰ | 15% | 5% | 30% |
| Ⅱ | 20% | 3% | 20% |
| Ⅲ | 10% | 10% | 40% |
| Ⅳ | 5% | 15% | 10% |
Table 4.
Input rate combination with optimal single-factor subsystem.
| Combination | Endogenous Factor | Basic Factor | Exogenous Factor |
| Combination A | 15% | 6% | 9% |
| Combination B | 13% | 5% | 12% |
| Combination C | 0 | 0 | 30% |
| Current | 10.86% | 9.1% | 9.98% |
Table 5.
Input rate of optimal single-factor subsystem.
| Combination | Endogenous Factor | Basic Factor | Exogenous Factor |
|---|---|---|---|
| Combination D | 15% | 0 | 0 |
| Combination E | 0 | 5% | 0 |
| Combination C | 0 | 0 | 30% |
| Current | 10.86% | 9.1% | 9.98% |
Table 6.
Input rate combination of the total system.
| Combination | Endogenous Factor | Basic Factor | Exogenous Factor |
|---|---|---|---|
| Combination B | 13% | 5% | 12% |
| Combination F | 13% | 4% | 13% |
| Current | 10.86% | 9.1% | 9.98% |
Disclaimer/Publisher’s Note: The statements, opinions and data contained in all publications are solely those of the individual author(s) and contributor(s) and not of MDPI and/or the editor(s). MDPI and/or the editor(s) disclaim responsibility for any injury to people or property resulting from any ideas, methods, instructions or products referred to in the content. |
© 2024 by the authors. Licensee MDPI, Basel, Switzerland. This article is an open access article distributed under the terms and conditions of the Creative Commons Attribution (CC BY) license (https://creativecommons.org/licenses/by/4.0/).
Share and Cite
MDPI and ACS Style
Wan, M.; Kuang, H.; Jia, P.; Zhao, S. Research on the Decision Making of Value Chain Reconstruction of Chinese Port Enterprises under the Background of Free Trade Zone Policy. Systems 2024, 12, 91. https://doi.org/10.3390/systems12030091
AMA Style
Wan M, Kuang H, Jia P, Zhao S. Research on the Decision Making of Value Chain Reconstruction of Chinese Port Enterprises under the Background of Free Trade Zone Policy. Systems. 2024; 12(3):91. https://doi.org/10.3390/systems12030091
Chicago/Turabian StyleWan, Min, Haibo Kuang, Peng Jia, and Sue Zhao. 2024. "Research on the Decision Making of Value Chain Reconstruction of Chinese Port Enterprises under the Background of Free Trade Zone Policy" Systems 12, no. 3: 91. https://doi.org/10.3390/systems12030091
Note that from the first issue of 2016, this journal uses article numbers instead of page numbers. See further details here.