Abstract
In the face of increasingly severe global climate change, achieving zero-carbon development goals has gradually become a consensus across various industries. Enhancing the electrification level of building energy use and increasing the proportion of renewable energy applications are primary means to achieve zero-carbon development in the construction sector, which also imposes higher demands on energy system planning and operation. This study focuses on urban building clusters and district energy systems, proposing coordinated optimization methods for energy supply and demand. On the demand side, strategies such as utilizing energy storage from electric vehicles are applied to enhance the flexibility of building energy use, along with methods to improve building load leveling rates and increase renewable energy penetration rates. On the supply side, a dual-layer planning method is proposed for the optimal configuration and operation of district energy systems considering the construction of shared energy storage stations. Results indicate that the optimization methods for urban building clusters significantly improve the flexibility of building energy use, and different functional compositions of building clusters can enhance load leveling and renewable energy penetration rates to a certain extent. The dual-layer optimization method for district energy systems can further exploit the potential of building energy flexibility, thereby achieving a balance between economic and environmental benefits.
1. Introduction
Urban buildings are significant consumers of final energy consumption. In developed countries such as the European Union and the United States, the primary energy consumed by buildings accounts for over 40% of the total primary energy consumption [1]. As countries have introduced carbon neutrality strategies, achieving zero-carbon use of building energy has emerged as a new developmental demand. Among them, the widespread adoption of renewable energy has become a pivotal solution for realizing zero-carbon development goals in the construction sector [2]. However, as the proportion of renewable energy sources such as solar photovoltaics increases, the intermittency and uncertainty of renewable energy pose challenges to the real-time supply–demand balance management of the grid [3]. Under the zero-carbon goal, issues such as the mismatch between renewable energy production and energy demand, as well as the low penetration rate of solar energy applications in urban buildings, are more pronounced.
District energy systems are considered effective conduits for improving the efficiency of renewable energy applications by converting solar energy, wind energy, geothermal energy, natural gas, and biomass energy into various forms of energy needed by consumers, thus enhancing comprehensive energy utilization efficiency and reinforcing the flexibility, safety, economy, and self-healing capacity of the energy supply system [4]. The core technologies for regional energy system applications encompass planning, design, and operational optimization, necessitating consideration of the intermittency, uncertainty, flexible system integration solutions, and diverse operation control strategies of renewable energy sources [5]. Among them, the two-level planning method, or two-stage planning method, is a commonly employed optimization approach for regional energy systems, wherein the upper-level planning, or first-stage planning, prioritizes multi-objective goals, such as minimizing construction costs, reducing environmental impacts, or maximizing installed renewable energy capacity, to determine the optimal system configuration. The lower-level, or second-stage planning, then focuses on optimizing the operation of the regional energy system, utilizing the flexibility of building energy usage to either maximize renewable energy consumption or minimize energy costs [5,6,7].
Compared to individual buildings, building clusters have demonstrated certain advantages in enhancing renewable energy self-consumption, reducing reliance on external grid energy, and boosting the penetration of renewable energy [8]. Caroline et al. propose a selection technique based on seasonal hourly energy load to identify, among optimal combinations of building mixtures, the scenario that will allow to reduce peak energy demands, thus avoiding a power surge of the grid, and prove that a reasonable proportion of building functions can help improve energy and environmental performance [9]. With the widespread integration of renewable energy in buildings, they transition from energy consumers to producers and suppliers. This enables multiple building prosumers within clusters to share surplus renewable energy with those facing inadequate power generation, thus enhancing the overall utilization rate of renewable energy [10]. To further explore the energy-sharing potential of building clusters, researchers have devised an optimization method focused on enhancing the energy sharing efficiency and operational performance of such clusters, thereby effectively enhancing their energy utilization. In this endeavor, numerous studies have employed electric vehicles as a means of energy storage, demonstrating their considerable impact on enhancing building energy flexibility, reducing operational expenses, and augmenting the consumption of renewable energy [11,12,13].
However, the majority of existing studies primarily concentrate on an individual building cluster, emphasizing the operational phase without delving deeper into the potential functional synergies among different building clusters. Furthermore, the optimization of a single building cluster’s operations often fails to establish an effective linkage with the architectural planning phase, revealing a lack of hierarchical optimization methods. The collaborative optimization method proposed in this study for urban building clusters and regional energy systems integrates the functional proportion method during the building planning stage and the optimal operation optimization method during the operational phase, alongside proposing a configuration and operational plan for the regional energy system. This comprehensive approach offers insights for building cluster planning and regional energy system configuration and operation, providing reference points for decision-making. The rest of this paper is organized as follows: Section 2 outlines the primary workflow of the research and details the specific content of the collaborative optimization method for urban building clusters and regional energy systems. Section 3 shows the optimization results through case simulation and analyzes the effectiveness of the optimization method. Finally, Section 4 summarizes the conclusions.
2. Materials and Methods
2.1. The Workflow of This Study
A building cluster refers to a collection of buildings within a designated area of a city, falling in scale between a single building and an urban area. It possesses a specific spatial extent and number of buildings, resembling a residential community, comprehensive business district, etc., comprising residential, public, or mixed-use buildings. Building clusters exhibit diverse characteristics, with their energy consumption levels influenced by factors such as building function and energy efficiency. Significantly, different functional types of building clusters demonstrate varying energy efficiency levels and consumption patterns, indicating substantial potential for optimization in energy usage operations, functional complementarity, and energy production and distribution coordination. This study took into account the comprehensive impact of various factors, such as the functions and layout of building clusters, on energy consumption in building, and established 12 prototypes of building clusters based on local climate zone (LCZ) [14], including 6 variants of residential building clusters differing in height and density, and 6 prototypes of public building clusters with various functions (Table 1). It represents a typical building cluster type in Beijing, a city located on the northwest edge of the North China Plain (latitude 39°26′ to 41°03′ N, longitude 115°25′ to 117°30′ E). The city experiences a warm-temperate continental monsoon climate, with the average temperature in the coldest month (January) being around −3.1 °C and in the hottest month (July) around 26.7 °C [15]. Based on the definitions and indicators of each LCZ type, LCZ 1–6 located within the built-up area were selected, representing compact high-rise building clusters, compact mid-rise building clusters, compact low-rise building clusters, as well as open high-rise building clusters, open mid-rise building clusters, and open low-rise building clusters [16]. Each building cluster occupies a land area of 300 m × 300 m. These prototypes can be arranged and combined to generate additional types of building clusters.

Table 1.
Building clusters prototype.
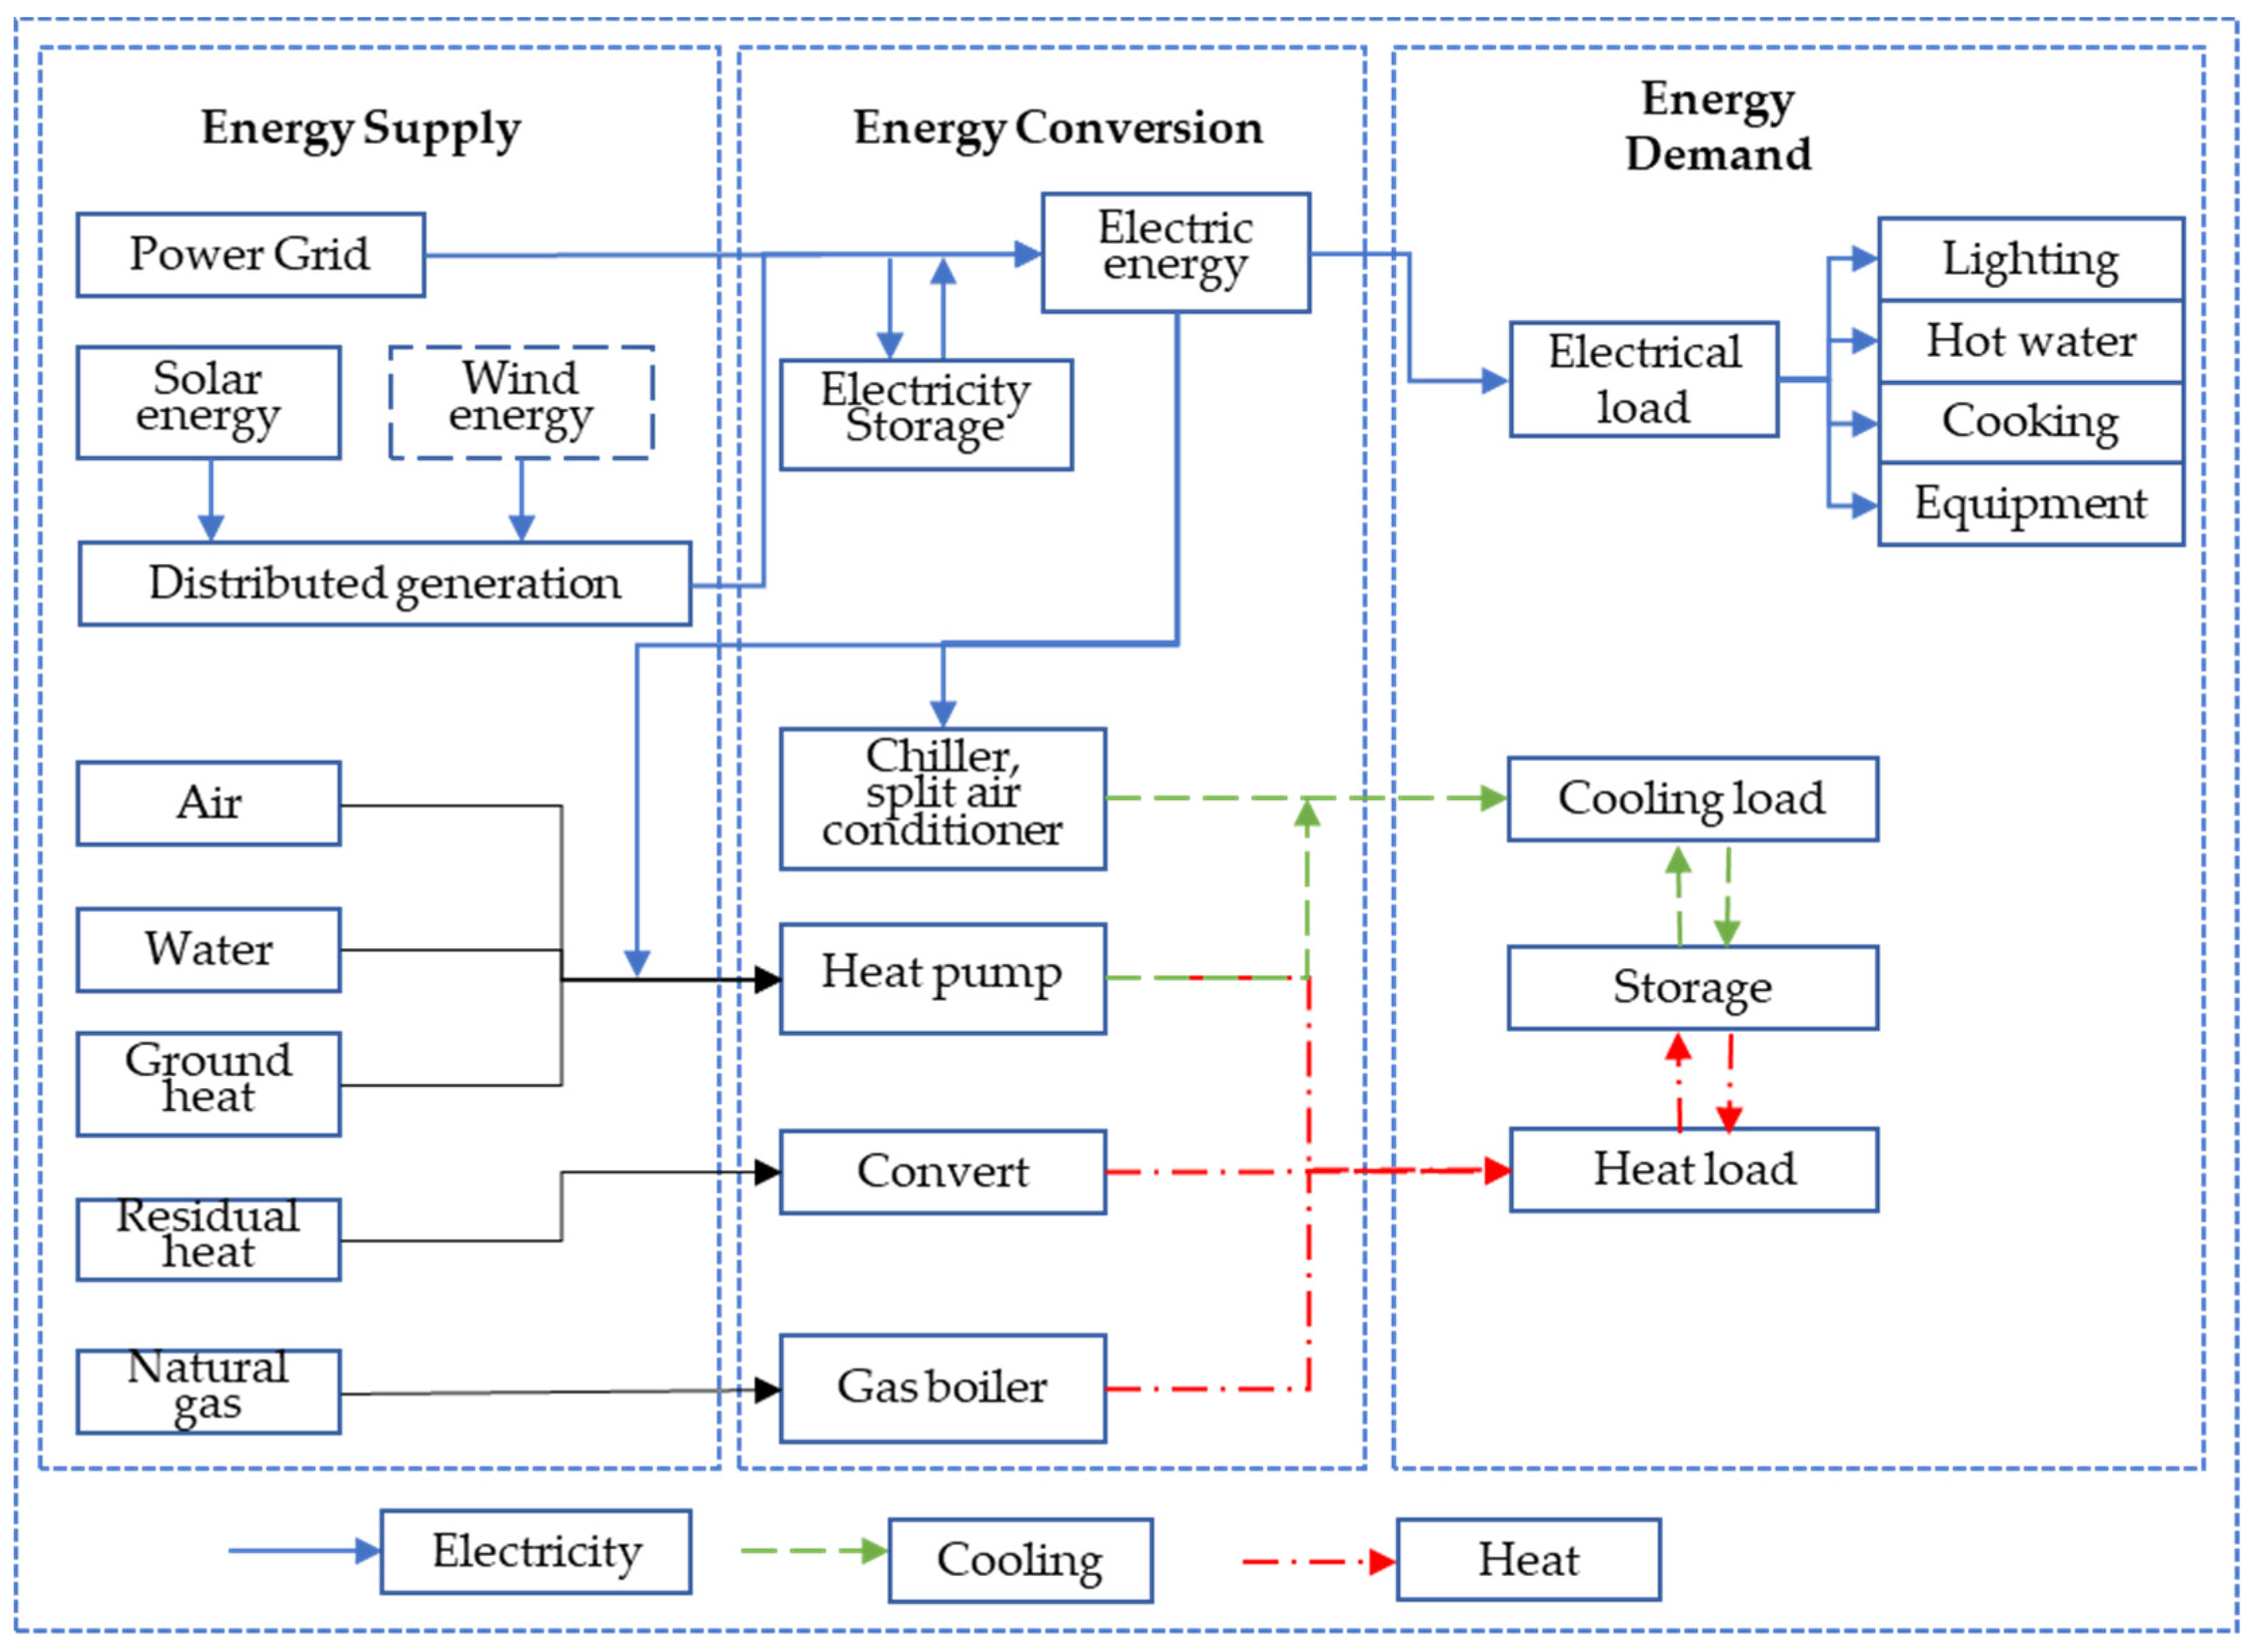
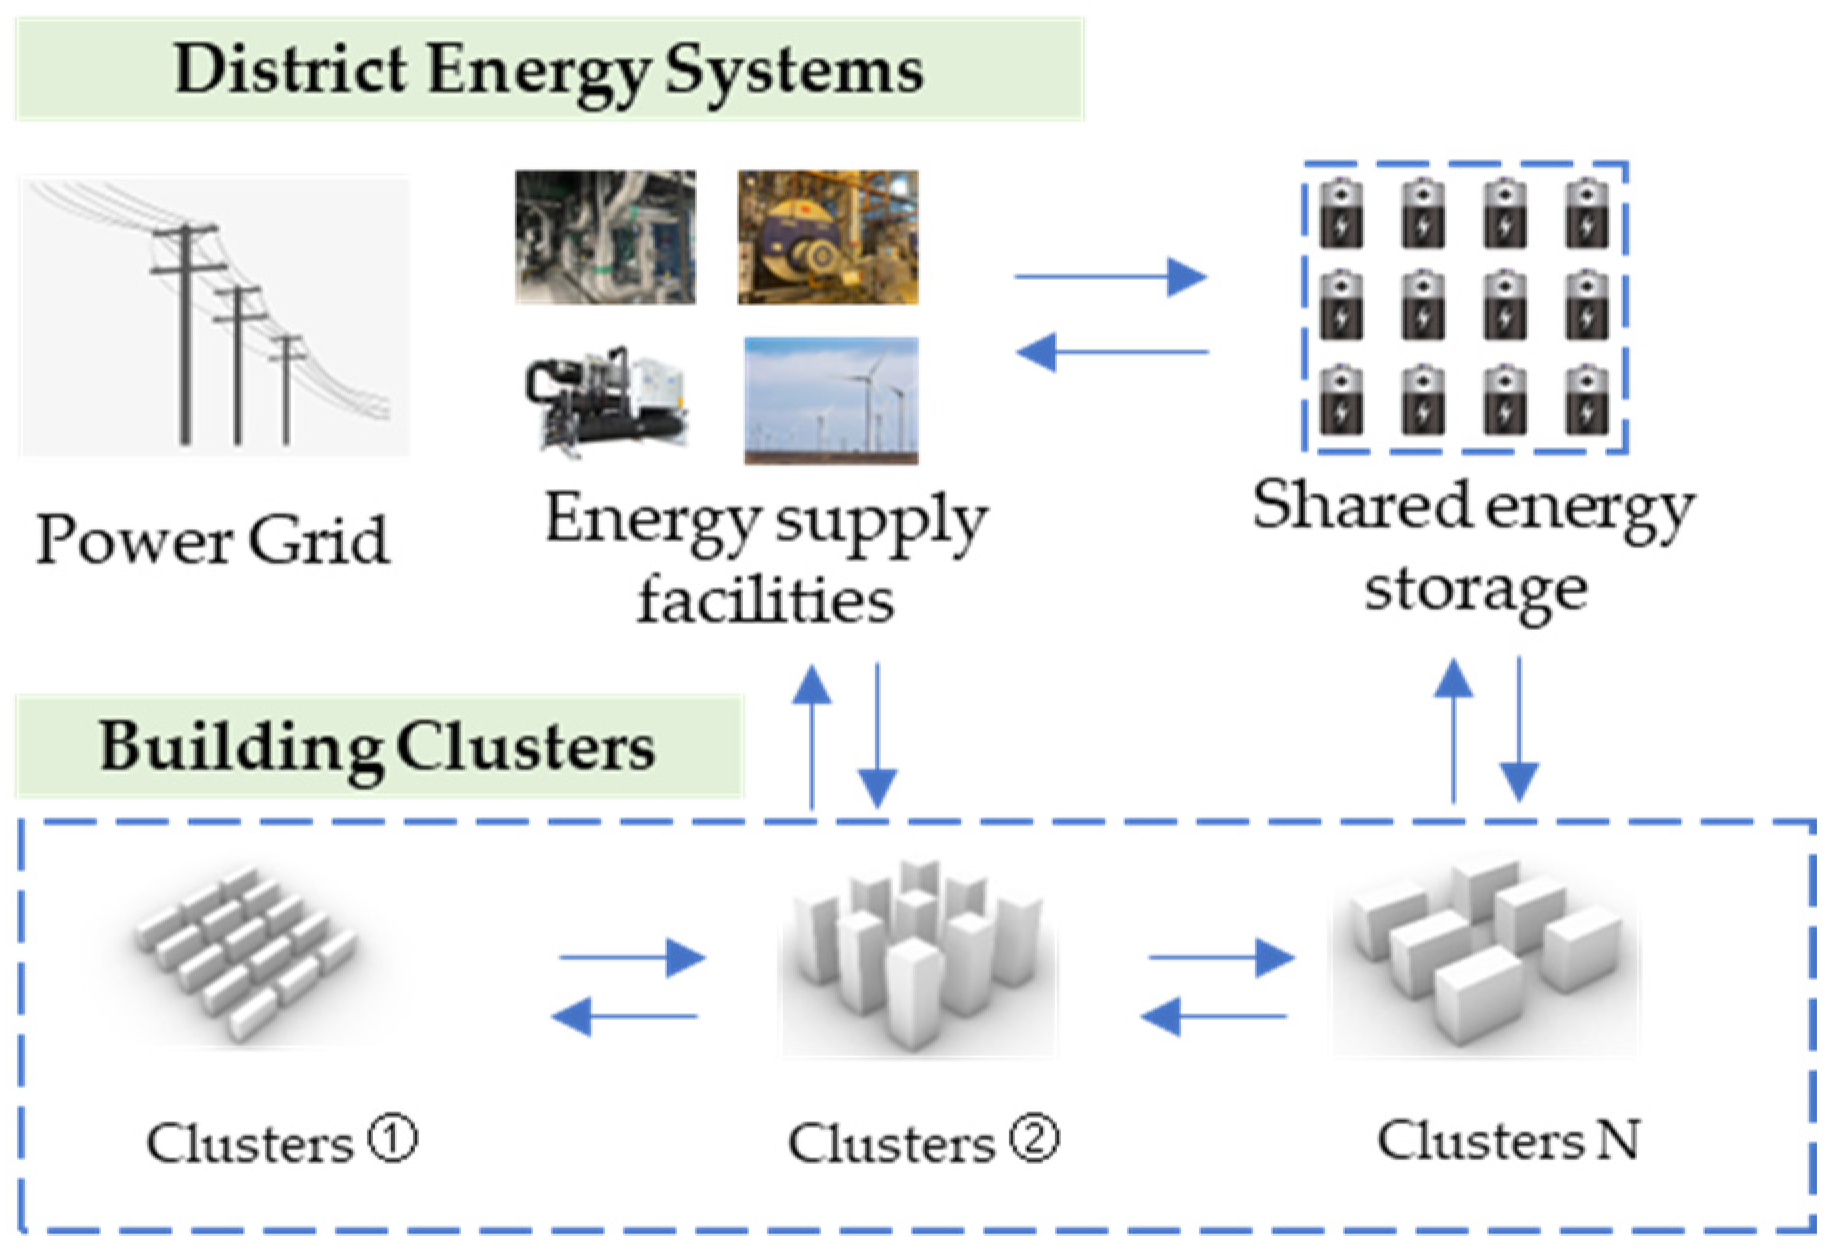
The energy consumption of building clusters is geared towards achieving low-carbon development objectives, which is exemplified by enhancing building energy efficiency to the fullest extent possible, maximizing the utilization of renewable energy sources, and transitioning to electrified building systems. The energy requirements of the building clusters, alongside the supporting regional energy supply, are depicted in Figure 1. Within this framework, the energy demand of the building clusters is segmented into three components: electrical load, cooling load, and heating load. Electrical energy is primarily sourced from renewable sources, such as solar and wind power, with any shortfall being supplemented by the external power grid. Cooling demands are met through heat pump systems, with any deficiencies addressed by chiller units and split air-conditioning systems. Meanwhile, any inadequacies in heating requirements are catered to by gas boiler systems.
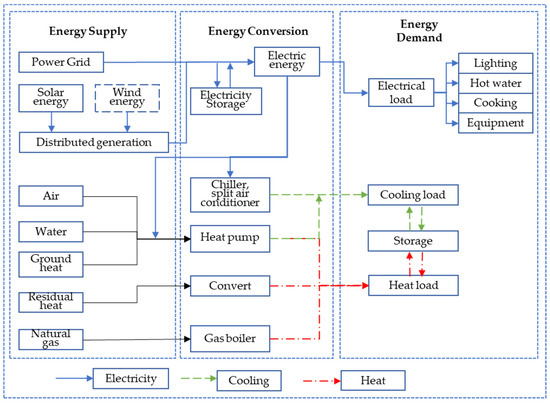
Figure 1.
Structure of regional energy system.
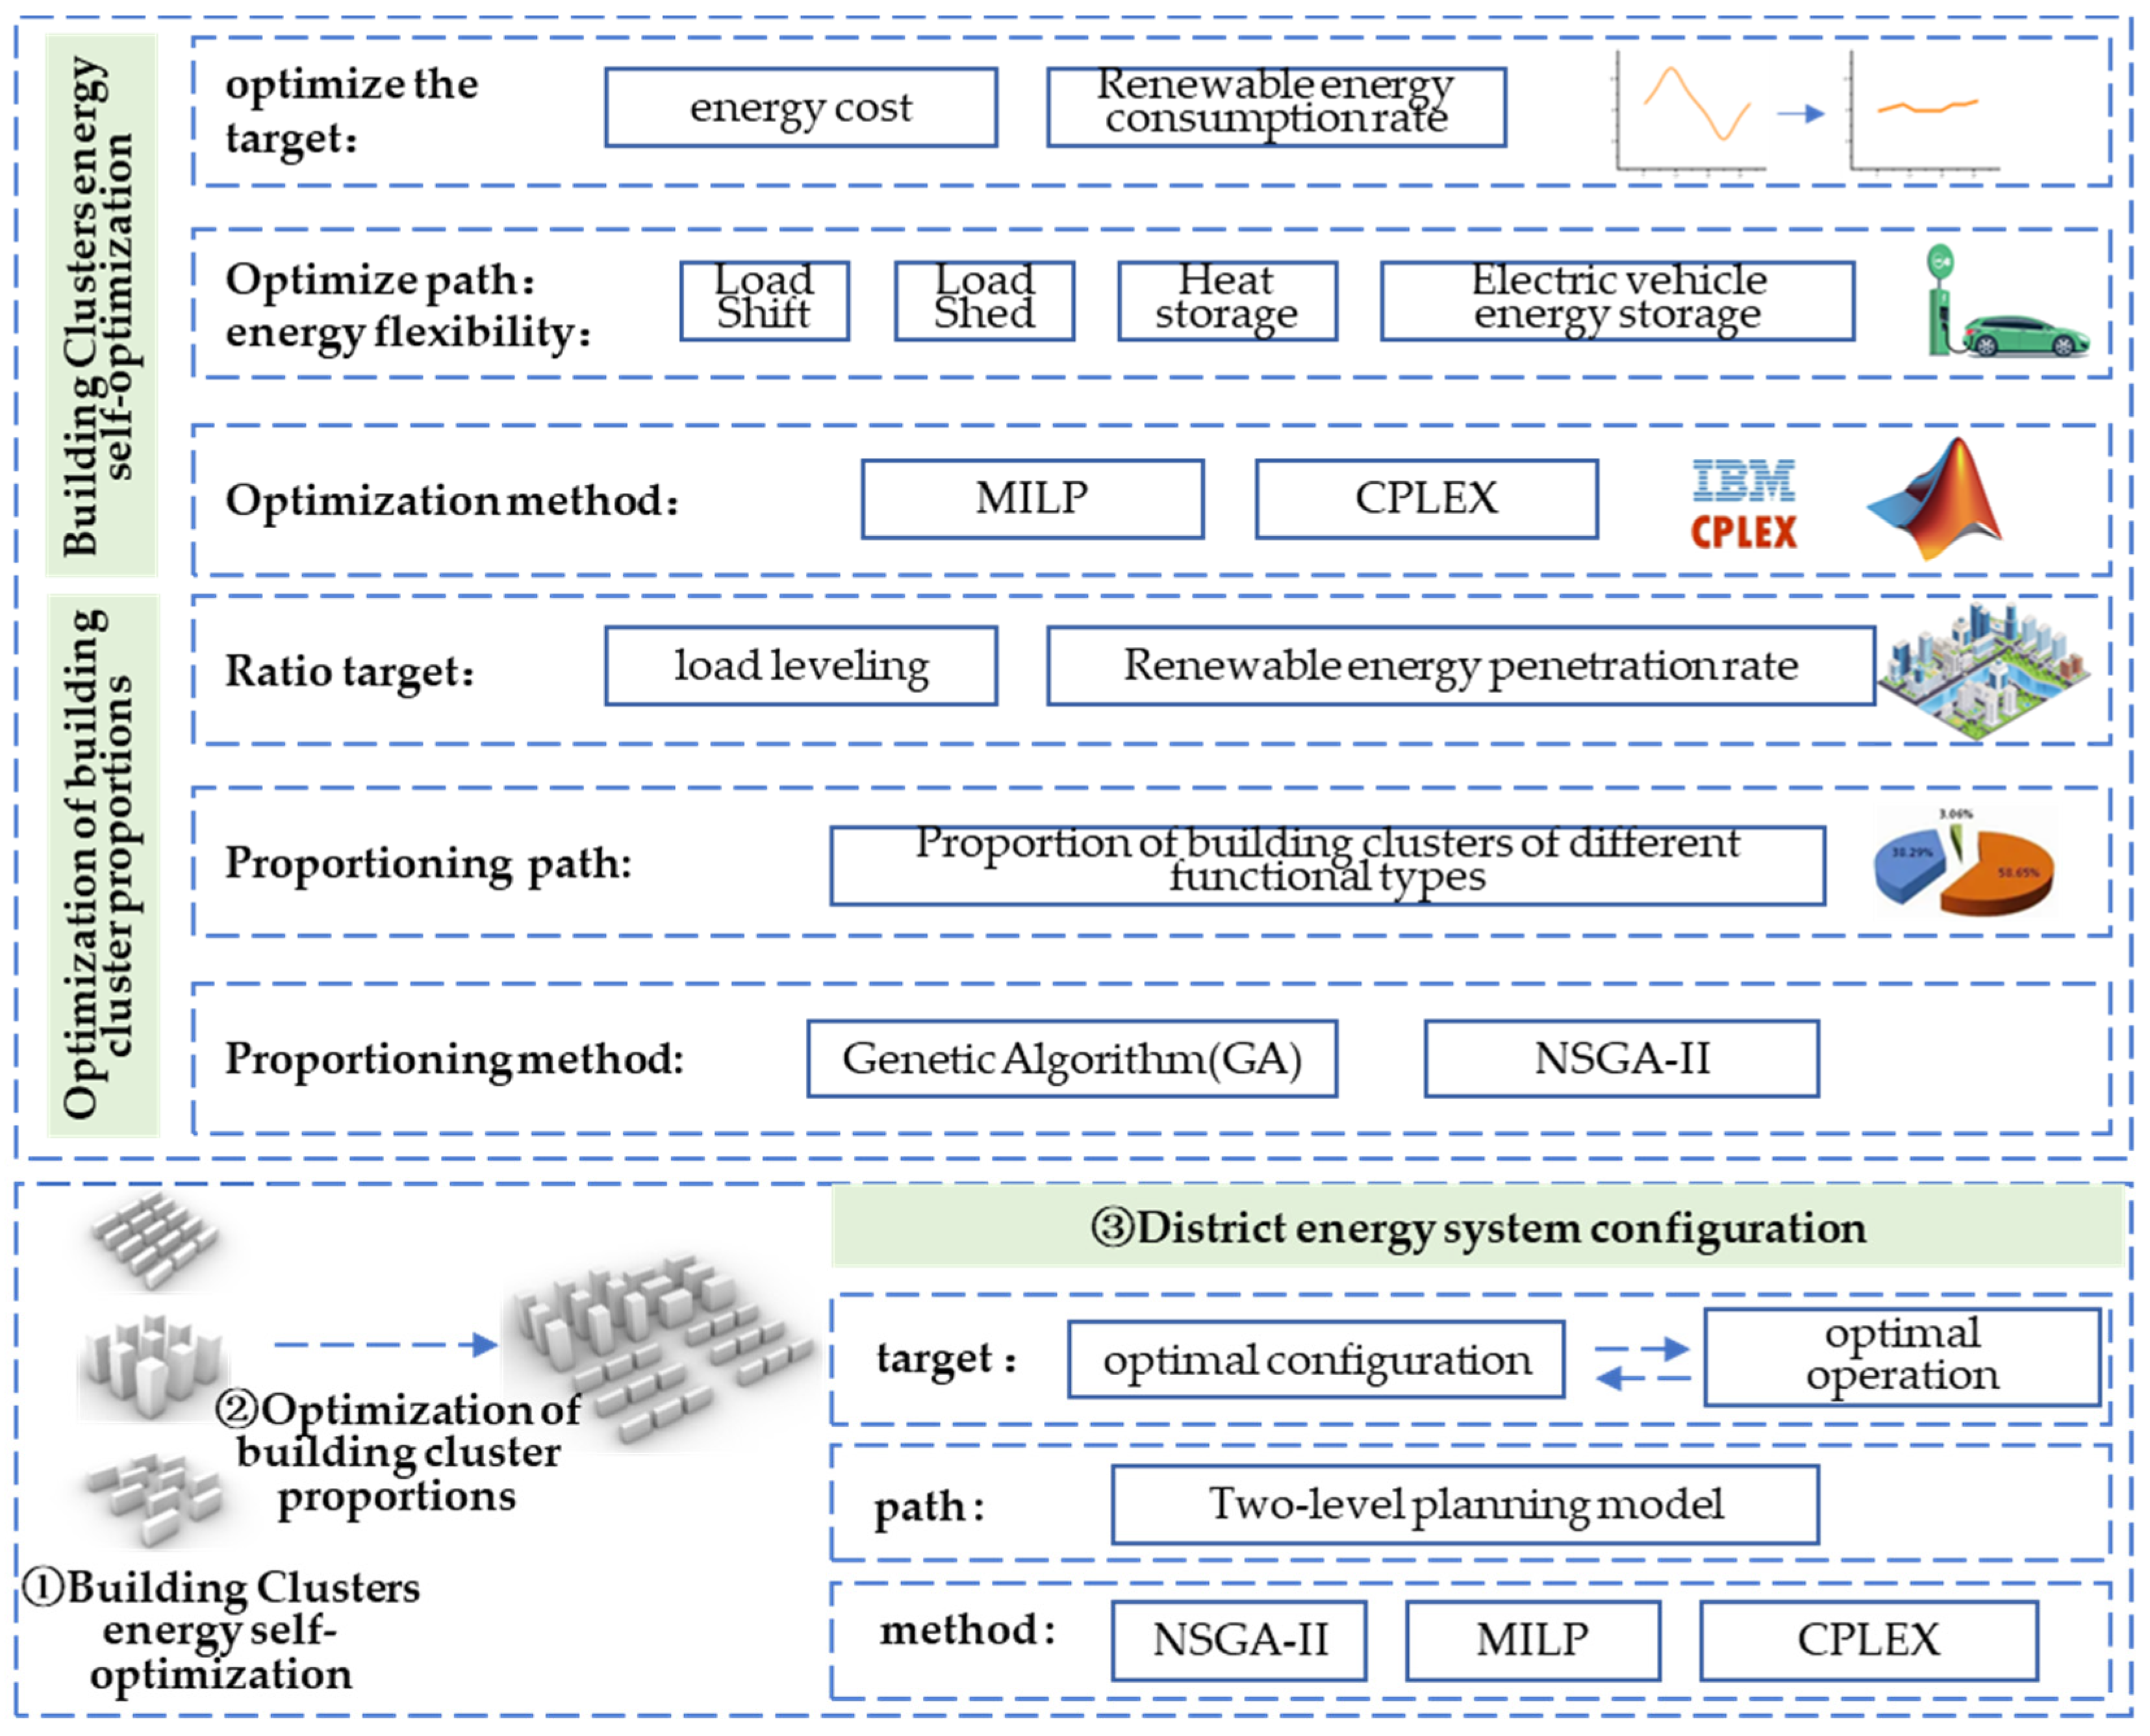
The collaborative optimization strategy for integrating building clusters energy systems with regional energy systems focuses on supply and demand dynamics. Building clusters’ energy consumption exhibits significant fluctuations and concentrated peaks, often diverging from renewable energy production capacity. Energy consumption optimization primarily leverages the flexibility of building energy usage through mechanisms such as time-of-use pricing. By shifting energy consumption from peak to off-peak hours, the strategy aims to smooth peaks and valleys. Notably, integrating energy storage systems plays a pivotal role in enhancing building energy flexibility. Leveraging existing infrastructure, particularly from electric vehicles, presents compelling economic and societal benefits compared to installing additional storage facilities within buildings. Consequently, the choice of energy storage options has become a focal point in current research endeavors [17]. Furthermore, different types of buildings exhibit distinct energy usage patterns and external energy requirements. Optimizing the functional composition of building clusters can contribute to overall energy optimization to a certain extent. The regional energy system configuration, based on these optimization principles, indeed offers substantial reductions in configuration costs. However, it remains essential to ascertain the appropriate capacity configuration for gas boilers, chillers, ground-source heat pump systems, and other components. This necessitates the pursuit of optimal solutions in both the planning and operation phases of the regional energy system. The workflow depicting these processes is illustrated in the Figure 2 below.
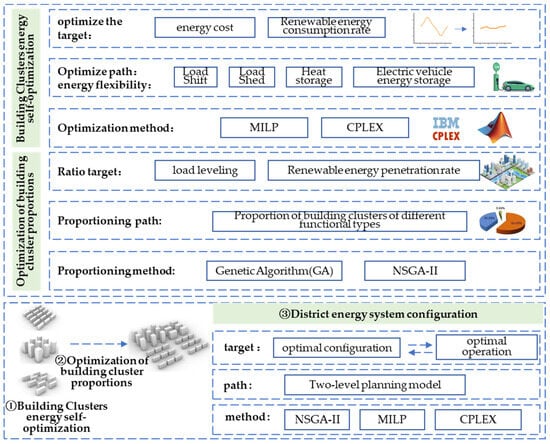
Figure 2.
General framework of collaborative optimization methods.
2.2. Energy Demand-Side Optimization Method for Building Clusters
2.2.1. Building Clusters Energy Self-Optimization
- Objective function
The optimization of energy consumption in building clusters seeks to maximize the utilization of building energy flexibility, enabling adjustments in energy consumption behaviors to achieve peak shaving, valley filling, and overall load leveling. In practical implementation, users are directed towards desired behaviors through the manipulation of time-of-use electricity pricing. The effectiveness of this guidance is most pronounced when users experience lower energy costs. Consequently, the lowest energy cost is the goal of internal optimization of the prototype. The objective function is articulated as follows:
where is the overall energy cost of the prototype building clusters; , represent electricity cost, heat cost, and energy storage cost, respectively; , and are the electricity, heat, and energy storage costs of the building clusters prototype at the i-th hour; and represent the electricity consumption and photovoltaic power generation in the i-th hour, respectively; , , and are the electricity price, photovoltaic grid price, and heat price at the i-th hour, respectively; represents the heat demand power of the building clusters prototype at the i-th hour; and is the maximum heat supply of the ground-source heat pump system at the i-th hour. In addition, the hourly electricity consumption of the building clusters is composed of j-type energy forms, such as lighting, electrical appliances, HVAC systems, cooking, etc., represented by , represent the charging and discharging power of the electric vehicle in the i-th hour, respectively. is also composed of hourly thermal power , hourly heat storage and hourly heat release power; and represent the unit power cost of electricity storage and heat storage, respectively.
- 2.
- Constraint conditions
Building energy optimization, grounded in energy flexibility, continues to require meeting diverse energy demands within the building. This entails fulfilling constraints related to electric energy flow balance, cold energy flow balance, and thermal energy flow balance. Furthermore, optimizing building energy consumption necessitates considering the capacity for installing energy storage and other relevant facilities.
represents the lighting load at time i, which is a typical load that can be reduced. It means that the lighting load can be reduced to times the base load . represents the transferable load at time i. This load typically originates from electrical appliances such as washing machines and dryers. Throughout the same cycle, the total transferable load remains constant.
Formulas (10)–(16) show the electric vehicle energy storage constraints, where represents the storage/release of electric energy power of the electric vehicle energy storage system at the i-th time. and respectively represent the charging\discharging power of the j-th electric vehicle at the i-th time. and represent the 0 and 1 charging/discharging state variables of the j-th electric vehicle at the i-th time. The number 0 represents that the equipment is not running, and 1 represents that the equipment is in charging/discharging operating state. The maximum charging\discharging power of the j-th electric vehicle at the i-th time are represented by and respectively.
Furthermore, the model does not account for the charging requirements of electric vehicles themselves. The electricity usage by electric vehicles is categorized as municipal electricity and is excluded from the power consumption scope of the building clusters prototype. Essentially, the charging process of the electric vehicle itself is disregarded, treating it solely as a means of energy storage. Throughout this process, the charging and discharging levels of the electric vehicle are balanced, with upper and lower limits on the total energy storage capacity. The formula is expressed as follows:
where represents the energy storage status of the j-th electric vehicle at the i-th hour, indicating the proportion of the total battery storage capacity that the j-th electric vehicle has stored at the i-th hour. To ensure the battery’s health and prolong its lifespan, the value of falls within the range of 0.2 to 0.8.
Thermal energy storage is a crucial component in enhancing building energy flexibility. This technology enables the concentrated storage and efficient utilization of thermal energy, thereby mitigating energy expenses. The constraint model for thermal energy storage systems is outlined as follows:
where is the energy storage power at time i, and and represents heat storage and heat release power, respectively. and represent the heat storage and heat release base power, respectively. and represent the maximum power of heat storage and heat release, respectively. and the 0 and 1 working state variables of the thermal storage system at time i, 0 represents that the equipment is not running, and 1 represents the running state of the equipment. represents the energy storage state of the thermal storage system, that is, the percentage of heat storage at time i to the total heat storage.
- 3.
- Model solution method
The decision variables in the energy consumption optimization model described above include electrical power, heat power, electric vehicle power storage and discharge status, electric vehicle power storage and discharge rate, as well as cold and heat storage status and power, among others, for the prototype users of the building clusters. The constraints include the electric power balance of lighting, hot water, home appliances, cooking, and other sub-items of energy consumption, electric vehicle energy storage charge and discharge balance constraints, cold storage and heat storage power constraints, etc.; the objective function is the lowest energy cost of the building cluster prototype. This model is a typical mixed-integer linear programming problem [18].
The mixed-integer linear programming problem is directly addressed utilizing the YALMIP platform within the MATLAB R2021a environment, leveraging the commercial software CPLEX v.12.6 solver. CPLEX is proficient in tackling a myriad of optimization problems, spanning linear programming, mixed-integer linear programming, quadratic programming, and more, boasting commendable stability and reliability. With an intuitive interface, the CPLEX solver seamlessly integrates with mathematical software such as MATLAB. Within MATLAB, integration with CPLEX via the YALMIP interface streamlines both the modeling and solution processes [19].
2.2.2. Optimization of Building Cluster Proportions
- Objective function
Load leveling: Load leveling necessitates the stable and uniform distribution of loads, preventing significant fluctuations in load peaks, valleys, and levels. This practice enhances the operational efficiency of building energy systems while concurrently diminishing the operating costs of energy systems. By strategically planning the building clusters, adjusting the ratio of different building types, and implementing mixed communities, it is feasible to achieve load leveling within the complex. Load leveling can be characterized by the ratio of the average load to the maximum load over a statistical period. However, while this method does provide insight into the concentration of the load to some extent, it does not effectively capture the temporal dispersion of the load. To capture the dynamic fluctuation characteristics of the load, the study accumulates the absolute differences between the hourly load values and the average load value, then calculates their ratio to the total load. This is expressed as follows:
where represents the load levelization rate of the building clusters, represents the load value of the building clusters at the i-th time, and represents the average value of the building load. The definition reveals that as the load levelization rate decreases, the degree of levelization increases, resulting in a flatter load curve. This makes it easier to maintain stability in the building energy system, mitigate peak energy loads, and reduce construction costs associated with the building energy system.
Renewable energy penetration rate: The renewable energy penetration rate refers to the proportion of renewable energy sources within the total energy supply of district energy systems.
where is the solar renewable energy penetration rate, is the shallow geothermal energy renewable energy penetration rate, and and are the total electricity and heat consumption of the building clusters. and are the total energy supply from solar energy and shallow geothermal energy. is the conversion factor.
- 2.
- Constraint conditions
The independent variable in optimizing the function ratio is the distribution proportion of various building prototypes within the building cluster. Assuming a building clusters comprises n different building prototypes, then there are the following formulas:
where is the proportion of prototypes in each building clusters.
- 3.
- Model solution method
The target load levelization rate is singular, leading to a single optimal solution. The solution variable pertains to the floor area proportion allocated to each building prototype within the group, with the sum of all variables equating to 1 and each variable falling within the range of [0, 1]. The core of resolving the load levelization rate objective lies in deriving an array whose total equals 1, ensuring the optimality of the objective function. This closely aligns with the problem-solving principle of the genetic algorithm.
The penetration rate of renewable energy in residential buildings notably surpasses that in public buildings. It is evident that maximizing the share of residential buildings, particularly low-density ones, can effectively enhance the penetration rate of renewable energy. Hence, mere enhancement of renewable energy utilization in buildings lacks substantial research and practical significance. A more pragmatic concern arises during the planning and construction phases of building clusters, where maintaining a certain proportion of public buildings or high floor area residential types is essential. Balancing renewable energy penetration with specific objectives such as public building proportion becomes a pertinent issue warranting further investigation. To address this, this section proposes a multi-objective optimization problem aiming to maximize both the penetration rate of renewable energy and the proportion of public buildings. This problem entails determining the prototype proportion of each public building cluster, where the sum of each variable equals 1, and the variable range lies between [0, 1]. NSGA-II is employed to resolve this optimization problem.
2.3. Energy Supply-Side District Energy System Configuration
After optimizing the energy utilization of the building clusters prototype and adjusting the functional ratio, there remains untapped potential in enhancing the energy flexibility of the building clusters. Primarily, this potential lies in leveraging electric vehicle (EV) energy storage within the building clusters prototype. However, due to limitations such as the energy storage capacity of EVs and the time required for energy provision, the full scope of building energy flexibility remains unrealized. Furthermore, on a broader regional scale, opportunities for operational optimization and synergy among various building clusters prototypes persist. By exploring the flexibility inherent in building operations, there remains room to fine-tune the configuration and operation of the regional energy system, thereby maximizing efficiency and effectiveness.
In recent years, the sharing economy has harnessed modern Internet information and communication technology to facilitate the transfer of usage rights for various items through sharing models, such as renting and borrowing. This concept has extended to the realm of energy storage technology on the user side. Shared energy storage power stations are introduced, offering building-level energy storage services to users across different building clusters (Figure 3). In essence, shared energy storage facilities are established to serve as a mutual resource between building clusters prototypes.
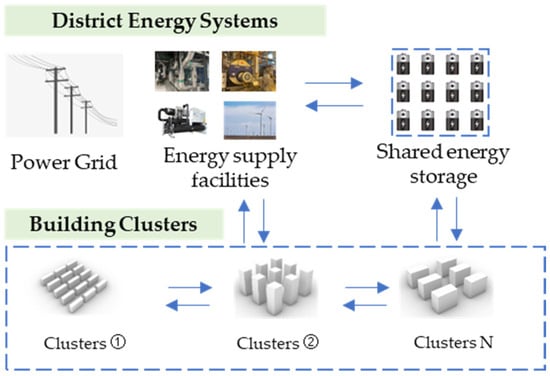
Figure 3.
District energy system configuration.
The configuration of the regional energy system necessitates consideration of various factors, including the design capacity of the shared energy storage power station, external grid power purchases, gas boiler and chiller capacities, among others. This comprehensive approach ensures alignment with the electricity, cooling, and heating load requirements of the building clusters. Within the framework of low-carbon objectives, the maximum feasible amount of solar photovoltaic installations within the building clusters is predetermined without alteration. Fundamentally, the endeavor to lower the carbon emission levels of the building clusters centers on augmenting the utilization of renewable energy sources while concurrently curbing external energy demands. Simultaneously, the integration of regional energy equipment, such as energy storage, will induce significant shifts in the operational dynamics of the building clusters. Conversely, alterations in the operational dynamics of the building clusters will directly impact the configuration of regional energy equipment. Consequently, configuring regional energy equipment and managing building energy operations represent typical two-layer planning challenges, characterized by a nested structure between the upper and lower layers.
In this study, the upper-level model focuses on determining the configuration of regional energy equipment, taking into account economic costs and carbon emission levels. Conversely, the lower-level model is dedicated to optimizing the operational parameters of the regional energy system, aiming to minimize energy costs. Specifically, it entails determining the time allocation for each green building clusters prototype, as well as optimizing parameters such as electric power allocation, time-sharing for energy storage, and discharge power distribution.
2.3.1. Upper Layer Multi-Objective Optimization Model
The objective of the upper-level model is to conduct multi-objective optimization focusing on carbon emissions and energy supply costs. The decision variables encompass the construction capacity of shared energy storage and the installation capacity of associated regional energy equipment. District energy system energy supply cost (C): the energy supply cost of the district energy system includes the system power supply cost, heating cost, and energy storage cost.
where represent the power supply cost, heating cost, and energy storage cost, respectively; is the time-sharing power supply, that is, the time-sharing power supply of the external power grid; and is the electricity purchase price at hour i. represents the energy supply power from the gas boiler system, represents the operating cost of the gas boiler; represents the gas boiler installation cost conversion coefficient, which represents that the installation cost of the gas boiler equipment is proportional to the total heat provided by the boiler. represents the energy storage facility installation cost conversion coefficient, which means that the energy storage facility installation cost is directly proportional to the energy storage facility’s maximum storage capacity. is the operating cost of energy storage facilities, and represents the energy storage power of the j-th type building clusters at the i-th time.
District energy system carbon emissions (E) encompass carbon emissions originating from both electricity and heat consumption. Specifically, electricity-related carbon emissions arise from indirect emissions stemming from the power grid supply, while thermal carbon emissions derive from the combustion of natural gas and other fuels in gas boilers, releasing carbon emissions.
where, respectively represent carbon emissions resulting from electricity use and heat use. and respectively represent the carbon emission factors associated with externally purchased electricity and gas boiler heating.
2.3.2. Lower-Level Mixed-Integer Linear Programming Model
The objective of the lower-level model is to minimize the operating costs of the building clusters. The decision variables include the time-sharing energy storage power for each building clusters prototype, as well as the time-sharing heating power, electricity power, gas boiler operating power, and cooling unit operating power for the building clusters.
where and represent electricity cost and heat cost, respectively; and represent the time-sharing electrical power and gas boiler thermal power, respectively. and represent electricity and heat prices.
Constraint conditions: Disregarding transmission and equipment losses, the constraints that the building clusters optimization dispatch model linked to the shared energy storage power station must satisfy include electrical power balance constraints, thermal power balance constraints, shared energy storage power station charging and discharging constraints, and the electrical state continuity constraints for the shared energy storage power station.
The electrical power and thermal power balance constraints necessitate that the regional energy system fulfill the energy demands of building users, encompassing both time-sharing electricity and heat requirements. This is expressed through the following formula:
where represents the total power consumption of the building clusters at the i-th time. and respectively represent the total electrical power, total energy storage power, and total heating power of the ground-source heat pump system of the building clusters at the i-th time. The COP (coefficient of performance) value of the ground-source heat pump system is assumed to be 3.5. is the base electricity load. and represent the power of the gas boiler and the base heat load. , , , , and respectively represent the time-sharing power supply power, energy storage power, baseline power consumption, ground source heat pump energy supply power, and energy storage and energy release power of the j-th building clusters.
and represent the 0 and 1 working state variables of the energy storage system at time i, 0 represents that the equipment is not running, and 1 represents that the equipment is in the power storage or discharge operating state; and represent the baseline energy storage and discharge power of building clusters j. and represent the upper limit of charge and discharge power of the energy storage system at time i. is the state of charge of the energy storage power station at time i; that is, the charge at time i accounts for the percentage of energy storage capacity. is the loss rate. is the maximum energy storage.
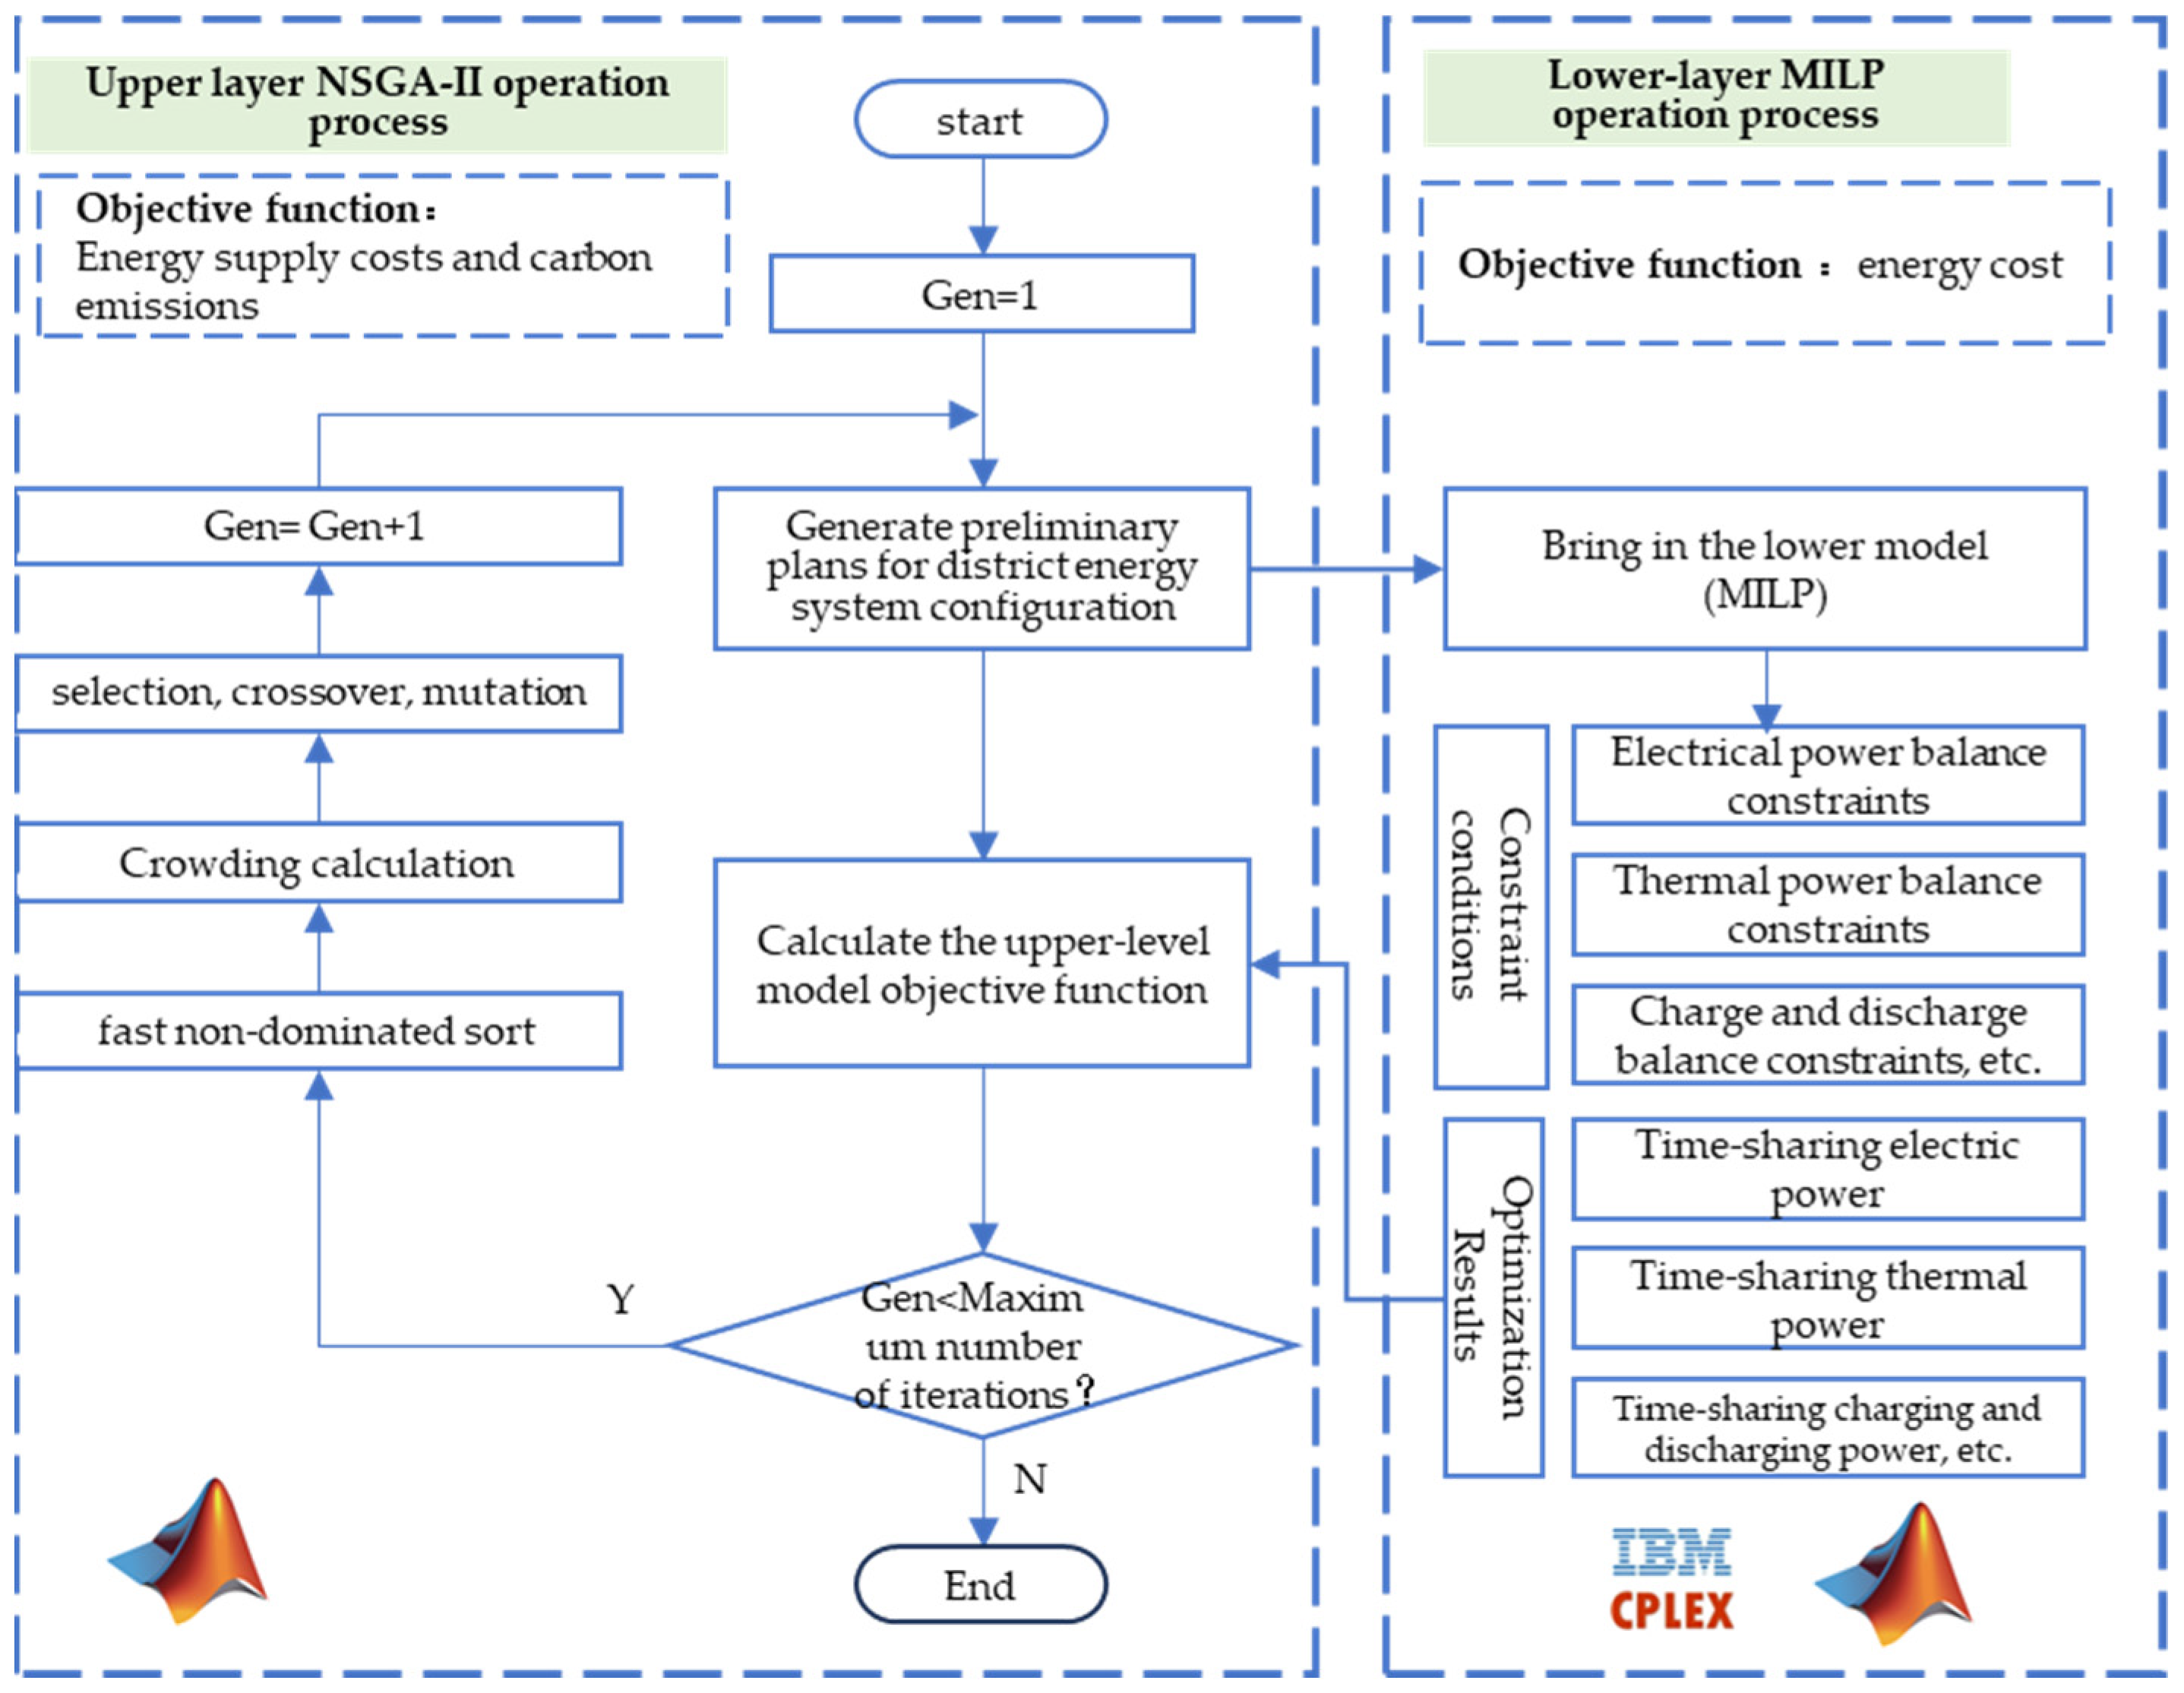
2.3.3. Model Solution Method
The upper-level model aims to achieve multi-objective optimization concerning carbon emissions and energy supply costs, with decision variables encompassing the shared energy storage construction capacity and the installation capacity of related regional energy equipment. The NSGA-II algorithm is employed to address the multi-objective optimization problem. This method has proven to have certain advantages in related research, as it is capable of enumerating all feasible solutions and identifying the optimal one [20]. Meanwhile, the lower layer is formulated as a mixed-integer linear programming problem, with the objective function set as the energy cost of the building clusters. Decision variables include time-sharing energy storage and discharge power, time-sharing heating power, time-sharing electricity power, gas boiler operating power, and operating power of the cooling unit. The problem is solved using the Cplex solver. The solution process is shown in Figure 4.
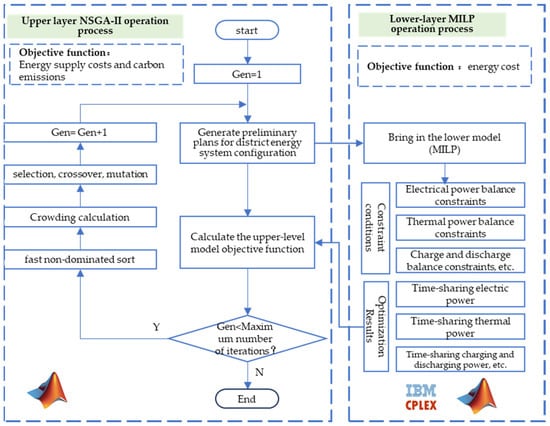
Figure 4.
Model solving process.
① Initialize the operation network by setting the number of iterations (Gen = 1) and configuring relevant parameters for the upper genetic algorithm, such as population size, crossover probability, and mutation probability.
② Generate the initial set of regional energy system configuration plans, which includes parameters such as shared the energy storage capacity and installed power of gas boilers, chillers, and other equipment.
③ The regional energy system configuration plan generated in the previous step is input into the lower-layer mixed-integer linear programming model. The Cplex solver is then invoked to compute the optimal operation plan for the building clusters, thereby obtaining data such as the time-sharing electricity and heat power consumption of the building clusters.
④ Input the regional energy system configuration plan and building clusters operation plan data into the upper-layer model to compute the objective function.
⑤ Based on the results of the objective function, conduct rapid non-dominated sorting and congestion degree calculation on the generated regional energy allocation plan and proceed with the next generation mutation generation process. Increment the number of iterations (Gen = Gen + 1).
⑥ Repeat steps ③–⑤ continuously for iterative optimization. Upon reaching the designated number of iterations and achieving relatively stable calculation results, output the final calculation result.
3. Results and Discussion
The hourly electricity price and heat price were calculated according to Table 2. The energy storage capacity of electric vehicles is directly proportional to the quantity, which is determined by factors such as the occupant rate and total number of households, with the aid of a specific conversion coefficient. Cold and heat storage mechanisms are simplified, with the cold and heat storage limit calculated as 20% of the total heat and cold consumption, based on the thermal inertia of the building and the tank heat storage device. The data on total energy consumption and sub-item energy consumption of the building clusters were simulated using Honeybee, a Grasshopper plug-in equipped with the EnergyPlus engine. For detailed simulation procedures, please refer to document [16]. This study analyzes the average hourly heating load and electricity load of the buildings in January.
Table 2.
Hourly electricity and heat prices (yuan).
3.1. Analysis of Self-Optimization Results of Building Clusters Prototypes
Utilizing energy cost as the focal point, the solution outcomes derived from the application of the Cplex solver are as follows. Figure 5 illustrates the comparative time-based energy cost chart before and after the energy self-optimization of the residential building clusters prototype . Based on the findings, due to the comprehensive utilization of building energy consumption flexibility, there has been a variable reduction in the cost of building energy consumption between the hours of 10 and 22. Moreover, a portion of energy consumption has been shifted to the hours between 01:00 and 05:00, characterized by relatively lower energy prices, as well as after 23:00. During the peak energy consumption period at 20:00, the energy cost for this interval decreased significantly from the initial 6500 yuan to approximately 3500 yuan. Concurrently, the total electricity cost decreased from 26,457 yuan to 14,556 yuan, marking an overall decrease of 44.98%, thereby highlighting the clear effectiveness of the optimization efforts. Additionally, both time-of-use electricity and heat consumption demonstrate similar patterns, wherein energy consumption shifts from peak energy consumption periods to periods of lower demand.
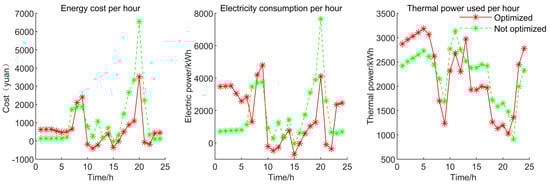
Figure 5.
Energy cost comparison: pre- and post-optimization.
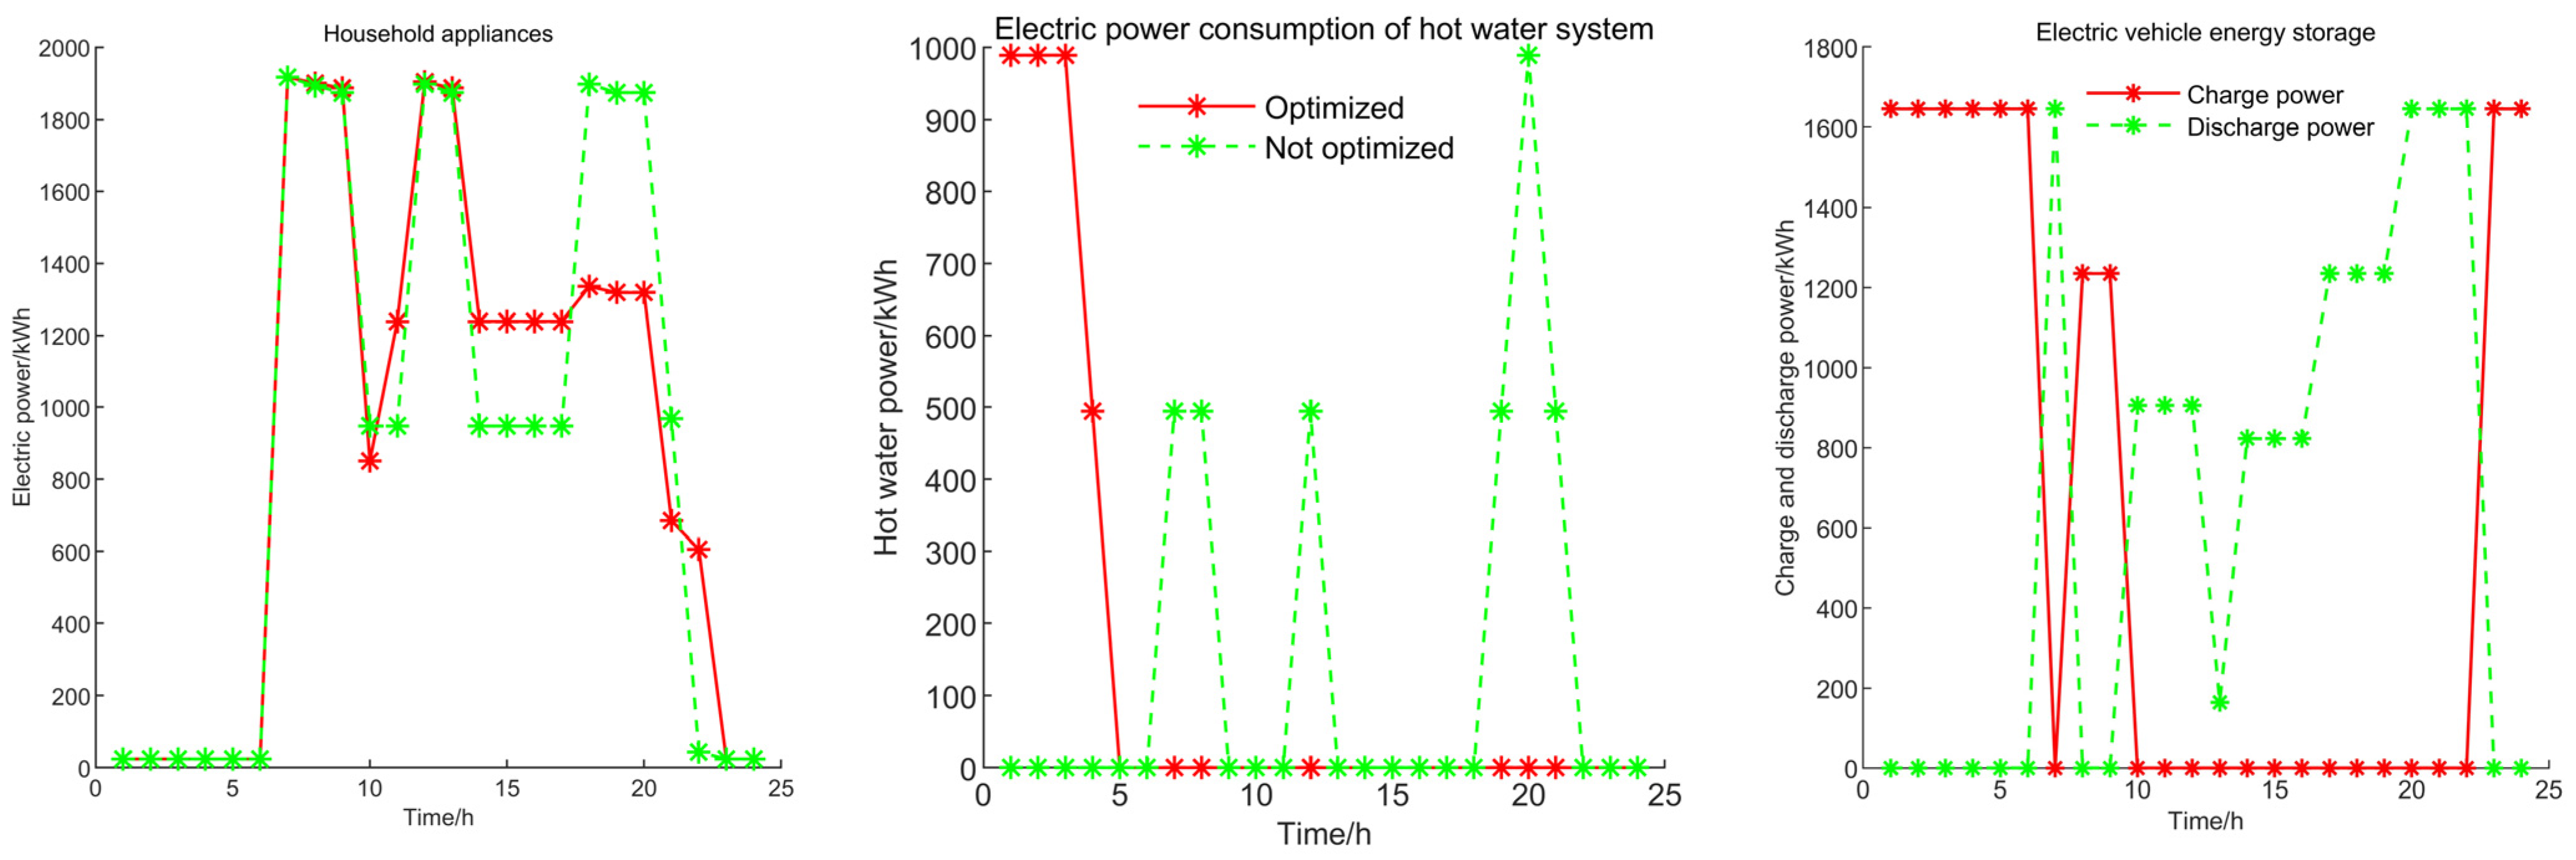
From the perspective of energy consumption by item(Figure 6), hot water load is shifted entirely to the 01:00–03:00 h period when electricity costs are lower, indicating that water heaters complete hot water preparation and storage during this timeframe. Transferable load is primarily shifted from peak hours of 18:00–20:00 and periods of higher electricity prices to the 14:00–17:00 timeframe. Representative power facilities for transferable load include dishwashers, dryers, and adjustable charging facilities. From the perspective of energy and thermal storage, energy storage predominantly occurs during periods of lower load and gradually releases energy during peak consumption periods, thus playing a crucial role in building energy consumption flexibility.
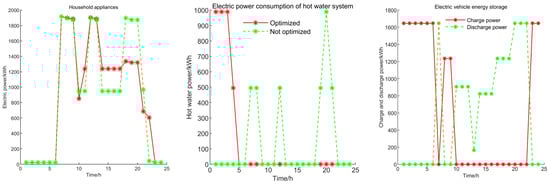
Figure 6.
Energy storage power and sub-item energy consumption.
3.2. Optimization of Building Cluster Proportions
3.2.1. Load Leveling
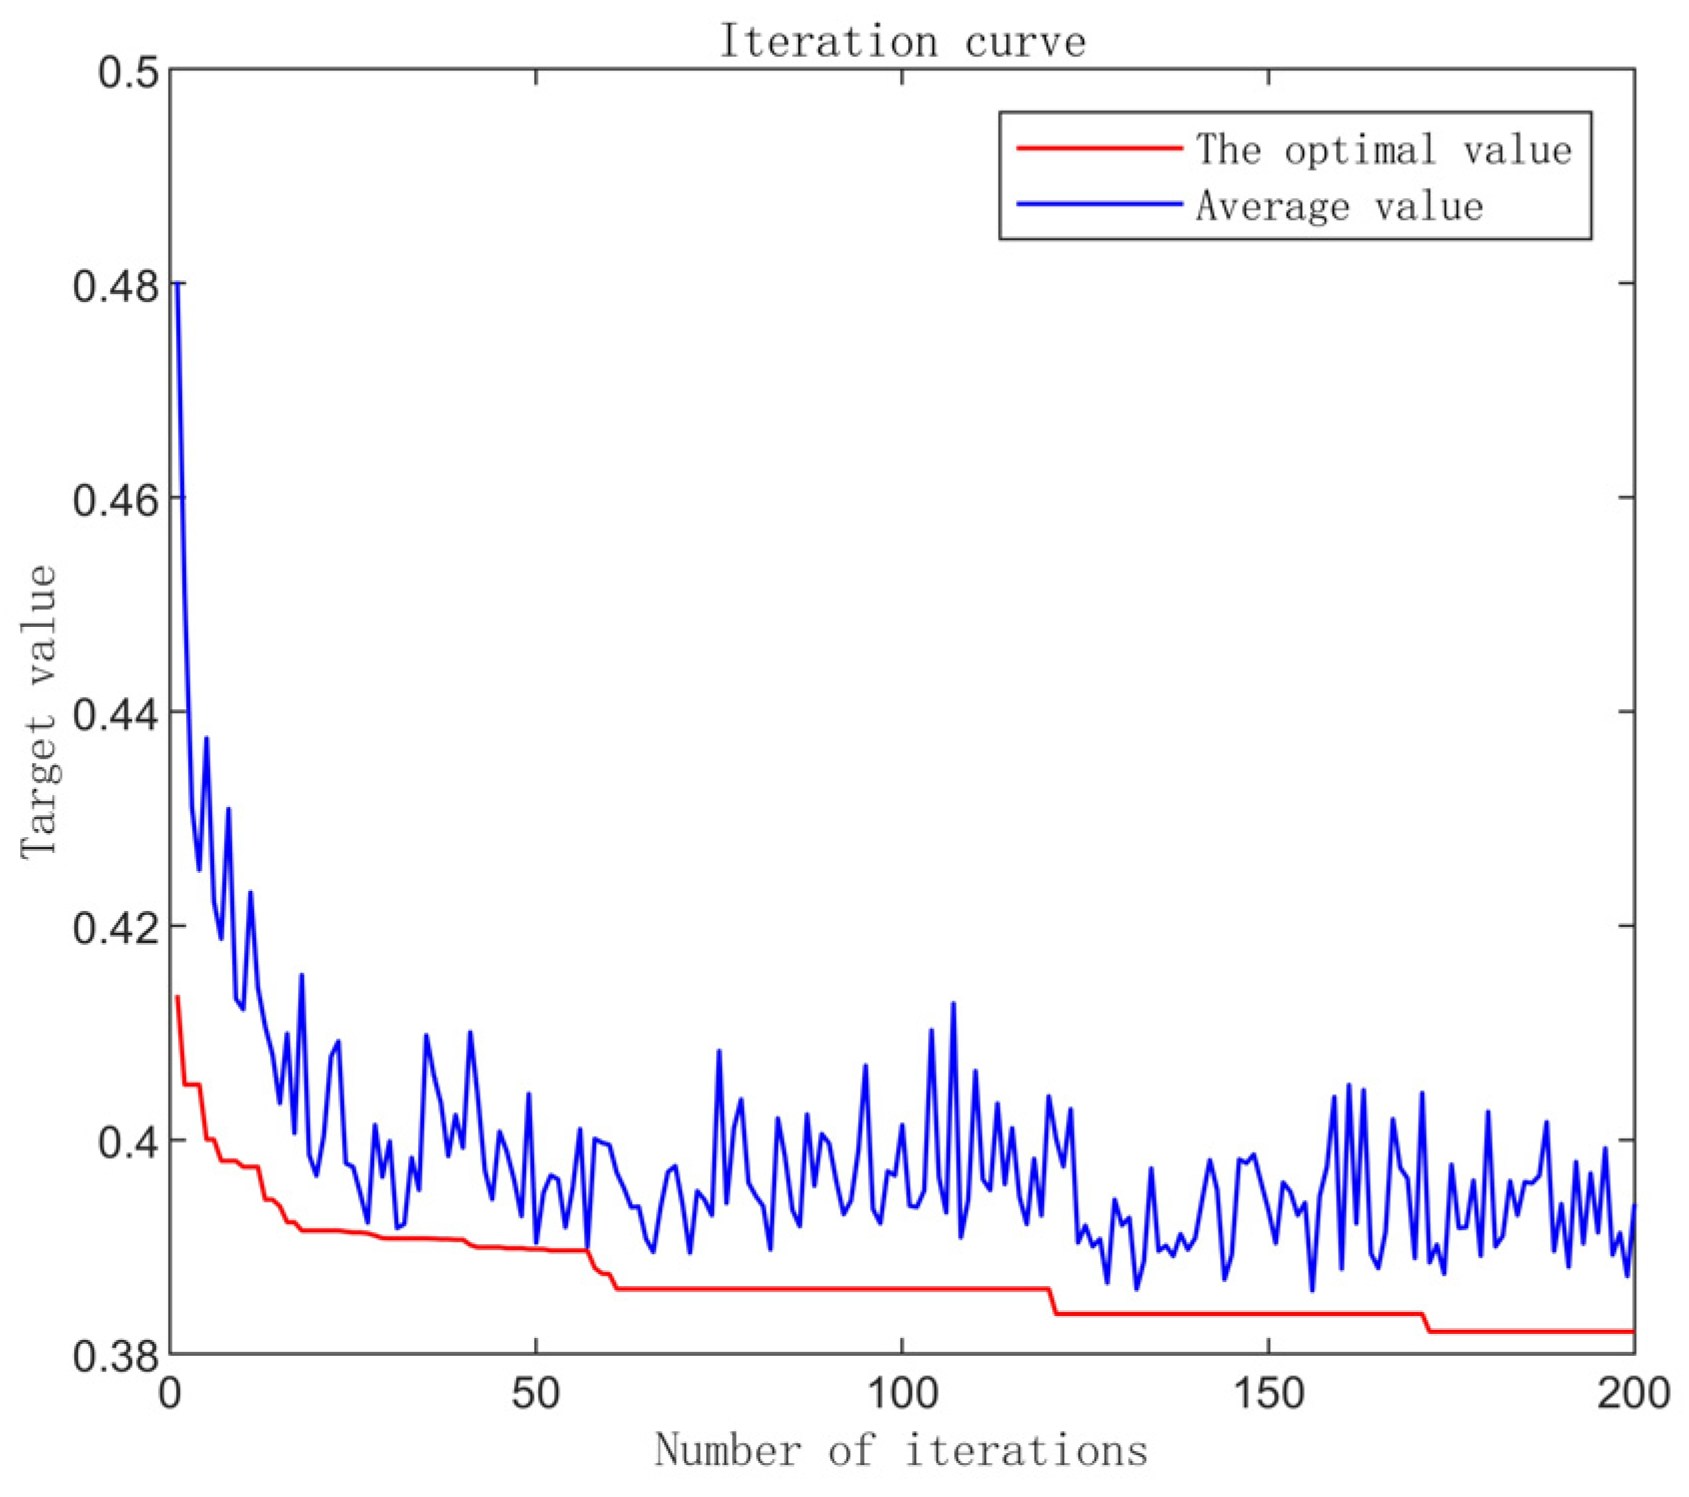
In this study, the decision variable is the proportion of prototypes from various building clusters, with the target being the levelized rate of load. To address this, a genetic algorithm was employed. Initial simulation data suggest a positive correlation between the proportion of hotel building prototypes and the levelization degree. This correlation is attributed to the relatively balanced energy load of hotel buildings. Consequently, the prototype proportion of hotel building clusters is fixed at 0.1, with the sum of proportions of other building clusters types set to 0.9. Further analysis can explore optimal proportions for different building clusters types, such as office-oriented, commercial-oriented, hotel-oriented, all residential, or all public buildings, although this discussion is beyond the scope of this paper. Regarding the genetic algorithm parameters, there are 10 variables, with a population size of 40 and 200 iterations. The mutation probability was set at 0.2, and the crossover probability at 0.8. The independent variables’ value range is 0–1, with their sum constrained to 0.9. The iteration curve of the genetic algorithm is depicted in Figure 7. Notably, the population mean stabilizes and generates better results around the 60th iteration, as observed from the iteration process.
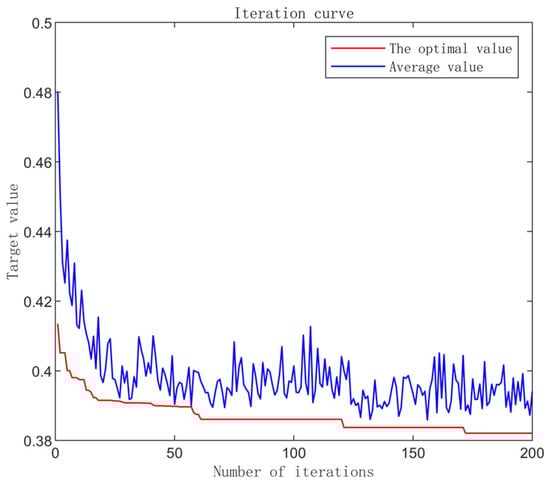
Figure 7.
Genetic algorithm iteration process.
The optimal result statistics derived from the genetic algorithm are presented in Table 3. Notably, the proportion of the ground area occupied by public buildings is 30.7%, while residential buildings account for 69.3% of the total area.
Table 3.
Area ratio of building clusters prototype.
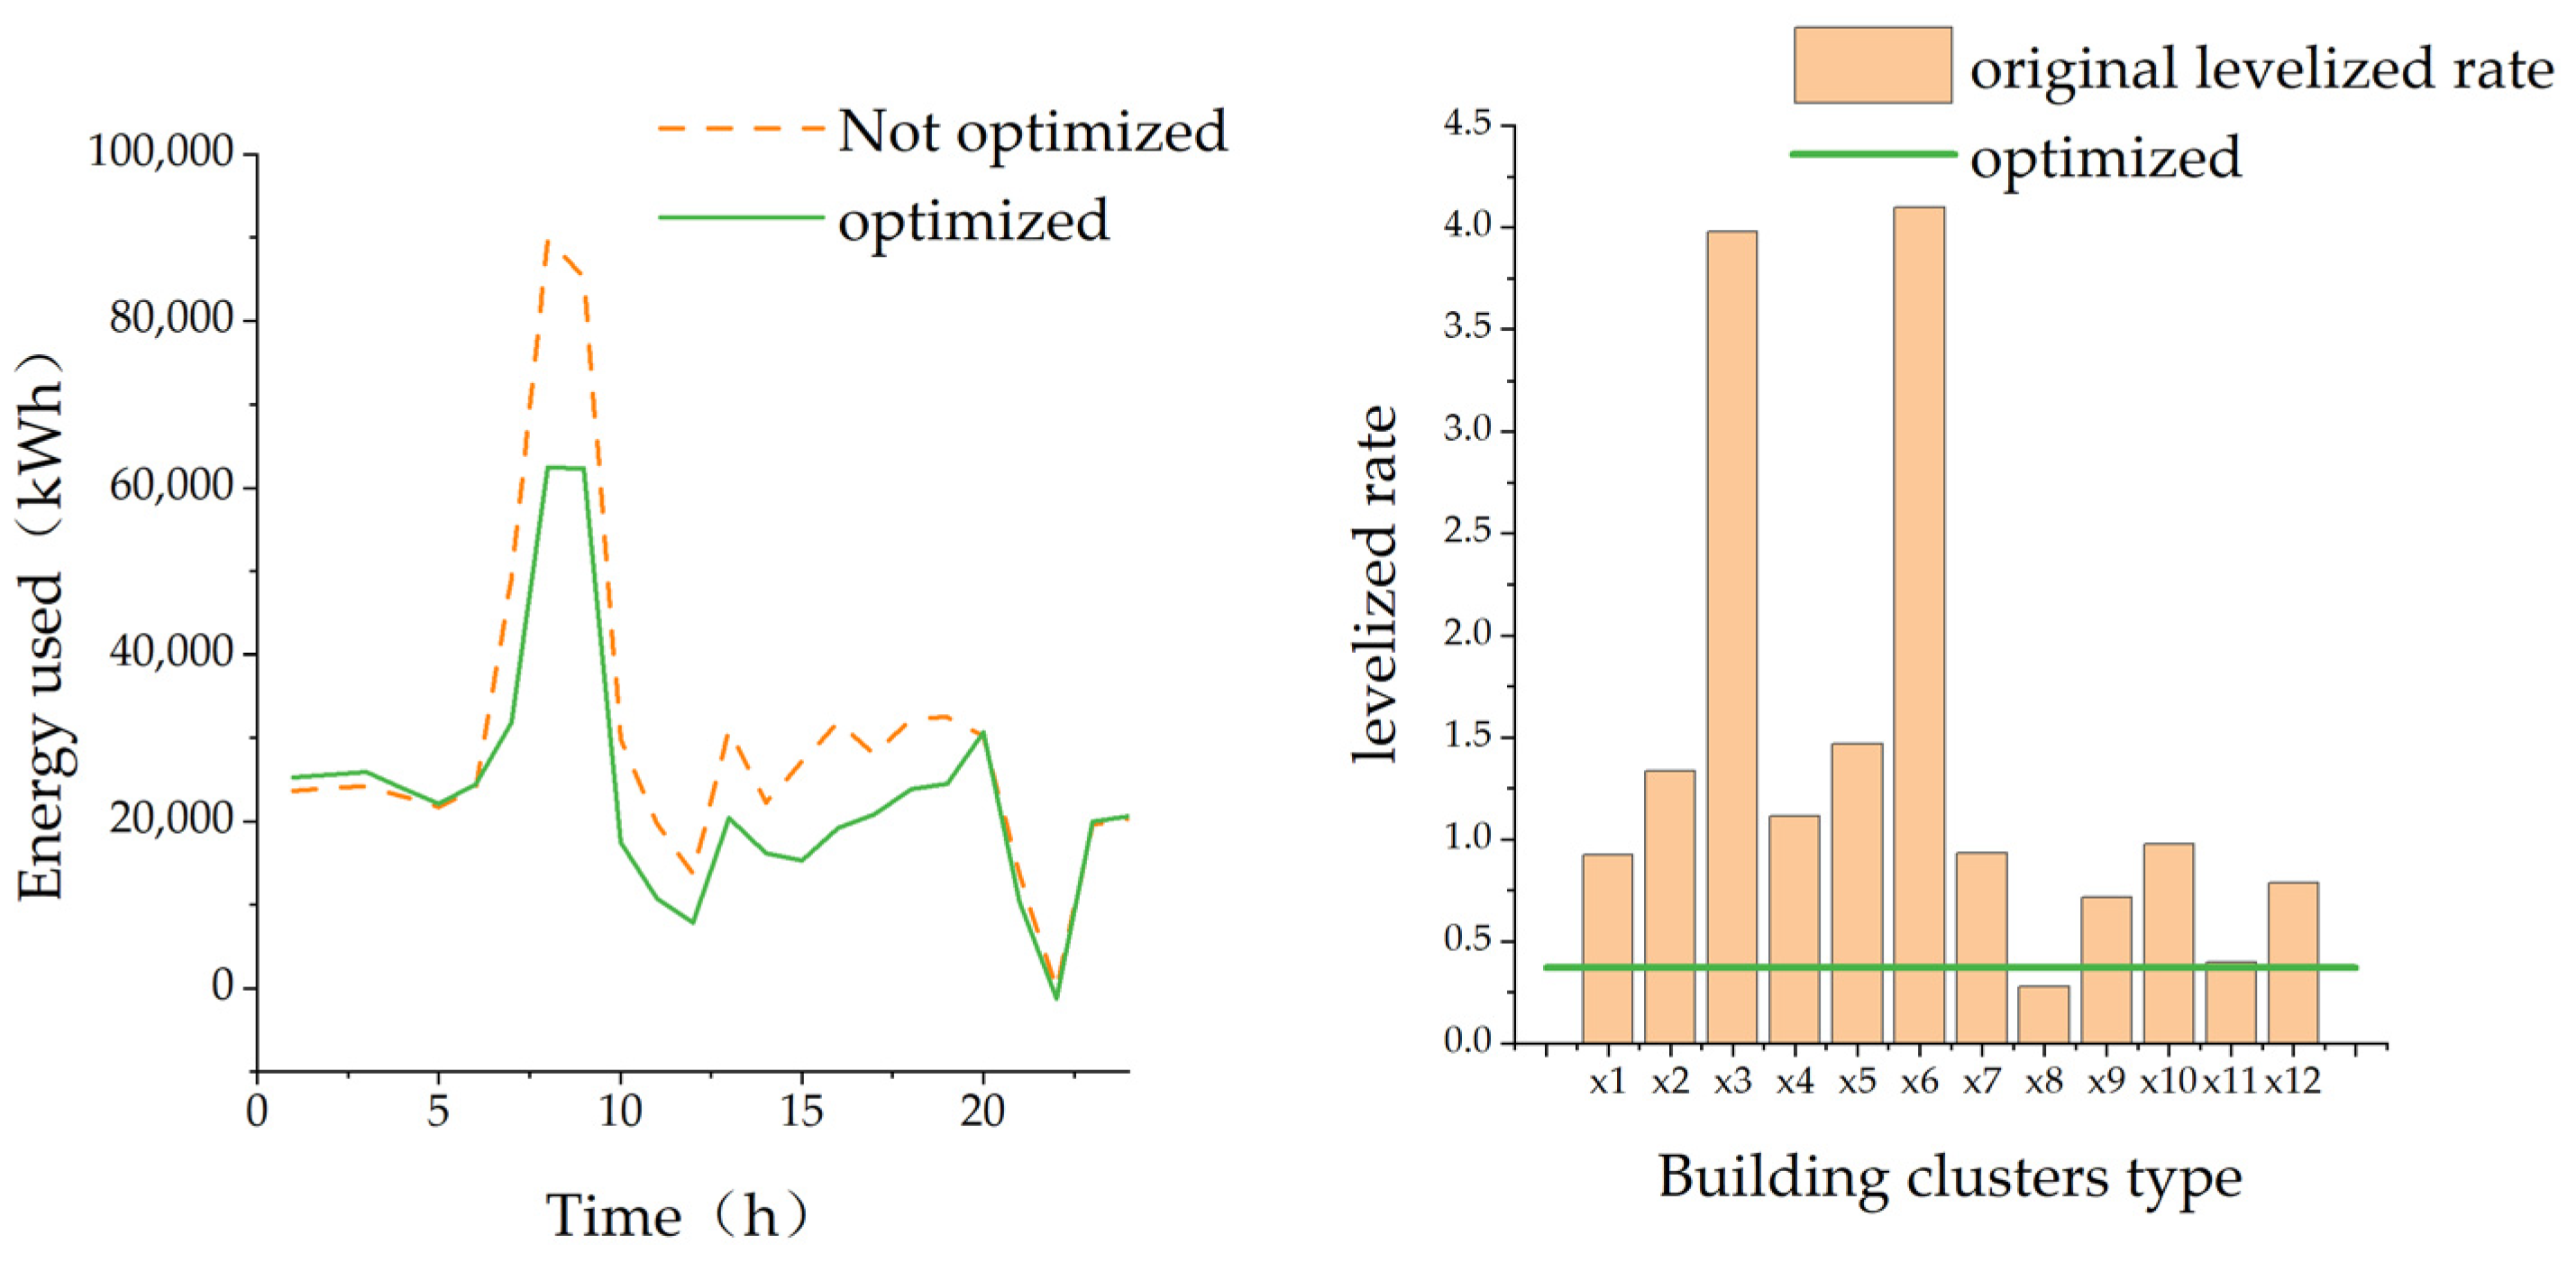
Comparing the base scenario, where prototypes from each building cluster are combined in a 1:1 ratio, with the optimized combination scenario, Figure 8 shows the monthly average hourly total electrical load of the building clusters. The optimized scenario exhibits a notable reduction in peak load compared to the baseline, with marginal changes in valley load, and certain increases in some valley loads. Additionally, apart from the hotel building clusters, the levelization rate of the optimized building clusters is lower than that of the initial building clusters prototype, validating the effectiveness of the optimization method.

Figure 8.
Comparison of levelized rate optimization results.
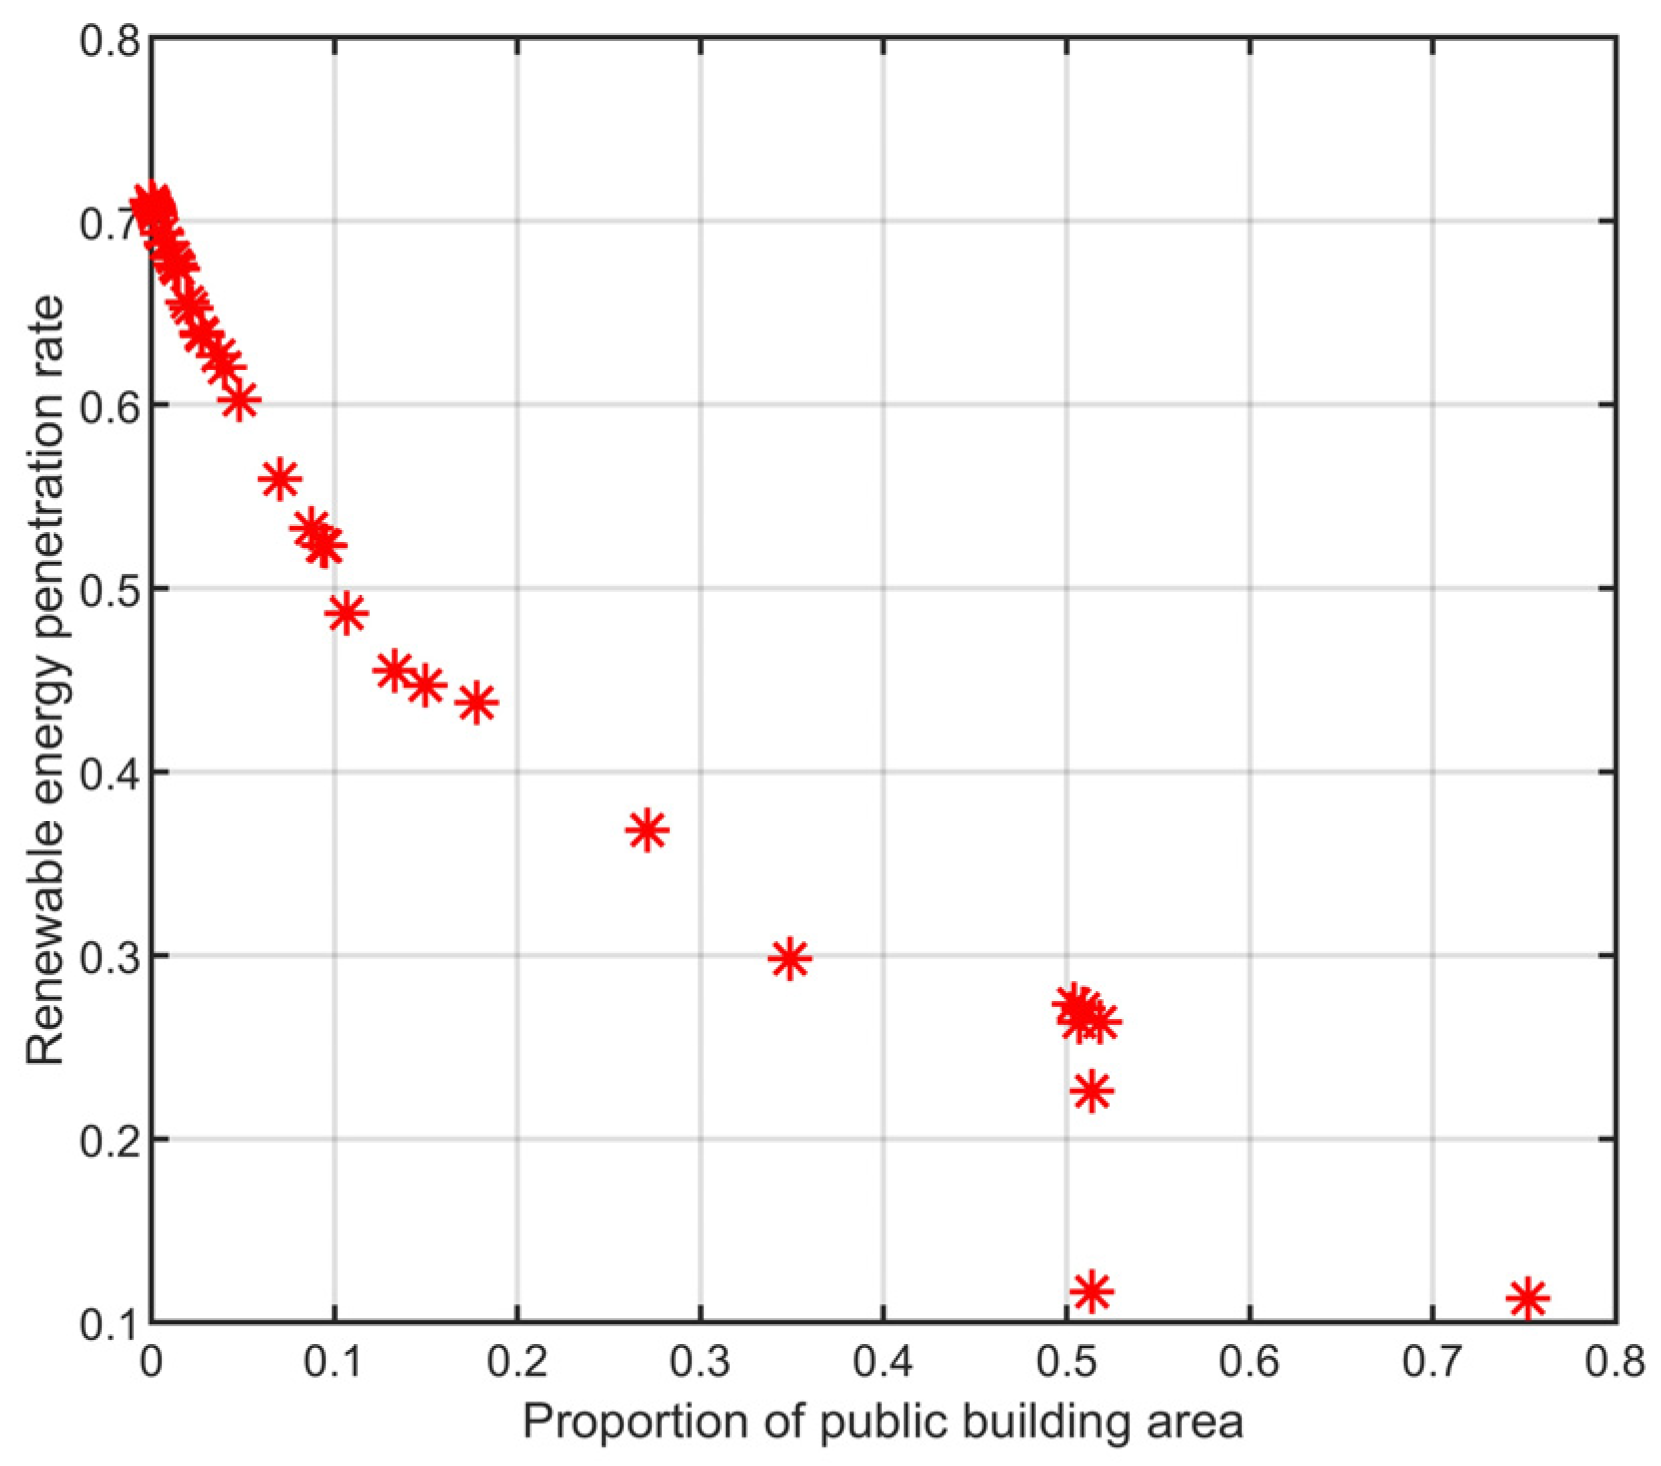
3.2.2. Renewable Energy Penetration Rate
The optimization model for renewable energy penetration rate also incorporates the proportions of different building prototypes as decision variables. Given the typically higher energy consumption of public buildings compared to residential ones, the penetration rate of renewable energy is notably lower for public buildings. Clearly, during the simulation, a higher proportion of residential buildings led to a higher penetration rate of renewable energy. To enhance the realism of the model, a multi-objective optimization model was devised to consider both the renewable energy penetration rate and the ratio of public building area. The model aims to generate a Pareto optimal solution set to realize various possibilities in building clusters planning. The population size was set at 40, with 12 independent variables constrained between 0 and 1. The sum of these variables was fixed at 1. Additionally, the maximum number of iterations was set to 200, with a crossover ratio of 0.8 and a mutation ratio of 0.3. The results stabilized after approximately 40 iterations. After iterating two hundred times, the results are as follows(Figure 9).

Figure 9.
Multi-objective optimization iteration results.
From the ultimate Pareto optimal frontier, a negative correlation emerges between the proportion of public buildings and the renewable energy penetration rate within the building clusters. Specifically, as the proportion of public buildings increases, the rate of renewable energy consumption declines. When the proportion of public buildings reaches 30%, the renewable energy consumption rate peaks at approximately 40%.
3.3. Energy Supply-Side District Energy System Configuration
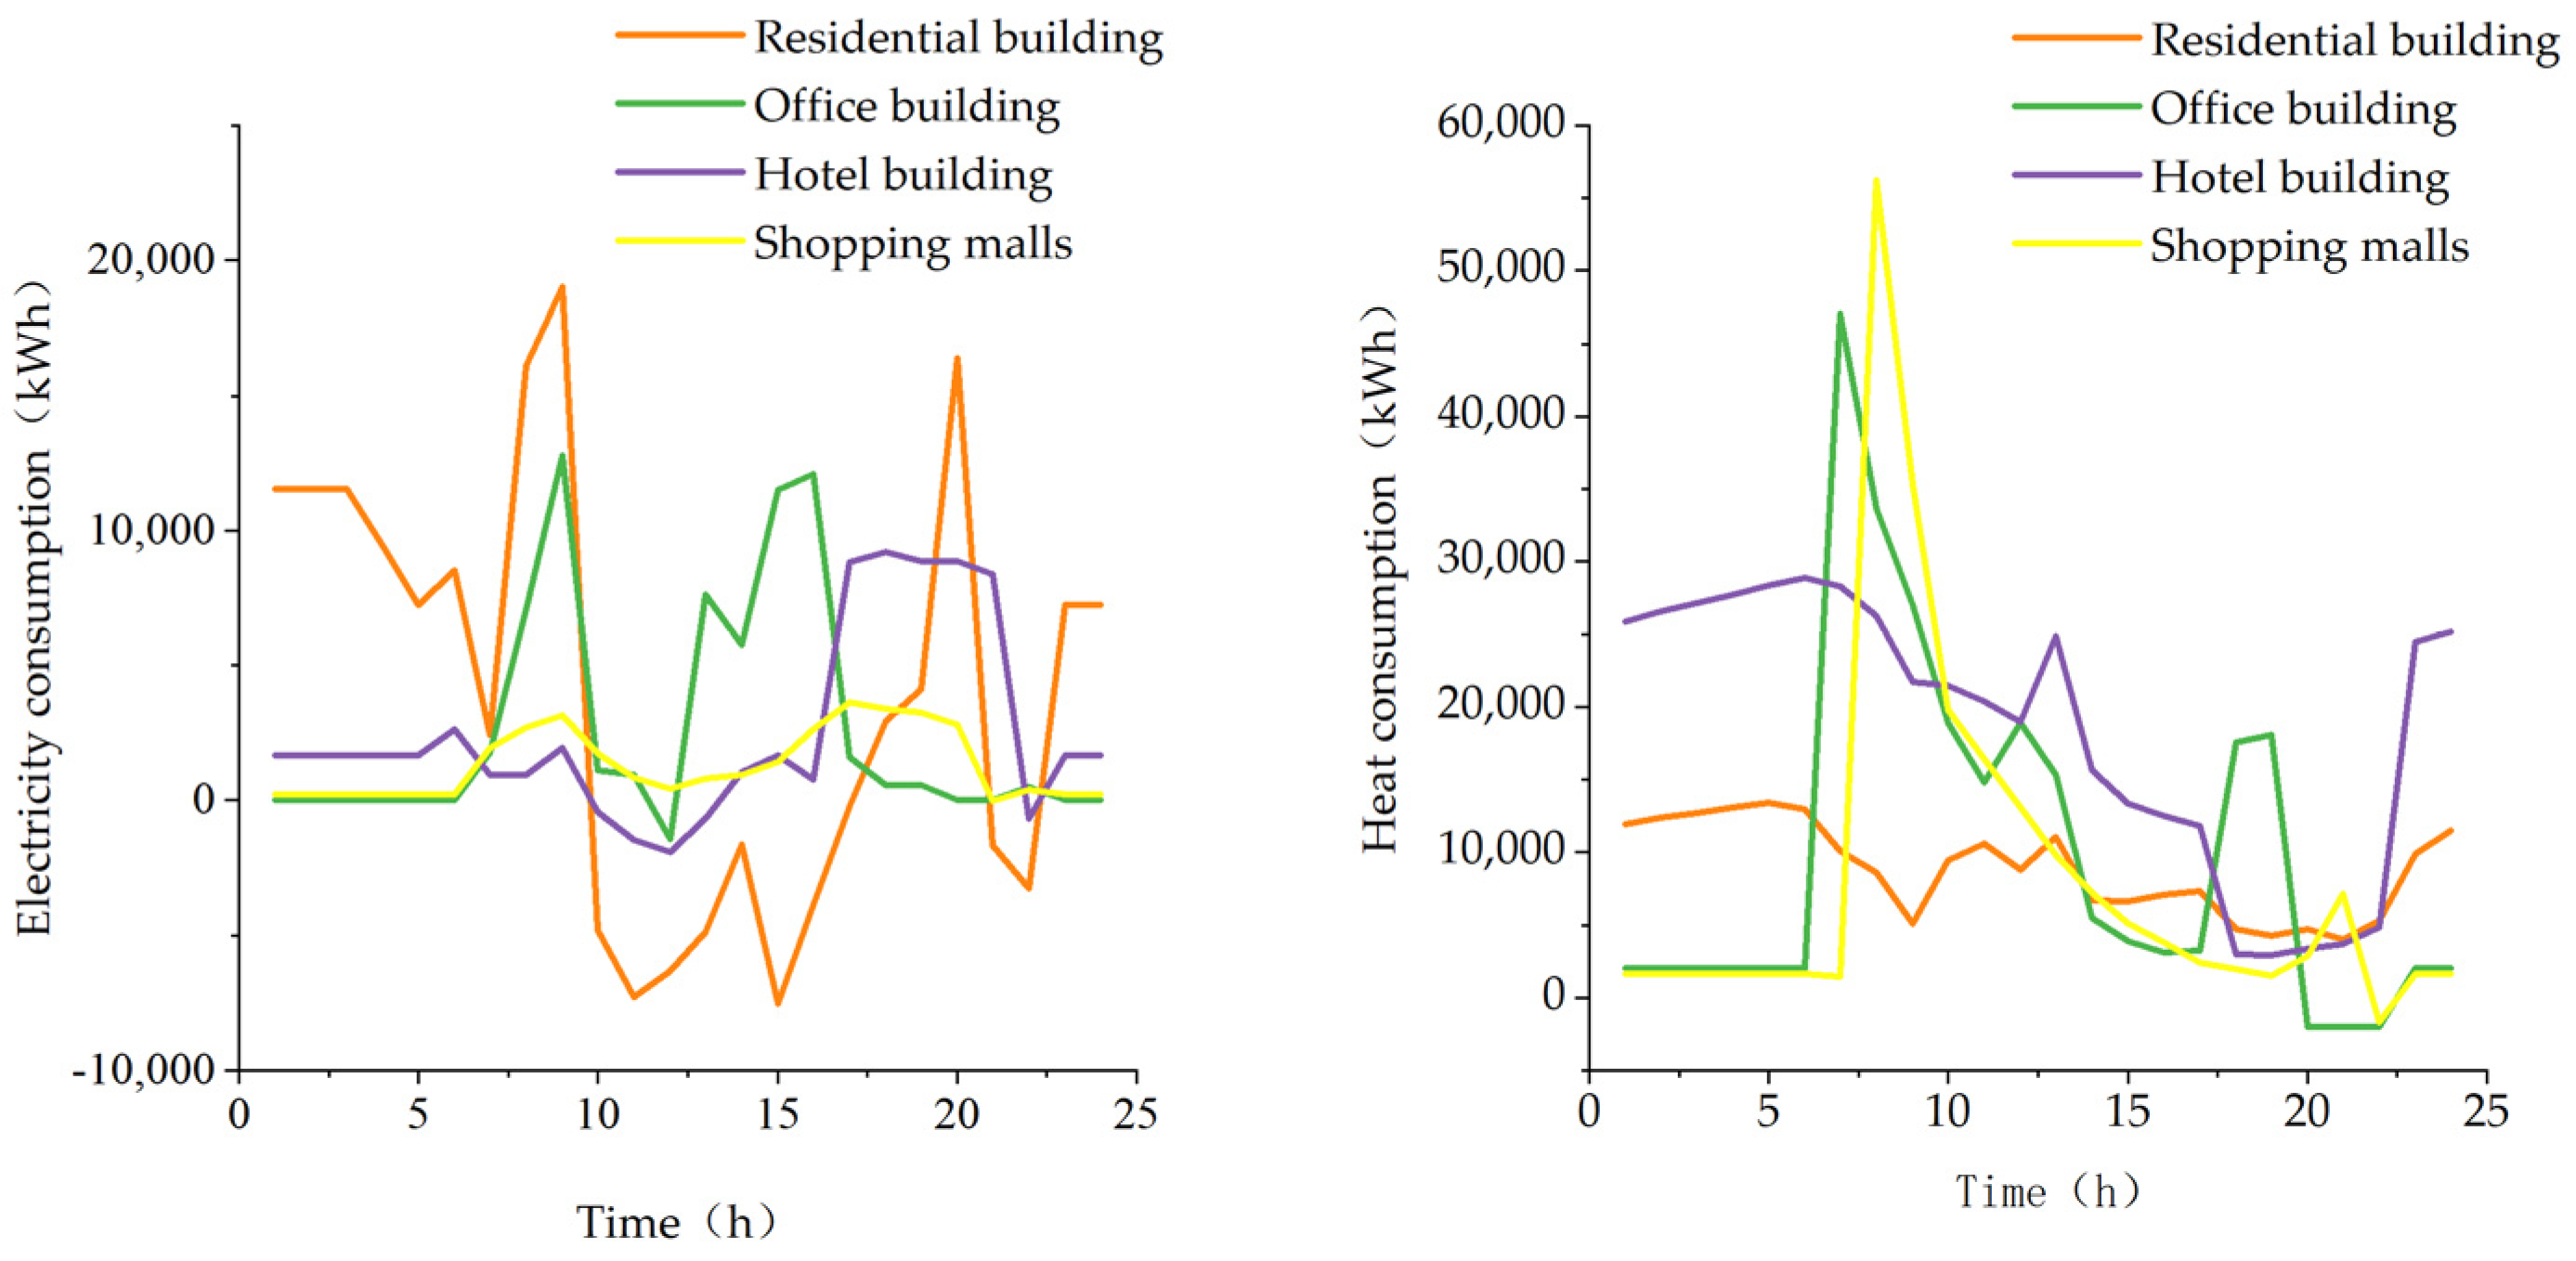
Following the self-optimization and load balancing of building clusters prototypes, the resulting building clusters exhibited a more rational operational state and energy supply distribution. This cluster comprises various prototypes, encompassing diverse residential buildings alongside public structures such as offices, hotels, and shopping malls. Specifically, residential buildings constitute 69.3% of the group, while public buildings make up the remaining 30.7%. Subsequent to supply-side energy optimization, the energy consumption curves for each building type are as follows (Figure 10).
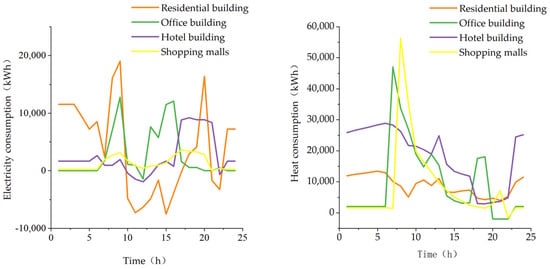
Figure 10.
Baseline electricity and heat consumption.
Additionally, the maximum time-sharing heating power for ground-source heat pump systems was set as follows: 27,062 kW for residential buildings, 2834 kW for office buildings, 4372 kW for hotel buildings, and 2504 kW for shopping malls. The grid emission factor was established at 0.5810 tCO2/MWh, while the carbon emission factor for gas boiler systems was 0.5 tCO2/MWh. Energy storage costs for public buildings and residential buildings were set at 0.25 yuan/kWh and 0.15 yuan/kWh, respectively. To achieve a balance between installation and operating costs, conversion coefficients of 10 yuan/kW and 15 yuan/kW were applied for energy storage facility installation and gas boiler installation, respectively. These parameters were then incorporated into the model, yielding the upper-level multi-objective optimization results depicted in Figure 11.
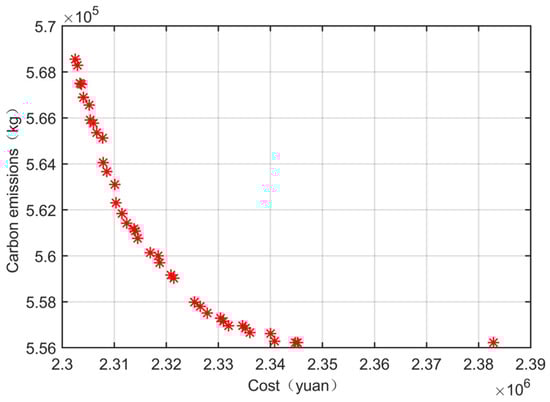
Figure 11.
Upper layer multi-objective optimization results.
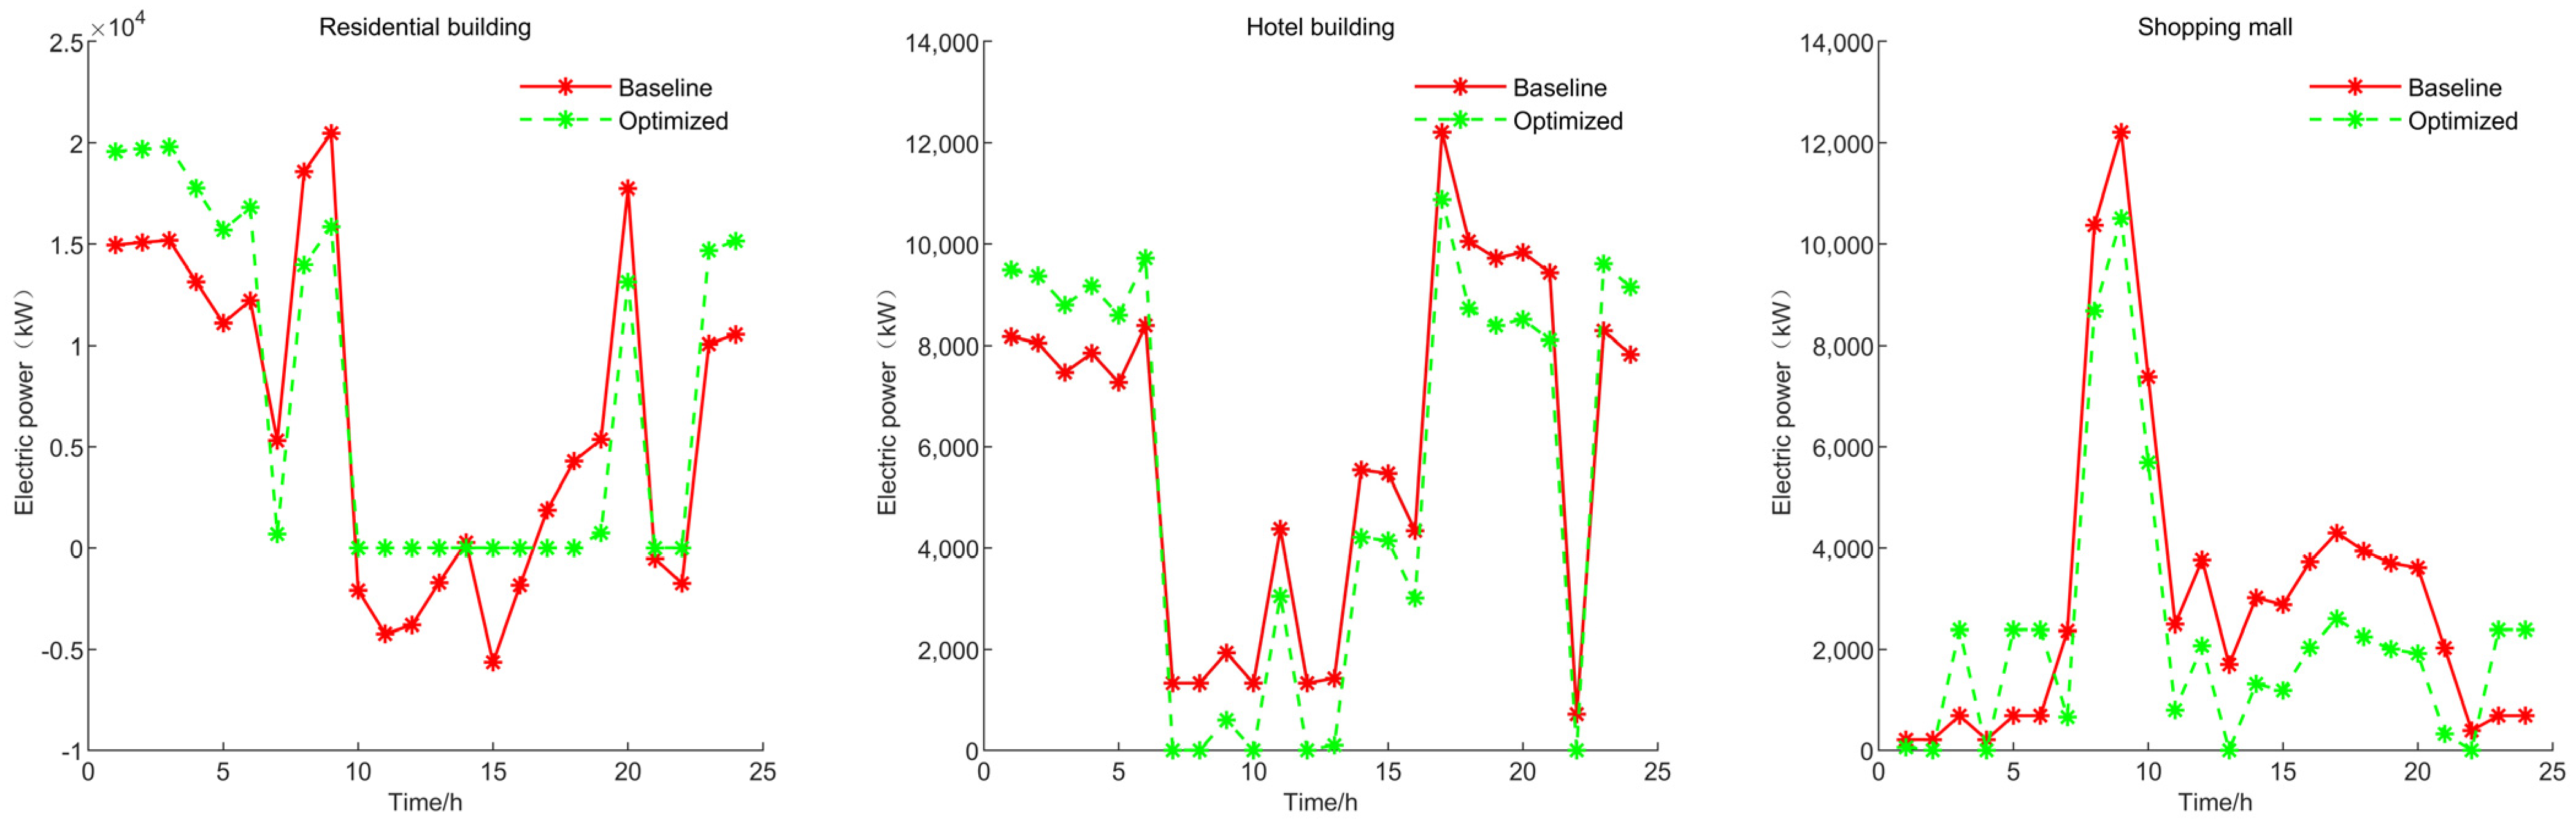
To better reflect the carbon emission reduction effect, we selected the solution set with lower carbon emissions for analysis. The regional energy system configuration parameters, such as shared energy storage capacity at this time, were incorporated into the lower-level model. The optimal solution under this configuration was then obtained and run. The result is shown in Figure 12.
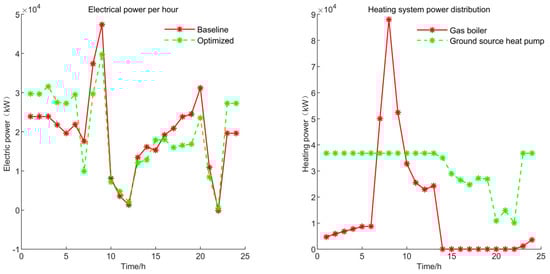
Figure 12.
Electricity and heat consumption per hour.
The implementation of a shared energy storage system has yielded notable benefits in terms of total time-of-use power consumption within the power system. This optimization is evidenced by the reduction in peak power demands and the strategic shifting of power consumption from high time-of-use electricity price periods to those with lower tariffs. Following the operational enhancements, a significant decrease in power consumption occurred during the 15 h to 20 h timeframe, coupled with a noticeable increase between 23 h to 5 h. Overall, this optimization led to a reduction in electricity costs from 322,600 yuan to 277,900 yuan, marking a notable decrease of 13.86%. Regarding the heating system of the building clusters, it comprises gas boilers and ground-source heat pump systems. The ground-source heat pump system accounts for the majority of the heating power, totaling 756,700 kW, representing 68.79% of the total heating capacity and 85.74% of its peak heating capacity. Meanwhile, the gas boiler system contributes 343,300 kW, constituting 31.21% of the total heating capacity, with a peak power demand of 88,000 kW.
In terms of sub-item power consumption(Figure 13), residential buildings exhibit a benchmark power consumption with a negative value, indicating a scenario where solar photovoltaic power generation exceeds power consumption. In this context, the power uploaded to the grid by the residential building clusters amounts to 21,370 kWh, representing 12.15% of the total. This surplus power uploaded to the grid signifies unconsumed energy. Elevating the rate of renewable energy consumption directly mitigates the need for external grid power purchases and consequently reduces the carbon emissions associated with the building clusters. With the integration of a shared energy storage system, the energy flexibility potential of the building clusters is further unlocked. In comparison to scenarios without such a system, the power uploaded to the grid decreases from 21,370.06 kWh to 7703 kWh, resulting in 13,667 kWh of renewable energy utilization. This local consumption curtails carbon emissions by 7941 kg, thereby accomplishing the objective of emission reduction. Public buildings similarly capitalize on energy flexibility potential, thereby trimming energy expenses. Nonetheless, as their solar photovoltaic power generation constitutes a smaller fraction and has already been consumed prior to optimization, the total grid power purchase remains unaltered. Consequently, the carbon emissions of public buildings remain consistent pre- and post-optimization.
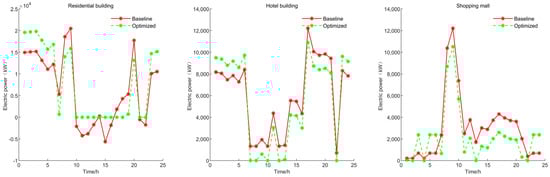
Figure 13.
Itemized electrical power.
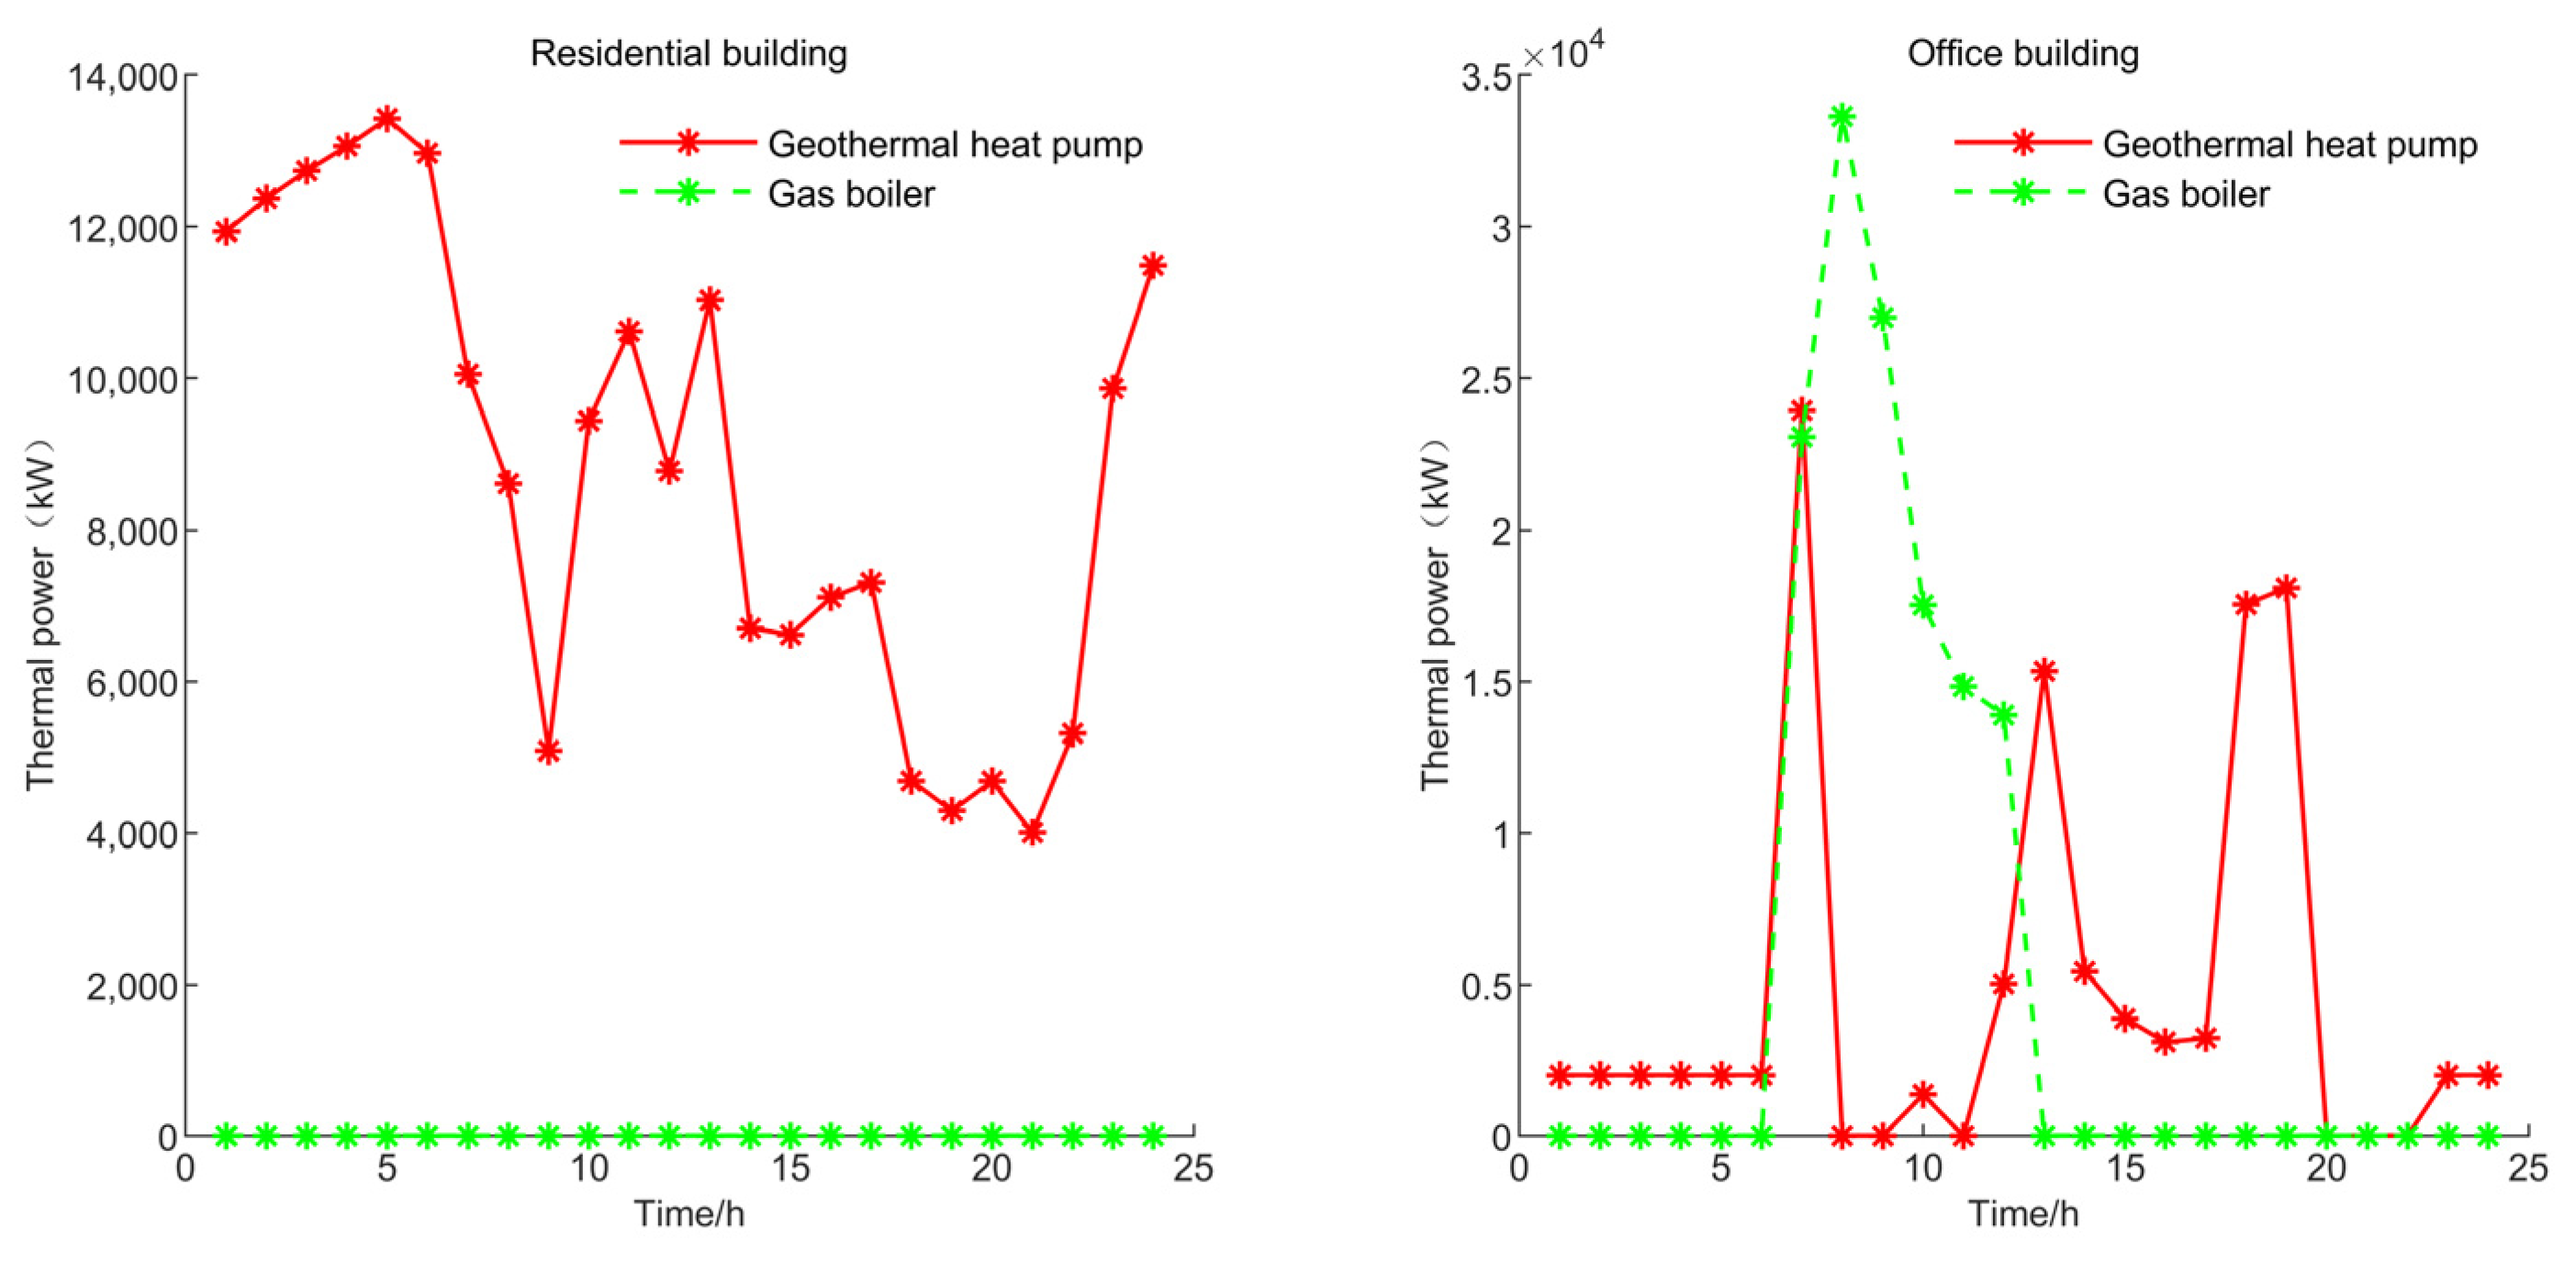
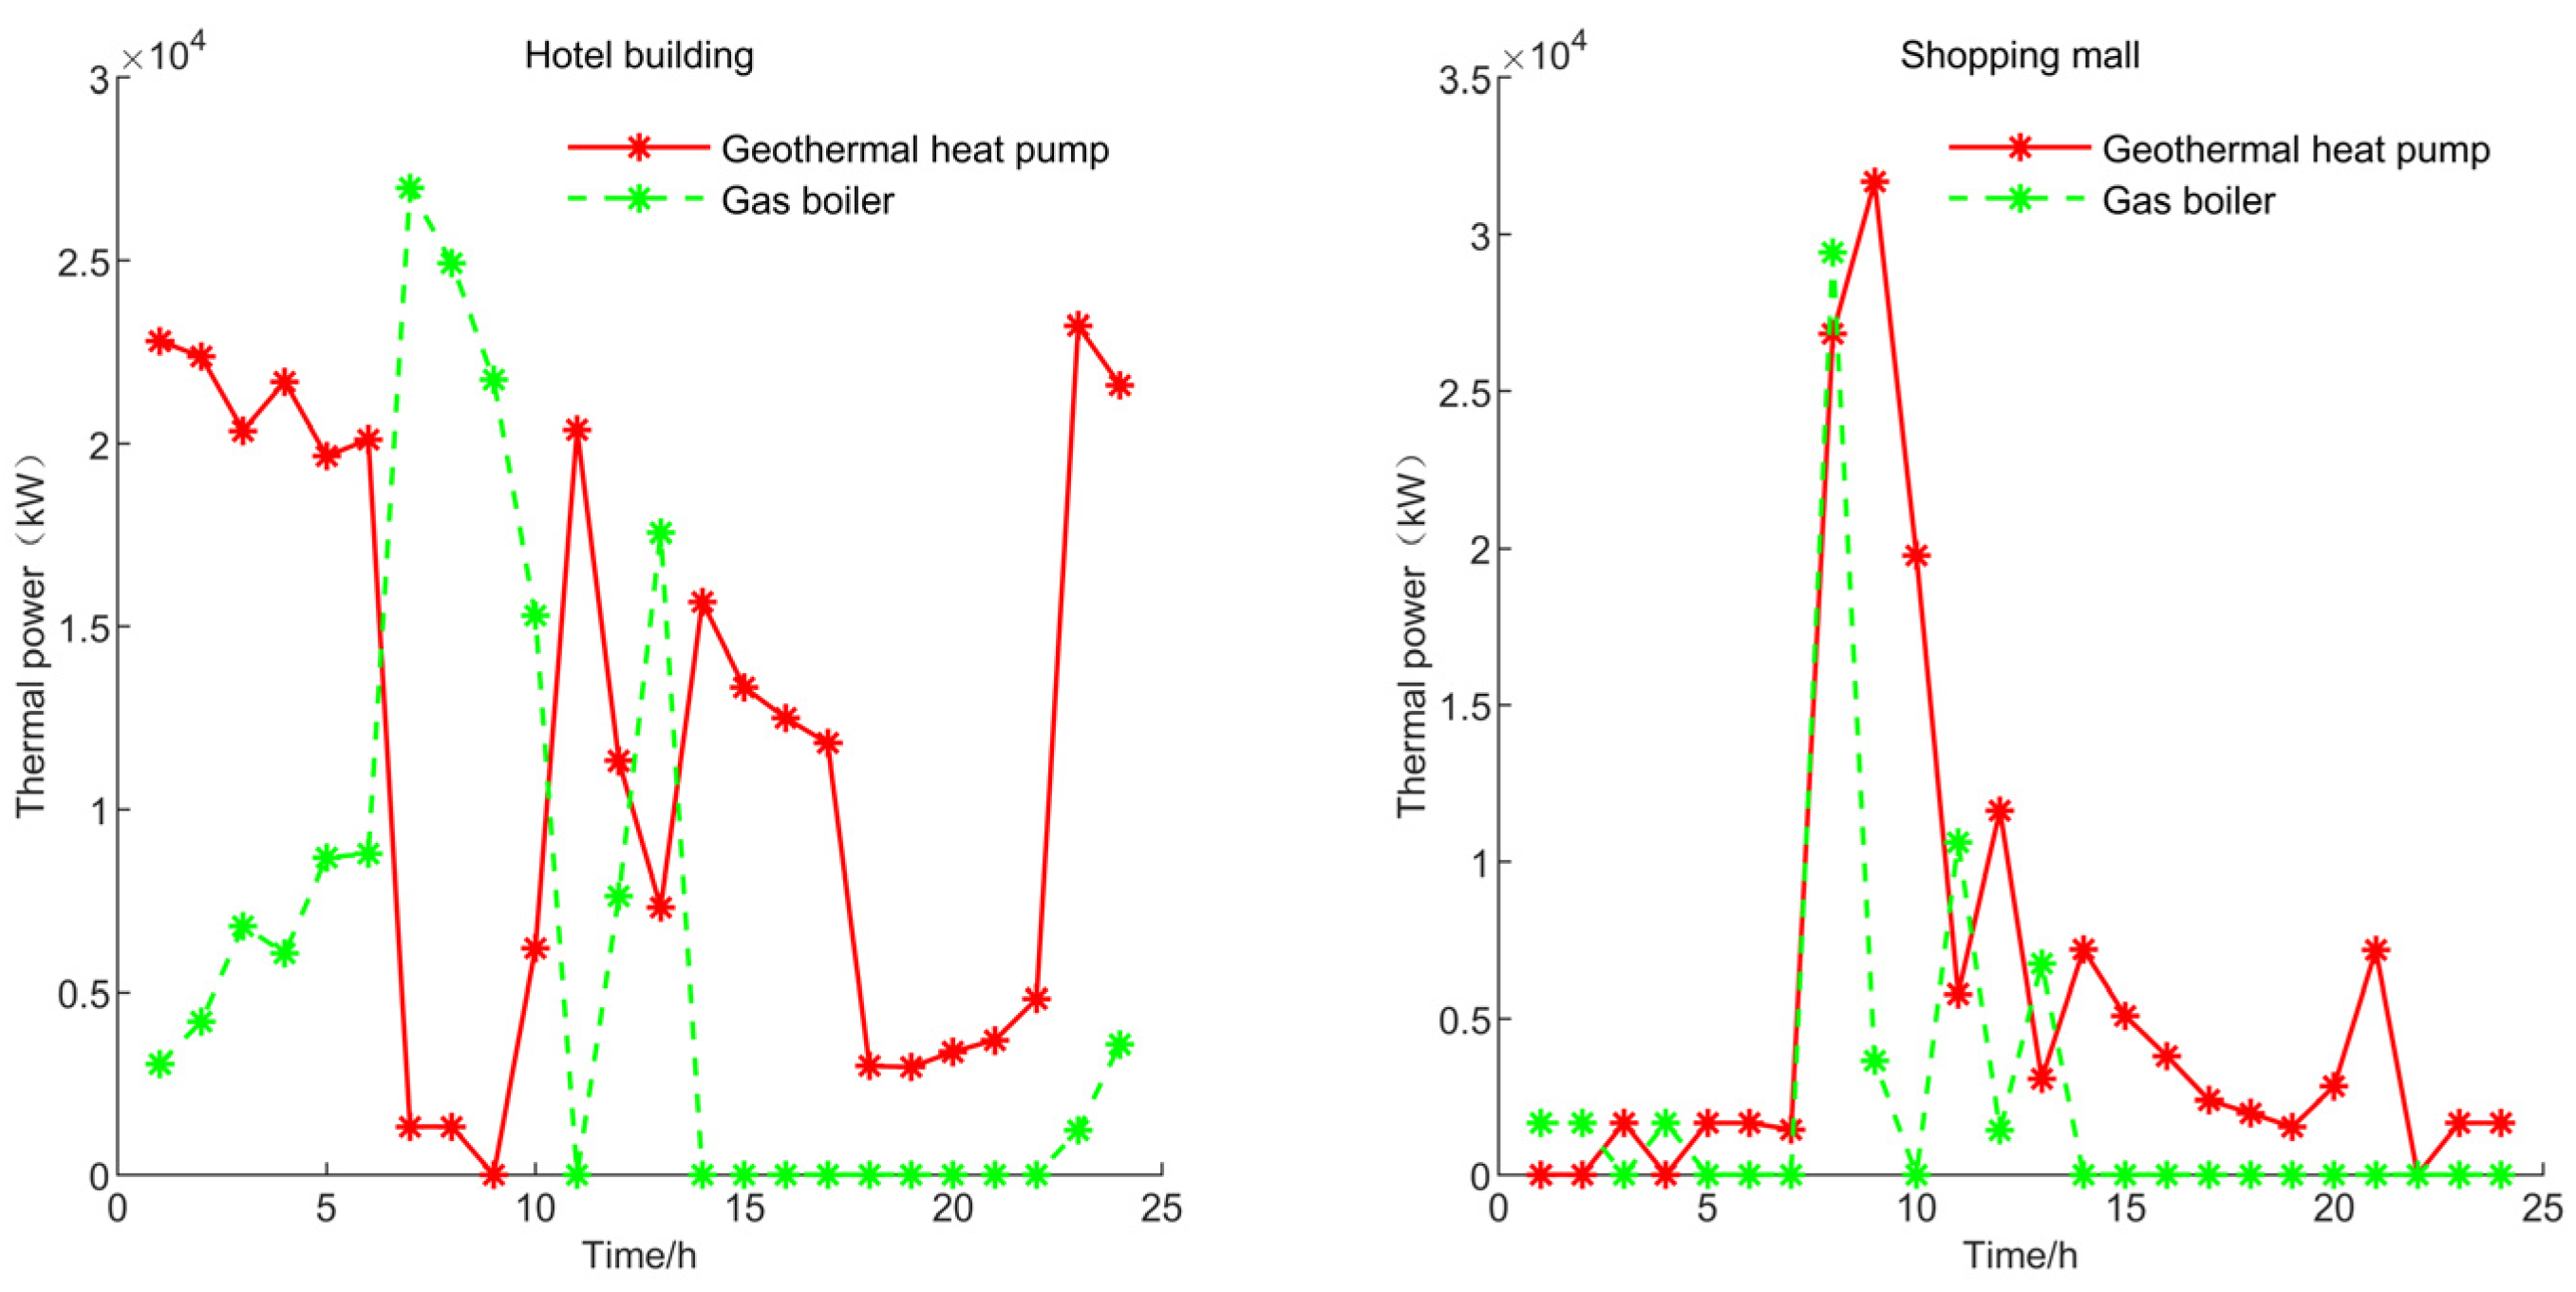
The heating power distribution within the building clusters is illustrated in Figure 14. The gas boiler system output is exclusively utilized in public buildings. The allocation ratios of the ground-source heat pump system vary across residential buildings, office buildings, hotel buildings, and shopping mall buildings, with percentages of 0, 46.54%, 65.01%, and 71.20%, respectively. In comparison to the scenario where shallow ground-temperature energy is not shared (as depicted in Figure 15), wherein each building clusters solely taps into the shallow ground-temperature energy within its own premises without utilizing that of adjacent building clusters, the shared scenario presents notable differences. Under this arrangement, the output of the geothermal heat pump system constitutes 37.63% of the total heating supply, with shallow geothermal energy utilization accounting for 46.90% of the maximum total energy supply. The distribution ratios of ground-source heat pump systems in residential buildings, office buildings, hotel buildings, and shopping mall buildings are 0%, 21.80%, 22.46%, and 24.44%, respectively.
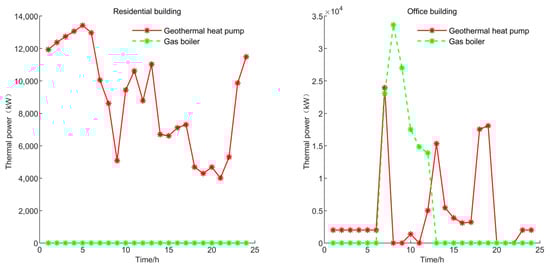
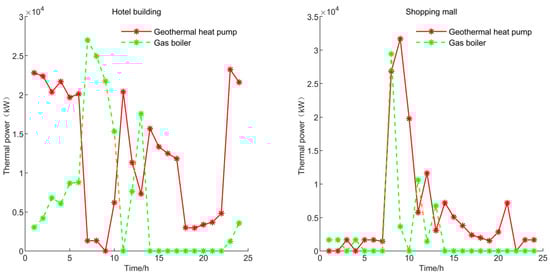
Figure 14.
Itemized thermal power.
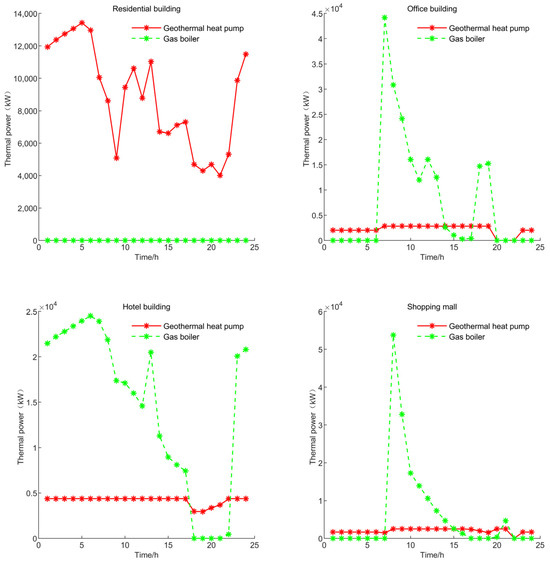
Figure 15.
Itemized thermal power under no-sharing scenario.
4. Conclusions
The paper introduces a collaborative optimization method for managing energy supply and demand in urban building groups and regional energy systems. It presents 12 building group prototypes with different functions and optimizes their energy consumption and functional ratios to propose district energy system configurations. Here are the key points:
(1) Without adding additional flexibility facilities, maximizing the flexibility of electric vehicle energy storage and load management can accomplish peak shaving and off-peak utilization of building energy consumption, thereby reducing energy costs to a certain extent. By fully harnessing the flexibility potential inherent in the building complex, the study demonstrates a potential reduction in building energy costs of up to 44.98%;
(2) By optimizing the functional composition ratios across various types of building groups, a certain level of multi-energy complementarity of building loads can be achieved, thereby enhancing load leveling and increasing the integration of renewable energy sources. Specifically, when the ratio of public buildings to residential buildings is set at 3:7, the levelized rate of building loads reaches its minimum, significantly lower than that of other single-functional building groups;
(3) The functional proportioning method of different types of building groups can be used to increase the penetration rate of renewable energy in building groups and often has a significant negative correlation with the proportion of public building types. The functional proportioning method can provide a certain reference for the planning and construction of building groups from an energy perspective;
(4) The two-layer optimization method of regional energy system configuration can easily obtain the system capacity configuration plan and accurately match the operation optimization plan. Among them, the design of shared energy storage can further tap the energy flexibility potential of building groups, increase the consumption of renewable energy, and achieve carbon emission reduction goals;
(5) Collaborative utilization of shallow geothermal energy among prototypes of diverse building clusters significantly enhances the efficiency of shallow geothermal energy application. In contrast to the non-sharing scenario, the output of the geothermal heat pump system in the shared configuration surged from 37.63% to 68.79% of the total heating supply, resulting in a substantial increase in the utilization rate of shallow low-temperature energy resources, rising from 46.90% to 85.74%;
(6) The collaborative optimization strategy proposed in the study extends to the building planning stage. Construction and operation of the regional energy system are conducted based on the optimization of building energy consumption, exhibiting a hierarchical structure.
Although some research has been carried out, the collaborative method only calculates the effects that can be achieved by applying energy flexibility on a theoretical level and does not consider what incentives are used to achieve energy flexibility applications, how to motivate electric vehicle owners to participate in energy storage, etc. The issue requires further study.
Author Contributions
Conceptualization, Y.L.; methodology, P.W.; software, P.W.; validation, P.W.; formal analysis, P.W.; investigation, P.W.; resources, Y.L.; data curation, P.W.; writing—original draft preparation, P.W.; writing—review and editing, Y.L.; visualization, P.W.; supervision, Y.L.; project administration, Y.L.; funding acquisition, Y.L. All authors have read and agreed to the published version of the manuscript.
Funding
This research was funded by the National Key R&D Plan Project (No. 2023YFE0102100).
Data Availability Statement
The data presented in this study are included in the manuscript.
Conflicts of Interest
The authors declare no conflicts of interest.
References
- Cao, X.; Dai, X.; Liu, J. Building energy-consumption status worldwide and the state-of-the-art technologies for zero-energy buildings during the past decade. Energy Build. 2016, 128, 198–213. [Google Scholar] [CrossRef]
- Liu, J.; Chen, X.; Yang, H.; Shan, K. Hybrid renewable energy applications in zero-energy buildings and communities integrating battery and hydrogen vehicle storage. Appl. Energy 2021, 290, 116733. [Google Scholar] [CrossRef]
- Li, H.; Wang, Z.; Hong, T.; Piette, M.A. Energy flexibility of residential buildings: A systematic review of characterization and quantification methods and applications. Adv. Appl. Energy 2021, 3, 100054. [Google Scholar] [CrossRef]
- Yu, X.; Xu, X.; Chen, S.; Wu, J.; Jia, H. A brief review to integrated energy system and energy internet. Trans. China Electrotech. Soc. 2016, 31, 1–13. [Google Scholar]
- Wang, Y.; Wang, Y.; Huang, Y.; Li, F.; Zeng, M.; Li, J.; Wang, X.; Zhang, F. Planning and operation method of the regional integrated energy system considering economy and environment. Energy 2019, 171, 731–750. [Google Scholar] [CrossRef]
- Mu, Y.; Chen, W.; Yu, X.; Jia, H.; Hou, K.; Wang, C.; Meng, X. A double-layer planning method for integrated community energy systems with varying energy conversion efficiencies. Appl. Energy 2020, 279, 115700. [Google Scholar] [CrossRef]
- Zhang, Z.; Jing, R.; Lin, J.; Wang, X.; van Dam, K.H.; Wang, M.; Meng, C.; Xie, S.; Zhao, Y. Combining agent-based residential demand modeling with design optimization for integrated energy systems planning and operation. Appl. Energy 2020, 263, 114623. [Google Scholar] [CrossRef]
- Huang, P.; Lovati, M.; Zhang, X.; Bales, C. A coordinated control to improve performance for a building cluster with energy storage, electric vehicles, and energy sharing considered. Appl. Energy 2020, 268, 114983. [Google Scholar] [CrossRef]
- Hachem-Vermette, C.; Singh, K. Optimization of the mixture of building types in a neighborhood and their energy and environmental performance. Energy Build. 2019, 204, 109499. [Google Scholar] [CrossRef]
- Fan, C.; Huang, G.; Sun, Y. A collaborative control optimization of grid-connected net zero energy buildings for performance improvements at building clusters level. Energy 2018, 164, 536–549. [Google Scholar] [CrossRef]
- Liu, J.; Wu, H.; Huang, H.; Yang, H. Renewable energy design and optimization for a net-zero energy building integrating electric vehicles and battery storage considering grid flexibility. Energy Convers. Manag. 2023, 298, 117768. [Google Scholar] [CrossRef]
- Wang, B.; Yu, X.; Xu, H.; Wu, Q.; Wang, L.; Huang, R.; Zhou, Q. Scenario analysis, management, and optimization of a new Vehicle-to-Micro-Grid (V2μG) network based on off-grid renewable building energy systems. Appl. Energy 2022, 325, 119873. [Google Scholar] [CrossRef]
- Khan, S.; Sudhakar, K.; Bin Yusof, M.H. Building integrated photovoltaics powered electric vehicle charging with energy storage for residential building: Design, simulation, and assessment. J. Energy Storage 2023, 63, 107050. [Google Scholar] [CrossRef]
- Stewart, I.D.; Oke, T.R. Local climate zones for urban temperature studies. Bull. Am. Meteorol. Soc. 2012, 93, 1879–1900. [Google Scholar] [CrossRef]
- Beijing Bureau of Statistics. Beijing Statistical Yearbook; China Statistics Press: Beijing, China, 2022.
- Wu, P.; Liu, Y. Impact of Urban Form at the Block Scale on Renewable Energy Application and Building Energy Efficiency. Sustainability 2023, 15, 11062. [Google Scholar] [CrossRef]
- Yang, A.; Wang, H.; Li, B.; Tan, Z. Capacity optimization of hybrid energy storage system for microgrid based on electric vehicles’ orderly charging/discharging strategy. J. Clean. Prod. 2023, 411, 137346. [Google Scholar] [CrossRef]
- Artigues, C.; Koné, O.; Lopez, P.; Mongeau, M. Mixed-integer linear programming formulations. Handb. Proj. Manag. Sched. 2015, 1, 17–41. [Google Scholar]
- Borodin, V.; Bourtembourg, J.; Hnaien, F.; Labadie, N. COTS software integration for simulation optimization coupling: Case of ARENA and CPLEX products. Int. J. Model. Simul. 2019, 39, 178–189. [Google Scholar] [CrossRef]
- Abdullah-Al-Nahid, S.; Khan, T.A.; Taseen, M.A.; Jamal, T.; Aziz, T. A novel consumer-friendly electric vehicle charging scheme with vehicle to grid provision supported by genetic algorithm based optimization. J. Energy Storage 2022, 50, 104655. [Google Scholar]


Disclaimer/Publisher’s Note: The statements, opinions and data contained in all publications are solely those of the individual author(s) and contributor(s) and not of MDPI and/or the editor(s). MDPI and/or the editor(s) disclaim responsibility for any injury to people or property resulting from any ideas, methods, instructions or products referred to in the content. |
© 2024 by the authors. Licensee MDPI, Basel, Switzerland. This article is an open access article distributed under the terms and conditions of the Creative Commons Attribution (CC BY) license (https://creativecommons.org/licenses/by/4.0/).