Article

An Analysis Method of System Coupling and Spatio-Temporal Evolution of County New Urbanization and Logistics Industry

School of Management Engineering and Business, Hebei University of Engineering, Handan 056038, China
*
Author to whom correspondence should be addressed.
Systems 2024, 12(6), 185; https://doi.org/10.3390/systems12060185
Submission received: 18 April 2024 / Revised: 19 May 2024 / Accepted: 23 May 2024 / Published: 24 May 2024

Abstract

:
New urbanization in counties and the logistics industry are closely related and are essential in promoting regional economic and social development. There are specific challenges and obstacles to revealing the interaction mechanism and system state measurement between the two. This paper explains the two coupling mechanisms and constructs the evaluation index system. It proposes a new analysis method based on the coupling coordination degree model, the spatio-temporal evolution analysis, and the grey prediction model. The goal is to learn more about and fully realize the coordinated development mechanisms of the two. It then uses the Hebei province of China as an example to empirically analyze its systematic cross-sectional data from 2013 to 2022. Research findings: (1) In Hebei province, the new urbanization in counties and the logistics industry have a systematic coupling relationship. However, the logistics industry’s comprehensive development level is relatively lagging. The two systems have been at a high-level coupling stage for the last decade and maintain a high coupling status. The coupling coordination has shown significant improvement. (2) Although the geographical distribution of the coupling and coordination degree of the new urbanization in counties and logistics industry system has short-term volatility, it is still stable in the long term and presents economic-related spatial characteristics. (3) Over the next five years, the coupling coordination of 11 cities in Hebei province will steadily grow. There will be greater harmonization between the two systems. (4) From the analysis results, the evaluation index system of the coupled system constructed is scientific and reasonable. The analysis method can not only measure the system’s coupling degree, but it can also predict the development trend and analyze the spatial evolution. The technique has novelty and validity, which can be used as a reference for analyzing and making decisions about similar systems.

1. Introduction

A country’s modernization is inseparable from the coordinated development of urban and rural areas. New urbanization is defined as urban-rural integration, industrial interaction, and resource intensification. Its goal is to achieve rational population movement, coordinated development of urban and rural areas, and harmonious ecosystems. The county serves as the fundamental unit in county urbanization, promoting the harmonious development of both urban and rural regions. It can form a buffer zone in rural-urban migration, thus avoiding a series of challenges, such as the massive and rapid growth of the urban population, lagging infrastructure development, and imbalanced industrial development [1]. As the new urbanization in counties continues to evolve, the demand for production and living materials by urban residents and industrial and commercial enterprises will expand. As a primary service industry, the logistics industry supports the sustained development of the national economy. It not only promotes commerce and trade circulation between industry and agriculture, as well as between cities and rural areas, but also facilitates the integrated development of urban and rural areas. The continuous promotion of new urbanization in counties also provides a broader trading market and spatial support for modern logistics development. Thus, it promotes the improvement of regional infrastructure, the optimization of industrial structures, and the enhancement of the logistics industry’s efficiency. The new urbanization in counties and the logistics industry have established a closely linked and mutually beneficial coupling system. Examining the interaction mechanism and coordination state of the measurement system between the two is beneficial in identifying the most effective approach for fostering coordinated growth between urban and rural areas that aligns with national and regional needs. It will enable government departments and regional managers to make informed decisions.
Hence, there is an urgent need for a set of scientific evaluation indexes and measurement methods to assess the systematic coupling degree, coordinated development status, and future development trend of new urbanization in counties and the logistics industry. By formulating and optimizing relevant policies and measures through timely and rational evaluations, we can promote the high-quality development of the regional economic and social system.

2. Literature Review

2.1. New Urbanization and Logistics Industry

When exploring the relationship between new urbanization and the logistics industry, most scholars believe there is a close interaction between the two. Singelmann’s analysis of dynamic effects revealed that promoting urbanization positively influenced the advancement of the logistics industry [2]. Eiichi et al. introduced the notion of “urban logistics”, which refers to the movement of commodities within an urban area and their distribution beyond its boundaries [3]. Marsden et al. believed that the differences in the characteristics of different agricultural products should be considered when constructing the supply chain of agricultural products [4]. Costopoulou et al. pointed out the importance of establishing a logistics supply chain for agricultural products [5]. Muñuzuri et al. explored the government’s role in building urban logistics systems [6]. Srivastava et al. highlighted the importance of emphasizing the green supply chain in agricultural product logistics [7]. Using long-term annual data from the Netherlands Logistics Agency, Van et al. found that areas of logistics concentration brought about a relative increase in logistics employment [8]. Alan et al. argued that urbanization is crucial in supporting and facilitating logistics innovation [9]. Zhang et al. used the propensity score matching-difference-in-differences (PSM-DID) approach, which found that implementing new urbanization significantly contributes to modern logistics development [10]. Mwamba et al. argued that urbanization can affect the flow of goods transported in cities and impact the flow of goods and supplies to cities [11]. Rivera et al., using sequential logistics-related data from the 1998–2008–2018 analysis, demonstrated the evolution of the model and the trend of the so-called freight villages in the Madrid urban metropolitan area. To deeply study the dynamic relationship between the digital economy and new urbanization, scholars have begun to use a variety of models and methods for exploration [12]. Chhetri et al. used principal component analysis and a spatial autocorrelation model to reveal the importance of logistics cluster development for population urbanization [13]. Through mathematical models and econometrics, Zeng et al. delved into the interaction between urbanization and service sector employment [14]. Wang et al. created a model of GDP and cargo turnover to demonstrate the relationship between the logistics industry and economic development [15]. Through descriptive case studies, Bibri et al. explored the potential of data-driven intelligent solutions in sustainable city building [16]. Ye et al. constructed an evaluation system to reveal the spatial and temporal evolution patterns of the logistics industry, urbanization, and ecological environment in a coordinated manner [17]. Ionescu et al. built a low-cost intelligent city model to identify growth-sensitive elements and provide medium and long-term alternatives for urban communities and economies [18].

2.2. County New Urbanization and Urban and Rural Development

Urbanization is a significant indicator of the advancement of modern society. The interaction between urban and rural areas plays a crucial role in urbanization. Fertne explored urban-rural interactions by examining the processes of urbanization and migration patterns in specific regions [19]. Olawepo et al. found that accelerated urbanization contributes to the growth of farmers’ income and the process of modernizing agriculture and rural areas [20]. Remy et al. emphasized improving the relationship between rural and urban environments [21]. According to Liu et al., mobility between urban and rural areas is of non-negligible importance in promoting integrated urban and rural development [22]. Yang et al. emphasized the central role of counties in urban and rural green development, and the development of county-level low-carbon standards is crucial to promoting new urbanization [23]. The new urbanization of counties is a crucial way to achieve urban and rural development. Kerr III predicted Orange County’s level of rural and agricultural development [24]. Hong et al. proposed a specific strategy for building new urbanization in counties [25]. Soltani et al. argued that rural revitalization needs to increase rural investment and construction [26]. Ríos et al. examined the multifaceted impact of ecological agriculture on rural prosperity [27]. Li et al. emphasized that focusing on the ruralization strategy is crucial for the future development of urban-rural relations in China, as it can effectively promote rural revitalization [28]. Tan et al. argued that an in-depth exploration of the synergistic relationship between regional macroeconomics and rural transformation is critically important in promoting regional development [29]. Si pointed out that accelerating the process of urban-rural integration is an indispensable and critical link in realizing the rural revitalization strategy [30]. More scholars have recently adopted data analysis methods to conduct in-depth studies on the relationship between new urbanization and urban-rural development in counties. Zhang et al. used panel data from China’s counties from 2000 to 2015 to accurately calculate the urbanization rate and the index of rural hollowing out. He then thoroughly analyzed the spatial and temporal changes between the two using spatial autocorrelation analysis and the coupled coordination degree model [31]. Xing et al. developed an evaluation index system to determine how satisfied people were with digital governance in rural areas. He then used principal component analysis, multiple regression, and SEM structural equation modeling to analyze the data comprehensively [32].
In conclusion, the existing research primarily explores the relationship between urbanization, urban-rural integration, and the logistics industry. It primarily uses case studies and comparative analysis methods to reveal their interaction and the situation’s development. In terms of quantitative analysis, the majority of studies utilize econometric models. However, a comprehensive measure of the system’s state still needs to be improved. Research on the interaction between new urbanization and the logistics industry system within the specific regional scope of the county still needs to be completed. Furthermore, more research must be conducted on the coordinated development between the two. Therefore, this paper constructs the evaluation index system and measurement model from the mechanism of coupled development of new urbanization in counties and the logistics industry system. Subsequently, it conducts empirical research in Hebei province, China, as an illustrative example.

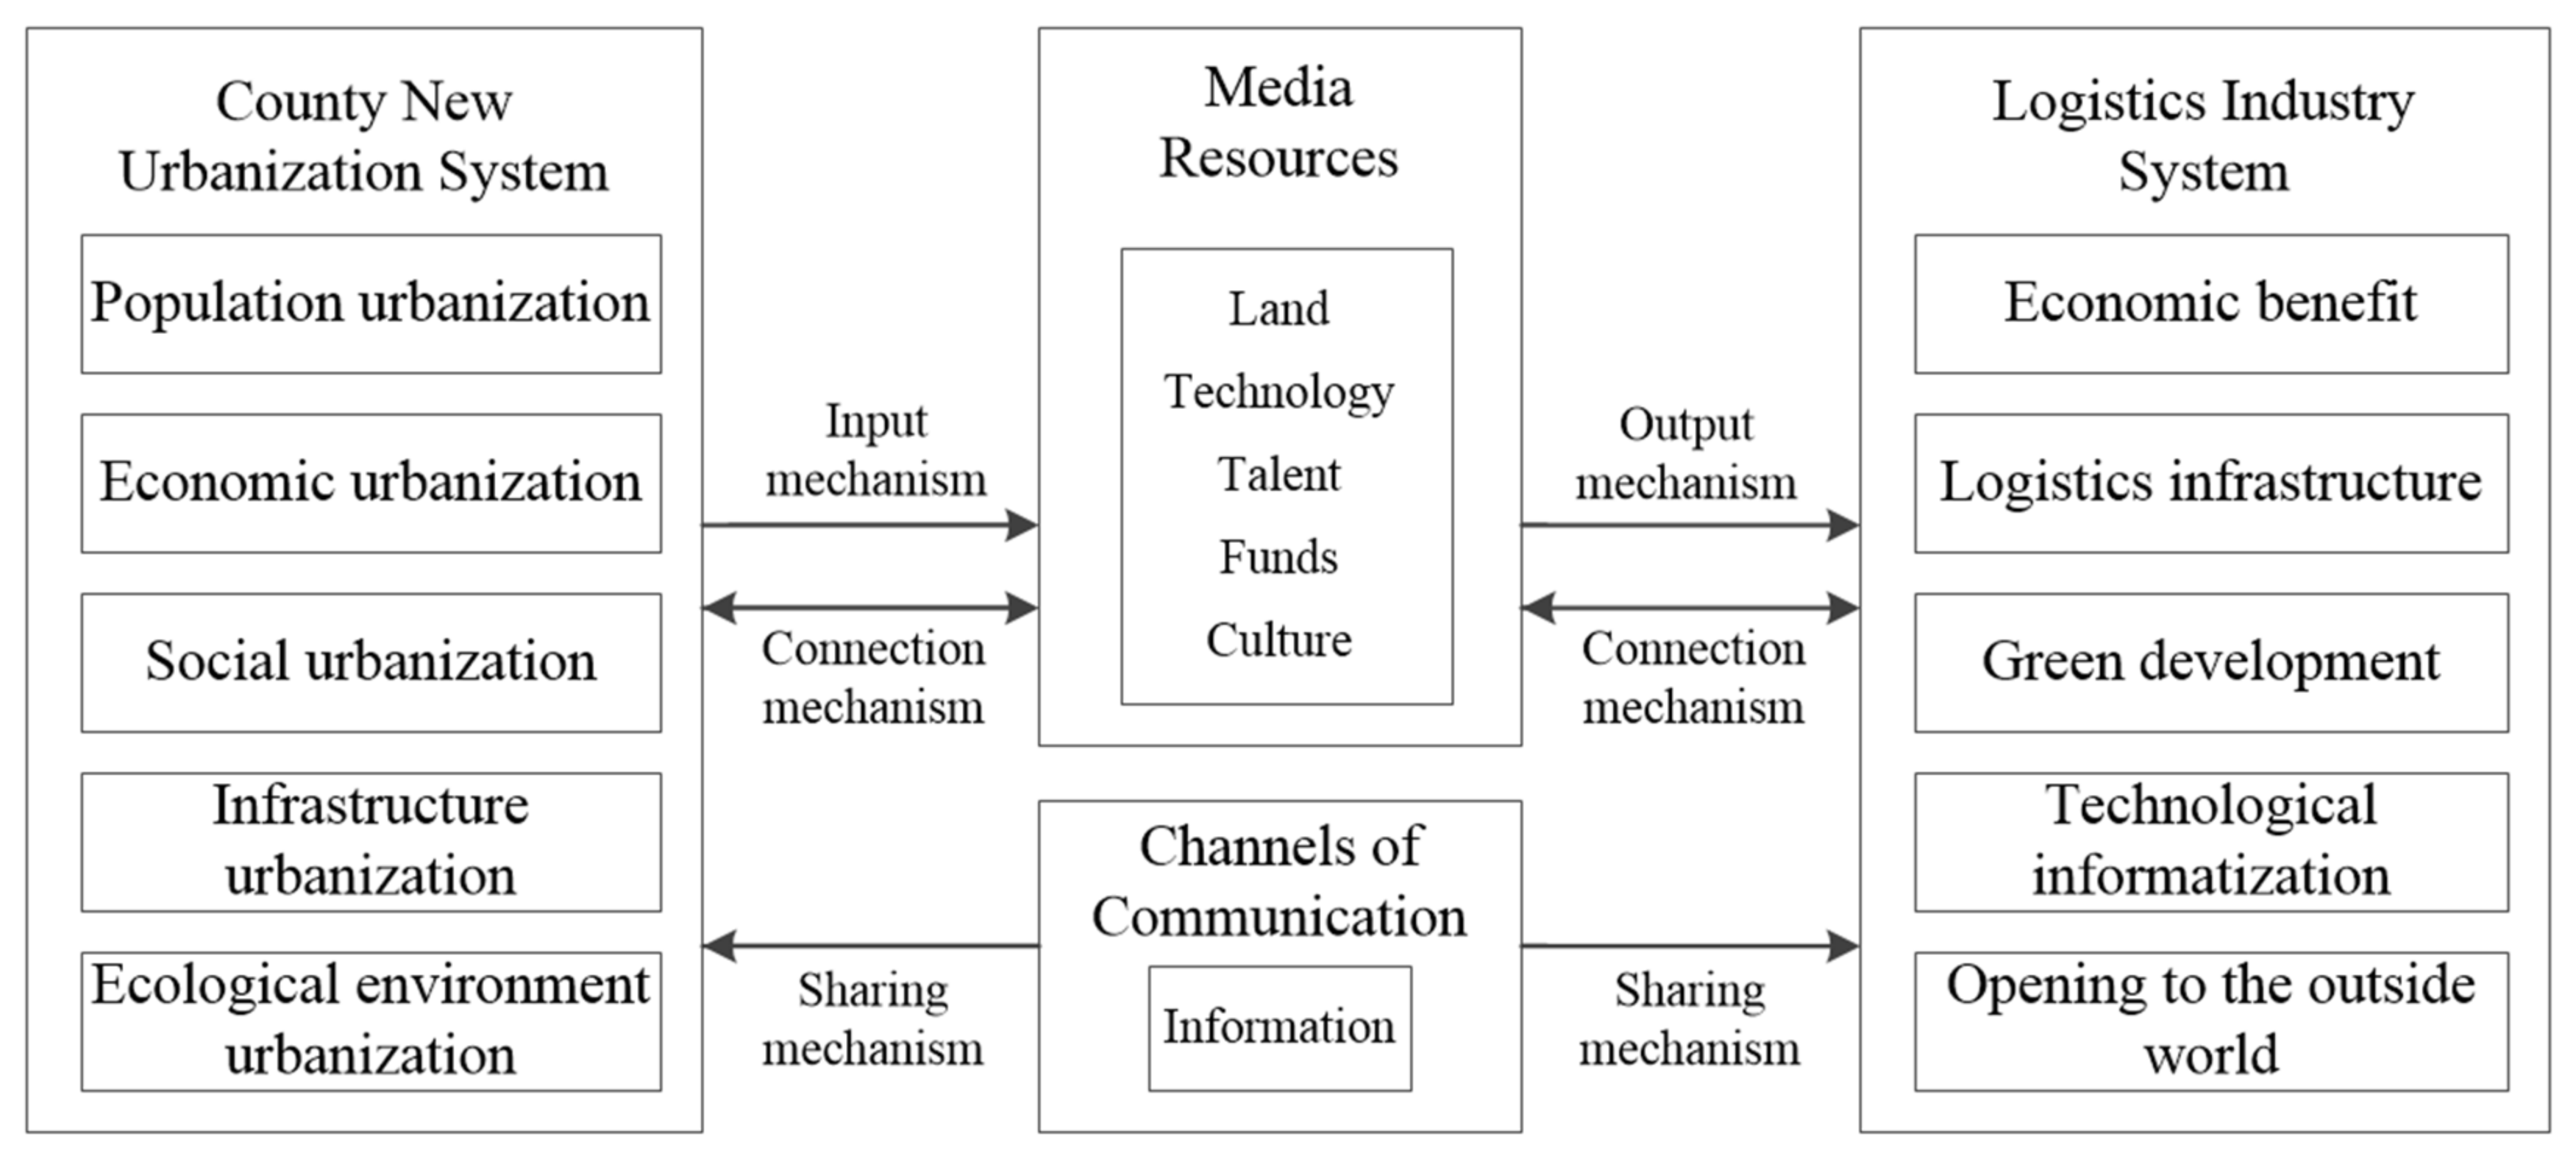
3. The Mechanism of Coupled Development of New Urbanization in Counties and Logistics Industry System

Coupling is the phenomenon in which two or more systems or modes of motion interact, influence, and even combine [33]. In the current era of advancing urban-rural integration and development, promoting new urbanization in counties presents opportunities for market demand and infrastructure construction within the logistics industry. Simultaneously, the development of the logistics industry can also support new urbanization in counties through services such as logistics transportation, warehousing, and distribution. These services play a crucial role in promoting the circulation of agricultural products and facilitating market access. Given the context of urban-rural integration development, analyzing the collaborative mechanism between the logistics industry and new urbanization in counties is critical. Figure 1 illustrates this relationship, providing clarity and coordination.

3.1. Input and Output Mechanisms

The new urbanization in counties mainly consists of population urbanization, economic urbanization, social urbanization, infrastructure urbanization, and ecological environment urbanization [34]. Population and economic urbanization can lead to the expansion of the logistics market, the increase in logistics demand, and the growth of the logistics industry. The advancement of social and infrastructural urbanization plays a crucial role in facilitating the development and improvement of logistics infrastructure. It leads to increased efficiency and improved logistics distribution and transportation services. Ecological urbanization requires the logistics industry to adopt a green development mode to reduce adverse environmental impacts. The new urbanization in counties provides the essential conditions for developing high-quality logistics. The logistics industry achieves its output goal by inputting system elements and utilizing media resources. (1) Population urbanization corresponds to economic benefit. Population urbanization, transferring people from rural areas to cities and towns, significantly impacts economic development. Lewis detailed his theory of dual economic structure in his 1954 book, Economic Development under an Unlimited Supply of Labor [35]. It explains how population migration can contribute to the growth of a city’s size and economic development, thereby increasing demand in the logistics industry and yielding increased economic benefits. (2) Economic urbanization signifies an opening to the outside world. Economic urbanization refers to the prosperity of the city economy, the enhancement of city functions, and the optimization and upgrading of industrial structures. It provides a solid foundation for opening up to the outside world. Krugman’s 1991 book Development, Geography, and Economic Theory emphasized the close link between urban economic development, industrial agglomeration, and opening up to the outside world [36]. Foreign investment and trade activities have surged with the rapid growth of the urban economy, benefiting international trade and cross-border logistics businesses within the logistics industry, thereby realizing the development of openness. (3) Social urbanization corresponds to green development. Social urbanization not only focuses on the development of urban society and the upgrading of social services but also emphasizes the popularization and practice of green concepts. Towards a Green Economy: Various Ways to Achieve Sustainable Development and Poverty Eradication emphasizes the importance of a green economy in urban development [37]. As a critical pillar of the city’s economy, the logistics industry should implement green logistics in transportation, warehousing, and distribution to reduce energy consumption and emissions, enhance resource utilization, and achieve sustainable development. (4) Infrastructure urbanization corresponds to logistics infrastructure. Urbanizing infrastructure, i.e., improving and upgrading urban infrastructure, provides strong support for developing the logistics industry. “Industrialization of Eastern and South-Eastern European Countries” presents the “Big Push” theory, which underscores the crucial role of infrastructure in economic development [38]. As infrastructure urbanizes, it continuously enhances and upgrades logistics infrastructure, ensuring the logistics industry operates efficiently and conveniently. (5) Ecological urbanization corresponds to technological informatization. Ecological urbanization focuses on protecting and improving the urban ecological environment while requiring technological innovation and information technology support. The theory of “competitive advantage” emphasizes the importance of technological innovation in enterprises’ acquisition of competitive advantage [39]. In ecological urbanization, the logistics industry is leveraging advanced technology and information technology systems to enhance operational efficiency and sustainability and achieve green, low-carbon, and circular development.

3.2. Connection Mechanism

Several factors, including land, technology, talent, funds, and culture, function as intermediaries within the coupling system connecting the logistics industry and new urbanization in counties. These elements facilitate the connection between the two domains. (1) The land has enabled the establishment of conducive circumstances for the coordinated advancement of the logistics system and the new urbanization in counties. A seamless connection between logistics nodes and urban areas can be achieved by strategically coordinating land resources, logistics parks, and urban planning. This integration facilitates the smooth flow of logistics operations, drives industries’ transformation and growth, and pushes economic development forward [40]. (2) Technology is pivotal in facilitating the cohesive development of the logistics industry system and the new urbanization in counties. By connecting technology, we can optimize logistics operations, elevate efficiency and service standards, bolster urbanization, and strengthen county urbanization and logistics industry competitiveness. (3) Talent is an essential factor in promoting the coordinated development of the new urbanization in counties and the logistics industry system. Various types of specialized talents are necessary to support and promote the coordinated development of the two systems. Attracting and fostering talents in urban planning, logistics, IT, and related fields will bolster overall development [41]. (4) Funds significantly aid both the coordinated development of the logistics industry system and the new urbanization in counties. By establishing effective financing channels and guiding the investment of social capital, it is possible to adequately fund the new urbanization in counties and the logistics industry. It ensures the development’s long-term sustainability and stability. (5) Culture plays a significant role in the coordinated development of the logistics industry system and the new urbanization in counties. Promoting local culture can enhance the recognition and support of all societal parties for urbanization and logistics development. This promotion also facilitates communication and cooperation between community residents and enterprises, fostering the organic integration of new urbanization in counties with the logistics industry. Ultimately, this approach promotes economic prosperity and social progress within the county.

3.3. Sharing Mechanism

As a means of facilitating reciprocal advantages that advance urban-rural development and encourage high-quality economic development, information sharing is an essential link between the logistics industry and the new urbanization in counties [42]. (1) It can improve information transparency and circulation efficiency. By establishing an information-sharing platform and mechanism, we can facilitate the exchange of information between urbanization and logistics systems. It will ensure timely access to data for all parties involved, ultimately improving transparency and accuracy while reducing information asymmetry and friction. (2) It can promote cooperation and coordinated development. By sharing information, all parties can better understand each other’s needs and resources and seek cooperation and joint development opportunities. For example, by sharing logistics demand information, the urbanization planning department can provide cooperation and investment opportunities for logistics enterprises. Logistics enterprises can provide support and services for urbanization construction by sharing urbanization planning information to achieve a mutual benefit. (3) It can enhance the precision and scientific nature of decision-making. Decision-makers can receive more comprehensive and accurate data support by sharing data and information from all parties. It enables them to make more scientific and accurate decisions.

4. Research Design

4.1. Research Methods

This paper evaluates the development status of the coupling coordination between two systems, utilizing a coupled coordination degree model, and delves into its spatiotemporal evolution. Subsequently, it forecasts the coupling coordination status between the systems, leveraging the grey prediction model. The composite system comprises the logistics industry and new urbanization in counties, which can be defined as U = { U 1 ,   U 2 } , with the new urbanization in counties subsystem as U 1 and the logistics industry subsystem as U 2 .

4.1.1. Coupled Coordination Degree Model

(1)
Standardization of Data
The conversion of unprocessed data into dimensionless values using standardization methods enables the comparison of indicators with varying units or magnitudes. To ensure the accuracy and fairness of the subsequent calculation, the denominator’s standardized value cannot be 0. We uniformly multiply the standardized indicator values by 0.99 and then increase them by 0.01 to prevent the standardized data from being 0 and impacting the calculation.
In the case of positive indications, a higher indicator value corresponds to a more substantial influence on the system. The formula for the calculation is as follows:
Z i j = [ ( x i j     min x i j max x i j     min x i j )   ×   0.99 ]   +   0.01
In the case of negative indications, a smaller value of the indicator corresponds to a more substantial influence on the system. The formula for the calculation is as follows:
Z i j = [ ( max x i j     x i j max x i j     min x i j )   ×   0.99 ]   +   0.01
In the formula, x i j is the j th data of the i th index ( i = 1 ,   2 ,   3 ,   ,   n ,   j = 1 ,   2 ,   3 ,   ,   m ), and the standardized data for each index is denoted by Z i j .
(2)
Calculation of Indicator Weights ( Ω j )
We calculated the weights of the indicators using the entropy method to make the study’s results more objective. In the following expressions, P i j represents the weight of indicator j , e j denotes its entropy value, and Ω j signifies its weight. The formula for the calculation is as follows:
P i j = Z i j i , j = 1 n Z i j
e j = 1 ln n × i , j = 1 n P i j × ln P i j ( 0     e j     1 )
Ω j = 1 e j j = 1 n 1 e j
(3)
Calculation of the Comprehensive Development Index of the System ( H )
We calculate a composite development index for each subsystem based on the weights, reflecting the state of development among the systems. The formula for the calculation is as follows:
H x = i , j = 1 n Z i j   ×   Ω j
H y = i , j = 1 n Z i j   ×   Ω j
In the formula, the value H x represents the level of new urbanization in counties’ comprehensive development index, while the value H y represents the level of logistics comprehensive development index.
(4)
Calculation of Synergy Development Coefficient ( E )
The relative development status of new urbanization in counties and the logistics industry can be assessed using the synergy development coefficient. The formula for the calculation is as follows:
E = H y H x
Table 1 displays the criteria for dividing the synergy development coefficient.
(5)
Calculate the Degree of Coupling Coordination ( D )
Applying coupled coordination degree models to the sustainability evaluation of systems. The formula for the calculation is as follows:
C = 2   ×   H x   ×   H y H x   +   H y 2 1 2           ( 0 C 1 )
T = α H x   +   β H y           ( 0 T 1 )
D = C × T           ( 0 D 1 )
In the formula, C is the degree of coupling, representing the intensity of system interaction, and Table 2 illustrates the division of the coupling degree. We denote the coordination index as T . This paper considers the two systems of new urbanization in counties and the logistics industry to have the same degree of importance, denoting them as α and β , respectively, with weights of 0.5 for each. We denote the degree of coupling coordination as D , which measures the level of coordination between two systems. Table 3 displays the degree of coupling coordination division, with a higher value of D indicating greater coordination between the systems.

4.1.2. Grey Prediction Model

By generating data sequences and related differential equation models, the grey prediction model can forecast future trends and predict the presence of uncertainties in a system [43]. The modeling process is described below.
(1)
Grade Ratio Test
Before building a grey prediction model, the feasibility of the method needs to be verified. Let the original series be x 0 = x 0 1 , x 0 2 , , x 0 m , and m be the number of raw data. Perform a grade-ratio test on the original series.
λ t = x 0 ( t 1 ) x 0 ( t )   ,   t = 2 ,   3 ,   ,   m
In the formula, if all λ t lie within the interval B = ( e 2 m + 1 ,   e 2 m + 1 ) , x 0 can be modeled as a grey prediction. Otherwise, it is necessary to perform the translation transformation of the original sequence and take the constant c such that the grade ratios all fall within the interval, that is, y 0 t   = x 0 t + c ,   t = 1 ,   2 ,   ,   m .
(2)
Generate Cumulative Sequences
The primary objective of the grey prediction model is to extract the progression of the information accumulation process using the accumulation operator. By reducing the unpredictability and uncertainty of the original sequence by generating a cumulative sequence, we can enhance the stability and reliability of the grey prediction model. An outline of the modeling process is presented below:
x 1 = x 1 1 ,   x 1 2 , ,   x 1 m
A cumulative treatment occurs when it passes the ratio test.
x 1 t = i = 1 t x 0 i   ,   t = 1 ,   2 ,   ,   m
(3)
Constructing a Grey Prediction Model
We developed a grey prediction model based on the cumulative series.
x 0 t   +   α x 1 t = μ
The corresponding model of whitening is:
d x 1 d t + α x 1 ( t ) = μ
where α denotes the development coefficient and μ denotes the grey action quantity.
(4)
Generate Equal Weight Neighbor Value Generation Sequence
z 1 = z 1 2 ,   z 1 3 ,   ,   z 1 t
z 1 t = γ x 1 t + ( 1     γ ) x 1 t     1   ,   t = 2 ,   3 ,   ,   m
In the formula, z 1 t is the number of neighboring values of the cumulative series x 1 under the weight γ . γ denotes the weighting factor, γ 0 ,   1 . A reference to existing research, γ = 0.5 , is made in this paper. The grey prediction model can be transformed:
x 0 t + α z 1 t = μ
(5)
Calculation of Unknown Variables
Obtained by least squares fitting:
α ^ = B T B 1 B T U n = α , μ T
Calculate the estimated values for the parameters. The variables B and U n represent the data matrix and data vector, respectively:
B = 1 2 ( x 1 1 + x 1 2 ) 1 1 2 ( x 1 2 + x 1 3 ) 1 1 2 ( x 1 m 1 + x 1 m ) 1
U n = x 0 ( 2 ) x 0 ( 3 ) x 0 ( m )
(6)
Restore Predicted Values
Substituting the estimated values of α and μ into the grey prediction model, we obtain solution x ^ ( 1 ) t of the model and restore the predicted value x ^ ( 0 ) t .
x ^ ( 1 ) t = x 0 1 μ α e α t 1 + μ α
x ^ ( 1 ) t + 1   = ( x ^ ( 0 ) 1 μ α ) e α t + μ α   ,   t = 1 , 2 , , m 1
x ^ ( 0 ) t   = x ^ ( 1 ) t + 1 x ^ 1 t   ,   t = 1 , 2 , , m 1
(7)
Accuracy Grade Test
Following the calculation of the grey prediction model, the mean squared error ratio value and the small error probability value test the prediction accuracy.
S 1 2 = 1 n k = 1 n x 0 t 1 n k = 1 n x 0 t 2
S 2 2 = 1 n k = 1 n e t 1 n k = 1 n e t 2
e t = x 0 t     x ^ 1 t   ,   t = 1 , 2 , , m
C = S 2 S 1
ρ = e t 1 n k = 1 n e t < 0.6745 S 1
In the formula, S 1 2 denotes the original series variance, S 2 2 denotes the variance of the residual series, and e t denotes the residual. C denotes the ratio of mean squared deviations and ρ denotes the small error probability. Table 4 presents the criteria for dividing the model’s accuracy.

4.2. Establishment of an Evaluation Indicator System

The study adhered to systematization, simplicity, data availability, and reference [44,45]. Sixteen indicators were selected from population urbanization, economic urbanization, social urbanization, infrastructure urbanization, and ecological environment urbanization, and fourteen indicators were selected from economic benefit, logistics infrastructure, green development, technological informatization, and opening to the outside world. Table 5 illustrates the construction of the evaluation index system that couples and coordinates the new urbanization in counties and the logistics industry systems.

5. Empirical Analysis

5.1. Data Sources

This study uses the Hebei province of China as an example, and the primary sources of data include the China Statistical Yearbook, Hebei Economic Yearbook, Hebei Statistical Yearbook, Hebei National Economic and Social Development Statistical Bulletin, as well as the Statistical Yearbook and Government Statistical Bulletin of cities in Hebei province from 2014 to 2023. We utilized the missing data processing function in the SPSS program to address the issue of missing data by employing the neighborhood point linear trend method.

5.2. A Comprehensive Evaluation of the New Urbanization in Counties and the Logistics Industry System

From Formulas (1)–(7), the comprehensive development index ( H x , H y ) of the new urbanization in counties and logistics industry in Hebei province from 2013 to 2022 are calculated, as shown in Table 6.

5.2.1. Evaluation of County New Urbanization Construction

Table 6 shows that in 2013, the comprehensive development index of new urbanization in counties in the Hebei province was 0.310. This value increased to 0.444 in 2022, demonstrating a clear upward trend, and the average annual growth rate for this index is 4.078%. The main reason is that the government has formulated and implemented a series of policies to promote the development of the regional economy and new urbanization. It encourages people to move to county cities and provides solid economic support and policy guarantees for its prosperity. Among them, the tax relief, increased financial investment, optimization of land policies, and other specific measures covered by Several Measures on Supporting the Construction of County Economy and New Urbanization and Opinions on Vigorously Promoting the High-quality Development of County Economy have laid a solid foundation for the prosperity of the county economy. The rapid economic growth and accelerated urbanization have bolstered the country’s industrial structure and economic vitality, creating more development opportunities and potential for new urbanization. It has also attracted increased investment and resource inflows to promote the construction of new urbanization in counties, further enhancing the overall economic landscape.

5.2.2. Evaluation of Logistics Industry Development

Table 6 shows that in 2013, the comprehensive development index of the logistics industry in Hebei province was 0.181. This value increased to 0.277 in 2022, demonstrating a clear upward trend, and the average annual growth rate for this index is 4.806%. The reasons for this are mainly the construction and improvement of transportation infrastructure, such as roads, railroads, airways, and ports, which have improved the efficiency and convenience of logistics transportation. The logistics industry has improved service quality and efficiency by implementing advanced information systems and technologies and optimizing supply chain management in response to urbanization and rapid economic development.

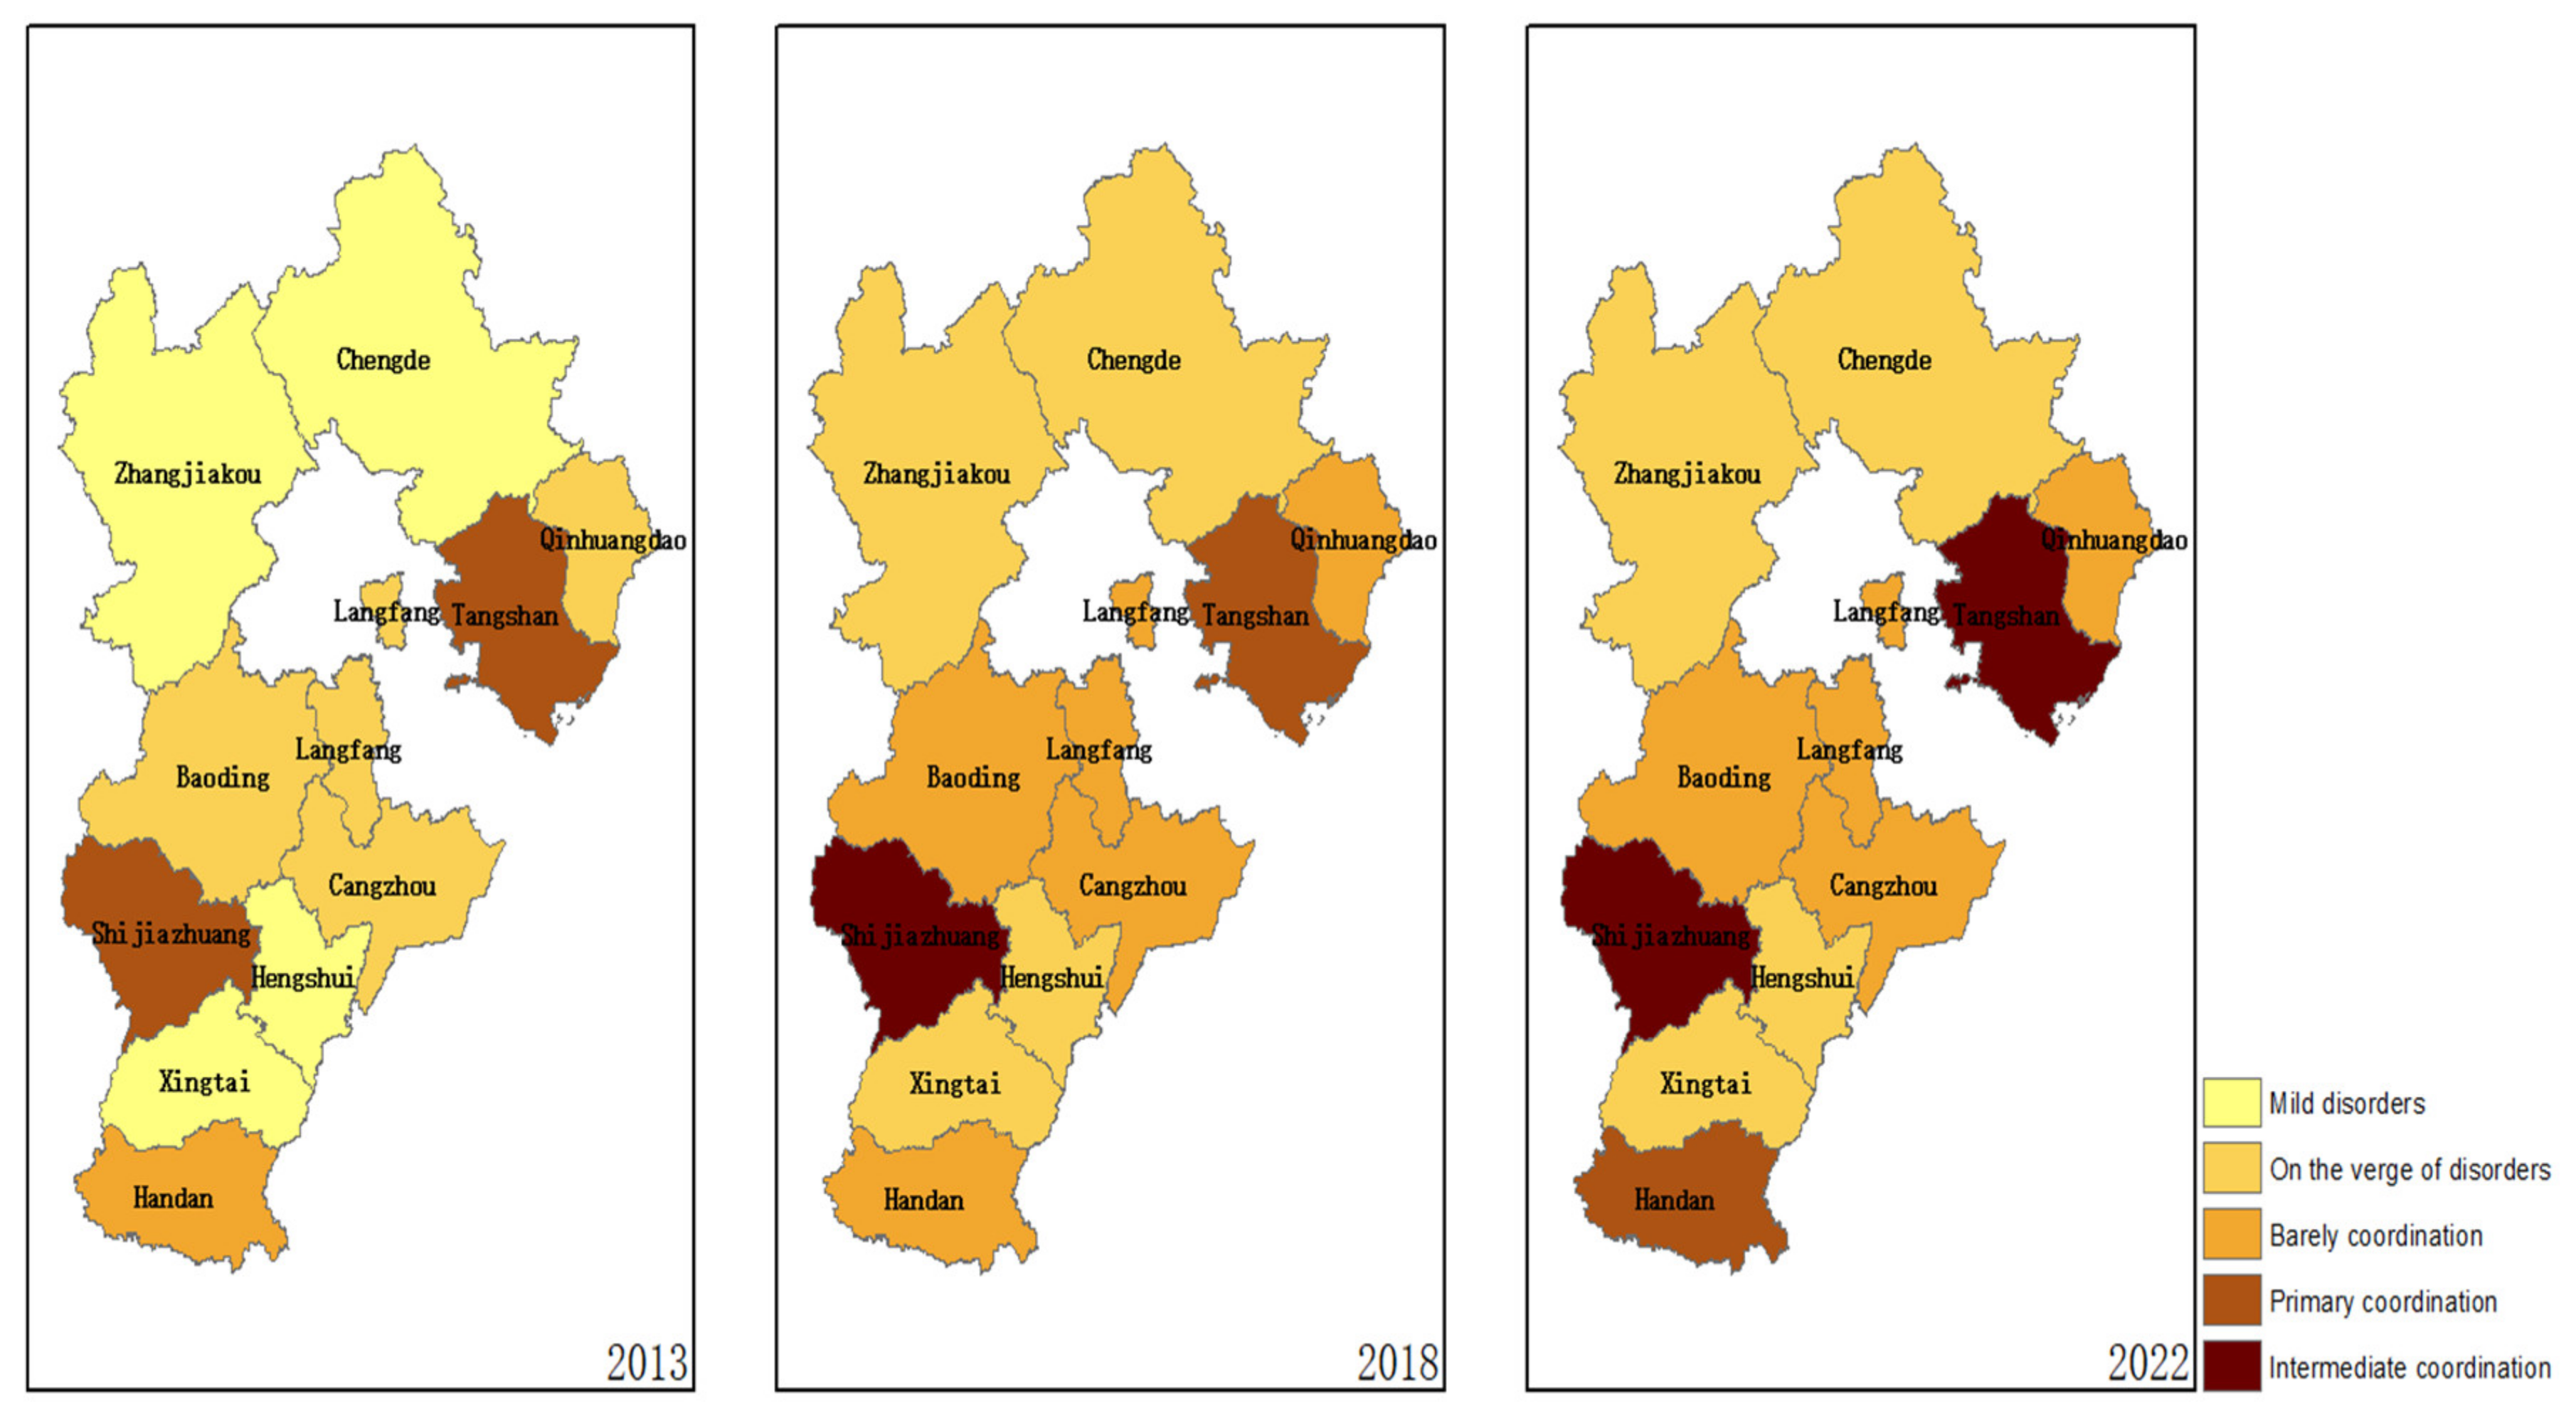
5.3. Spatio-Temporal Evolution Analysis of Coupling Coordination Degree

From Formulas (8)–(11), the synergy development coefficient ( E ), the degree of coupling ( C ), and the degree of coupling coordination ( D ) of the new urbanization in counties and the logistics industry in Hebei province from 2013 to 2022 are calculated, as shown in Table 7.
Table 7 indicates that from 2013 to 2022, in Hebei province, the comprehensive development level of new urbanization in counties was higher than that of the logistics industry. The logistics industry’s development could have been faster. In particular, the coefficient of synergistic development showed a decreasing trend in 2013–2015 and 2016–2017; from 2018 to 2019, it showed an increasing trend, reaching 0.601; and from 2020 to 2022, it first decreased and then increased. Although there is a certain degree of coupling and coordination between the two systems, there is a need for additional enhancement in the level of synergistic development. During this period, the degree of coupling between the logistics industry and the new urbanization in counties in Hebei province stayed stable between 0.8 and 1, a high-level coupling state. It means that the two systems have had a strong interaction and profound impact over the past ten years. The coupling coordination degree increases significantly from 0.471 in 2013 to 0.570 in 2022, marking two distinct stages in the coupling coordination relationship: on the verge of coordination from 2013 to 2016 and barely coordinated from 2017 to 2022. From 2013 to 2022, the level of coordination between the new urbanization in counties and the development of the logistics industry in Hebei province has increased annually. The reasons for this are manifold, including policy support, economic development, improvements in urbanization levels, and a transformation in urbanization strategy. In this process, the government introduced the Comprehensive Pilot Program for Urban-Rural Integration Development in Hebei province, the Implementation Plan for Promoting Transportation Structure Adjustment in Hebei province, and other related policies. It supports the growth of new urbanization in counties and the logistics industry. Rapid economic development is the foundation and driving force for advancing new urbanization in counties and the logistics industry. As the number of people living in cities grows and strategies for urbanization change, there is more focus on coordination and mutual support between these two sectors. It has led to an annual increase in the level of coupling and coordination between them.
We used ArcGIS 10.3 software to visualize and analyze the coordinated development of new urbanization in counties and logistics systems in 11 cities in Hebei province. We showed the coupling coordination degree of the two systems in 2013, 2018, and 2022 and analyzed their geographical distribution characteristics and evolution processes. Figure 2 displays the results.
Figure 2 illustrates this point clearly. In 2013, the degree of coupling coordination in Hebei province presented economic-related spatial characteristics regarding geographic distribution. Specifically, the mildly dislocated Chengde, Zhangjiakou, Hengshui, and Xingtai are located in the north, northwest, southeast, and south of Hebei province; on the verge of disorderly Qinhuangdao, Langfang, and other cities (except Qinhuangdao, which is located in the northeast of Hebei) are located in the central part of Hebei; Handan, which is barely coordinated, is located in the southern part of Hebei; and the primary coordinated Tangshan and Shijiazhuang are located in the northeast and central regions of Hebei. In 2018, the degree of coupling coordination among all cities in Hebei province has improved. Hengshui has the highest average annual growth rate of 4.587%, ranging from mild disorders to those on the verge of disorder. In 2022, the degree of coupling coordination in each city in Hebei province increased compared with 2018 Chengde, which had the highest average annual growth rate of 2.87%, maintaining the state of being on the verge of disorder. The geographical distribution of the degree of coordination between the two systems has mostly stayed the same from 2013 to 2022, and regional differences still exist. It indicates that although the geographical distribution of the coupling coordination degree of new urbanization in the county and logistics system has short-term volatility, it still has specific stability in the long term.

5.4. Prediction of the Degree of Coupling Coordination

The goal is to better understand the coordination level between new urbanization in counties and the logistics industry in Hebei province in the next five years. Using MATLAB R2019b software, we constructed a gray prediction model based on the coupling coordination data for each city from 2013 to 2022. Table 8 shows the prediction accuracy level of the model for each city. The prediction models of all cities in Hebei province meet the accuracy level of “qualified”, “good”, or “very well”, indicating that the prediction results have high reliability and accuracy. Figure 3 shows the predicted coupling coordination degree from 2023 to 2027.
As can be seen from Figure 3, eleven cities in Hebei province will steadily increase their coupling coordination over the next five years, with each city’s average annual growth rate rising from 2.156% to 2.62%. The spatial pattern of the new urbanization in counties and the logistics industry’s coupled and coordinated development have remained the same. Xingtai, Chengde, and Zhangjiakou exhibit barely coordinated coordination; Hengshui, Cangzhou, Baoding, Langfang, and Qinhuangdao demonstrate primary coordination; Handan and Tangshan demonstrate intermediate coordination; and Shijiazhuang demonstrate high-quality coordination. Over the next five years, the new urbanization in counties and the logistics industry system will continue to move toward coordinated, synchronous, and orderly development. However, a lot of time is still required to achieve high-quality final coordination, and there are still differences among cities.

5.5. Comparative Analysis

This study, which uses the coupled coordination degree model, provides a more comprehensive measurement of the coordinated development of new urbanization in counties and the logistics industry in Hebei province, China, compared to previous studies. Through spatio-temporal changes, it shows how the coordination process between the 11 municipalities in Hebei province changes over time and space, going beyond the limits of current research frameworks. By fitting and analyzing historical data, this study employs the grey prediction model to forecast the future development trend of coupling coordination degrees in 11 cities within Hebei province. It aims to deepen and expand existing studies in this field. These unique and comprehensive research findings offer new perspectives and ideas for the theoretical framework in related fields and provide more scientific and practical guidance for decision-making.

6. Discussion

To systematically analyze and forecast the interconnected and coordinated development between new urbanization in counties and the logistics industry, this study employs the coupled coordination degree model, spatiotemporal evolution analysis, and the grey prediction model. This method reveals the intricate interactions between the two systems and illustrates the systematic evolution of coupling across various time and spatial scales, a feature absent in previous research. The findings indicate that the new urbanization in counties and the logistics industry in Hebei province, China, exhibit an apparent coupling and coordination relationship. However, they have also undergone a dynamic and fluctuating evolutionary process over the past decade. This result is also consistent with our research objectives. Despite introducing a new analytical method for studying this type of system, we discovered that the study process still has some limitations. The coupled coordination degree model in this study utilizes the entropy weight method to determine the weights of indicators. Despite considering objectivity, experts’ subjective opinions may influence the results. In addition, the grey prediction model introduced in this study is suitable for the case where the system considers the short-term, and the data is in exponential form. The period of the research object in this case is ten years, which may lead to a reduction in the prediction accuracy. In the future, we can further improve the index weighting method and the prediction model by introducing the combination weighting method or the grey higher-order model.
However, the analytical methodology and the results of this study are still relatively scientific and reliable and have essential reference value for promoting urban-rural integrated development and realizing the high-quality development of the regional economy. At the same time, we recommend that local government departments fully consider the coupling and interaction between new urbanization in the county and the logistics industry when formulating policies. These policy recommendations are universally applicable not only to China but also to other countries or regions. Specifically, the government can introduce policies that deepen the integration of new urbanization and the logistics industry, ensuring synergy and consistency through a well-designed top-level structure. Furthermore, the logistics industry has a strong foundation thanks to optimizing land spatial distribution, implementing the new urbanization strategy, and promoting urban-rural integration. Enhancing the financial and talent support environment and the scientific and technological innovation strategy is also crucial. It will help accelerate the coordinated development of the logistics industry and new urbanization. In turn, it will foster the development of the regional economy to a high standard.

7. Conclusions

This paper adopts the new urbanization in counties and the logistics industry as its research perspective, elucidates the coupling mechanisms between the two, and establishes an evaluation index system for coupling coordination. Then, it integrates the coupled coordination degree model, the grey prediction method, and spatiotemporal evolution analysis to form a novel analytical method. Hebei province, China, was selected as the research object, and an empirical analysis was conducted. The study found that (1) The new urbanization in counties and the logistics industry have a high degree of coupling. They have experienced a transition from the lagging development of the logistics industry to the synergistic development of the two. The two systems consistently uphold their coupling at a high-level stage, maintaining a high coupling status. The degree of coupling coordination is on the rise and has shown significant improvement. (2) The degree of coupling coordination reveals economic-related spatial characteristics. The geographical distribution of the coordination degree of the two systems has mostly stayed the same, and regional differences still exist. However, overall, it still has specific stability. (3) By fitting a grey prediction model, 11 cities in Hebei province’s coupling coordination will show a steady growth trend over the next five years. There will be greater harmonization between the two systems. (4) The systematic evaluation index system that was constructed is feasible. The indicator selection prioritizes data availability and operability, ensuring the objectivity and accuracy of the assessment results. This approach promotes the coupled and coordinated development of the two and provides strong support for future sustainable development. (5) The constructed analytical method measures the systematic coupling and predicts the development trend. The analytical results align with the actual situation, and the method has certain novelty and validity.
The coupled and coordinated development of new urbanization in counties and the logistics industry is a systematic and dynamic analysis process. The rapid advancement of artificial intelligence and big data technology will continue to improve indicator selection and model application. It will provide decision-makers with more advanced and reliable analytical results, thereby promoting the high-quality development of the regional economy and society.

Author Contributions

Conceptualization, Z.L. and C.G.; data curation, Z.X.; formal analysis, Y.Z.; investigation, Z.X.; methodology, Z.X.; supervision, Z.L.; validation, Y.Z.; writing-original draft, Z.X. and Z.L.; writing-review and editing, C.G. and Y.Z. All authors have read and agreed to the published version of the manuscript.

Funding

This research was funded by the Research Project of Social Science Development of Hebei province of China, grant number 20230203028 and the Philosophy and Social Science Program of Handan City of China, grant number 2023048.

Data Availability Statement

Data are available upon request from the corresponding author upon reasonable request.

Conflicts of Interest

The authors declare that they have no conflict of interest.

References

  1. Bijker, R.A.; Haartsen, T. More than Counter-urbanisation: Migration to Popular and Less-popular Rural Areas in the Netherlands. Popul. Space Place 2012, 18, 643–657. [Google Scholar] [CrossRef]
  2. Singelmann, J. The Sectoral Transformation of the Labor Force in Seven Industrilized Countries, 1920–1970. Am. J. Sociol. 1978, 83, 1224–1234. [Google Scholar] [CrossRef]
  3. Eiichi, T.; Michihiko, N.; Tadashi, Y. Optimal size and location Planning of Public logistics terminals. Transp. Res. Part E 1999, 35, 207–222. [Google Scholar]
  4. Marsden, T.; Banks, J.; Bristow, G. Food Supply Chain Approaches: Exploring their Role in Rural Development. Sociol. Rural. 2000, 40, 424–438. [Google Scholar] [CrossRef]
  5. Costopoulou, C.; Maria, L. An architecture of Virtual Agricultural Market systems: The case of trading perishable agricultural products. Inf. Serv. Use 2000, 20, 39–48. [Google Scholar] [CrossRef]
  6. Muñuzuri, J.; Larrañeta, J.; Onieva, L.; Cortéset, P. Solutions applicable by local administrations for urban logistics improvement. Cities 2004, 22, 15–28. [Google Scholar] [CrossRef]
  7. Srivastava, S.K. Green supply-chain management: A state-of-the-art literature review. Int. J. Manag. Rev. 2007, 9, 53–80. [Google Scholar] [CrossRef]
  8. Van, D.; Langen, P.D.; Donselaar, K.V.; Fransoo, J.C. Spatial concentration and location dynam ics in logistics: The case of a Dutch province. J. Transp. Geogr. 2013, 28, 39–48. [Google Scholar]
  9. Alan, A.; Patricia, J.D. Logistics and distribution innovation in China. Int. J. Phys. Distrib. Logist. Manag. 2018, 50, 323–332. [Google Scholar]
  10. Zhang, Z.F.; Zhang, C.C. An Empirical Study on the Impact of New Urbanization Pilot Policy on China’s Modern Logistics Development. Soc. Econ. Geogr. 2020, 5, 15–19. [Google Scholar]
  11. Mwamba, E.; Masaiti, G.; Simui, F. Dynamic Effect of Rapid Urbanization on City Logistics: Literature Gleened Lessons for Developing Countries. J. City Dev. 2021, 3, 37–47. [Google Scholar]
  12. Rivera-Blasco, D.; Ruiz-Sánchez, J. Logistics sprawl in the urban mega-region of Madrid. The space of the supply chain between dispersion and centrality. Ciudad. Y Territ.-Estud. Territ.-Cytet 2021, 53, 95–118. [Google Scholar]
  13. Chhetri, P.; Butcher, T.; Corbitt, B. Characterising spatial logistics employment clusters. Int. J. Phys. Distrib. Logist. Manag. 2014, 44, 221–242. [Google Scholar] [CrossRef]
  14. Zeng, S.H.; Xia, J.C. Why rapid urbanization process cannot improve employment absorption capacity of service industry in China—Also on the interactive mode innovation between service industry development with urbanization under the background of transformation and upgrading. China Financ. Econ. Rev. 2016, 4, 9. [Google Scholar] [CrossRef]
  15. Wang, Y. Empirical Research on the Effects of Logistics Industry on Economic. iBusiness 2010, 2, 87–91. [Google Scholar] [CrossRef]
  16. Bibri, S.E.; Krogstie, J. Environmentally data-driven smart sustainable cities: Applied innovative solutions for energy efficiency, pollution reduction, and urban metabolism. Energy Inf. 2020, 3, 29. [Google Scholar] [CrossRef]
  17. Ye, C.; Pi, J.W.; Chen, H.Q. Coupling Coordination Development of the Logistics Industry, New Urbanization and the Ecological Environment in the Yangtze River Economic Belt. Sustainability 2022, 14, 5298. [Google Scholar] [CrossRef]
  18. Ionescu, R.V.; Zlati, M.L.; Antohi, V.M. Smart cities from low cost to expensive solutions under an optimal analysis. Financ. Innov. 2023, 9, 60. [Google Scholar] [CrossRef] [PubMed]
  19. Fertner, C. The Emergence and Consolidation of the Urban-rural Region: Migration Patterns around Copenhagen 1986–2011. Tijdschr. Voor Econ. En Soc. Geogr. 2013, 104, 322–337. [Google Scholar] [CrossRef]
  20. Olawepo, R.A.; Ibrahim, A.B. Rural Farmers Benefits from Agricultural Modernizati on in Kano River Project Phase l, Kano Arca, Nigeria. J. Agric. Environ. Sci. 2013, 2, 39–54. [Google Scholar]
  21. Remy, S.; Jackson, K.; Xing, Q.Z. Clarissa Augustinus, Raf Tuts. Role of Urban-Rural Linkages in Promoting Sustaninable Urbanization. Environ. Urban. Asia 2014, 5, 219–234. [Google Scholar]
  22. Liu, C.; Yu, B.; Zhu, Y.; Liu, L.; Li, P. Measurement of Rural Residents’ Mobility in Western China: A Case Study of Qingyang, Gansu Province. Sustainability 2019, 11, 2492. [Google Scholar] [CrossRef]
  23. Yang, F.M.; Shi, L.Y.; Wang, X.T.; Gao, L.J. Study on the extension of the dynamic benchmark system of per capita carbon emissions in China’s county. Environ. Sci. Pollut. Res. 2023, 30, 10256–10271. [Google Scholar] [CrossRef] [PubMed]
  24. Kerr, W.S., III. Impact of Urbanization on Agriculture in Orange County, California. Yearb. Assoc. Pac. Coast Geogr. 2014, 34, 161–170. [Google Scholar] [CrossRef]
  25. Hong, R.G.; Chen, F.B. Researching on New Urbanization in County Regions. Appl. Mech. Mater. 2014, 3488, 644–647. [Google Scholar] [CrossRef]
  26. Soltani, A.; Sankhayan, P.L.; Hofstad, O.; Eshraghi, F.; Arabmazar, A. Consequences of an Improved Road Network in Rural Iran: Does it Leadto Better Livelihoods and Forest Protection? Small-Scale For. 2016, 11, 11–13. [Google Scholar] [CrossRef]
  27. Ríos, I.D.L.; Becerril, H.; Rivera, M. Ecological agriculture and its inluence on rural prosperity: An agricultural company’s vision (Murcia, Spain). Agrociencia 2016, 50, 375–389. [Google Scholar]
  28. Li, Y.H.; Jia, L.R.; Wu, W.H.; Yan, J.Y.; Liu, Y.S. Urbanization for rural sustainability—Rethinking China’s urbanization strategy. J. Clean. Prod. 2018, 178, 580–586. [Google Scholar] [CrossRef]
  29. Tan, B.; Wang, H.; Ma, C.; Wang, X.; Zhou, J. Spatial and Temporal Measurement of the Interaction between the County Economy and Rural Transformation in Xinjiang, China. Sustainability 2021, 13, 5318. [Google Scholar] [CrossRef]
  30. Si, Y. Study on the Path of Integrated Development of Urban and Rural Areas in Kaifeng with County Region as Carrier. Open Access Libr. J. 2023, 10, 1–9. [Google Scholar] [CrossRef]
  31. Zhang, R.J.; Jiang, G.H.; Zhang, Q. Does urbanization always lead to rural hollowing? Assessing the spatio-temporal variations in this relationship at the county level in China 2000–2015. J. Clean. Prod. 2019, 220, 9–22. [Google Scholar] [CrossRef]
  32. Xing, Q.F.; Yao, W.Y. Digital governance and its benchmarking college talent training under the rural revitalization in China—A case study of Yixian County (China). Front. Public Health 2022, 10, 984427. [Google Scholar] [CrossRef] [PubMed]
  33. Harast, A.I.; Kryvonosova, E.V. Scientific and Technological Innovations in the Reprocessing Metal-Containing Industrial Waste and Industrial Waste of Polymeric Materials by Metallurgical Methods. Adv. Appl. Sci. 2019, 3, 65–78. [Google Scholar]
  34. Yan, M.T.; Zhao, J.J.; Yan, S.W.; Zhu, M. Coupling coordination of new urbanization in Chinese urban agglomeration—Characteristics and driving factors. Environ. Sci. Pollut. Res. 2023, 30, 117082–117095. [Google Scholar] [CrossRef] [PubMed]
  35. Lewis, W.A. Economic Development with Unlimited Supplies of Labour. Manch. Sch. 1954, 22, 139–191. [Google Scholar] [CrossRef]
  36. Krugman, P.R. Development, Geography, and Economic Theory, 1st ed.; Mit Press: Cambridge, UK, 1995; pp. 47–52. [Google Scholar]
  37. United Nations Environment Programme: Advancing the Transition to an Inclusive Green Economy—A Policy Review Manual. Available online: https://wedocs.unep.org/xmlui/handle/20.500.11822/22023 (accessed on 13 December 2011).
  38. Rosenstein, R.; Paul, N. Problems of Industrialisation of Eastern and South-Eastern Europe. Econ. J. 1943, 53, 202–211. [Google Scholar] [CrossRef]
  39. Porter, M. Competitive Advantage: Creating and Sustaining Superior Performance, 1st ed.; Simon & Schuster: New York, NY, USA, 2004; pp. 23–34. [Google Scholar]
  40. Liu, B.; Wang, Y.; Chang, X.; Nie, B.; Meng, L.; Li, Y. Does land urbanization affect the catch-up effect of carbon emissions reduction in China’s logistics? Land 2022, 11, 1503. [Google Scholar] [CrossRef]
  41. Mylonakou, M.; Chassiakos, A.; Karatzas, S.; Liappi, G. System Dynamics Analysis of the Relationship between Urban Transportation and Overall Citizen Satisfaction: A Case Study of Patras City, Greece. Systems 2023, 11, 112. [Google Scholar] [CrossRef]
  42. Grant, R.M. Toward a knowledge-based theory of the firm. Strateg. Manag. J. 1996, 17, 109–122. [Google Scholar] [CrossRef]
  43. Liu, S.F.; Lin, Y. The role and position of grey system theory in science development. J. Grey Syst. 1997, 4, 351–356. [Google Scholar]
  44. Yu, Q.W.; Sun, Z.H.; Shen, J.Y.; Xu, X.; Han, Q.Y. The nonlinear effect of new urbanization on water pollutant emissions: Empirical analysis based on the panel threshold model. J. Environ. Manag. 2023, 345, 118564. [Google Scholar] [CrossRef] [PubMed]
  45. Dong, C.R.; Zhao, G.M.; Wang, Y.H.; Wu, Y.J.; Liang, H.M. Evaluation of Logistics-Industry Efficiency and Enhancement Path in China’s Yellow River Basin under Dual Carbon Targets. Sustainability 2023, 15, 12848. [Google Scholar] [CrossRef]
Figure 1. The coupling mechanism of the new urbanization in counties and the logistics industry system.
Systems 12 00185 g001
Figure 2. The spatial difference in coupling coordination degree between the new urbanization in counties and the logistics industry system in Hebei province.
Systems 12 00185 g002
Figure 3. Forecast of the coupling coordination degree of cities in Hebei province from 2023 to 2027.
Systems 12 00185 g003
Table 1. Classification of synergy development coefficient status.
Synergy Development Coefficient 0   <   E     0 . 8 0 . 8   <   E     1 . 2 E   >   1 . 2
Relative state of developmentRelative lag in the logistics industrySynchronized development of both systemsNew urbanization in counties lags relatively behind
Table 2. Criteria for classifying the coupling degree.
Degree of CouplingLow LevelGeneralHigher LevelHigh Level
C value range ( 0 ,   0.3 ] ( 0.3 ,   0.5 ] ( 0.5 ,   0.8 ] ( 0.8 ,   1 ]
Table 3. Criteria for classifying the degree of coupling coordination.
D Value RangeDegree of Coupling Coordination D Value RangeDegree of Coupling Coordination
[ 0 ,   0.1 ) Extreme disorder [ 0.5 ,   0.6 ) Barely coordinated
[ 0.1 ,   0.2 ) Serious imbalance [ 0.6 ,   0.7 ) Primary coordination
[ 0.2 ,   0.3 ) Moderate imbalance [ 0.7 ,   0.8 ) Intermediate coordination
[ 0.3 ,   0.4 ) Mild disorders [ 0.8 ,   0.9 ) Good coordination
[ 0.4 ,   0.5 ) On the verge of disorders [ 0.9 ,   1 ) High-quality coordination
Table 4. Criteria for classifying the accuracy of the grey prediction model.
Very WellGoodQualifiedUnqualified
ρ     0.95 ρ     0.8 ρ     0.7 ρ   <   0.7
C     0.35 0.35   <   C   0.5 0.5   <   C     0.65 0.65   <   C
Table 5. Evaluation index system of coupling and coordination of the new urbanization in counties and the logistics industry system.
System LayerDimensionality LayerIndicator LayerDescription of IndicatorsAttribute *
County New Urbanization
( X )
Population urbanizationUrbanization rate ( x 1 )Source statistical information+
Urban population density ( x 2 )Source statistical information+
Urban-rural population ( x 3 )Source statistical information
Economic urbanizationUrban and rural per capita GDP ( x 4 )Gross GDP/Total urban and rural population+
Share of non-agricultural industry ( x 5 )The GDP value of secondary and tertiary industries/GDP+
The ratio of revenue to the expenditure of the general public finance budget ( x 6 )Revenue from the public budget/Public budget expenditure+
Social urbanizationPer 100,000 students enrolled in general secondary schools ( x 7 )Source statistical information+
The number of beds available in medical institutes per 10,000 individuals ( x 8 )The quantity of beds available at medical and health establishments/Total population of the region+
Year-end balance of household deposits ( x 9 )Source statistical information+
The aggregate retail sales of consumer products ( x 10 )Source statistical information+
Infrastructure urbanizationWater supply penetration rate ( x 11 )Source statistical information+
County New Urbanization
( X )
Infrastructure urbanizationGas penetration rate ( x 12 )Source statistical information+
Road area per capita ( x 13 )Urban road area/Urban population+
Ecological environment urbanizationPer capita green space in parks ( x 14 )park green area/Urban population+
Non-hazardous treatment rate of domestic waste ( x 15 )Amount of non-hazardous domestic waste treated/Amount of domestic waste generated+
Greening coverage in built-up areas ( x 16 )Source statistical information+
Logistics industry
( Y )
Economic benefitGross regional product transportation, warehousing, and postal services ( y 1 )Source statistical information+
The logistics industry’s contribution to the Gross Domestic Product in terms of added value ( y 2 )Value added of transportation, warehousing, and postal services/GDP+
Logistics infrastructureQuantity of freight transported ( y 3 )Source statistical information+
Highway mileage ( y 4 )Source statistical information+
Investment in fixed assets in transport, warehousing, and postal services ( y 5 )Source statistical information+
Freight turnover ( y 6 )Source statistical information+
The proportion of transportation in fiscal expenditure ( y 7 )Transport expenditure/Total fiscal expenditure+
Green developmentProportion of fiscal spending allocated to environmental protection ( y 8 )Environmental protection expenditure/Total fiscal expenditure+
Electricity consumption of the logistics industry ( y 9 )Source statistical information+
Technological informatizationNumber of Internet broadband access users ( y 10 )Source statistical information+
Mobile telephone subscriber ( y 11 )Source statistical information+
Total telecommunication services ( y 12 )Source statistical information+
Opening to the outside worldTotal exports of goods ( y 13 )Source Statistical information+
Total imports of goods ( y 14 )Source statistical information+
* “+” represents positive indicators, “−” represents negative indicators.
Table 6. The average value of the comprehensive development index for new urbanization in counties and the logistics industry in Hebei province by city.
Year H x H y Year H x H y
20130.3100.18120180.4040.228
20140.3380.18020190.4240.255
20150.3450.18320200.4520.267
20160.3600.19520210.4920.270
20170.3960.20820220.4440.277
Table 7. The average value of the correlation index of the coupling degree between new urbanization in counties and the logistics industry in Hebei province by city.
Year C E Coordination Phase D Degree of Coupling Coordination
20130.9210.585High-level coupling stage0.471On the verge of disorders
20140.9060.533High-level coupling stage0.480On the verge of disorders
20150.9080.531High-level coupling stage0.485On the verge of disorders
20160.9090.542High-level coupling stage0.498On the verge of disorders
20170.9010.526High-level coupling stage0.518Barely coordinated
20180.9130.564High-level coupling stage0.532Barely coordinated
20190.9180.601High-level coupling stage0.553Barely coordinated
20200.9040.590High-level coupling stage0.566Barely coordinated
20210.8930.550High-level coupling stage0.579Barely coordinated
20220.9180.622High-level coupling stage0.570Barely coordinated
Table 8. The prediction accuracy level of the model for each city.
CityHandanXingtaiHengshuiCangzhouZhangjiakouChengdeBaodingShijiazhuangLangfangTangshanQinhuangdao
P 10.71110.80.9110.80.9
C 0.12120.34230.06350.06120.08060.22450.10080.05790.03490.21740.2365
Accuracy levelVery wellQualifiedVery wellVery wellVery wellGoodGoodVery wellVery wellGoodGood
Disclaimer/Publisher’s Note: The statements, opinions and data contained in all publications are solely those of the individual author(s) and contributor(s) and not of MDPI and/or the editor(s). MDPI and/or the editor(s) disclaim responsibility for any injury to people or property resulting from any ideas, methods, instructions or products referred to in the content.

