Abstract
Mining is a high-risk industry where occupational accidents are common due to its complex nature. Therefore, providing a more holistic and dynamic risk assessment framework is essential to identify and minimize the potential risks and enhance safety measures. Unfortunately, traditional risk assessment methods have limitations and shortcomings, such as uncertainty, differences in experience backgrounds, and insufficiency to articulate the opinions of experts. In this paper, a novel risk assessment method precisely for such cases in the mining sector is proposed, applied, and compared with traditional methods. The objective of this study is to determine the risk scores of Turkish Coal Enterprises, based on non-fatal occupational accidents, which operates eight large-scale open-cast coal mine enterprises in Türkiye. The causes of the accidents were categorized into 25 sub-criteria under 6 main criteria. The risk scores for these criteria were computed using the Pythagorean fuzzy Analytical Hierarchy Process (PFAHP) method. The first shift (8–16 h) (0.6341) for the shift category is ranked highest out of the 25 sub-risk factors, followed by maintenance personnel (0.5633) for the occupation category; the open-cast mining area (0.5524) for the area category, the 45–57 age range (0.5279) for employee age category, and the mining machine (0.4247) for the reason category, respectively. The methodologies proposed in this study not only identify the most important risk factors in enterprises, but also provide a mechanism for risk-based rankings of enterprises by their calculated risk scores. The enterprises were risk-based ranked with the fuzzy Technique for Order Preference by Similarity to Ideal Solution (FTOPSIS) method and Paksoy approach based on interval type-2 fuzzy sets (IT2FSs). The findings indicate that the first three risk score rankings of enterprises are the same for both approaches. To examine the consistency of the applied methods, sensitivity analyses were performed. The results of the study also indicate that the proposed approaches are recommended for effective use in the mining sector due to their ease of application compared to other methods and their dynamic nature in the risk assessment process.
1. Introduction
In today’s world, coal continues to be a pivotal, indispensable, reliable, and non-renewable energy source in the generation of global electricity [1,2,3,4]. It is used as fuel to generate electric power and in the iron and steel industry. Additionally, it also has a myriad of other uses, such as in medicine, the production of carbon fibers and foams, cement production, synthetic petroleum-based fuels, tars, and home and commercial heating. The global increase in coal production is due to the high demand for low-cost energy. The World Energy Council (WEC) reports that the world’s proven and exploitable coal reserve is 891 billion tons. At current production rates, this reserve is expected to last for 115 years. Additionally, it is anticipated that renewable energy will overtake fossil fuels as the world’s primary energy source in the near future in many countries [4,5,6]. A total of 87% of the total energy requirement of the world is provided by fossil fuels, such as natural gas, fuel oil, and coal, while the rest comes from other sources, such as hydroelectric and nuclear power plants [7]. According to the last Energy Institute Statistical Review of World Energy records, the ratio of coal in the production of electricity was 35.51% in 2023 [6,8]. It is predicted that the nature of coal as the fuel used at the highest rate in electricity production will not change until 2025, and that by 2030, it will be on a par with oil, natural gas, and renewable energy sources (solar, offshore wind, onshore wind, and hydroelectric power). With the rapid growth of electricity production, renewable energy sources, including solar, wind, and hydroelectric power, are predicted to be the fastest growing major energy source by 2050 [9,10,11].
Coal is extracted by either surface mining or underground mining methods. In Türkiye, all hard coal is extracted only from the Zonguldak Basin, and lignite basins are spread over the Middle Anatolia and Aegean Regions. The coal mining industry is characterized by a high degree of labor intensity, which in turn gives rise to a high incidence of fatal and non-fatal occupational accidents. Furthermore, the industry is replete with a plethora of hazards and associated risks. The hazards and hazard potential inherent in a mine may trigger occupational accidents unless strong measures are taken to prevent them. Such hazards may have undesirable effects on employees in the form of injury, disability, or fatality, as well as on mining enterprises due to downtimes, equipment breakdowns, and interruptions in operations [12,13].
The human factors approach was used to gain insight into the causes of accidents and can be applied to mining safety [14]. The Human Factors Analysis and Classification System (HFACS) defines failure under four levels as in stated in Figure 1 (Unsafe Acts, Preconditions for Unsafe Acts, and Unsafe Supervision and Organizational Influences). This Reason’s “Swiss cheese” model of accident causation had a profound impact on the prevailing views of accident causation. Consequently, it is necessary to identify the specific system failures or “holes” that may contribute to accidents so that they can be detected and corrected during accident investigations, or preferably, before an accident occurs. It is possible for latent failures/conditions to manifest during the operation of a system, which can subsequently trigger errors by affecting the conditions. These types of failures/conditions can give rise to active failures, which occur as a result of interaction with a system that acts in an insecure manner. In contrast to active failures, it is possible to detect them in advance and eliminate them or reduce their effects [15,16].
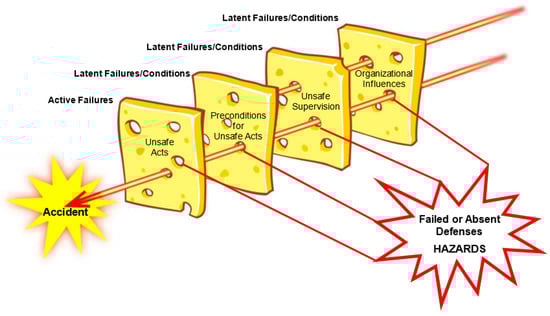
Figure 1.
The “Swiss cheese” model (adapted from [17,18,19,20,21,22,23,24]).
Risk assessment is just one of many stages of the risk management process, and it starts with hazard identification [25,26]. According to current literature knowledge, risk is defined as the likelihood of something happening that will have negative impacts, such as injuries, disabilities, and fatalities on the health or safety of miners [27]. It is reliable and easy to demonstrate the potential risks by evaluating historical accident data. This helps estimate the characteristics of risk parameters in risk assessments, and the hazards inherent in mining operations can be easily identified by an expert’s evaluation of historical injury data on occupational accidents [28]. To assess risks based on accidents that are resultant from individual, occupational, and locational aspects, evaluations should be made by considering all factors that affect occupational accidents [29]. If the risk scores of areas in which occupational accidents occurred, shifts in which occupational accidents occurred, occupational accident reasons, affected occupational groups, affected part of the body, and workers’ ages affected by the occupational accidents are calculated, various hazards can be easily determined and workers’ risk of exposure to occupational accidents and catching occupational diseases can be easily controlled by permanent supervisors and occupational health and safety (OHS) experts.
Traditional probabilistic risk analysis techniques often rely on the availability and accuracy of previous data, making them ineffective when data are unavailable. Recently, there was a growing interest in applying risk assessment techniques in fuzzy environments to provide accurate solutions even when data are approximate or uncertain. When the latest state of the topic in the literature is compiled, in the risk assessment process, the traditional AHP method is insufficient for reflecting the human thinking style in real life because it uses a fixed value to articulate the decision-maker’s opinion in the pair-wise comparisons [30]. In the area of decision-making, decision-makers usually find that it is more reliable to make interval judgments rather than fixed-value judgments. Therefore, the AHP method is criticized for its inability to adequately handle the inherent uncertainty [31]. To be able to overcome all these uncertainties, Fuzzy Multi-Criteria Decision-Making (FMCDM) techniques were developed. The linguistic terms employed in FMCDM techniques are converted to numerical values by using fuzzy sets, which serve to eliminate ambiguities and inconsistencies commonly encountered in classical risk assessment processes, such as those observed in this study. This, in turn, affords decision-makers greater freedom to express their opinions in a realistic manner. Due to these deficiencies of literature and to overcome this uncertainty, innovative combinations of hybrid decision risk assessment methods with different FMCDM techniques using IT2FSs are proposed in this study.
The rest of this paper is organized as follows: In Section 2, a detailed literature review about the subject is presented. In Section 3, Pythagorean fuzzy sets, hybrid Pythagorean fuzzy AHP, fuzzy TOPSIS, and the Paksoy [32] approach using IT2FSs methods are illustrated and the information given about the Turkish Coal Enterprises (TCE) enterprises for the relevant period of occupational accident records, the proposed risk-based classification hierarchy, the detailed data information, and risk estimation studies are summarized. In Section 4, determination of the risk weights of the criteria is achieved by using the Pythagorean fuzzy AHP and coal mines were risk-based ranked by using the fuzzy TOPSIS method and Paksoy approach by using IT2FSs. Obtained final risk scores and comparisons of the two methods are given in this section. Sensitivity analyses and the main limitations of the existing study are conducted in Section 5. Finally, conclusions, recommendations for future application perspectives, and solutions are discussed in the last section of the paper.
2. Literature Review
In general, when the literature is examined, it is found that there were several studies about risk assessment in different sectors up to now. Some of these are studies conducted in the mining sector using the Fault Tree Analysis (FTA) technique to overcome the risk management process, the prediction of the risk of potential coal and gas outburst in underground mining, in assessing the condition of mining equipment, and roof fall accidents in coal mines by different researchers [33,34,35,36,37,38,39,40,41,42]. Researchers also used the Failure Mode and Effects Analysis (FMEA) technique to investigate different mining problems, such as minimizing the risks to acceptable levels [43,44,45,46]. In addition, in the mining sector, Hazard and Operability Studies (HAZOP) techniques were also used by different researchers [47,48].
In the construction sector, Aslan [49] used the Fine–Kinney technique; Lee and Kim [50], Singha and Debasis [51], Ardeshir et al. [52], and Uchoa et al. [53] used the FMEA technique; and Liu and Zhang [54] and Joubert et al. [55] used the HAZOP technique, and Rusli et al. [56] used the FTA technique in their research studies.
In energy sector, Ateş [57], and Efe and Efe [58] used the Fine–Kinney technique; Ghasemi et al. [59] and Keyghobadi et al. [60] used the FMEA technique; and Melani et al. [61], Choi and Byeon [62], Pandey et al. [63], and Suryadi et al. [64] used the HAZOP technique in different risk management processes.
FMCDM techniques are also used in risk management process research studies aimed at evaluating risk factors in the mining industry up to now. Mahdevari [12] determined the most risk factors for coal mines producing with the underground production method in Kerman, Iran, with a model they created. In this study, the hazards were investigated and the most significant risks with the greatest negative impact were identified based on eight main criteria, such as electrical, personal, environmental, geo-mechanical, geo-chemical, mechanical, chemical, social, cultural, and managerial risks using the fuzzy TOPSIS method. Nezarat et al. [25] used the fuzzy AHP method to investigate the geological risks of the Golab tunnel located 120 km northwest of Iran. According to their risk estimation-based hierarchy, the riskiest criterion scores are computed for squeezing and face stability. In addition to these results, gas emissions and clogging of clay criteria have the lowest risk score. In another study, Yılmaz and Alp [65] studied to determine the riskiest sectors by evaluating the factors that cause work accidents. They applied the fuzzy TOPSIS method with the survey studies that applied to the decision-makers with high experience working in five different sectors. They stated that the riskiest sectors are the construction sector and the coal mining sector in the model they created with seven main criteria, which they determined as the inadequacy of preventive OHS services, the inadequacy of inspection, inadequacy of labor inspection, inadequacy of training, the inadequacy of risk assessment, insufficiency of maintenance, and inadequacy of employees. Gul et al. [66] consulted decision-makers to assess the hazards of underground mining and proposed a new risk assessment methodology by conducting a case study in a copper and zinc mine, which they see as a gap in the literature. They pointed out that their study, in which they preferred Pythagorean fuzzy Vise Kriterijumsa Optimizacija I Kompromisno Resenje (PFVIKOR) as a method, is a study that was not conducted before in underground metal mining in the literature, and they also evaluated the model with sensitivity analysis.
Furthermore, upon examination of the literature, it is evident that various studies were conducted on the risk management process, utilizing comparable MCDM techniques in other sectors. Chen and Wu [67] proposed a revised failure mode and effect analysis approach to selecting new suppliers. They applied the fuzzy AHP method to prioritize and evaluate supplier selection criteria and sub-criteria. Gul and Ak [68] proposed a comparative methodology for quantifying risk ratings in OHS risk assessment. Researchers used linguistic terms and Pythagorean fuzzy sets, which provide greater independence in their evaluations. The fuzzy AHP-fuzzy VIKOR-integrated method in quantifying risk ratings is also provided. Bakıoglu and Atahan [69] prioritized risks in self-driving vehicles by using AHP-integrated TOPSIS and VIKOR methods with Pythagorean fuzzy sets. Çolak and Kaya [70] suggested a MCDM methodology based on these methods to evaluate renewable energy alternatives for Turkey. The interval type-2 fuzzy AHP method is applied to determine the weights of decision criteria, and the hesitant fuzzy TOPSIS method is applied to prioritize renewable energy alternatives. Norouzi Masir et al. [71] aim to assess the risk of flyrock in opencast mines in order to calculate the risk score and minimize the risk of flyrock. They combined the decision-making trial and evaluation laboratory (DEMATEL) method and the fuzzy analytic network process (FANP) technique. Maksimović et al. [72] described an attempt to select the most suitable transport system at the open pit mines from the safety and quality point of view. For that purpose, the Evaluation Based on Distance from Average Solution (EDAS) method was used. Wang and Zhang [73] present a comprehensive quantitative approach for managing safety in coal mines by using fuzzy AHP. A multi-criteria decision-making model for managing safety in coal mines based on fuzzy set is constructed, which includes 17 factors and was an assessment. Wang et al. [74] estimate and rank all of these factors to develop a management model and guide the safety managers in the mining process by using the fuzzy AHP. Li et al. [75] conducted a gas explosion risk assessment in Babao coal mine in China. They proposed evaluating the risk of gas explosion in underground coal mines using the Bayesian network and fuzzy AHP.
3. Methodologies
In this part of the study, Pythagorean fuzzy sets and IT2FSs properties are presented. Then, Pythagorean fuzzy AHP, fuzzy TOPSIS methods, and Paksoy approach steps are given, respectively. The set of all notations used throughout this research article is also summarized in Table 1.

Table 1.
Set of the notations used through this research article.
3.1. Pythagorean Fuzzy Sets (PFSs)
In the process of the fuzzy sets being proposed until today, many extensions of it were revealed, such as neutrosophic sets [76], Pythagorean fuzzy sets [77], orthopair fuzzy sets [78], hesitant fuzzy sets [79], and intuitionistic fuzzy sets [80,81].
This study utilized Pythagorean fuzzy sets to reduce uncertainty and address the uncertainty inherent in the decision-making process. This section outlines the basic process stages of Pythagorean fuzzy sets, IT2FSs, and the interval type-2 Pythagorean fuzzy AHP method.
Definition 1.
If is a fixed set, a Pythagorean fuzzy set is an object with the form shown in Equation (1) [82]:
where the function [0, 1] describes the degree of membership and [0, 1] expresses the degree of non-membership of the element to P, respectively, and, for every , it holds (Equation (2)):
The formula for calculating the degree of indeterminacy is shown in Equation (3):
Definition 2.
An interval-valued Pythagorean fuzzy set is defined as shown in Equation (4) [83]:
where ⊂ [0, 1] and For , the following Equation (5) must be provided:
Then, with the degree of indeterminacy, , it can be computed as follows (Equations (6) and (7)) [83]:
3.2. Interval Type-2 Fuzzy Sets
In this section of the research paper, brief definitions of interval type-2 fuzzy sets are provided.
Definition 3.
Let be a non-negative interval type-2 trapezoidal fuzzy number (IT2TrFN).
In the following, the upper trapezoidal membership function and the lower trapezoidal membership function of the interval type-2 fuzzy set are provided in Figure 2 [84].
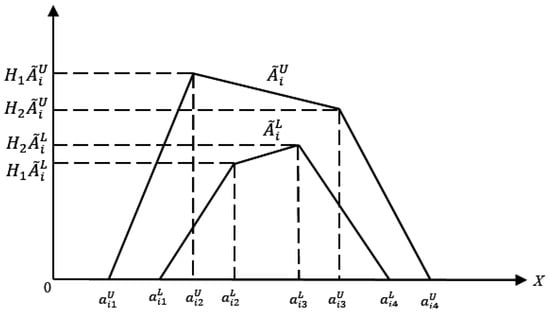
Figure 2.
The upper trapezoidal membership function and the lower trapezoidal membership function of the interval type-2 fuzzy set .
Where are type-1 fuzzy sets, are the references points of the IT2FSs ; states the membership estimation of the factor in the upper trapezoidal membership function ; also it states the membership estimation of the factor in the lower trapezoidal membership function ,, and [85,86].
Defuzzification for Type-2 Fuzzy Sets
The defuzzification process for a type-2 fuzzy set involves two steps. In the first step, the type-2 fuzzy set is identified as a type-1 fuzzy set using the type reduction process. Then, one of the defuzzification methods for ordinary (type-1) fuzzy sets is used to find the equivalence of type-2 fuzzy sets [87]. The probability-based approach reduction method of [85], which is one of the reduction methods in the literature, is given in Equation (8).
The largest possible value of the upper membership function is and the largest possible value of the lower membership function is ; and the least possible value of the upper membership function is and the least possible value of the lower membership function is . The second and third parameters of the upper membership function are and ; and are the second and third parameters of the lower membership function, respectively [86].
3.3. Pythagorean Fuzzy AHP
Pythagorean fuzzy sets are an improved variation of intuitionistic fuzzy sets [68] in some cases where intuitionistic fuzzy sets cannot resolve ambiguity [77]. Compared to other fuzzy sets, Pythagorean fuzzy sets are a more helpful and flexible tool in addressing vagueness and uncertainty in multi-criteria decision-making problems in the mining industry [88].
This subsection explains the steps of the interval-valued Pythagorean Fuzzy (IVPF) AHP. Table 2 provides the linguistic terms and Pythagorean Fuzzy Number (PFN) equivalents of IVPF numbers.
Table 2.
Interval-valued Pythagorean fuzzy AHP weighting scale [89].
- Step 1. Construct the pairwise comparison matrix as provided in Table 2.
- Step 2. Calculate the differences matrix by applying Equations (9) and (10) to the lower and upper values of the membership and non-membership functions.
- Step 3. Calculate the interval multiplicative matrix using Equations (11) and (12):
- Step 4. Calculate the determinacy value of the using Equation (13):
- Step 5. To obtain the weights matrix before normalization, multiply the determinacy values with the matrix, resulting in the matrix.
- Step 6. Calculate the normalized priority weights using Equation (15).
3.4. Fuzzy TOPSIS
The fuzzy TOPSIS method evaluates both the distance to the positive ideal solution and the distance to the negative ideal solution simultaneously to calculate the necessary proximity for the ideal solution. The order of preference to be made at the end is obtained by comparing the distances. In other words, it emerges as a method that ranks the alternatives by revealing the distances between the best (positive ideal) to the worst (negative ideal) points [90].
The coefficient of closeness for each alternative is calculated using transformed fuzzy numbers. Alternatives can be ranked with the help of the obtained closeness coefficients. In the conventional TOPSIS method, performance values and weights of criterion are given as exact numbers and therefore it does not take into account the uncertainty arising from human perception of determining the weights and qualitative measurements. Since precise data are insufficient to model real-life applications, subjective attributes and weights of attributes are often expressed in verbal variables [91]. The concept of [92] fuzzy TOPSIS, the most preferred technique, can be described as follows:
- Step 1: Consisting of decision-makers and shows the .’rd. alternative’s criterion value of . The values of the alternative criteria are calculated using an Equation (16).Hereby, using IT2FS alternatives were evaluated based on criteria (Table 3).
Table 3. Definition and IT2FSs of the linguistic variables [85,93,94,95].Table 3. Definition and IT2FSs of the linguistic variables [85,93,94,95].
Linguistic Terms Interval Type-2 Fuzzy Sets Very Low (VL) ((0, 0, 0, 0.1; 1, 1), (0, 0, 0, 0.05; 0,9 0,9)) Low (L) ((0, 0.1, 0.1, 0.3; 1, 1), (0.05, 0.1, 0.1, 0.2; 0.9, 0.9)) Medium Low (ML) ((0.1, 0.3, 0.3, 0.5; 1, 1), (0.2, 0.3, 0.3, 0.4; 0.9, 0.9)) Medium (M) ((0.3, 0.5, 0.5, 0.7; 1, 1), (0.4, 0.5, 0.5, 0.6; 0.9, 0.9)) Medium High (MH) ((0.5, 0.7, 0.7, 0.9; 1, 1), (0.6, 0.7, 0.7, 0.8; 0.9, 0.9)) High (H) ((0.7, 0.9, 0.9, 1; 1, 1), (0.8, 0.9, 0.9, 0.95; 0.9, 0.9)) Very High (VH) ((0.9, 1, 1, 1; 1, 1), (0.95, 1, 1, 1; 0.9, 0.9)) - Step 2: The importance weights of the criteria’s importance, determined by decision-makers are calculated using Equation (17).In this paper, the weights for the criteria were obtained using the interval Pythagorean fuzzy AHP method.
- Step 3: Equation (18) shows the fuzzy decision matrix for a fuzzy multi-criteria decision-making problem with n criteria and m alternatives, presented in matrix format.where and are trapezoidal fuzzy numbers, and where denotes fuzzy decision matrix and denote fuzzy weights matrix.
- Step 4: After creating the fuzzy decision matrix, it is necessary to normalize it. The resulting normalized fuzzy decision matrix is denoted by and can be expressed as shown in Equation (19) below.Decision criteria come in two forms as benefit and cost criteria, where A is the benefit criterion and B is the cost criterion and is calculated as follows (Equations (20) and (21)):Here, are normalized trapezoid fuzzy numbers.
- Step 5: Equation (22) is used to form the weighted normalized fuzzy decision matrix, taking into account the varying importance weight of each decision criterion. The elements of this matrix are calculated using Equation (23), based on the obtained normalized fuzzy decision matrix.
- Step 6: After creating the weighted normalized fuzzy decision matrix, the Fuzzy Positive Ideal Solution (FPIS ) and the Negative Ideal Solution (FNIS ) are calculated using Equations (24) and (25):Here, . In other words, there are (1,1,1) and (0,0,0) represent the values for the decision criteria, respectively [92].
- Step 7: Equations (26) and (27) are used to calculate the distance of each alternative from to after assigning the (FPIS ) and the (FNIS ).Here, is the distance between the two fuzzy numbers. The distance measurement between two trapezoid fuzzy numbers can be calculated using the vertex method [96]. Equation (28) calculates the distance between two fuzzy numbers given as and .
- Step 8: Equation (29) calculates the closeness coefficient using (FPIS ), and (FNIS ), .If , then and if then . In other words, as the value approaches 1, the alternative moves closer to the positive ideal solution and further away from the negative ideal solution. Using , we can rank all alternatives and confidently select the best one [97]. Convergence coefficients take a value between 0 and 1, and the closer to 1, the higher the preference rate.
3.5. Determining the Risk Scores of Enterprises
The risk scores of coal mines were computed as follows using the weights obtained from Pythagorean fuzzy AHP in this section and the assessment scores obtained in Equation (30) with the Paksoy approach using interval type-2 fuzzy sets.
- : i. enterprise’s evaluation score according to j criteria
- : weight of j criterion
- : enterprise risk score
3.6. Introduction of Coal Mines, and Designing of the Robust Hybrid Top-Down Risk-Based Classification Hierarchy
The proposed methods were implemented to compute the risk scores (weights) of the main criteria, its sub-criteria, and risk scores of TCE enterprises and to risk-based rank according to computed risk scores. The proposed model comprises the following steps:
- Identifying the robust hybrid top-down risk-based classification decision hierarchy algorithm.
- Computing the risk scores of criteria by using interval-valued Pythagorean fuzzy AHP.
- Evaluating the enterprises according to computed risk scores with a combination of the fuzzy TOPSIS method and Paksoy approach by using IT2FSs and determining the final risk scores of the coal mines, comparing the two methods’ results with each other.
- Demonstrating the robustness of the applied methods by performing sensitivity analyses.
The proposed approaches applied in this study are all clearly delineated in the general step by step flowchart, as illustrated in Figure 3.
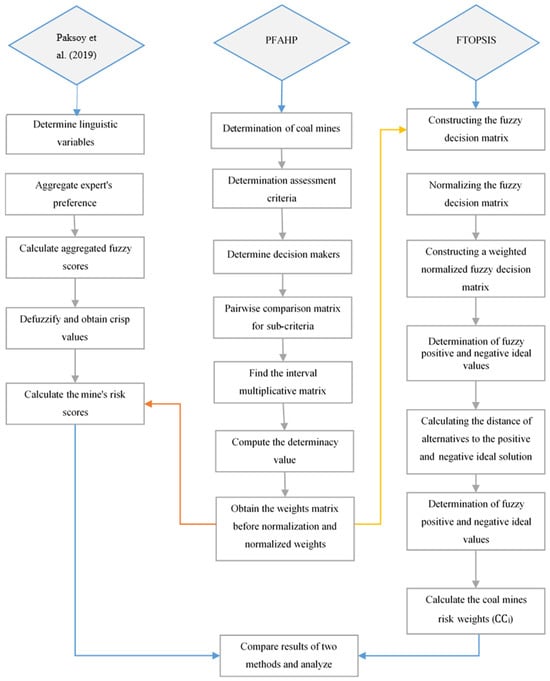
Figure 3.
The flowchart of the proposed approaches [32].
In the context of the present study, the proposed approach was implemented by evaluating the non-fatal occupational accident records of TCE enterprises over a six-year period. These records were kept in an exemplary manner by the top management of TCE, with meticulous attention to detail and regularity. Based on the occupational accident history, the main components contributing to occupational accidents were categorized and evaluated in the robust hybrid top-down risk-based classification decision hierarchy algorithm [98].
This study’s database was provided by TCE lignite mines. The data source is the official records of TCE, and TCE is a government-run enterprise. The records were provided in full, therefore our data source is reliable. The data include details for each accident, such as the detailed reason of the accident, location of the accident, employee’s information about the name, surname, birthday, the job conducted during the accident of the employees, and injured body parts due to the accidents. The inclusion and exclusion criteria of the robust hybrid top-down risk-based classification decision hierarchy were determined according to these records and the authors’ current knowledge of the literature [20,98,99]. Pairwise comparisons were conducted by taking into account these records by decision-makers. In addition, the experienced and highly educated managers who worked in the TCE were selected as decision-makers in this study.
According to these records, TCE’s enterprises (alternatives) are coded as E1, E2, E3, E4, E5, E6, E7, and E8 in the hierarchy (Figure 4). These enterprises are spread over the Aegean Regions, Marmara Regions, and Middle Anatolia in Türkiye. Coal is extracted by the open-cast mining method in E1, E2, E4, E6, E7, and E8, whereas it is extracted both by the open-cast mining method and underground mining method at E3 and E5 enterprises. From these enterprises, E7 was transferred to the private sector in 2012; E4 and E8 were transferred to the private sector in 2013 under the privatization policies of TCE’s top management. As shown in Figure 5, the non-fatal occupational accident records were categorized under 6 main criteria under 25 sub-criteria. The accident location (area) main criterion was categorized into four sub-criteria: open-cast mining area (C11), workshops (C12), social facilities area of surface installations (C13), and coal handling plants–coal washing plants–storage bins (C14). The open-cast mining area is defined as the area that extracted the coal using heavy-duty mining equipment (heavy-duty mining trucks, hydraulic mining shovels, draglines, excavators, large wheel loaders, large dozers, rotary drill rigs, rock drills, and motor graders). Maintenance of the mining equipment is conducted in workshops. They show similarities to many other service workshops, except that the powered mobile plant is increasingly larger. The area of surface installations is the facility areas except for the coal handling plants, workshop, and open-cast mining area. A facility that washes coal to remove waste material from coal is defined as a coal handling plant [99]. The accident type criterion (reason) was categorized into six sub-criteria as mining machine (C21), manual and mechanical handling (C22), slip/fall (C23), hand tools-related (C24), transporting (C25), and machinery (C26). The occupation main criterion has four sub-criteria: maintenance personnel (C31), driver (C32), worker (C33), and mining machine operator (C34). The part of the body main criterion has four sub-criteria: head (C41), upper extremities (C42), lower extremities (C43), as well as torso and sundry (C44). The age main criterion was categorized according to the ESAW criteria as 20–24 (C51), 25–34 (C52), 35–44 (C53), and 45–57 (C54) [100]. The last main criterion of the hierarchy is the shift criterion, which was categorized as first shift (8–16 h) (C61), second shift (16–24 h) (C62), and third shift (24–08 h) (C63).
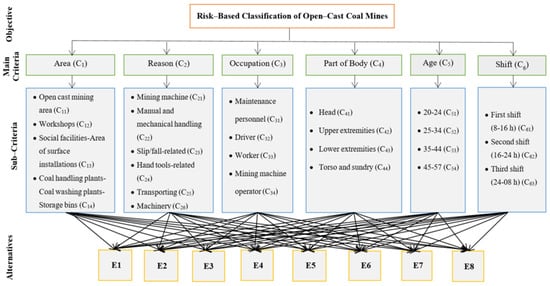
Figure 4.
Hierarchical structure of the risk-based classification approach.
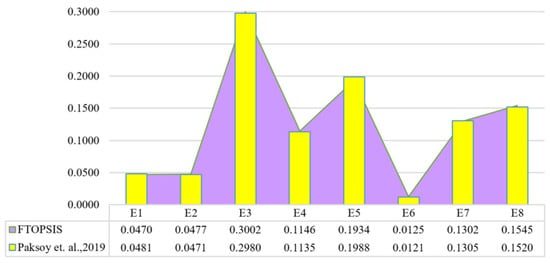
Figure 5.
Risk rankings comparison of enterprises according to the two proposed methods [32].
In the present study, the most important and innovative combinations of FMCDM techniques with current scales were used to compute the risk scores of TCE in Türkiye. Combinations of these hybrid decision risk assessment methods are used for the first time, according to the authors’ current knowledge through literature.
This study will be a technical guide for the top management and decision-makers of coal mines or other industries to assess the potential hazards inherent in their work environment, evaluate the risks, and ensure coal production sustainability for enterprises. Furthermore, this study will provide a foundation for evaluating the vagueness and impreciseness of subjective evaluations in existing literature studies on mining with different FMCDM techniques using IT2FSs.
4. Results and Discussion
4.1. Application of the Pythagorean Fuzzy AHP Method
After constructing the robust hybrid top-down risk-based classification hierarchy, the risk scores of the evaluation criteria were computed. In this stage of the study, the Pythagorean fuzzy AHP method was used to compute the sub-criteria risk scores. Table 4 shows the pairwise comparisons of sub-criteria for area criterion. Such comparisons were conducted for every main criterion in the robust hybrid top-down risk-based classification hierarchy.
Table 4.
Pairwise comparisons for the area criterion.
The application of the Pythagorean fuzzy AHP method applied to the area’s sub-criterion is given below. Sub-criterion weights were obtained by applying these implementation steps to all other sub-criteria. By using the weighting scale for the interval-valued Pythagorean fuzzy AHP method [89] (Table 2), the decision-maker’s unified agreed pairwise comparison matrix for the area sub-criterion was obtained (Table 5). Then, by using Equations (9) and (10), the difference matrix was calculated. This matrix is demonstrated in Table 6.
Table 5.
Decision-maker’s unified agreed pairwise comparison matrix for the area’s sub-criterion.
Table 6.
The differences matrix.
Then, by using Equations (11) and (12), the interval multiplicative matrix was computed (Table 7).
Table 7.
Interval multiplicative matrix.
In Table 8, by using Equation (13), the determinacy value matrix is presented. By using Equation (14), the weights matrix before normalization, and by using Equation (15), the normalized priority weights for sub-criteria were obtained (Table 9). These computed the final risk scores for the whole hierarchy and are presented in detail (Table 10 and Table 11).
Table 8.
Determinacy value matrix.
Table 9.
The weights matrix before normalization and the normalized priority weights.
Table 10.
Priority weights (risk scores) for area, reason, and occupation sub-criteria.
Table 11.
Priority weights (risk scores) for part of body, age, and shift sub-criteria.
According to Table 10 and Table 11, the highest risky area for TCE enterprises was found to be an open-cast mining area; for occupational accident reason it is a mining machine; and for occupational group, the highest risk score value was computed for maintenance personnel in TCE enterprises. As a result of these risk score values, the upper extremities are the most affected part of the body for mine employees. It was determined that the most hazard-prone group is the mine employees between 45 and 57 years old. Additionally, it was concluded that the first shift (8–16 h) in TCE enterprises has the highest risk score among all the hazard factors.
4.2. Application of the Fuzzy TOPSIS Method
The calculated criteria weights in the previous section using the Pythagorean fuzzy AHP method were integrated into the fuzzy TOPSIS method and the final risk scores of TCE enterprises were calculated using the fuzzy TOPSIS method. Fuzzy averages of alternatives for each decision-maker based on the sub-criterion evaluation chart by using Equation (17) are presented in an aggregated fuzzy decision matrix (Table 12). Then, normalized fuzzy decision matrix using Equation (18) is presented in Table 13. By using Equation (19), a weighted normalized fuzzy decision matrix was obtained (Table 14). The weights of alternatives were computed using Equation (20); then, according to , these alternatives were ranked (Table 15). Based on seven linguistic expressions in Table 3, pairwise comparisons for all enterprises according to the twenty-five sub-criteria of the hierarchy were calculated. One of these pairwise comparison matrixes for the C11 sub-criterion is demonstrated in the first line of Table 16.
Table 12.
Aggregated fuzzy decision matrix.
Table 13.
Normalized fuzzy decision matrix.
Table 14.
Weighted normalized fuzzy decision matrix.
Table 15.
Fuzzy TOPSIS results.
Table 16.
Interval type-2 fuzzy sets for the pairwise comparison matrix of enterprises according to C11 the sub-criteria.
4.3. Application of the Paksoy Approach
At this stage, to evaluate the alternatives under each criterion were used IT2FSs. Therefore, we obtained the assessment scores of the alternatives. The assessment scores of the alternatives by using IT2FSs for the pairwise comparison matrix according to the C11 sub-criteria are given in Table 16 and the final results of the Paksoy approach are given in Table 17. Such pairwise comparisons were conducted for other sub-criteria in the robust hybrid top-down risk-based classification hierarchy.
Table 17.
Final results of the Paksoy approach.
4.4. Comparisons
According to the results that computed the final risk scores of enterprises, the enterprise with coded E3 has the highest risk score and is followed by E5 and E8, respectively. It was concluded that the first three risk score rankings were the same for both methods. The lowest risk score was computed for E2, E1, and E6 in the fuzzy TOPSIS method and for E1, E2, and E6 in the Paksoy approach, respectively. The detailed computed final risk scores for enterprises are presented in Figure 5.
5. Sensitivity Analyses
Sensitivity analyses were performed using different sub-criterion weights to examine the sensitivity of the results obtained at the last stage of the study. We changed the weight of the sub-criterion, which is the highest among each criterion’s sub-criterion weights, and the weights of the other sub-criterion. Under the area criterion, the open-cast mining area sub-criterion, under the reason criterion the mining machine sub-criterion, under occupation criterion maintenance personnel sub-criterion, under part of body torso and sundry sub-criterion, under age criterion 45–57 sub-criterion, and under shift criterion first shift sub-criterion have the highest criterion weight.
The importance weight of the open-cast mining area sub-criterion, the importance weight of the workshops sub-criterion, the social facilities area of surface installations sub-criterion, and coal handling plants–coal washing plants storage bins sub-criterion were replaced, respectively, and the importance weights of the alternatives were computed again. The same procedures are applied for reason, occupation, part of body, age, and shift sub-criteria. As a result, we obtained 18 different scenarios for all enterprises. The obtained results are illustrated in Figure 6 and Figure 7. When we examine Figure 6 and Figure 7, we see that the risk-based rankings of enterprises do not change according to the scenarios obtained. The difference between the computed risk scores of these enterprises is very low. This shows that the determined risk scores of the TCE enterprises are sensitive to the risk weights obtained.
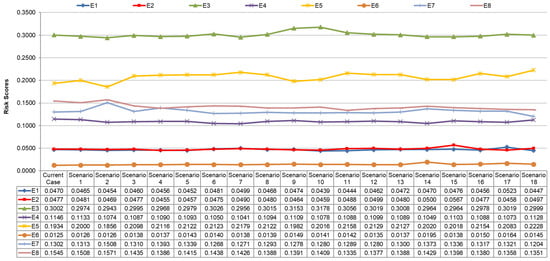
Figure 6.
Fuzzy TOPSIS results of sensitivity analysis.
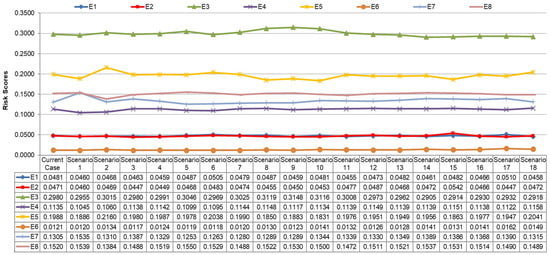
Figure 7.
Paksoy approach results of sensitivity analysis.
The risk evaluation methods that are proposed in this study not only identify the most important risk factors in these open-cast coal mine enterprises, but also provide a mechanism for risk-based ranking of enterprises by their calculated risk scores. In this context, the highest risk factors of the 25 sub-risk factors in the robust hybrid top-down risk-based classification decision hierarchy algorithm are detected in Table 10 and Table 11 before. In this context, to determine the level of significance and type of risk, these risk factors were also evaluated and compared with the As Low As Reasonably Practicable (ALARP) diagram. The ALARP is the most widely used approach to establish risk tolerance and is a framework that guides the decision-making process in risk management. The structure is composed of three principal levels from top to bottom as unacceptable region (intolerable risks), ALARP region (tolerable risk), and broadly acceptable region (tolerable risks) [101,102,103]. In this study, according to the derived final risk weights of the hierarchy, the first shift (8–16 h) category (0.6341), the maintenance personnel category (0.5633), the open-cast mining area category (0.5524), and the age range category (0.5279) lie in the intolerable risk zone, respectively. The mining machine category (0.4247), the upper extremities category (0.4030), the workshops category (0.3191), the 35–44 age range (0.3163) category, and the torso and sundry category are also located in the ALARP region. In conclusion, The ALARP principle is a fundamental concept that guides decision-making in risk management, and is most commonly used to establish risk tolerance, helping organizations systematically identify, assess, and reduce risks to as low a level as is reasonably practicable. It is imperative that decision makers implement appropriate control measures without delay in order to reduce the risks identified in the intolerable risk region to the lowest reasonably practicable level. These risk levels should be moved to the ALARP region immediately. Furthermore, the efficacy of the implemented engineering control measures must be continuously evaluated.
It is recommended that all employees involved in repair and maintenance activities are trained in standard procedures, as this is an important element in accident prevention. Training programs should be used to raise awareness of the use of Personal Protective Equipment (PPE). The overall safety of equipment and protective devices should be developed and periodically reviewed by the manufacturer. The majority of occupational accidents can be prevented through the implementation of effective work planning, including the allocation of appropriate workloads, shift changes where necessary for older employees, and the establishment of an occupational health and safety culture.
The main limitations of the existing study were also pointed out. In this sense, the delineation of these limitations can be described as follows: The data set used in the robust hybrid top-down risk-based classification decision hierarchy algorithm includes only open-cast mine employees who had a non-fatal occupational accident. This study was carried out on the large-scale open-cast coal mine enterprises of TCE lignite mines in Türkiye. By updating the dataset in such future studies, this limitation can be eliminated by adding non-fatal occupational accidents and even fatal accidents in underground coal mining to the risk assessment algorithm that was designed within the scope of the study. Furthermore, the analysis can be extended to include administrative staff in future work. It is of paramount importance to note that the methodologies proposed in this study can be readily applied in a multitude of high-risk industries, including the coal mining sector.
6. Conclusions
Considering that occupational accidents occur as the result of a combination of many factors, evaluation of all these factors together to investigate the root causes of accidents provides convenience to permanent supervisors, top management, and OHS experts. In this paper, non-fatal occupational accidents that are the most common in open-cast mining were evaluated.
For this purpose, this study presented the hybrid methods of Pythagorean fuzzy AHP and the fuzzy TOPSIS method and the Paksoy approach using IT2FSs to analyze and assess the risk scores and the risk-based rank of all the Turkish Coal Enterprises in Türkiye. Pythagorean fuzzy AHP was used to obtain risk scores of the criteria and the sub-criteria and the fuzzy TOPSIS and Paksoy approach was used for risk-based ranking.
According to the author’s current knowledge through literature and accident records database, six criteria used as the main criteria and twenty-five sub-criteria were identified for the risk-based ranking hierarchy [20,98,99]. The results of the study show that, for TCE enterprises, the highest weight risk score was computed for E3 > E5 > E8 in the two methods. This was followed by the fuzzy TOPSIS method as E7 > E4 > E2 > E1 > E6; and for the Paksoy approach E7 > E4 > E1 > E2, respectively. The lowest risk score was computed for the E6 enterprise in both methods. Additionally, the risk scores of the main criterion and sub-criterion in the hierarchy were computed. In the last stage of this study, according to the results obtained in the sensitivity analyses, it was observed that the proposed risk assessment methods are quite consistent.
The results indicate that, open-cast mining areas for area criterion and mining machine reasons, OHS trainings should be made more effective to create a safety culture for employees. Additionally, these trainings should be increased according to the occupational accidents in the enterprises and the current needs, not only according to the minimum periods in the occupational and safety regulations. Studies (elimination, substitution, isolation, risk transfer, and engineering controls) should be carried out, and primary vocational training should be given to occupation groups. Precautions should be organized by considering protection principles for the source, environment, and individual, respectively. Special training education related to their profession areas for maintenance personnel should be conducted more frequently by the top management of enterprises.
It is of great importance to review the risk factors identified within the scope of the study and to plan the regulatory studies to be carried out to reduce the lost day accidents in the enterprises. A coherent and overall prevention policy should be developed that covers the impact of factors related to technology, work organization, working conditions, social relations, and the work environment. After all these studies, the risk management process should be continued by monitoring and controlling whether the implementations are carried out. To reduce the risks that cannot be adequately controlled at the source, regular use of appropriate PPEs should be ensured. The use of PPEs for all employees should be supervised and ensured. At this point, employers should also be sensitive to this issue and be aware that it is both human responsibility and a legal obligation.
This study will be a guide for the top management of enterprises and decision-makers with the goal of identifying the existing hazards and associated risks easily to improve enterprises’ conditions through OHS policy for ensuring production sustainability. Considering the complex structure of occupational accidents, decision-makers can easily handle a risk assessment in the mining sector or other industries by using the proposed methodologies in the presented study. The hybrid approaches can be used by integrating the methods used in this study with other multi-criteria decision-making techniques. For further studies, other MCDM approaches, such as VIKOR, Elimination and Choice Translating Reality English (ELECTRE), Preference Ranking Organization Method for Enrichment Evaluation (PROMETHEE), and the Best Worst Method (BWM) can be applied by integrating different fuzzy set extensions such as heuristic, neutrosophic, and spherical. The proposed robust hybrid top-down risk-based classification decision hierarchy algorithm in this study can be expanded to provide a more holistic risk assessment by adding new criteria for other operations in the mining sector. Additionally, these approaches can be diversified to other high-risk sectors.
Author Contributions
Conceptualization, M.M.; literature review, M.M. and N.C.C.; methodology, M.M. and N.C.C.; validation—investigation, M.M., N.C.C. and S.O.; writing—original draft preparation, M.M.; writing—review and editing, M.M., N.C.C. and S.O.; supervision, S.O.; formal analysis, M.M., N.C.C. and S.O.; visualization, M.M., N.C.C. and S.O. All authors have read and agreed to the published version of the manuscript.
Funding
This research received no external funding.
Data Availability Statement
The data presented in this study are available on request from the corresponding author due to privacy.
Conflicts of Interest
The authors declare no conflict of interest.
References
- Dursun, A.E. Fatal accident analysis and hazard identification in Turkish coal-extracting industry using analytic hierarchy process. Min. Metall. Explor. 2024, 41, 149–172. [Google Scholar] [CrossRef]
- Fossil Fuels Still Dominate Global Power Systems. Available online: https://www.reuters.com/markets/commodities/fossil-fuels-still-dominate-global-power-systems-2023-11-30/ (accessed on 7 July 2024).
- Electricity Mix. Available online: https://ourworldindata.org/electricity-mix (accessed on 8 July 2024).
- Distribution of Electricity Generation Worldwide in 2023, by Energy Source. Available online: https://www.statista.com/statistics/269811/world-electricity-production-by-energy-source/ (accessed on 8 July 2024).
- World Energy Resources 2013 Survey. Available online: https://www.worldenergy.org/assets/images/imported/2013/09/Complete_WER_2013_%20Survey.pdf (accessed on 17 May 2022).
- Energy Institute-Statistical Review of World Energy. 2024. 73rd edition. Available online: https://www.energyinst.org/__data/assets/pdf_file/0006/1542714/EI_Stats_Review_2024.pdf (accessed on 3 July 2024).
- Onal, G. The Importance of Coal in Energy. ITU Energy Workshop and Exhibition; Istanbul, Turkey. 2006; 41. pp. 94–109. Available online: https://inis.iaea.org/collection/NCLCollectionStore/_Public/41/103/41103128.pdf?r= (accessed on 4 February 2021).
- Our World in Data, Share of Electricity Production from Coal. 2023. Available online: https://ourworldindata.org/grapher/share-electricity-coal. (accessed on 3 July 2024).
- EIA Independent Statistics and Analysis U.S. Energy Information Administration. Available online: https://www.eia.gov/todayinenergy/detail.php?id=42342 (accessed on 7 May 2024).
- Chrifi-Alaoui, L.; Drid, S.; Ouriagli, M.; Mehdi, D. Overview of photovoltaic and wind electrical power hybrid systems. Energies 2023, 16, 4778. [Google Scholar] [CrossRef]
- Renewables Now. Available online: https://renewablesnow.com/news/renewables-produce-85-of-global-power-nearly-50-of-energy-in-2050-582235/ (accessed on 3 July 2024).
- Mahdevari, S.; Shahriar, K.; Esfahanipour, A. Human health and safety risks management in underground coal mines using fuzzy TOPSIS. Sci. Total Environ. 2014, 488, 85–99. [Google Scholar] [CrossRef]
- Qin, L.; Xue, Z.; Lin, H.; Li, S.; Li, B.; Lin, S. Mechanical strength change and coal damage analysis of frozen saturated bitumite after cryogenic freezing. J. Saf. Sustain. 2024. [Google Scholar] [CrossRef]
- Lenné, M.G.; Salmon, P.M.; Liu, C.C.; Trotter, M. A systems approach to accident causation in mining: An application of the HFACS method. Accid. Anal. Prev. 2012, 48, 111–117. [Google Scholar] [CrossRef]
- Reason, J. Human Error; Cambridge University Press: Cambridge, UK, 1990. [Google Scholar]
- Shappell, S.A.; Wiegmann, D.A. The Human Factors Analysis and Classification System-HFACS; (Report Number DOT/FAA/AM-00/7); Office of Aerospace Medicine: Washington, DC, USA, 2000.
- Reason, J.; Hollnagel, E.; Paries, J. Revisiting the Swiss cheese model of accidents. J. Clin. Eng. 2006, 27, 110–115. [Google Scholar]
- Swuste, P. Qualitative methods for occupational risk prevention strategies in safety, or control banding-safety. Saf. Sci. Monit. 2007, 11, 3. [Google Scholar]
- Bergeon, F.; Hensley, M. Swiss cheese and the PRiMA model: What can information technology learn from aviation accidents? J. Oper. Risk 2009, 4, 47. [Google Scholar] [CrossRef]
- Onder, S. Evaluation of occupational injuries with lost days among opencast coal mine workers through logistic regression models. Saf. Sci. 2013, 59, 86–92. [Google Scholar] [CrossRef]
- Song, W.; Li, J.; Li, H.; Ming, X. Human factors risk assessment: An integrated method for improving safety in clinical use of medical devices. Appl. Soft Comput. 2020, 86, 105918. [Google Scholar] [CrossRef]
- Wiegmann, D.A.; Wood, L.J.; Cohen, T.N.; Shappell, S.A. Understanding the “Swiss cheese model” and its application to patient safety. J. Patient Saf. 2022, 18, 119–123. [Google Scholar] [CrossRef]
- Kursunoglu, N. Fuzzy multi-criteria decision-making framework for controlling methane explosions in coal mines. Environ. Sci. Pollut. Res. 2024, 31, 9045–9061. [Google Scholar] [CrossRef]
- Shabani, T.; Jerie, S.; Shabani, T. A comprehensive review of the Swiss cheese model in risk management. Saf. Extrem. Environ. 2024, 6, 43–57. [Google Scholar] [CrossRef]
- Nezarat, H.; Sereshki, F.; Ataei, M. Ranking of geological risks in mechanized tunneling by using Fuzzy Analytical Hierarchy Process (FAHP). Tunn. Undergr. Space Technol. 2015, 50, 358–364. [Google Scholar] [CrossRef]
- Göransson, G.; Norrman, J.; Larson, M.; Alén, C.; Rosén, L. A methodology for estimating risks associated with landslides of contaminated soil into rivers. Sci. Total Environ. 2014, 472, 481–495. [Google Scholar] [CrossRef]
- Barnes, M. Risk Assessment Workbook for Mines, Metalliferous, Extractive and Opal Mines, and Quarries. Mine Safety Operations, [IGA-019 (TRIM: OUT09/16488)]. 2009, p. 64. Available online: https://www.integralskills.com.au/wp-content/uploads/IGA-019-Risk-assessment-workbook-for-mines.pdf (accessed on 7 May 2024).
- Wilson, R.; Crouch, E.A.C. Risk assessment and comparisons: An introduction. Science 1987, 236, 267–270. [Google Scholar] [CrossRef] [PubMed]
- Erdogan, H.H.; Duzgun, H.S.; Selcuk-Kestel, A.S. Quantitative hazard assessment for Zonguldak Coal Basin underground mines. Int. J. Min. Sci. Technol. 2019, 29, 453–467. [Google Scholar] [CrossRef]
- Kahraman, C.; Cebeci, U.; Ulukan, Z. Multi-criteria supplier selection using fuzzy AHP. Logist. Inf. Manag. 2003, 16, 382–394. [Google Scholar] [CrossRef]
- Kahraman, C.; Ruan, D.; Dogan, I. Fuzzy group decision making for facility location selection. Inf. Sci. 2003, 157, 135–153. [Google Scholar] [CrossRef]
- Paksoy, T.; Çalik, A.; Yildizbaşi, A.; Huber, S. Risk management in lean & green supply chain: A novel fuzzy linguistic risk assessment approach. In Lean and Green Supply Chain Management; Springer: Cham, Switzerland, 2019; pp. 75–100. [Google Scholar]
- Ruilin, Z.; Lowndes, I.S. The application of a coupled artificial neural network and fault tree analysis model to predict coal and gas outbursts. Int. J. Coal Geol. 2010, 84, 141–152. [Google Scholar] [CrossRef]
- Fan, X.H.; Yi, J.; Bao, Z.Q. Research on safety input research model for preventing coal gas explosion. Procedia Eng. 2011, 26, 2012–2017. [Google Scholar] [CrossRef][Green Version]
- Jiang, W.; Qu, F.; Zhang, L. Quantitative identification and analysis on hazard sources of roof fall accident in coal mine. Procedia Eng. 2012, 45, 83–88. [Google Scholar] [CrossRef]
- Zhang, M.; Kecojevic, V.; Komljenovic, D. Investigation of haul truck-related fatal accidents in surface mining using fault tree analysis. Saf. Sci. 2014, 65, 106–117. [Google Scholar] [CrossRef]
- Gharahasanlou, A.N.; Mokhtarei, A.; Khodayarei, A.; Ataei, M. Fault tree analysis of failure cause of crushing plant and mixing bed hall at Khoy cement factory in Iran. Case Stud. Eng. Fail. Anal. 2014, 2, 33–38. [Google Scholar] [CrossRef]
- Kumar, P. Risk analysis by using failure mode and effects analysis for safe mining. Int. J. Sci. Res. 2014, 3, 2512–2515. [Google Scholar]
- Yasli, F.; Bolat, B. A risk analysis model for mining accidents using a fuzzy approach based on fault tree analysis. J. Enterp. Inf. Manag. 2018, 31, 577–594. [Google Scholar] [CrossRef]
- Shi, S.; Jiang, B.; Meng, X. Assessment of gas and dust explosion in coal mines by means of fuzzy fault tree analysis. Int. J. Min. Sci. Technol. 2018, 28, 991–998. [Google Scholar] [CrossRef]
- Mottahedi, A.; Ataei, M. Fuzzy fault tree analysis for coal burst occurrence probability in underground coal mining. Tunn. Undergr. Space Technol. 2019, 83, 165–174. [Google Scholar] [CrossRef]
- Sherin, S.; Rehman, Z.U.; Hussain, S.; Mohammad, N.; Raza, S. Hazards identification and risk analysis in surface mines of Pakistan using fault tree analysis technique. Min. Miner. Depos. 2021, 15, 119–126. [Google Scholar] [CrossRef]
- Kumar, P.; Kumar, A. Methods for risk management of mining excavator through FMEA and FMECA. Int. J. Eng. Sci. 2016, 5, 57–63. [Google Scholar]
- Rahimdel, M.J.; Aryafar, A.; Vaziri, S. Fuzzy FMEA for the safety risk analysis of underground coal mining (a case study in Iran). Min. Technol. 2022, 131, 104–114. [Google Scholar] [CrossRef]
- Wang, X.; Wang, H. Risk assessment of coal mine safety production management activities based on FMEA-BN. J. Comput. Methods Sci. Eng. 2022, 22, 123–136. [Google Scholar] [CrossRef]
- Duda, A.; Juzek, T. Use of the method FMEA for hazard identification and risk assessment in a coal mine. Manag. Syst. Prod. Eng. 2023, 31, 332–342. [Google Scholar] [CrossRef]
- Zhang, J.; Wang, Q.; Zhao, S. Application of HAZOP-LOPA coal mine safety risk assessment method based on Bayesian network. Min. Saf. Environ. Prot. 2022, 49, 114–120. [Google Scholar]
- Tsopa, V.; Cheberiachko, S.; Yavorska, O.; Deryugin, O.; Bas, I. Increasing the safety of the transport process by minimizing the professional risk of a dump truck driver. Min. Miner. Depos. 2022, 16, 101–108. [Google Scholar] [CrossRef]
- Aslan, S. Risk assessment of construction works in city square using Fine Kinney method. Cukurova Univ. J. Fac. Eng. 2022, 37, 329–340. [Google Scholar] [CrossRef]
- Lee, J.S.; Kim, Y.S. Analysis of cost-increasing risk factors in modular construction in Korea using FMEA. KSCE J. Civ. Eng. 2017, 21, 1999–2010. [Google Scholar] [CrossRef]
- Singha, M.; Debasis, S. Project risk analysis for elevated metro rail projects using fuzzy failure mode and effect analysis (FMEA). Int. J. Eng. Technol. Sci. Res. 2017, 4, 906–914. [Google Scholar]
- Ardeshir, A.; Farnood Ahmadi, P.; Bayat, H. A prioritization model for HES risk assessment using combined failure mode, effect analysis, and fuzzy inference system: A case study in Iranian construction industry. Int. J. Eng. 2018, 31, 1487–1497. [Google Scholar]
- Uchoa, J.G.L.; de Sousa, M.J.A.; Silva, L.H.V.; Cavaignac, A.L.D.O. FMEA method application based on occupational risks in the construction industry on work at height: A theoretical contribution. Int. J. Adv. Eng. Res. Sci. 2019, 6, 261–278. [Google Scholar] [CrossRef]
- Liu, H.; Zhang, Z. Application of quantitatively improved HAZOP method in ventilation safety during gas tunnel construction. China Saf. Sci. J. 2017, 27, 92. [Google Scholar]
- Joubert, F.; Steyn, E.; Pretorius, L. Using the HAZOP method to conduct a risk assessment on the dismantling of large industrial machines and associated structures: Case study. J. Constr. Eng. Manag. 2021, 147, 05020021. [Google Scholar] [CrossRef]
- Rusli, R.; Zulkarnain, I.; Ekandari, Y. A risk analysis of occupational safety and health (OSH) using the Hazard And Operability study (HAZOP) method for the Semani drainage project (Sentosa-Remaja-A. Yani): Rekayasa. JSE J. Sci. Eng. 2024, 2, 66–72. [Google Scholar] [CrossRef]
- Ateş, K.T. Determination of high risks and elimination of possible risks in the winding section of an energy company using the Fine-Kinney method. Int. Sci. Vocat. Stud. J. 2023, 7, 62–71. [Google Scholar] [CrossRef]
- Efe, B.; Efe, Ö.F. Fine-Kinney method based on fuzzy logic for natural gas pipeline project risk assessment. Soft Comput. 2023, 27, 16465–16482. [Google Scholar] [CrossRef]
- Ghasemi, S.; Mahmoudvand, R.; Yavari, K. Application of the FMEA in insurance of high-risk industries: A case study of Iran’s gas refineries. Stoch. Environ. Res. Risk Assess. 2016, 30, 737–745. [Google Scholar] [CrossRef]
- Keyghobadi, A.R.; Ebadi, A.; Yeganegi, M.R.; Motadel, M.R. The analysis of sustainable supply chain risks based on the FMEA method in the oil and gas industry and factors affecting risk management. Pet. Bus. Rev. 2020, 4, 95–116. [Google Scholar] [CrossRef]
- Melani, A.H.A.; Murad, C.A.; Netto, A.C.; de Souza, G.F.M.; Nabeta, S.I. Criticality-based maintenance of a coal-fired power plant. Energy 2018, 147, 767–781. [Google Scholar] [CrossRef]
- Choi, J.Y.; Byeon, S.H. HAZOP methodology based on the health, safety, and environment engineering. Int. J. Environ. Res. Public Health 2020, 17, 3236. [Google Scholar] [CrossRef]
- Pandey, V.; Sircar, A.; Yadav, K.; Bist, N. A proposed HAZOP based upgradation model for improvement in existing industrial practices: A geothermal energy industry case study. Int. J. Energy Sect. Manag. 2023. [Google Scholar] [CrossRef]
- Suryadi, A.; Islami, M.C.P.; Ramadhan, G. Safety assessment approach of Hazard and Operability (HAZOP) in a power plant sector. Nusant. Sci. Technol. Proc. 2023, 36, 245–251. [Google Scholar] [CrossRef]
- Yilmaz, F.; Alp, S. Underlying factors of occupational accidents: The case of Turkey. Open J. Saf. Sci. Technol. 2016, 6, 1–10. [Google Scholar] [CrossRef]
- Gul, M.; Ak, M.F.; Guneri, A.F. Pythagorean fuzzy VIKOR-based approach for safety risk assessment in mine industry. J. Saf. Res. 2019, 69, 135–153. [Google Scholar] [CrossRef] [PubMed]
- Chen, P.S.; Wu, M.T. A modified failure mode and effects analysis method for supplier selection problems in the supply chain risk environment: A case study. Comput. Ind. Eng. 2013, 66, 634–642. [Google Scholar] [CrossRef]
- Gul, M.; Ak, M.F. A comparative outline for quantifying risk ratings in occupational health and safety risk assessment. J. Clean. Prod. 2018, 196, 653–664. [Google Scholar] [CrossRef]
- Bakioglu, G.; Atahan, A.O. AHP integrated TOPSIS and VIKOR methods with Pythagorean fuzzy sets to prioritize risks in self-driving vehicles. Appl. Soft Comput. 2021, 99, 106948. [Google Scholar] [CrossRef]
- Çolak, M.; Kaya, İ. Prioritization of renewable energy alternatives by using an integrated fuzzy MCDM model: A real case application for Turkey. Renew. Sustain. Energy Rev. 2017, 80, 840–853. [Google Scholar] [CrossRef]
- Norouzi Masir, R.; Ataei, M.; Mottahedi, A. Risk assessment of flyrock in surface mines using a FFTA-MCDM combination. J. Min. Environ. 2021, 12, 191–203. [Google Scholar] [CrossRef]
- Maksimović, M.; Brzaković, M.; Grahovac, M.; Jovanović, I. An approach for evaluation the safety and quality of transport at the open pit mines, based on the EDAS method. Min. Metall. Eng. Bor 2017, 3–4, 139–144. [Google Scholar] [CrossRef]
- Wang, X.; Zhang, L. A multicriteria decision model based on analytic hierarchy process for managing safety in coal mines. Geofluids 2022, 1, 5390249. [Google Scholar] [CrossRef]
- Wang, Q.; Wang, H.O.N.G.; Qi, Z. An application of nonlinear fuzzy analytic hierarchy process in safety evaluation of coal mine. Saf. Sci. 2016, 86, 78–87. [Google Scholar] [CrossRef]
- Li, M.; Wang, H.; Wang, D.; Shao, Z.; He, S. Risk assessment of gas explosion in coal mines based on fuzzy AHP and bayesian network. Process Saf. Environ. Prot. 2020, 135, 207–218. [Google Scholar] [CrossRef]
- Smarandache, F. Neutrosophy: Neutrosophic Probability, Set, and Logic: Analytic Synthesis & Synthetic Analysis; American Research Press: Rehoboth, NM, USA, 1998. [Google Scholar]
- Yager, R.R. Pythagorean fuzzy subsets. In Proceedings of the 2013 Joint IFSA World Congress and NAFIPS Annual Meeting (IFSA/NAFIPS), Edmonton, AB, Canada, 24–28 June 2013; IEEE: Piscataway, NJ, USA; pp. 57–61. [Google Scholar]
- Yager, R.R.; Alajlan, N. Approximate reasoning with generalized orthopair fuzzy sets. Inf. Fusion 2017, 38, 65–73. [Google Scholar] [CrossRef]
- Torra, V. Hesitant fuzzy sets. Int. J. Intell. Syst. 2010, 25, 529–539. [Google Scholar] [CrossRef]
- Atanasov, K.T. Intuitionistic fuzzy sets. Fuzzy Sets Syst. 1986, 20, 87–96. [Google Scholar] [CrossRef]
- Karasan, A.; Ilbahar, E.; Cebi, S.; Kahraman, C. A new risk assessment approach: Safety and Critical Effect Analysis (SCEA) and its extension with Pythagorean fuzzy sets. Saf. Sci. 2018, 108, 173–187. [Google Scholar] [CrossRef]
- Yager, R.R. Properties and applications of Pythagorean fuzzy sets. In Imprecision and Uncertainty in Information Representation and Prosscessing; Springer: Cham, Switzerland, 2016; pp. 119–136. [Google Scholar]
- Peng, X.; Yang, Y. Fundamental properties of interval-valued pythagorean fuzzy aggregation operators. Int. J. Intell. Syst. 2016, 31, 444–487. [Google Scholar] [CrossRef]
- Lee, L.W.; Chen, S.M. Fuzzy multiple attributes group decision-making based on the extension of TOPSIS method and interval type-2 fuzzy sets. In Proceedings of the 2008 International Conference on Machine Learning and Cybernetics, Kunming, China, 12–15 July 2008; IEEE: Piscataway, NJ, USA; pp. 3260–3265. [Google Scholar]
- Chen, S.M.; Lee, L.W. Fuzzy multiple attributes group decision-making based on the interval type-2 TOPSIS method. Expert Syst. Appl. 2010, 37, 2790–2798. [Google Scholar] [CrossRef]
- Kahraman, C.; Öztayşi, B.; Sarı, İ.U.; Turanoǧlu, E. Fuzzy analytic hierarchy process with interval type-2 fuzzy sets. Knowl. Based Syst. 2014, 59, 48–57. [Google Scholar] [CrossRef]
- Karnik, N.N.; Mendel, J.M. Operations on type-2 fuzzy sets. Fuzzy Sets Syst. 2001, 122, 327–348. [Google Scholar] [CrossRef]
- Zhu, J.; Li, Y. Pythagorean fuzzy Muirhead mean operators and their application in multiple-criteria group decision-making. Information 2018, 9, 142. [Google Scholar] [CrossRef]
- Ilbahar, E.; Karaşan, A.; Cebi, S.; Kahraman, C. A novel approach to risk assessment for occupational health and safety using Pythagorean fuzzy AHP & fuzzy inference system. Saf. Sci. 2018, 103, 124–136. [Google Scholar] [CrossRef]
- Ignatius, J.; Mustafa, A.; Goh, M. Modeling funding allocation problems via AHP-fuzzy TOPSIS. Int. J. Innov. Comput. Inf. Control 2012, 8, 3329–3340. [Google Scholar]
- Yong, D. Plant location selection based on fuzzy TOPSIS. Int. J. Adv. Manuf. Technol. 2006, 28, 839–844. [Google Scholar] [CrossRef]
- Chen, C.T. Extensions of the TOPSIS for group decision-making under fuzzy environment. Fuzzy Sets Syst. 2000, 114, 1–9. [Google Scholar] [CrossRef]
- Demiralay, E.; Çopur, E.H.; Paksoy, T. Spaceport selection using a novel hybrid pythagorean fuzzy AHP & TOPSIS based methodology: A case study of Turkey: A case study of Turkey. J. Aeronaut. Space Technol. 2022, 15, 1–17. [Google Scholar]
- Yucesan, M.; Kahraman, G. Risk evaluation and prevention in hydropower plant operations: A model based on Pythagorean fuzzy AHP. Energy Policy 2019, 126, 343–351. [Google Scholar] [CrossRef]
- Yucesan, M.; Gul, M. Hospital service quality evaluation: An integrated model based on Pythagorean fuzzy AHP and fuzzy TOPSIS. Soft Comput. 2020, 24, 3237–3255. [Google Scholar] [CrossRef]
- Chen, J.; Chor, B.; Fellows, M.; Huang, X.; Juedes, D.; Kanj, I.A.; Xia, G. Tight lower bounds for certain parameterized NP-hard problems. Inf. Comput. 2005, 201, 216–231. [Google Scholar] [CrossRef]
- Chen, C.T.; Lin, C.T.; Huang, S.F. A fuzzy approach for supplier evaluation and selection in supply chain management. Int. J. Prod. Econ. 2006, 102, 289–301. [Google Scholar] [CrossRef]
- TCE. Turkish Coal Enterprieses Occupational Accident Report; TCE: Ankara, Türkiye, 2012; unpublished work. [Google Scholar]
- Onder, S.; Mutlu, M. Analyses of non-fatal accidents in an opencast mine by logistic regression model—A case study. Int. J. Inj. Control Saf. Promot. 2017, 24, 328–337. [Google Scholar] [CrossRef] [PubMed]
- European Statistics on Accidents at Work (ESAW) Methodology 2001 Edition. Available online: https://ec.europa.eu/eurostat/ramon/statmanuals/files/ESAW_2001_EN.pdf (accessed on 15 May 2022).
- Hadjigeorgiou, J. Understanding, managing and communicating geomechanical mining risk. Min. Technol. 2020, 129, 159–173. [Google Scholar] [CrossRef]
- Fukuoka, K. Visualization of a hole and accident preventive measures based on the Swiss cheese model developed by risk management and process approach. WMU J. Marit. Aff. 2016, 15, 127–142. [Google Scholar] [CrossRef]
- Worksafe UK. Available online: https://www.worksafe.uk.com/risk-assessment/what-does-alarp-mean/ (accessed on 10 July 2024).


Disclaimer/Publisher’s Note: The statements, opinions and data contained in all publications are solely those of the individual author(s) and contributor(s) and not of MDPI and/or the editor(s). MDPI and/or the editor(s) disclaim responsibility for any injury to people or property resulting from any ideas, methods, instructions or products referred to in the content. |
© 2024 by the authors. Licensee MDPI, Basel, Switzerland. This article is an open access article distributed under the terms and conditions of the Creative Commons Attribution (CC BY) license (https://creativecommons.org/licenses/by/4.0/).