Abstract
With the outbreak and evolution of the pandemic worldwide, the financial market has experienced unprecedented shocks and adjustments, and the volatility and correlation of the stock market, as an important indicator of economic activities, have shown new features and trends during the pandemic. Based on the CSI 300 Index, we construct a three-stage sequential network representing the pre-pandemic, pandemic, and post-relaxation phases. We investigate the evolving dynamics and resilience of the network, forecasting potential future connections, thus offering fresh insights into comprehending market recovery. Our findings unveil that the market adapts dynamically to the pandemic’s progression, witnessing an overall augmentation in network interconnectedness. While the financial sector maintains its pivotal role, the influence of non-financial sectors experiences an upsurge. Despite the network demonstrating poor stability and heavy reliance on key nodes, there exists a positive recovery trajectory. Non-financial sectors such as energy and transportation emerge as pivotal catalysts for market rejuvenation. We provide suggestions for government regulators and investors, providing strong support for optimizing the market structure and promoting the long-term healthy development of the market.
1. Introduction
In recent years, amidst the growing complexity of financial markets, their inherent stability has emerged as a linchpin for the dynamic equilibrium of investment and financing. As one of the most pivotal financial markets, the stock market not only offers investors an expansive array of investment avenues but also mirrors market participants’ anticipations regarding the future operational performance and developmental trajectories of corporations [1]. Beyond being a conduit for corporate fundraising and investor return generation, the stock market serves as a vital barometer reflecting economic conditions and forecasting economic tendencies. Consequently, the robust functioning of the stock market is closely tied to the stable and rapid development of the socio-economic environment [2]. The COVID-19 pandemic, which swept across the globe in 2020, stands as the most devastating global public health emergency since the dawn of the 20th century, exerting a profound impact on both public health and daily life, while also presenting an unprecedented challenge to the stability of the worldwide economy and financial markets [3,4]. This quintessential “black swan” event, characterized by its extensive reach and heightened risk, induced severe repercussions on the economies of various nations [5]. Central to this, the stock market, acting as a weathervane for national economies, was subjected to intense volatility under the shroud of heightened uncertainty [6]. The severe turbulence in global financial markets caused by COVID-19 has heightened investor concerns about the uncertainty of stock returns due to healthcare and economic instability. This information uncertainty exposes investors to the influence of other investors, potentially leading to a herding effect [7,8].
During the COVID-19 pandemic, stock markets in numerous countries and regions worldwide were severely afflicted [9,10]. The U.S. stock market endured the most calamitous crash in its history, undergoing four consecutive “circuit breaker” events, while stock markets in Germany, the United Kingdom, and other nations plummeted by over 25% within a month [11,12]. In stark contrast, China’s stock market demonstrated relative resilience when compared to other global markets. Initially, China’s SSE index plunged to 2600 points at the onset of the pandemic [13]. However, with the Chinese government’s timely implementation of effective fiscal and financial measures, coupled with a series of market-supportive policies introduced by regulatory bodies, the stock market began to gradually stabilize and rebound, emerging as the sole major market globally to post positive growth in 2020 [14]. Fighting COVID-19: China in Action (https://www.gov.cn/zhengce/2020-06/07/content_5517737.htm, accessed on 1 August 2024), released in June 2020, pointed to building a global community of health for all, international solidarity and cooperation in fighting the pandemic, demonstrating the Chinese government ‘s determination to fight the pandemic. Nevertheless, by 2022, China’s stock market was still navigating numerous challenges owing to a myriad of factors and underwent several months of downturn before gradually recovering. The CSI 300 Index, a pivotal indicator of the performance of leading listed companies on China’s A-share market, encompasses 300 large and liquid stocks across China’s two exchanges. It not only mirrors the collective trajectory of the Chinese stock market but also serves as an important window for international investors seeking to gauge the dynamics of the Chinese market [15,16,17].
The ramifications of emergent events on stock market stability have consistently been a focal point in financial research [18,19]. For instance, Yousaf et al. examined the repercussions of the Russia–Ukraine conflict on the stock market, uncovering that the conflict adversely impacted most stock markets, with the Russian market bearing the brunt [20]. Yang probed the correlation between global oil market volatility, stock market volatility, and economic policy uncertainty by constructing a minimum spanning tree network, finding a notable correlation between stock market fluctuations and global oil price variations [21]. These studies further underscore that emergent events can precipitate sharp fluctuations in financial markets, influencing investor behavior and market expectations [22,23,24,25]. In recent times, the COVID-19 pandemic, a monumental global outbreak, has profoundly affected the stock market [26]. Throughout the pandemic, the earnings growth rate of large-cap stocks on the Chinese stock market waned compared to the pre-pandemic period, and its volatility alongside the evolution of the network structure displayed novel characteristics, attracting extensive attention from the academic realm. Comparable phenomena have been highlighted globally and have become a focal topic in international financial research [3,27]. Yang et al. detected the relationship between the risk diversification ability of financial institutions during the pandemic and the systemic contribution through gravity strength centrality model and found that financial institutions with greater risk diversification contributed more to systemic risk [28]. Okorie and Lin explored the fractal contagion effect of 32 stock markets before and after the outbreak utilizing the Detrended Moving Cross-Correlation Analysis (DMCA) and Detrended Cross-Correlation Analysis (DCCA) methodologies, discerning that the fractal contagion effect diminishes over time [29]. Conversely, Liu et al. investigated the risk contagion among 16 principal global stock markets during the COVID-19 pandemic by analyzing realized volatility data, discovering that the outbreak significantly amplified the risk contagion effect across international stock markets, with this spillover effect varying geographically [30].
The stock market is a complex economic system comprising stocks from various countries and regions [31]. With the advancement of big data technology, network analysis has become a powerful tool for studying financial market dynamics. Compared to traditional analytical methods, network analysis reveals intricate structural relationships and dynamic evolutionary processes within the market, offering investors and policymakers a more comprehensive and insightful perspective [32,33]. Mantegna pioneered the use of the minimum spanning tree method to construct a network for the Dow Jones and the Standard & Poor’s indices, optimizing portfolio strategies [34]. Since then, both domestic and international researchers have focused more on applying complex network models to financial markets. For instance, Roy and Sarkar used Pearson correlation coefficients to construct a network measuring the similarity of returns for 93 global stock indices from 2006 to 2010, discovering that Europe’s SXXP and SXXE were the most influential in the global stock market network before and after the Lehman Brothers’ bankruptcy [35]. Abuzayed et al. explored systematic risk spillovers in global and national stock markets during the COVID-19 pandemic, finding that developed regions’ stock markets propagated and received more risk during this period [36]. Zou investigated the co-jumps of China’s stock market before, during, and after the COVID-19 pandemic from a network perspective, and found that the epidemic had a continuous impact on China ‘s stock market, and its volatility and crash risk increased [37]. Huang et al. constructed a network based on 70 significant global stock indices to investigate stock market movements during COVID-19, finding that developed markets and European countries’ stock indices dominated the complex global stock market network [38]. Link prediction, a key technique in complex networks, can extract missing network information and forecast potential future connections. In stock networks, scholars utilize link prediction algorithms to predict future stock prices, index trends, and other aspects [39,40].
In general, scholars worldwide have provided significant insights into stock market dynamics. However, the global crisis induced by COVID-19 highlights the urgent need for a deeper examination of stock market behavior. Traditional methods, such as event study methodology, time series analysis, and Granger causality, offer fundamental understandings of market reactions to pandemics but often overlook dynamic market structure evolution and network resilience [41,42,43]. Most studies analyze the stock network at the pandemic’s onset from a static viewpoint, paying less attention to the dynamic shifts in the stock network throughout the pandemic and its before-and-after phases [44]. Complex network analysis can quantify the relationships among the stocks in the CSI 300 Index and reveal the overall structure of the stock market [45]. Taking two stocks in the CSI 300 Index as an example, Vanke A is a well-known real estate entity in the index, while Ping An Bank is a leading financial institution. Suppose the daily log return of Vanke A rises sharply, which could be triggered by a favorable policy shift or a rise in economic indicators. The impact of such changes extends beyond the real estate industry. Network analysis, with its ability to measure and interpret complex correlations, can reveal an indirect but substantial impact on financial stocks such as Ping An Bank. This impact may be manifested in increased lending opportunities in the real estate sector or in increased investor confidence from broader economic optimism. This illustrates the nuanced insights that network analysis can provide into the interconnectedness of market components, and its ability to provide a sophisticated view of the intricate web of relationships in the market. Therefore, we focus on stocks within the CSI 300 Index and construct a complex network model during three pandemic phases: pre-outbreak, outbreak, and post-release. We employ the threshold method, the minimum spanning tree technique, and the planar maximal filtering graph approach to delineate the network’s structural attributes, scrutinize its evolutionary trajectory, evaluate its resilience, and forecast potential future pivotal nodes from a dynamic standpoint. Through network analysis, we can more accurately identify and forecast changes in key market nodes, assess the robustness of market structures, thereby providing more precise decision-making support for market participants. This method not only uncovers complex relationships within the market but also tracks dynamic changes over different periods, offering a scientific basis for building multi-level markets. Our study aims to address the following research questions: (1) How did the network dynamics and resilience of the CSI 300 evolve during the pre-pandemic, pandemic, and post-relaxation phases? (2) Which industries were most affected during the pandemic? (3) Which industries played a key role in the market recovery trajectory during these phases?
The organizational structure of this paper is as follows: Based on the review and analysis of previous studies, Section 2 gives data sources and processing methods, different methods of network construction, evaluation indicators of network structure attributes and resilience, and analysis methods of potential links. Section 3 analyzes the overall correlation of the stock system, network topology results, core node identification, network cooperation resilience and potential connections. Section 4 includes conclusions and policy recommendations.
2. Data and Methodology
2.1. Data
From 2020 to 2022, there were two large-scale outbreaks of the novel coronavirus pandemic in China. Due to the continuous optimization and adjustment of prevention and control measures by the Chinese government, the pandemic prevention and control achieved a smooth transition in a relatively short period of time. In 2023, the government announced a decisive victory in the prevention and control of the novel coronavirus pandemic. Therefore, we selected the daily closing price of the CSI 300 Index constituent stocks from the Cathay Pacific database as a sample, and the time range is from 2017 to 2023. Taking the outbreak of COVID-19 as the time node, the research period is divided into three stages: the first stage is the early stage of the pandemic (from 2017 to 2019); the second stage is the outbreak period (from 2020 to 2022); the third stage is the release period of the pandemic (from 1 January 2023 to 31 December 2023). To maintain data consistency and stability across each stage, we ensured the inclusion of stocks from the CSI 300 Index throughout the first stage. Additionally, we omitted suspended stocks and those suspended at the conclusion of the study period from our analysis in all stages, applying the same approach to both the second and third stages.
2.2. Methodology
2.2.1. Network Construction
Firstly, we calculate the daily logarithmic return rate of the constituent stocks in the CSI 300 Index, that is, the logarithm of the closing price ratio of the two adjacent trading days of the stock. Compared with the simple return rate, the logarithmic return rate can make the stock data more intuitive and stable. The calculation formula is:
where ri(t) is the logarithmic return rate of stock i on date t, pi(t) is the closing price of stock i on date t, and pi(t − 1) is the closing price of stock i on date t − 1.
Secondly, using the daily logarithmic return rate of each stock to calculate the Pearson correlation coefficient between each stock, the correlation coefficient matrix is constructed. The formula is:
where N is the total number of stocks, and Cij is the correlation coefficient between stock i and stock j.
Based on the constructed network matrix, we use the threshold method, minimum spanning tree method, and plane maximum filter graph method to construct an undirected weighted network based on the daily logarithmic return rate of CSI 300 Index stocks, and analyzes the network stability and evolution characteristics of CSI 300 Index stocks from different angles.
- (1)
- Threshold method
The threshold method is a straightforward approach to constructing networks by filtering stock connections based on a predetermined threshold value of the correlation coefficient [33]. This method leverages the Pearson correlation coefficient matrix to establish network connections. Initially, a threshold value, denoted as θ, is selected. A link is established between two stocks if their correlation coefficient exceeds this threshold, with the correlation coefficient itself serving as the weight of the connecting edge. As θ is increased, the network topology evolves, resulting in a reduction in the number of connections within the network. For this study, the threshold value is strategically chosen at the critical point of network connectivity. This selection is crucial for preserving the integrity of stock information while simultaneously mitigating redundancy, thus ensuring a robust and meaningful representation of the stock market’s interconnectedness.
- (2)
- Minimum spanning tree
The Minimum Spanning Tree (MST) is an effective technique for constructing a connected graph that encompasses all vertices without forming any closed loops, while ensuring that the total edge weight is minimized [46]. This is achieved by selectively linking vertices with the smallest available edge weights. Two widely recognized algorithms for generating an MST are Kruskal’s algorithm and Prim’s algorithm. In this study, we opt for Prim’s algorithm to build the MST within the stock network. Given that the Pearson correlation coefficient does not align with traditional Euclidean distance metrics, we first transform the correlation coefficient matrix into a distance matrix. Subsequently, we apply Prim’s algorithm to construct the MST, thereby ensuring that the connectivity between any two stocks is achieved at the minimum possible distance. The calculation formula is:
the greater the value of dij, the lower the correlation between stocks i and j.
- (3)
- Plane maximum filter graph
The Planar Maximal Filtering Graph (PMFG) is an enhancement of the MST method, designed to include as many edges as possible while maintaining the network as a planar graph [47]. Unlike MST, which strictly limits the number of edges, PMFG relaxes this restriction by only requiring that any new edges added to the stock network maintain planarity. This allows PMFG to retain more information while preserving the network’s clear structure.
2.2.2. Network Attribute
- (1)
- Degree and node weight
In the network, the degree and the node weight (NW) jointly reveal the importance of the stock nodes in the network structure. The degree reflects the number of direct connections between a node and other nodes, and the node weight represents the cumulative influence of the node through the weight of the edge it connects, which can measure the propagation intensity of the node.
- (2)
- Degree correlation
The degree correlation can describe the interaction between the nodes with higher moderate value and other nodes in the stock network. The calculation formula is:
where ki and kj denote the degree of the two nodes i and j of the edge eij, respectively, and E denotes the total number of edges of the network. If the r value is positive, it indicates that the high-value nodes in the network tend to connect to the nodes with higher degree, and vice versa.
- (3)
- Degree centrality
Degree centrality (DC) can directly reflect the key degree of a single stock node in the network [48,49]. If a stock has a high degree centrality value, it indicates that it is directly related to many other stocks in the market, and thus has significant control in the transmission of information and the formation of market trends. The calculation formula is:
where N is the total number of nodes in the stock network, and xij is the number of edges between stocks i and j.
- (4)
- Closeness centrality
Closeness centrality (CC) depicts the ability of a node to be ‘not controlled by other nodes’ in the stock network [50,51]. The higher the closeness centrality of the node, the stronger the correlation with other nodes. The calculation formula is:
where dij represents the shortest path between nodes i and j, and N is the total number of nodes in the stock network.
- (5)
- Betweenness centrality
Betweenness centrality (BC) can describe the ‘bridge’ and ‘intermediary’ role played by nodes in the stock network, and can reflect the node’s ability to control information flow and resource transmission throughout the network [52]. The calculation formula is:
where σst(i) denotes the number of shortest paths passing through i from node s to t, and σst denotes the total number of shortest paths from node s to t.
- (6)
- Influence strength
Influence strength (IS) can measure the ability of one stock’s price fluctuation to cause the price fluctuation of other stocks. The calculation formula is:
where Si is the influence strength of stock i, and wij is the weight between stocks i and j. Γi indicates the set of all nodes connected to node i.
2.2.3. Resilience
Resilience can test the transmission efficiency and robustness of the constructed stock network under attack. Random attack and deliberate attack are two main attack methods to test the robustness of the network. They can simulate the impact of some nodes on the whole network when they exit and evaluate the overall robustness and resilience of the stock network [53,54]. We adopt two different attack strategies, random attack and targeted attack, to observe the change of AUC (Area Under Curve) area, and use the change trend of global efficiency and relative size of largest cluster to measure the robustness of the stock network.
- (1)
- Global efficiency
Global efficiency of the network is a typical connectivity measure index, which can measure the utility and connectivity of the stock network after the attack from a global perspective: if the network is attacked by a small number of nodes but the global efficiency does not change significantly, it can be explained that the network has more invulnerability. Strong connectivity is higher, and vice versa, invulnerability is weaker. The calculation formula is:
the greater the E value, the stronger the robustness of the stock network. When E = 0, it shows that any two enterprises in the network are isolated, and the stock network connectivity is the worst.
- (2)
- Relative size of largest cluster
Relative size of largest cluster refers to the extent to which the nodes can remain connected to each other after the network is attacked. Its high value means that even if some nodes fail after being attacked, the main part of the network can still maintain stable operation, showing strong resilience. The calculation formula is:
2.2.4. Link Prediction
Link prediction can predict the future missing connections or potential connections through the existing network topology relationships in the stock network; common link prediction similarity metrics include Common Neighbors (CN), Preferential Attachment (PA), Jaccard, Adamic–Adar (AA) and Resource Allocation (RA) [39,55]. CN and PA pay more attention to the number of direct connections of nodes, Jaccard considers the proportion of common neighbors, AA and RA consider the scarcity of common neighbors [25]. Different metrics can measure node similarity from different perspectives. The calculation formula is:
CN:
AA:
RA:
PA:
Jaccard:
where Γ(x)∩ Γ (y) represents the set of common neighbors between nodes, and kz represents the degree of z.
3. Results
3.1. Overall Correlation
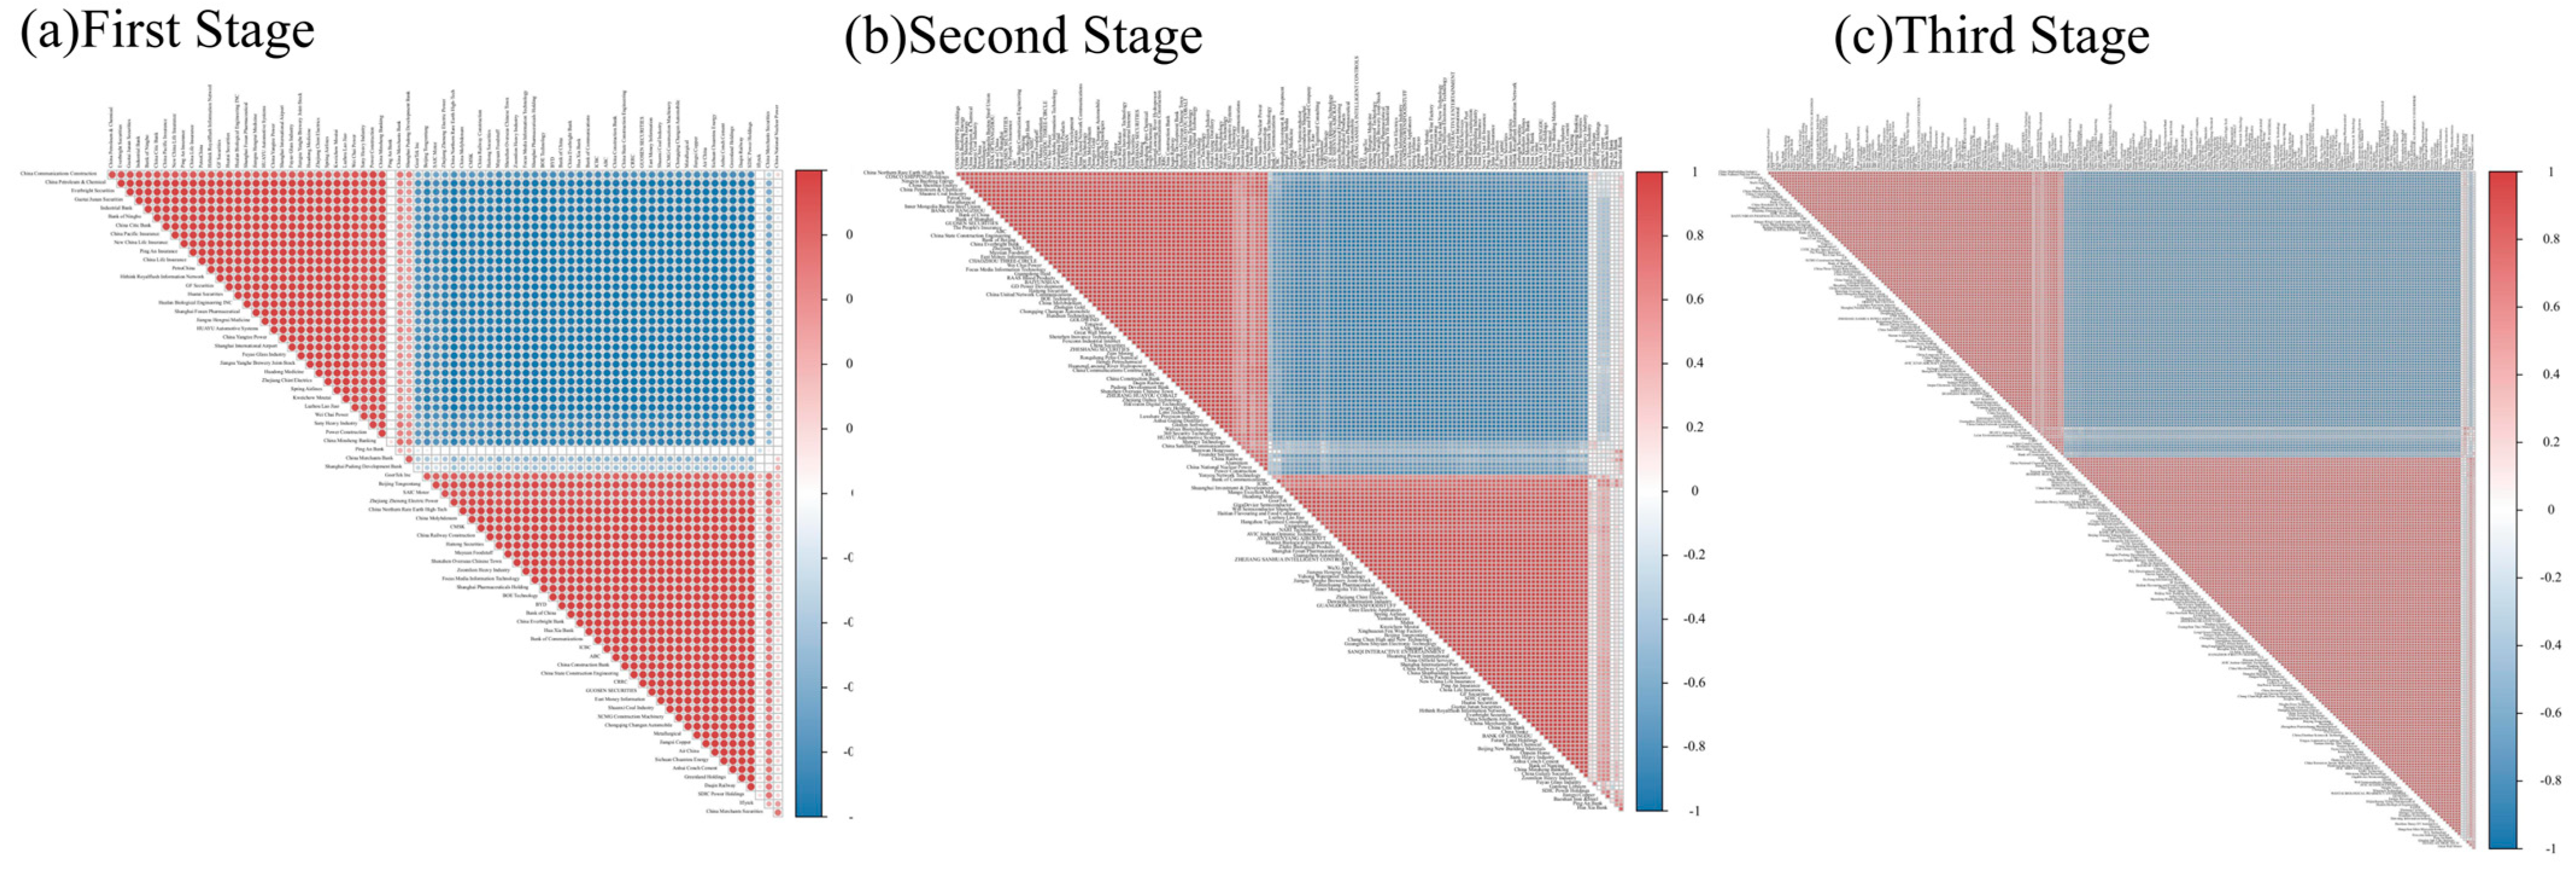
Analyzing the CSI 300 Index, we computed correlation coefficients between stock pairs, constructing the correlation network presented in Figure 1. Positive correlations suggest vulnerability to systemic risks, while negative correlations may offer hedging opportunities. Blue shades indicate negative correlations, and red shades denote positive ones, with intensity reflecting correlation strength.
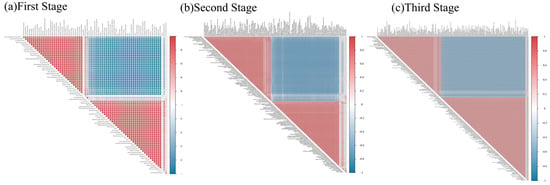
Figure 1.
Overall correlation plots of three stages.
The network’s evolution across stages reveals notable shifts. Initially, the market shows a balanced correlation distribution with a slight bias towards positive correlations, indicating stability. During the second stage, the pandemic’s impact increases positive correlations, reflecting convergent investor behavior and a collective response to heightened risk aversion. In the third stage, while there is a noticeable rise in negative correlations, the market largely maintains positive correlations. This indicates that despite some sectors and stocks diverging due to the pandemic and recovery efforts, most stocks continue to have positive associations, preserving overall market coherence. The choice of thresholds for constructing these networks was based on ensuring a sufficient number of significant links to capture the underlying market structure, while the MST and PMFG methods provided complementary perspectives on the network’s topology.
3.2. Construction of Network
Based on the analysis of stock correlations, we employ three distinct network construction methods: threshold method, MST method, and PMFG method. These techniques are utilized to construct spatial correlation network diagrams for the Shanghai and Shenzhen 300-value stocks. The objective is to investigate the dynamic development trends within these networks. The Gephi software(0.10.1) facilitates the division of the network into communities and aids in identifying node clustering patterns within the stock network, as illustrated in Figure 2, Figure 3 and Figure 4.
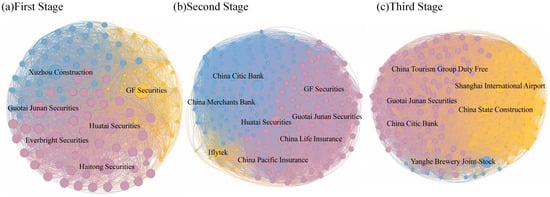
Figure 2.
Threshold network of three stages.
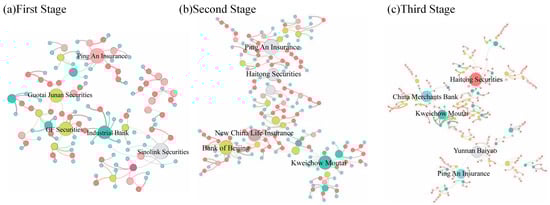
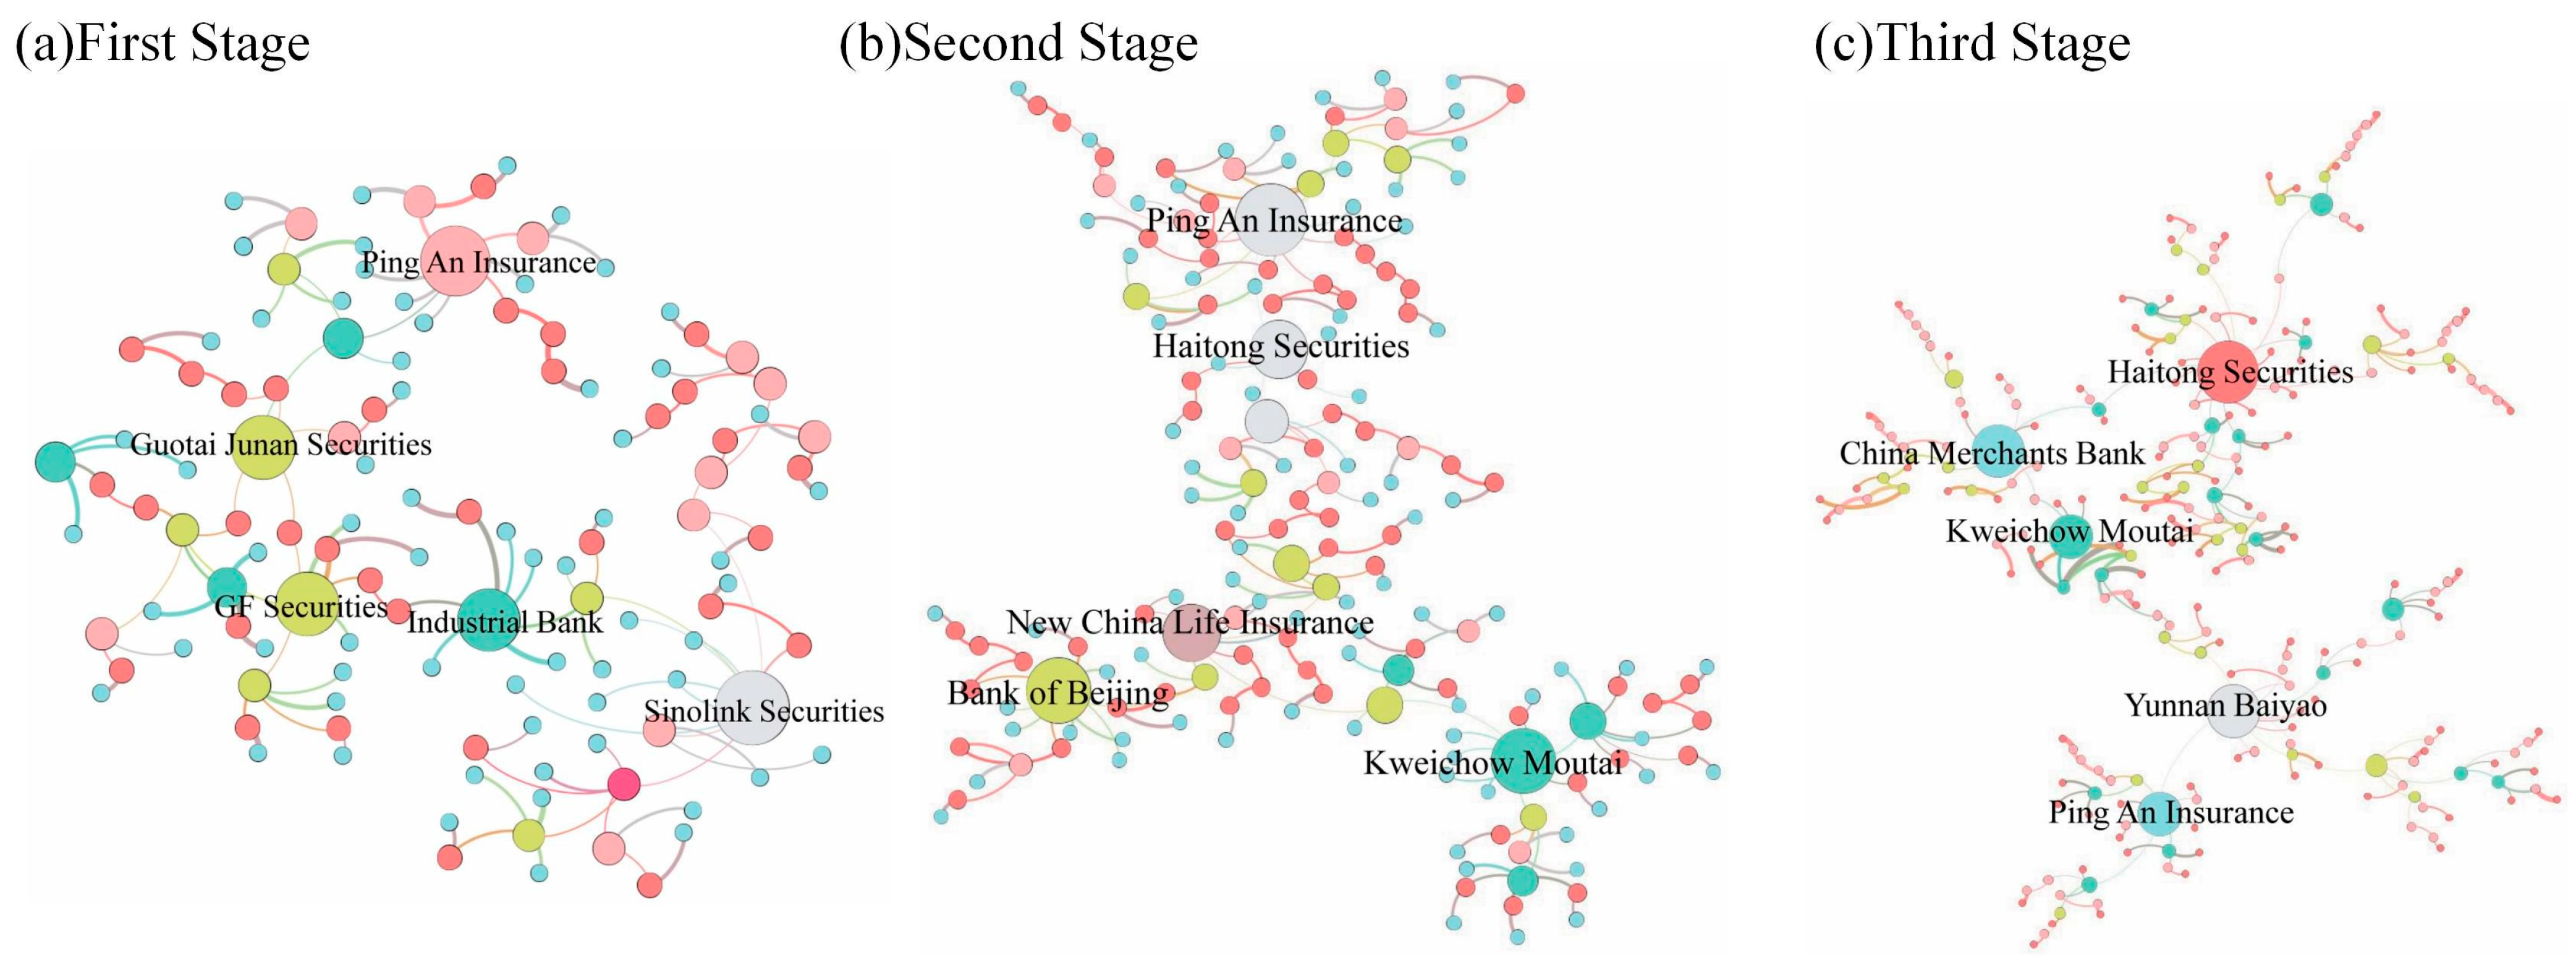
Figure 3.
MST network of three stages.
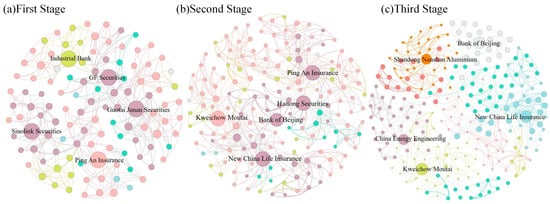
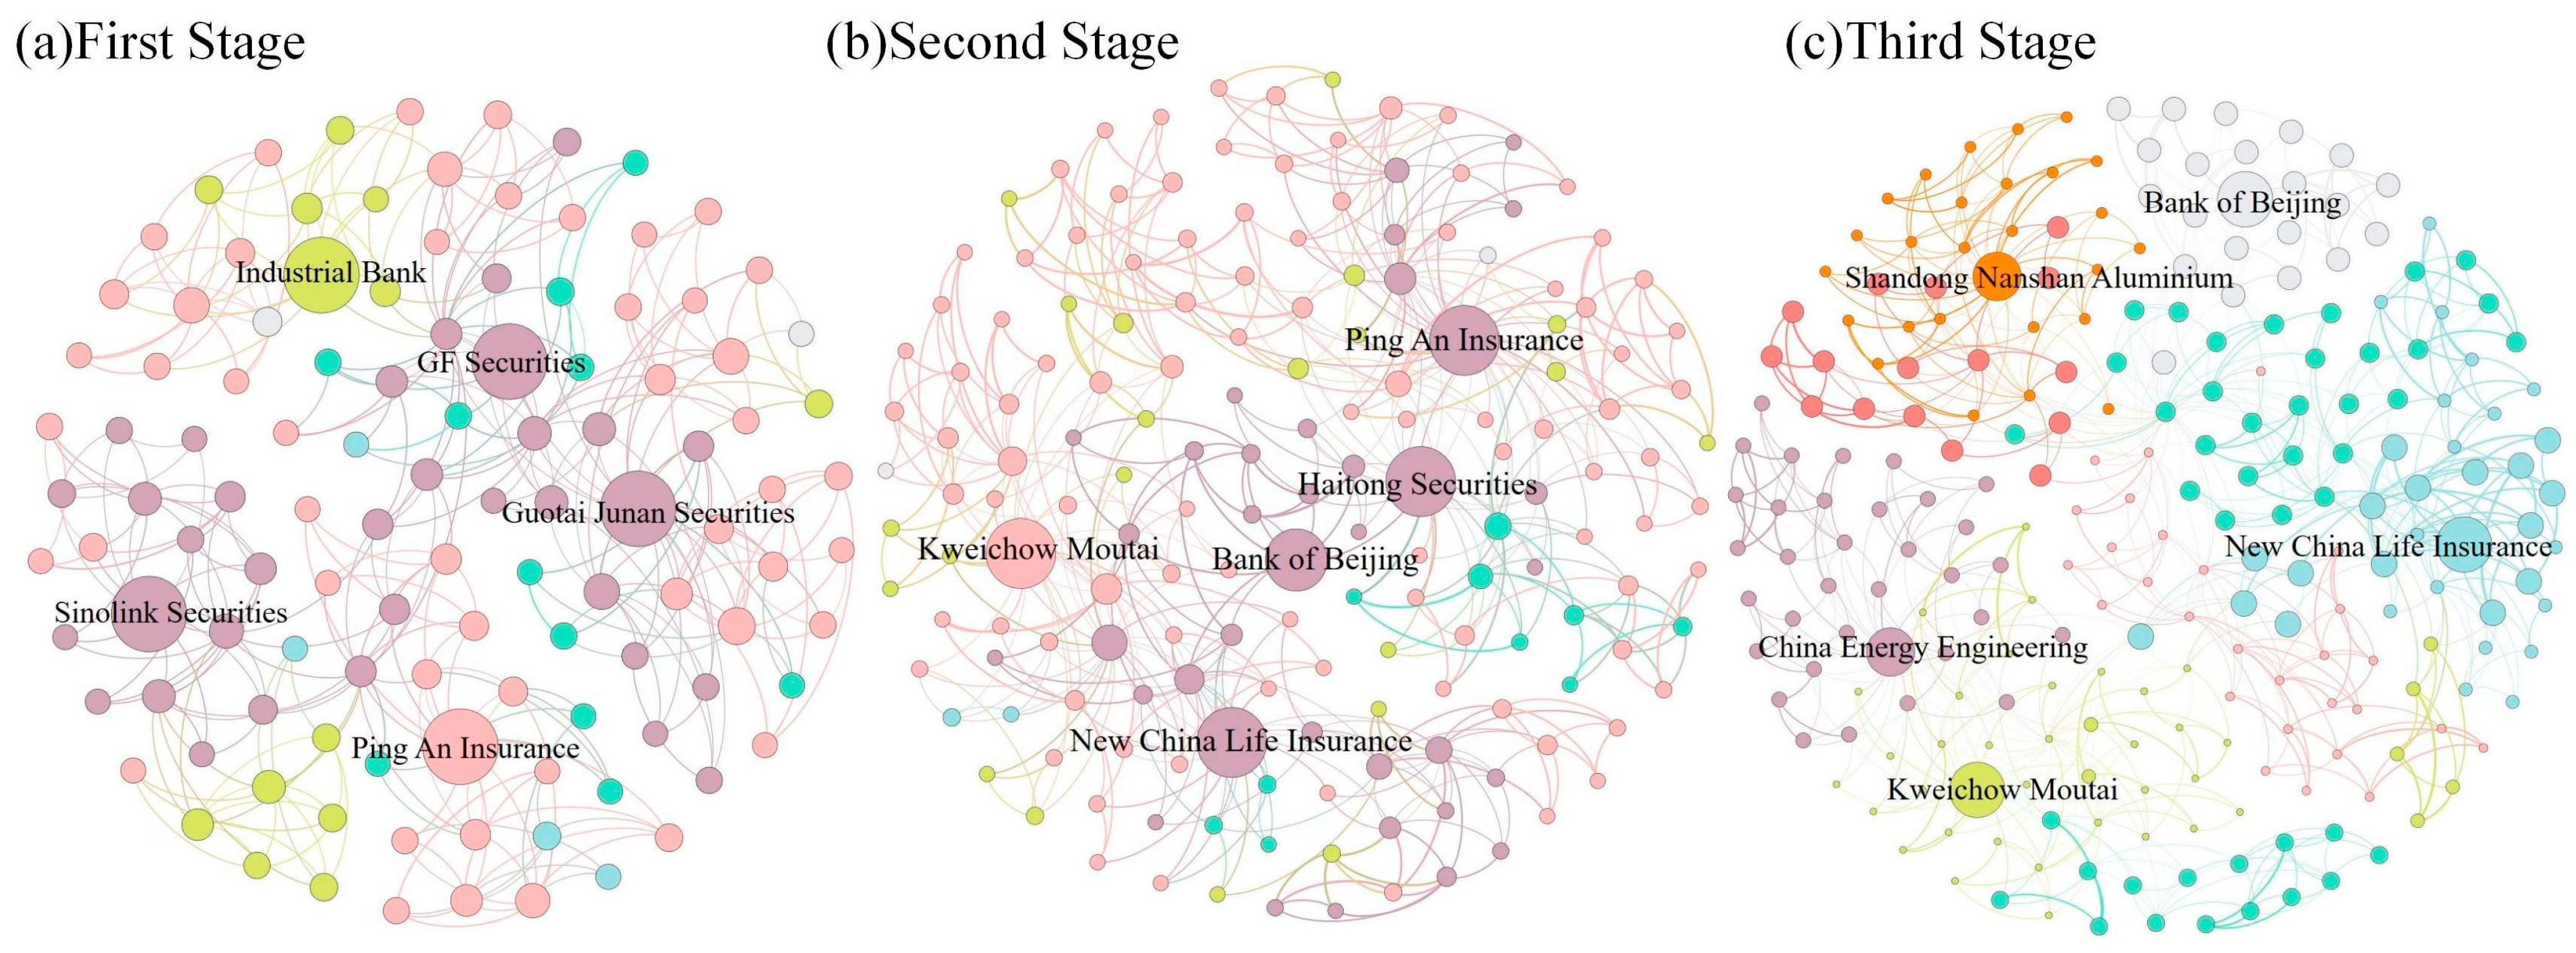
Figure 4.
PMFG network of three stages.
In the network established using the threshold method, Guotai Junan Securities and GF Securities consistently occupy core positions across the three-stage stock network, significantly influencing industry progression. Concurrently, non-financial sectors like Iflytek, Yanghe Brewery, Shanghai International Airport, and China State Construction Engineering witness a notable rise in their node centrality, progressively dominating the network’s nucleus. Utilizing the minimum spanning tree approach, firms including Ping An Bank, GF Securities, Haitong Securities, and Kweichow Moutai demonstrate enhanced impact within the network. Additionally, the significance of entities like China Merchants Bank, Bank of Beijing, and Yunnan Baiyao is observed, underscoring their crucial function in sustaining market equilibrium and ensuring information flow efficiency. The planar maximum filter graph method yields a network complexity intermediate between that of the threshold method and the minimum spanning tree method, offering deeper insights into network intricacy. Nodes like Ping An Bank, Guotai Junan Securities, Haitong Securities, and Kweichow Moutai consistently exhibit high importance across all three phases. In contrast, entities such as New China Life Insurance, Shandong Nanshan Aluminum, and China Energy Engineering Corporation witness a rising prominence, underscoring the market’s multifaceted nature.
In summary, stocks including Ping An of China, Haitong Securities, and Guotai Junan Securities are pivotal across all three network paradigms, exerting significant influence. All three methodologies for crafting 3-stage network graphs reveal a pattern: an uptick in participant numbers, outward expansion of network dimensions, densification of node interconnections, and heightened network cohesion. Such trends underscore intensifying interactions among market actors and amplifying market interconnectivity and intricacy.
3.3. Network Structure Attribute
3.3.1. Degree and Node Weight
Table 1 and Table 2 present an analysis of the top five stocks in each of the three-stage networks, ranked by degree and node weight size. These stocks are identified as potential key nodes due to their substantial connectivity and market influence, which may significantly impact market dynamics within the network context.

Table 1.
The top 5 stocks in different stages of degree.
Table 2.
The top 5 stocks in different stages of node weight.
Different industries have different sensitivities to the COVID-19 pandemic [56]. In the initial stage, entities such as GF Securities, Huatai Securities, and Everbright Securities exhibit the highest degree and node weight. This suggests that these securities firms possess a heightened degree of connectivity and exert considerable influence within the network, underscoring their centrality to market interactions. Progressing to the second stage, the analysis reveals that stocks including CITIC Bank, Huatai Securities, China Merchants Bank, New China Life Insurance, and GF Securities have elevated degree and node weight. This trend indicates a gradual increase in the market influence of banking and insurance institutions, highlighting their growing significance within the financial ecosystem. In the final stage, Ping An Bank, China National Chemical Engineering, China State Construction Engineering, and Yanghe Brewery shares emerge with high network rights. This shift reflects the rise in prominence of not only traditional financial sector stocks but also other industries such as semiconductor materials, chemicals, and consumer goods. These sectors are beginning to claim more prominent positions within the market network, indicating a diversification of influence and a broadening of the market’s multi-sectorial dynamics.
The banking sector consistently maintained a prominent position throughout all three phases, underscoring the enduring impact of the financial sector on market dynamics [57]. Concurrently, there was an uptick in the demand and popularity of insurance products, potentially due to heightened uncertainty stemming from the pandemic, which may have intensified the focus on risk management and asset conservation. As restrictions related to the pandemic were progressively lifted, the market significance of stocks associated with retail, tourism, and consumer goods saw a notable increase. Furthermore, the influence of consumer-centric industries continued to broaden within an increasingly diverse market structure.
Equation (4) presents the degree correlations for the three-stage network as −0.2405, −0.1704, and −0.0876, respectively. According to Newman‘s’research, a negative degree correlation in a network suggests that nodes with higher connectivity tend to link with those of lower connectivity, rendering the network relatively more fragile [58]. From the initial to the final stage, the diminishing absolute value of the degree correlation indicates a reduction in the network’s vulnerability, implying that the stock network structure is evolving towards greater stability.
3.3.2. Centrality Analysis
In centrality measurement, different metrics focus on distinct aspects and should not be assessed solely from a single perspective. Degree centrality identifies key nodes in the stock network and evaluates their importance. Closeness centrality, a crucial measure of node influence within the network, reflects the pivotal role of stocks in information flow and risk transfer. Betweenness centrality further elucidates the interactions and connection tightness between different stock groups. These three metrics measure the characteristics of nodes within the network from various perspectives. The centrality results for the top five stocks across different stages are presented in Table 3, Table 4 and Table 5.
Table 3.
The top 5 stocks in different stages of degree centrality.
Table 4.
The top 5 stocks in different stages of closeness centrality.
Table 5.
The top 5 stocks in different stages of betweenness centrality.
Regarding degree centrality, variations exist in the rankings across different stages. During the initial stage, GD Power Development exhibits the highest degree centrality at 0.0820, signifying its pronounced impact on information dissemination and risk propagation within the network. As we transition to the second stage, Haitong Securities and Huatai Securities witness an uptick in their degree centrality to 0.0667 and 0.0556, respectively, denoting an amplified influence of these securities firms within this phase. In the concluding stage, Kweichow Moutai secures the pinnacle in degree centrality at 0.0615, underscoring its predominant influence relative to other stocks. Kweichow Moutai’s performance varied significantly across different stages of the pandemic. During the early stage, its performance was less pronounced due to the sudden market disruptions and heightened uncertainty, which affected consumer behavior and investor confidence. The company’s reliance on traditional sales channels also hindered its ability to adapt quickly to the rapidly changing market conditions [59]. But it may have maintained its core position during the pandemic by geographical protection of origin, unique brewing technology, and other advantages.
Pertaining to closeness centrality, prominent financial entities like Ping An Bank, Huatai Securities, and Guotai Junan Securities manifest elevated proximity centrality throughout the tri-phasic network, underscoring their paramount significance and sway within the marketplace. The consistent high proximity centrality of the financial sector during the first and second stages reaffirms its pivotal role in the overarching stock market milieu. By the third stage, Ping An Bank’s proximity centrality escalates to 0.7052, delineating its commanding presence within the network. Concurrently, the prominence of non-financial sector stocks, including Baoshan Iron & Steel, China National Chemical Engineering, and China State Construction Engineering, surges, alluding to a metamorphosing market landscape and a burgeoning appetite for varied investment portfolios.
Concerning betweenness centrality, the foremost five stocks in the preliminary phase encompass financial domain counters such as Guotai Junan Securities, Ping An Bank, New China Life Insurance, and China Pacific Insurance. This suggests their enhanced efficacy in facilitating information transmission and wielding influence within the stock exchange during this interval. Progressing into the second phase, while certain top-tier stocks from the initial phase, notably Guotai Junan Securities and Ping An Bank, sustain their elevated intermediary centrality, newcomers like Xinhua Insurance, Bank of Beijing, and Haitong Securities manifest heightened centrality. Such shifts potentially mirror the market’s adaptive response to external shocks and the subsequent recalibration of informational flows and influence dynamics within this fluid context. In the terminal phase, non-financial sector stocks, epitomized by Kweichow Moutai (0.6218) and Yunnan Baiyao (0.4987), ascend into the echelons of elevated intermediary centrality. This trend underscores their escalating influence within the market network and signals an evolving marketplace that is progressively multifaceted and intricate.
3.3.3. Influence Strength
The influence strength of the network is presented in Table 6. During the first stage, nodes such as Guotai Junan Securities, Sinolink Securities, Ping An Bank, and Industrial Bank exhibit higher influence strength, highlighting their significant role within the network. In the second stage, Haitong Securities, Kweichow Moutai, and Bank of Beijing demonstrate increased node influence strength, suggesting a redistribution of market influence due to the pandemic’s impact. In the third stage, Kweichow Moutai, Haitong Securities, Shandong Nanshan Aluminium, China Energy Engineering Corporation, and Ping An Bank display elevated influence strength, potentially reflecting the market’s adjustment to the new normal following the relaxation of pandemic restrictions. Overall, financial sector nodes predominantly exhibit high influence strength across the three stages. However, as time progresses, stocks from other sectors also begin to show increased influence strength, indicating that their market influence cannot be overlooked at certain stages. These shifts illustrate the evolution of market dynamics, particularly amidst the global pandemic where inter-sector influence may vary over time and circumstances.
Table 6.
The top 5 stocks in different stages of impact strength.
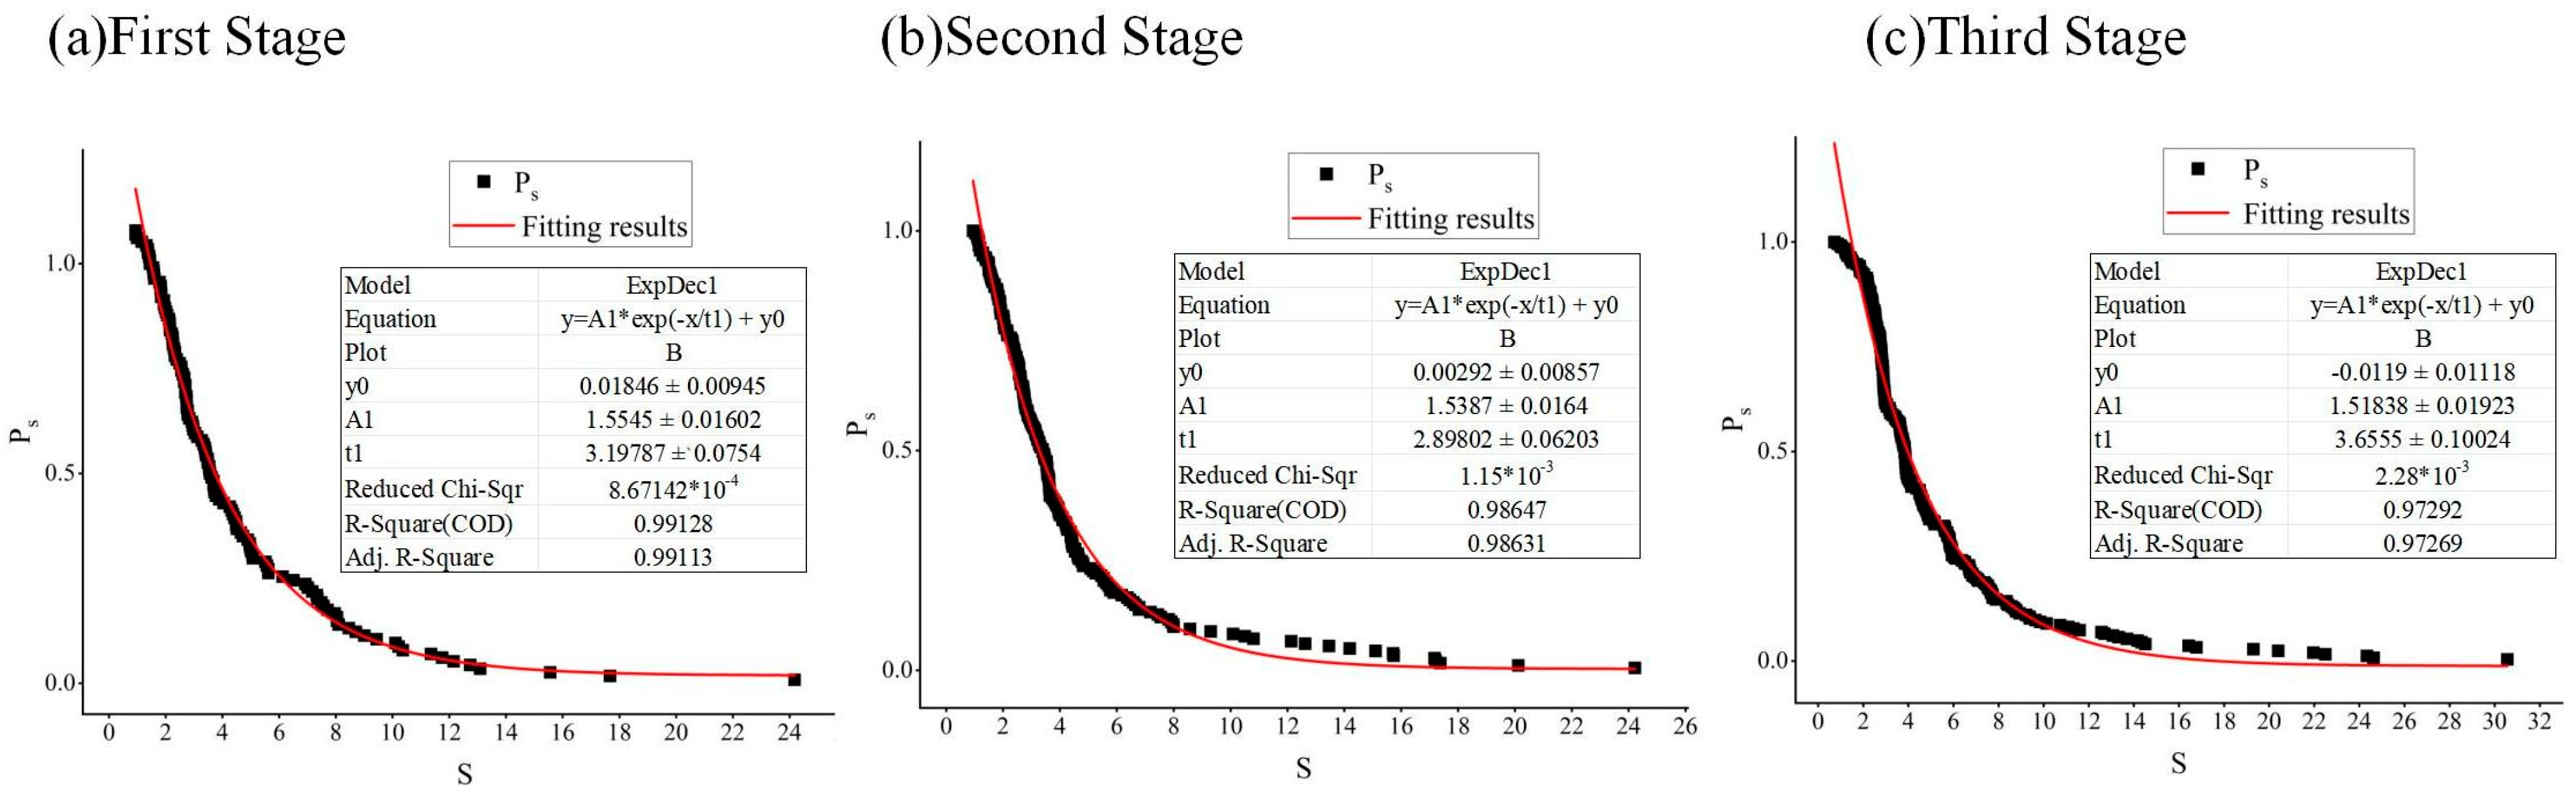
The power-law distribution can characterize the scale free of the stock network [60]. Cumulative influence can result from the interaction between multiple features of a given type [61]. Additionally, we applied a power-law distribution to the influence strength and cumulative influence strength across the three-stage network to understand its structural dynamics, with results shown in Figure 5; R2 and Adjusted R2 indicate goodness of fit and adjusted goodness of fit. As evident from the figure, the goodness of fit for all three stages exceeds 95%, indicating that the distribution function of cumulative influence strength adheres to a power-law distribution with high confidence. This suggests that the distribution of influence within the stock market network is distinctly hierarchical and uneven, with a few nodes potentially possessing most of the connections or influence. The distribution of stock influence varies across different stages. In the first stage, the power index of the stock network is approximately 0.3127 (1/3.1978), indicating that a small portion of the network holds a significant amount of influence. In the second stage, with the outbreak of the pandemic, the power index is about 0.345 (1/2.8980), indicating a more uneven distribution of influence within the stock market network. This may be due to investors seeking safe assets in an uncertain economic environment, leading them to invest more in large, stable stocks with a strong track record. In the third stage, as the market gradually adapts to the new economic environment, the power index is about 0.2736 (1/3.6555). This suggests that as the economic environment stabilizes and investor confidence is restored, the distribution of influence within the market begins to equalize. Investors may start reassessing the value of various equities and diversifying their investment risks, rather than concentrating on a few large-cap stocks.
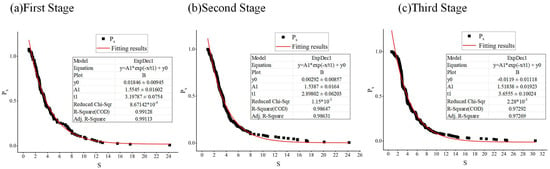
Figure 5.
Power-law distribution fitting results for influence strength and cumulative influence strength in different stages.
3.4. Network Structure Effect
Further, with network efficiency as the explained variable and five indicators of network node weight, degree, influence strength, degree centrality, closeness centrality, and betweenness centrality as the explanatory variables to reveal the internal mechanism of the stock network correlation system, the results are shown in Table 7, and the 6 indicators pass the significance test. In the two stages of pre-pandemic outbreak and pandemic outbreak, node weight, influence strength, and each centrality indicator are mainly negatively correlated to efficiency, when the network information flow is blocked, and the pandemic impact exacerbates the information asymmetry and circulation barriers in the market, and the network efficiency is low. After the liberalization of the pandemic, node weight and influence strength have a positive effect on efficiency, the market gradually returns to normal, and stocks with high node weight and influence strength have more advantages in the network. However, centrality still shows a negative correlation effect, which may reflect that too high centrality may lead to overconcentration of resources and affect market efficiency during the market recovery period.
Table 7.
Regression results in different stages of nodal attributes.
3.5. Resilience
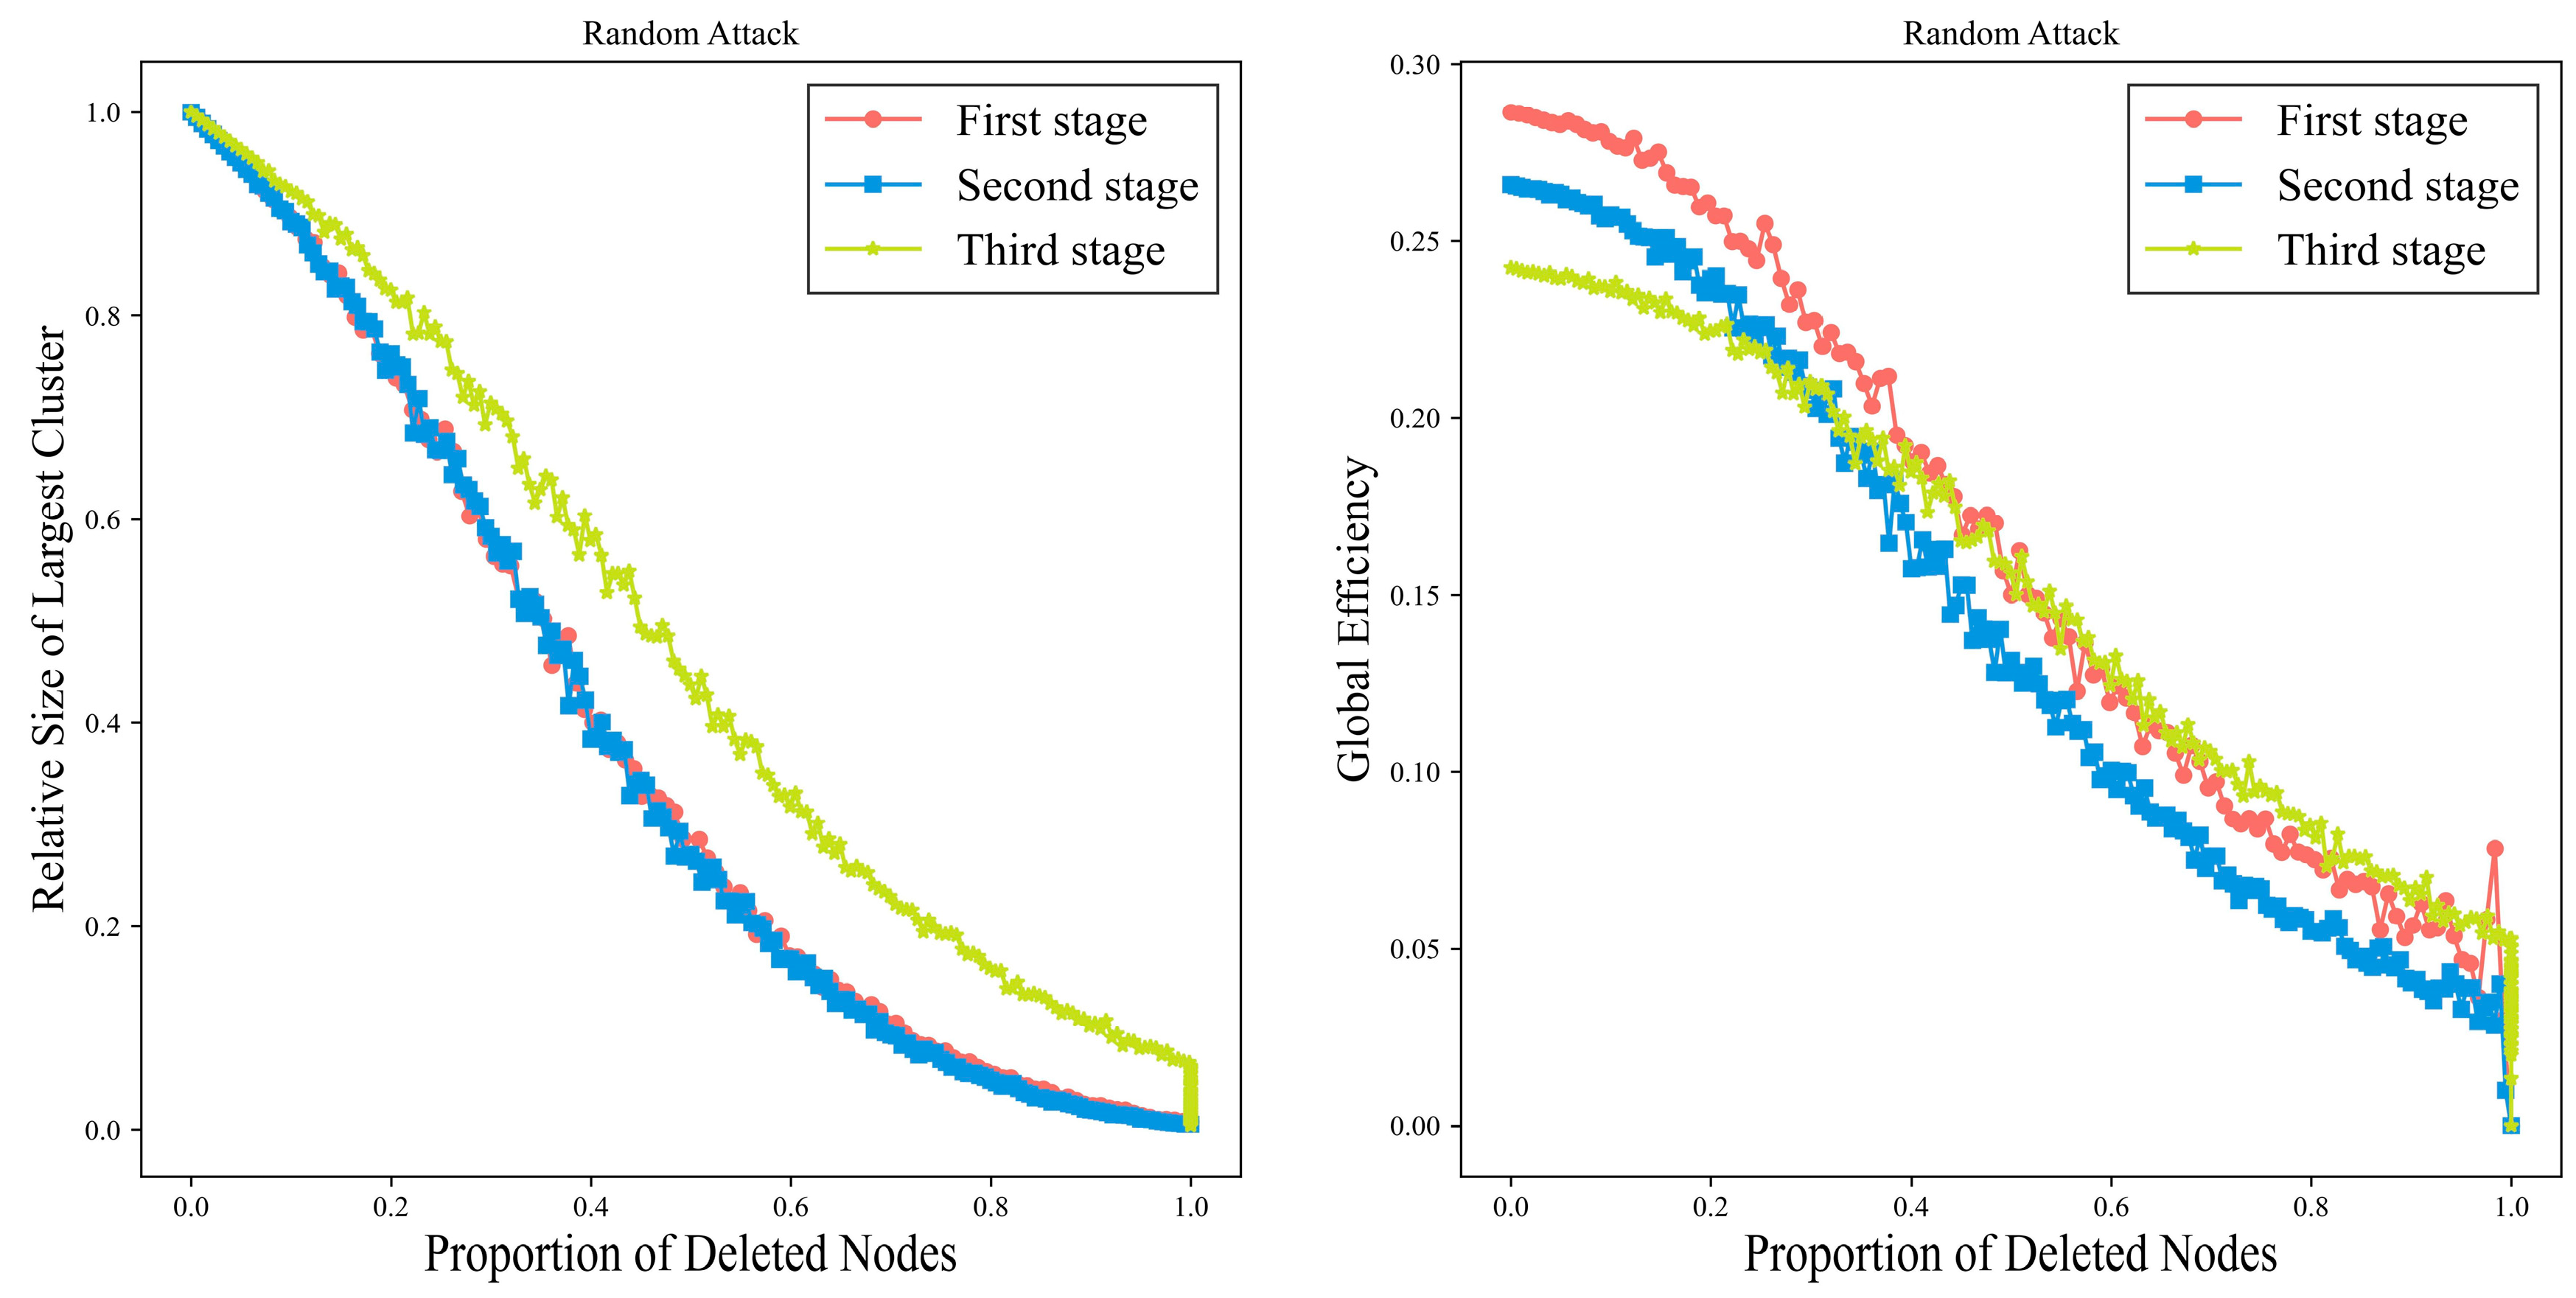
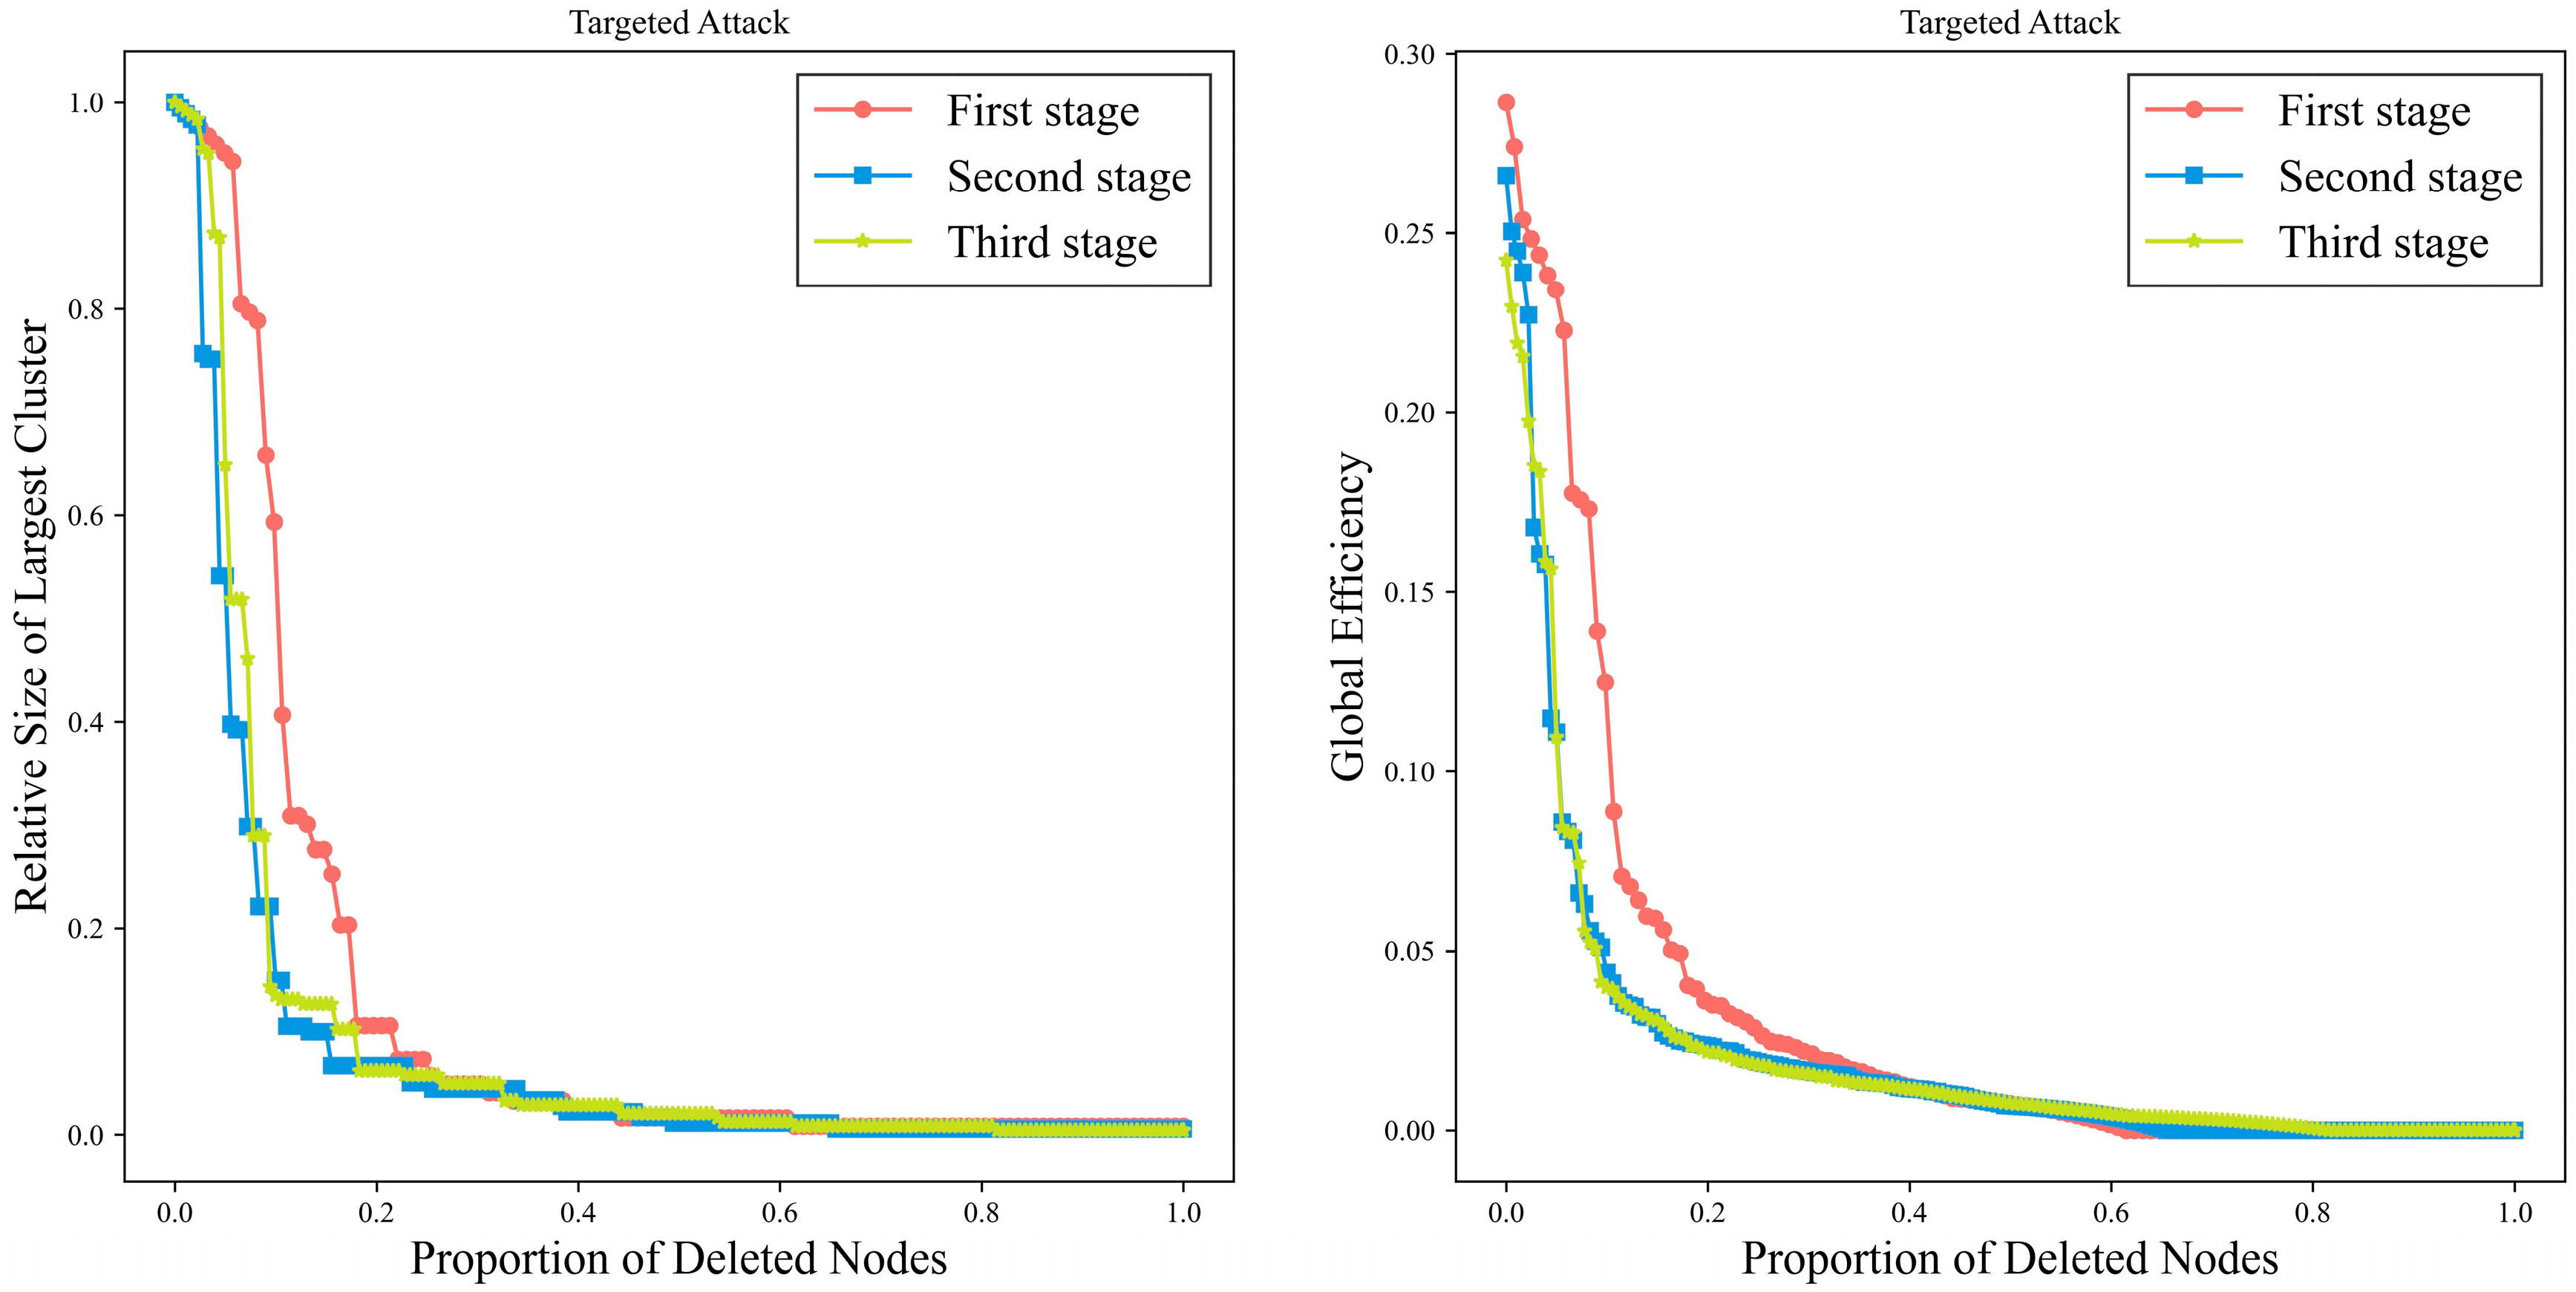
Furthermore, to thoroughly investigate the stability evolution trend of the CSI 300 Index network across three distinct stages, we employ a simulation method for intervention and analysis of the stock network. The trends in global efficiency and the relative size of the largest subgraph are observed when the network is subjected to attacks, using two different strategies: random and targeted attacks [62]. To enhance the precision of statistical results and minimize chance errors, we conduct the random attack 100 times and compute the average indicators of the statistical measures at each stage. For targeted attacks, nodes are ranked based on their importance, and then the top-ranked nodes are removed to simulate targeted attacks against key nodes in the network, as illustrated in Figure 6 and Figure 7.
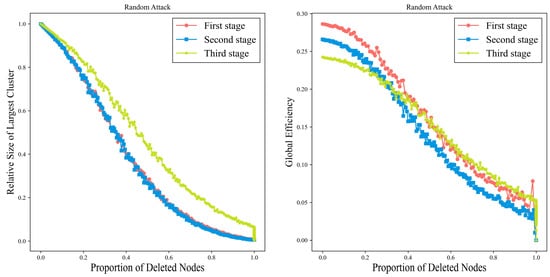
Figure 6.
Network change trend under random attack.
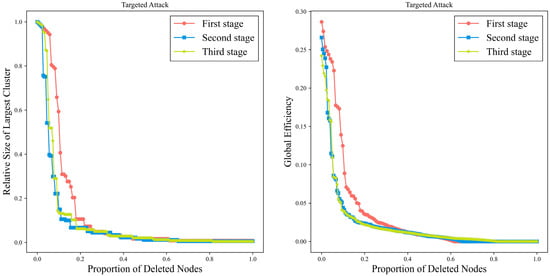
Figure 7.
Network change trend under targeted attack.
With an increasing proportion of removed nodes, both the efficiency and the relative size of the largest subgraph in the three-phase network exhibit a progressive decline, accompanied by a gradual decrease in network connectivity. Under random attack, the network’s efficiency and the relative size of the largest subgraph show a relatively uniform decline with minor fluctuations; under intentional attack, these parameters display a steep downward trajectory. Taking the third stage as an example, when 20% of nodes are removed, the relative size of the largest subgraph under random attack approximates 80%, and the global efficiency is around 0.24. In contrast, the decline of these two metrics under intentional attack approaches zero, indicating that the stock network nodes fail throughout almost the entire stage. This phenomenon is primarily due to the rapid disintegration of the network’s connectivity state at the onset of the intentional attack, leading to a sharp decrease in overall network efficiency. This also suggests that, compared to intentional attacks, random attacks have less impact on the stock network and demonstrate some degree of resilience.
3.6. Link Prediction
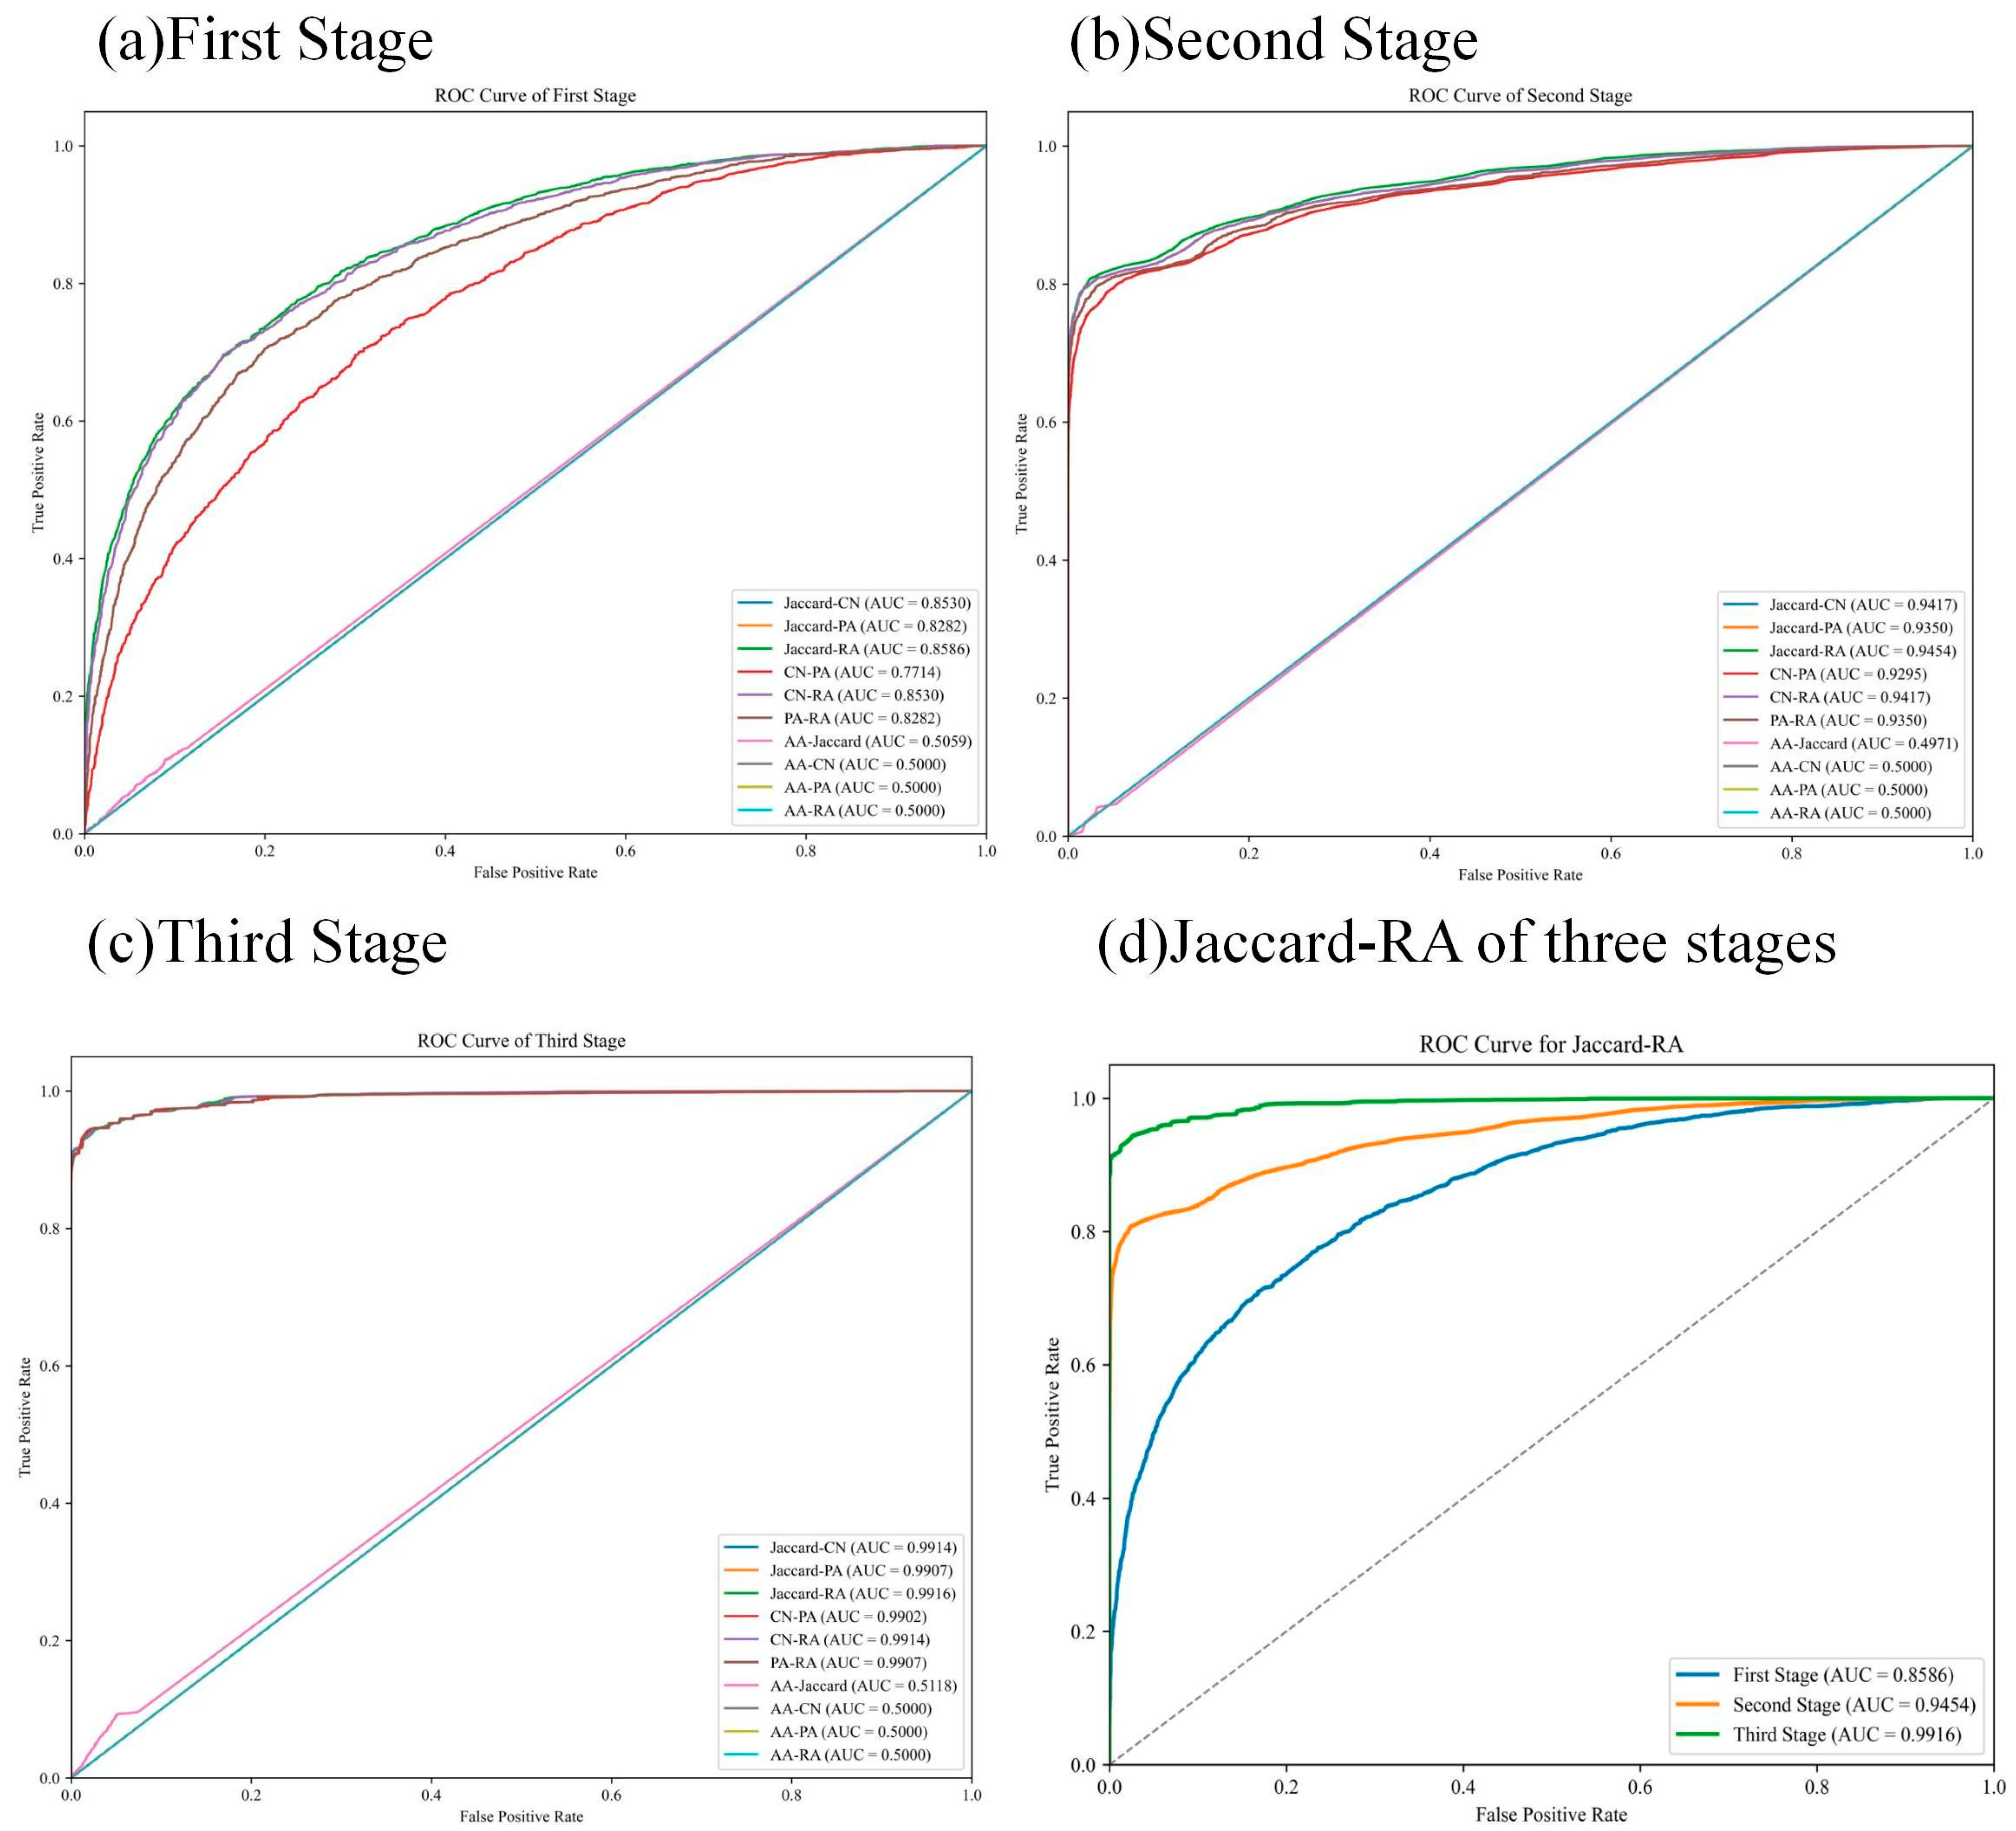
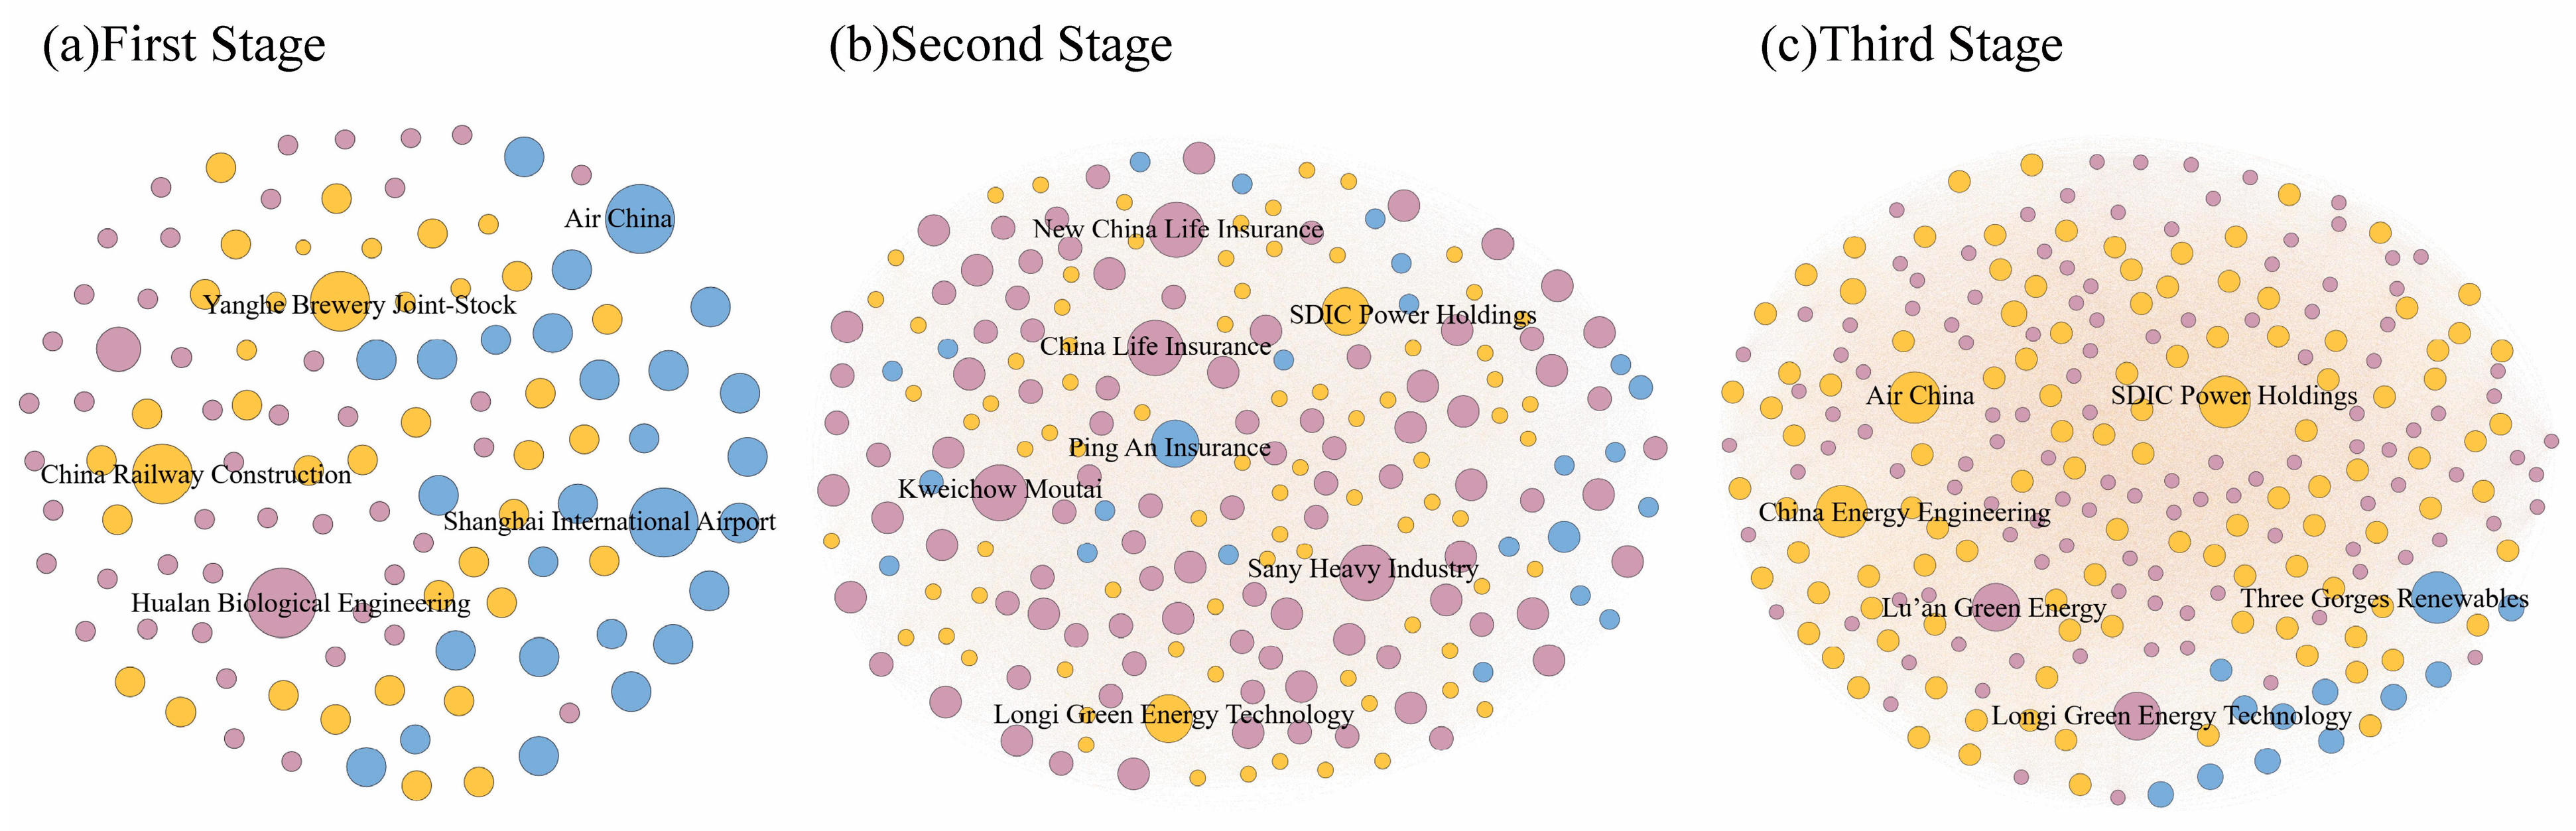
We evaluate the predictive performance of various similarity algorithms—Jaccard, CN, AA, PA, and RA—on stock networks by comparing their AUC (Area Under the Curve) values, as shown in Table 8. We also pair these indicators to assess potential improvements in AUC, with the corresponding ROC curves presented in Figure 8. The Jaccard indicator consistently outperforms others across stages, suggesting its efficacy in predicting node connections within the network. Utilizing the Jaccard-RA indicator, we identify high-similarity node pairs across three stages and analyze the impact of the pandemic on market structure and node interactions, as depicted in Figure 9.
Table 8.
AUC value comparison under 5 indicators.
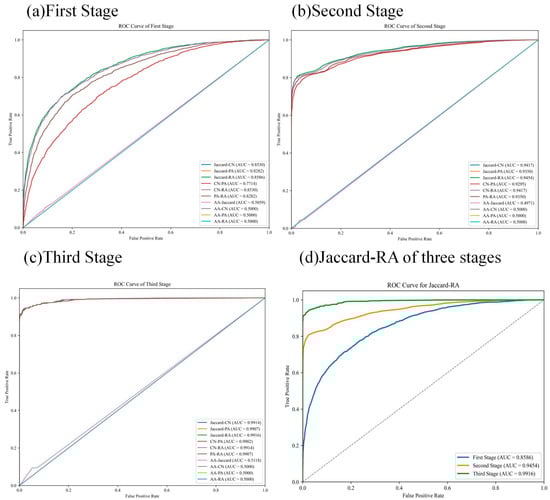
Figure 8.
ROC curves under different algorithms. Note: The dashed line represents the baseline, with ACU=0.5.

Figure 9.
Prediction results of network links in different stages under Jaccard-RA index.
Furthermore, this study compares the actual ranking of the top 20 core stock nodes across three phases with predictive outcomes to analyze trends in network connectivity and market structure evolution, with findings in Table 9. In the actual network data from the first to the third stage, sectors such as real estate, industry, and finance consistently occupy core positions, underscoring their long-term stability and importance in the market. However, the first phase also exhibited discrepancies between forecasts and actual data, which may be attributed to early-stage responses to the pandemic, including market overreaction and regulatory interventions that were still taking shape. The second phase shows notable divergences between forecasts and actual data, especially in the industrial and financial sectors. This may be due to external factors such as reduced market demand and economic uncertainty post-pandemic, which can alter network structure and prediction accuracy. Despite the overall robust performance of the network forecasting capability in the third stage, discrepancies persist between forecasts and actual results. Notably, the business sector identified as a potential key sector in the Stage 3 network forecasts did not align with actual network performance. This underscores the stock market’s resilience post-pandemic relaxation, yet its complexity and uncertainty introduce bias into prediction models when capturing changes in network structure and connectivity.
Table 9.
Industry comparison of the top 20 stocks between actual network and prediction network.
4. Discussion
Under the impact of public health emergencies such as the COVID-19 pandemic, the instability of the stock market not only increases the market risk but also poses a challenge to the smooth operation of the economy. To this end, we put forward the following suggestions:
(1) Enhancing the regulation and guidance of the stock market is essential to mitigate the impact of public health emergencies, such as pandemics, on market stability. Amidst the COVID-19 pandemic, the stock market has faced heightened pressure, with the effects becoming increasingly persistent as the pandemic normalizes [63]. To address this ongoing market challenge, there is an urgent need to bolster the regulatory oversight and strategic direction of the stock market. It is imperative for governments to develop a comprehensive emergency response framework that delineates the roles and responsibilities of regulatory bodies during public health crises. This framework should prioritize information disclosure, transparency, and the promotion of market transparency to fortify market stability and resilience against risks. Regulatory authorities must intensify their vigilance in monitoring market participants, proactively preventing and penalizing instances of market manipulation and insider trading to safeguard a fair and just market environment. Additionally, governments could consider fiscal policies, such as fiscal tightening or loosening, to stabilize the economy, provide stimulus packages to support businesses and individuals, and implement measures to enhance investor confidence during turbulent times.
(2) To bolster the stock market’s structural integrity and enhance its complexity and diversification, it is essential to elevate the market network’s resilience. As financial markets progress, non-financial sector companies and industries are assuming more significant roles within the stock market [64]. Addressing this shift requires a multifaceted approach to foster the robust development of market participants. Key initiatives include improving the quality of listed companies by setting higher standards for listing, refining the delisting mechanism through stricter criteria and more transparent procedures, and fostering a culture of long-term investment by providing incentives for investors to focus on long-term performance rather than short-term gains. These measures are crucial for reinforcing the fundamental strength of market dynamics. These measures are pivotal for strengthening the foundational support of market dynamics. Concurrently, the development of a tiered capital market system is imperative. This system should cater to the varied capital requirements of businesses and the investment inclinations of investors, including platforms such as the SME board, the Growth Enterprise Market (GEM), and the Science and Technology Innovation Board (STIB). These platforms are instrumental in offering a broader array of financing avenues for innovative and burgeoning enterprises. Furthermore, policymakers should contemplate the strategic use of fiscal and tax policies to motivate enterprises in technological innovation and business expansion. Such incentives can help dilute market concentration, augment the market’s overall resilience to risk, and catalyze the comprehensive health and stability of the stock market.
(3) Fostering a sound investment philosophy and elevating risk prevention awareness are crucial in a fluctuating market environment. Investor decisions and behaviors wield considerable influence over market stability [65]. Hence, it is imperative for investors to cultivate an investment philosophy grounded in thorough information and judicious analysis, keeping abreast of the evolving industry landscape. Moreover, investors should eschew the herd mentality and speculative inclinations, adopting instead a posture of prudence and caution. They must devise investment strategies that align with individual financial circumstances, investment goals, and risk profiles. During the investment process, it is essential to view market volatility and risks with a rational perspective, and to conduct timely evaluations and adjustments to the investment portfolio. Adopting suitable risk management strategies, such as diversification of assets, prudent leverage control, and setting stop-loss orders, can help investors adapt to the new market environment. These measures are designed to safeguard the investment principal and curtail potential financial losses effectively.
5. Conclusions
This paper takes the closing price of the Shanghai and Shenzhen 300 Index as the research object. Based on the Pearson correlation coefficient matrix, the network of three stages before, during, and after the outbreak of the pandemic is constructed respectively. From the perspective of network structure, the node attributes and dynamic evolution characteristics are described, and the network stability is explored. At the same time, based on the Jaccard-RA algorithm, the possible key nodes in the future are identified and analyzed. The main conclusions are as follows:
(1) The network structure across all three stages exhibits a trend of increasing number of participants and gradual outward expansion of the network’s scale. The interconnections among constituent nodes are becoming increasingly dense, indicative of a network that is evolving towards greater complexity and diversification. This morphological shift reflects an intensification of interactions among market participants, with the overall interconnectedness of the market demonstrating a sustained upward trend. Financial institutions such as Guotai Junan Securities, Ping An Bank, China CITIC Bank, and GF Securities continue to play a significant and dominant role in the network. Meanwhile, the importance of non-financial sectors, including China State Construction Engineering, Kweichow Moutai, and Yunnan Baiyao, has also gradually increased.
(2) Regarding the characteristics of network structure, the CSI 300 stock network demonstrates intricate and dynamic evolutionary traits. As the diversification of intermediary and supervisory capabilities among stock nodes intensifies, there emerges a notable disparity in the intermediary capacities of node members. This divergence highlights the presence of core nodes that exert a more pronounced control over the network’s overall architecture. The financial sector, with a particular emphasis on the banking industry, maintains a central role within the CSI 300 stock network. Meanwhile, sectors such as insurance and consumer goods also manifest an amplified influence at particular junctures. These fluctuations underscore the sectoral interplay and the evolving landscape of market influence. Furthermore, the vulnerability of the market network is observed to diminish over time, with the network’s structure exhibiting enhanced stability. The power-law distribution observed indicates a concentration of market influence within a select few nodes. This concentration not only reflects the market’s hierarchical structure but also mirrors its adaptive capacity in response to the economic environment.
(3) The resilience of the stock-associated network across all three stages was found to be relatively weak. When subjected to random attacks, the network demonstrated a greater degree of robustness compared to deliberate attacks. The departure of non-critical nodes under random attacks is less disruptive to the network’s integrity; the overall structure remains largely intact, thereby revealing an inherent level of resilience within the network. In contrast, deliberate attacks targeting key nodes have a profound impact on the network’s stability. The exit of these pivotal nodes leads to a significant increase in network vulnerability, severely undermining its connectivity and operational efficiency. This underscores the critical role that key stocks play in preserving the stability of the network. The susceptibility of the network to targeted attacks highlights the need for a more resilient network architecture and the importance of safeguarding influential stocks against potential disruptions.
(4) Utilizing the Jaccard-RA algorithm, we further examine the three-stage network to identify node pairs with high similarity. The findings indicate an upward trend in the number of nodes and potential future connecting edges from the first to the third stage within the framework of possible future connections. This suggests that the network’s structure is evolving towards a more interconnected and tightly knit configuration. However, there are discernible differences in the potential core nodes across various stages, reflecting the dynamic nature of the network’s composition. Before the outbreak, sectors such as consumer goods and tourism exerted significant influence within the network. As the outbreak unfolded, the focus shifted towards the finance and insurance sectors, along with infrastructure, which garnered increased attention. Post-outbreak, with the liberalization stage, sectors like transportation, energy, and construction emerged as pivotal to the market’s recovery. These shifts underscore the evolving roles of different sectors in response to the changing economic landscape and the network’s adaptive capacity to realign its core components in the face of new challenges.
Author Contributions
Conceptualization, X.L.; methodology, D.W.; software, D.W.; writing—original draft preparation, X.L.; writing—review and editing, J.Y. All authors have read and agreed to the published version of the manuscript.
Funding
This research was supported by the MOE (Ministry of Education in China) Liberal Arts and Social Sciences Foundation (Grant No. 19YJCZH228) and graduate-level project at Guizhou University of Finance and Economics (Grant No. 2022ZXSY006).
Data Availability Statement
The data used to support the findings of this study are available from the corresponding author upon request.
Acknowledgments
The authors would like to thank the teachers and students at Guizhou University of Finance and Economics for their help in collecting the data needed for this study and revising the manuscript. At the same time, the authors would also like to thank the respected editor and reviewer for their support.
Conflicts of Interest
The authors declare no conflicts of interest.
References
- Dumiter, F.C.; Turcaș, F.; Nicoară, Ș.A.; Bențe, C.; Boiță, M. The Impact of Sentiment Indices on the Stock Exchange—The Connections between Quantitative Sentiment Indicators, Technical Analysis, and Stock Market. Mathematics 2023, 11, 3128. [Google Scholar] [CrossRef]
- Tang, C.; Liu, X.; Yang, G. A study of financial market resilience in China—From a hot money shock perspective. Pac.-Basin Financ. J. 2024, 83, 102256. [Google Scholar] [CrossRef]
- Yu, X.L.; Xiao, K.T. COVID-19 Government restriction policy, COVID-19 vaccination and stock markets: Evidence from a global perspective. Financ. Res. Lett. 2023, 53, 103669. [Google Scholar] [CrossRef] [PubMed]
- Kanamura, T. An impact assessment of the COVID-19 pandemic on Japanese and US hotel stocks. Financ. Innov. 2023, 9, 1–51. [Google Scholar] [CrossRef]
- Mazzoleni, S.; Turchetti, G.; Ambrosino, N. The COVID-19 outbreak: From “black swan” to global challenges and opportunities. Pulmonology 2020, 26, 117–118. [Google Scholar] [CrossRef] [PubMed]
- Zhou, Y. Is the Stock Market a Reliable Indicator of the National Economy?—Empirical Analysis According to Chinese Data. Adv. Econ. Manag. Political Sci. 2023, 20, 81–88. [Google Scholar] [CrossRef]
- Wu, G.S.; Yang, B.X.; Zhao, N.R. Herding Behavior in Chinese Stock Markets during COVID-19. Emerg. Mark. Financ. Trade 2020, 56, 3578–3587. [Google Scholar] [CrossRef]
- Nguyen, H.M.; Bakry, W.; Vuong, T.H.G. COVID-19 pandemic and herd behavior: Evidence from a frontier market. J. Behav. Exp. Financ. 2023, 38, 100807. [Google Scholar] [CrossRef] [PubMed]
- Li, W.; Chien, F.; Waqas Kamran, H.; Aldeehani, T.M.; Sadiq, M.; Nguyen, V.C.; Taghizadeh-Hesary, F. The nexus between COVID-19 fear and stock market volatility. Econ. Res.-Ekon. Istraživanja 2022, 35, 1765–1785. [Google Scholar] [CrossRef]
- Yiming, W.; Xun, L.; Umair, M.; Aizhan, A. COVID-19 and the transformation of emerging economies: Financialization, green bonds, and stock market volatility. Resour. Policy 2024, 92, 104963. [Google Scholar] [CrossRef]
- Fang, Y.; Shao, Z.; Zhao, Y. Risk spillovers in global financial markets: Evidence from the COVID-19 crisis. Int. Rev. Econ. Financ. 2023, 83, 821–840. [Google Scholar] [CrossRef]
- Zhang, D.; Hu, M.; Ji, Q. Financial markets under the global pandemic of COVID-19. Financ. Res. Lett. 2020, 36, 101528. [Google Scholar] [CrossRef] [PubMed]
- Bai, C.; Duan, Y.; Fan, X.; Tang, S. Financial market sentiment and stock return during the COVID-19 pandemic. Financ. Res. Lett. 2023, 54, 103709. [Google Scholar] [CrossRef]
- O’Donnell, N.; Shannon, D.; Sheehan, B. The impact of monetary policy interventions on banking sector stocks: An empirical investigation of the COVID-19 crisis. Financ. Innov. 2024, 10, 44. [Google Scholar] [CrossRef]
- Ausloos, M.; Zhang, Y.; Dhesi, G. Stock index futures trading impact on spot price volatility. The CSI 300 studied with a TGARCH model. Expert Syst. Appl. 2020, 160, 113688. [Google Scholar] [CrossRef]
- Zhou, W.; Rao, W.; Lu, S. Market stability analysis after the circuit breaker for the CSI 300 energy index. Financ. Res. Lett. 2020, 34, 101348. [Google Scholar] [CrossRef]
- Wan, X.-l.; Zhang, Z.; Zhang, C.; Meng, Q. Stock Market Temporal Complex Networks Construction, Robustness Analysis and Systematic Risk Identification: A Case of CSI 300 Index. Complexity 2020, 2020, 19. [Google Scholar] [CrossRef]
- Sayed, O.A.; Eledum, H. The short-run response of Saudi Arabia stock market to the outbreak of COVID-19 pandemic: An event-study methodology. Int. J. Financ. Econ. 2023, 28, 2367–2381. [Google Scholar] [CrossRef]
- Marta, W. The impact of the coronavirus (COVID-19) pandemic on investors’ behaviour in the light of behavioural finance. Zesz. Nauk. Szkoły Głównej Gospod. Wiej. W Warszawie 2022, 27, 111–122. [Google Scholar] [CrossRef]
- Yousaf, I.; Patel, R.; Yarovaya, L. The reaction of G20+stock markets to the Russia-Ukraine conflict “black-swan” event: Evidence from event study approach. J. Behav. Exp. Financ. 2022, 35, 100723. [Google Scholar] [CrossRef]
- Yang, X.; Wen, S.; Liu, Z.; Li, C.; Huang, C. Dynamic Properties of Foreign Exchange Complex Network. Mathematics 2019, 7, 832. [Google Scholar] [CrossRef]
- Szczygielski, J.J.; Charteris, A.; Bwanya, P.R.; Brzeszczynski, J. Which COVID-19 information really impacts stock markets? J. Int. Financ. Mark. Inst. Money 2023, 84, 101592. [Google Scholar] [CrossRef]
- Khalfaoui, R.; Mefteh-Wali, S.; Viviani, J.L.; Ben Jabeur, S.; Abedin, M.Z.; Lucey, B.M. How do climate risk and clean energy spillovers, and uncertainty affect US stock markets? Technol. Forecast. Soc. Change 2022, 185, 122083. [Google Scholar] [CrossRef]
- Yang, T.; Yu, T.R.; Zhao, H. Uncovering the relationship between incidental emotion toward a disaster and stock market fluctuations: Evidence from the US market. Decis. Support Syst. 2024, 181, 114213. [Google Scholar] [CrossRef]
- Kumar, A.; Singh, S.S.; Singh, K.; Biswas, B. Link prediction techniques, applications, and performance: A survey. Phys. A Stat. Mech. Its Appl. 2020, 553, 124289. [Google Scholar] [CrossRef]
- Apergis, N.; Lau, C.K.; Xu, B. The impact of COVID-19 on stock market liquidity: Fresh evidence on listed Chinese firms. Int. Rev. Financ. Anal. 2023, 90, 102847. [Google Scholar] [CrossRef]
- Razmi, S.F.; Razmi, S.M.J. The role of stock markets in the US, Europe, and China on oil prices before and after the COVID-19 announcement. Resour. Policy 2023, 81, 103386. [Google Scholar] [CrossRef]
- Yang, M.-Y.; Wu, Z.-G.; Wu, X.; Li, S.-P. Influential risk spreaders and systemic risk in Chinese financial networks. Emerg. Mark. Rev. 2024, 60, 101138. [Google Scholar] [CrossRef]
- Okorie, D.I.; Lin, B.Q. Stock markets and the COVID-19 fractal contagion effects. Financ. Res. Lett. 2021, 38, 101640. [Google Scholar] [CrossRef]
- Liu, Y.T.; Wei, Y.; Wang, Q.; Liu, Y. International stock market risk contagion during the COVID-19 pandemic. Financ. Res. Lett. 2022, 45, 102145. [Google Scholar] [CrossRef]
- Dhingra, B.; Batra, S.; Aggarwal, V.; Yadav, M.; Kumar, P. Stock market volatility: A systematic review. J. Model. Manag. 2024, 19, 925–952. [Google Scholar] [CrossRef]
- Wen, F.; Yang, X.; Zhou, W.X. Tail dependence networks of global stock markets. Int. J. Financ. Econ. 2018, 24, 558–567. [Google Scholar] [CrossRef]
- Zhou, Y.; Chen, Z.; Liu, Z. Dynamic analysis and community recognition of stock price based on a complex network perspective. Expert Syst. Appl. 2023, 213, 118944. [Google Scholar] [CrossRef]
- Mantegna, R.N. Hierarchical structure in financial markets. Eur. Phys. J. B—Condens. Matter Complex Syst. 1998, 11, 193–197. [Google Scholar] [CrossRef]
- Roy, R.B.; Sarkar, U. Identifying influential stock indices from global stock markets: A social network analysis approach. Procedia Comput. Sci. 2011, 5, 442–449. [Google Scholar] [CrossRef]
- Abuzayed, B.; Bouri, E.; Al-Fayoumi, N.; Jalkh, N. Systemic risk spillover across global and country stock markets during the COVID-19 pandemic. Econ. Anal. Policy 2021, 71, 180–197. [Google Scholar] [CrossRef]
- Zou, R.; Zhang, S.; Hao, C. Co-Jumps in the Chinese Stock Market Before, During and after the COVID-19 Pandemic: A Network Perspective; Elsevier: Amsterdam, The Netherlands, 2024. [Google Scholar]
- Huang, W.; Wang, H.; Wei, Y.; Chevallier, J. Complex network analysis of global stock market co-movement during the COVID-19 pandemic based on intraday open-high-low-close data. Financ. Innov. 2024, 10, 7. [Google Scholar] [CrossRef]
- Cai, L.; Li, J.D.; Wang, J.; Ji, S.W. Line Graph Neural Networks for Link Prediction. IEEE Trans. Pattern Anal. Mach. Intell. 2022, 44, 5103–5113. [Google Scholar] [CrossRef] [PubMed]
- Martínez, V.; Berzal, F.; Cubero, J.C. A Survey of Link Prediction in Complex Networks. ACM Comput. Surv. 2017, 49, 1–33. [Google Scholar] [CrossRef]
- Sakawa, H.; Watanabel, N. The impact of the COVID-19 outbreak on Japanese shipping industry: An event study approach. Transp. Policy 2023, 130, 130–140. [Google Scholar] [CrossRef]
- Zaheer, K.; Aslam, F.; Tariq Mohmand, Y.; Ferreira, P. Temporal changes in global stock markets during COVID-19: An analysis of dynamic networks. China Financ. Rev. Int. 2023, 13, 23–45. [Google Scholar] [CrossRef]
- Sahiner, M. Volatility Spillovers and Contagion During Major Crises: An Early Warning Approach Based on a Deep Learning Model. Comput. Econ. 2023, 63, 2435–2499. [Google Scholar] [CrossRef]
- Aslam, F.; Mohmand, Y.T.; Ferreira, P.; Memon, B.A.; Khan, M.; Khan, M. Network analysis of global stock markets at the beginning of the coronavirus disease (COVID-19) outbreak. Borsa Istanb. Rev. 2020, 20, S49–S61. [Google Scholar] [CrossRef]
- Lai, Y.; Hu, Y. A study of systemic risk of global stock markets under COVID-19 based on complex financial networks. Phys. A Stat. Mech. Its Appl. 2021, 566, 125613. [Google Scholar] [CrossRef]
- Bastidon, C.; Parent, A. Cliometrics of world stock markets evolving networks. Ann. Oper. Res. 2024, 332, 23–53. [Google Scholar] [CrossRef]
- Qiu, L.; Su, R.; Wang, Z. Financial crisis prediction based on multilayer supervised network analysis. Front. Phys. 2022, 10, 1048934. [Google Scholar] [CrossRef]
- Zhang, B.; Yin, J.; Jiang, H.T.; Qiu, Y.H. Application of Social Network Analysis in the Economic Connection of Urban Agglomerations Based on Nighttime Lights Remote Sensing: A Case Study in the New Western Land-Sea Corridor, China. ISPRS Int. J. Geo-Inf. 2022, 11, 522. [Google Scholar] [CrossRef]
- Jiang, H.; Yin, J.; Wei, D.; Luo, X.; Ding, Y.; Xia, R. Industrial carbon emission efficiency prediction and carbon emission reduction strategies based on multi-objective particle swarm optimization-backpropagation: A perspective from regional clustering. Sci. Total Environ. 2024, 906, 167692. [Google Scholar] [CrossRef]
- Luo, X.Y.; Yin, J.; Jiang, H.T.; Wei, D.Q.; Xia, R.C.; Ding, Y. Venture Capital Syndication Network Structure of Public Companies: Robustness and Dynamic Evolution, China. Systems 2023, 11, 302. [Google Scholar] [CrossRef]
- Zhang, B.; Yin, J.; Jiang, H.; Chen, S.; Ding, Y.; Xia, R.; Wei, D.; Luo, X. Multi-source data assessment and multi-factor analysis of urban carbon emissions: A case study of the Pearl River Basin, China. Urban Clim. 2023, 51, 101653. [Google Scholar] [CrossRef]
- Zhang, Q.; Deng, R.; Ding, K.; Li, M. Structural analysis and the sum of nodes’ betweenness centrality in complex networks. Chaos Solitons Fractals 2024, 185, 115158. [Google Scholar] [CrossRef]
- Nakajima, K.; Shudo, K. Measurement error of network clustering coefficients under randomly missing nodes. Sci. Rep. 2021, 11, 2815. [Google Scholar] [CrossRef] [PubMed]
- Gao, Y.-L.; Chen, S.-M.; Nie, S.; Ma, F.; Guan, J.-J. Robustness analysis of interdependent networks under multiple-attacking strategies. Phys. A Stat. Mech. Its Appl. 2018, 496, 495–504. [Google Scholar] [CrossRef]
- Lü, L.Y.; Pan, L.M.; Zhou, T.; Zhang, Y.C.; Stanley, H.E. Toward link predictability of complex networks. Proc. Natl. Acad. Sci. USA 2015, 112, 2325–2330. [Google Scholar] [CrossRef] [PubMed]
- Liu, X.; Chen, Z.; Chen, Z.; Yao, Y. The time-varying spillover effect of China’s stock market during the COVID-19 pandemic. Phys. A Stat. Mech. Its Appl. 2022, 603, 127821. [Google Scholar] [CrossRef] [PubMed]
- James, N.; Menzies, M.; Gottwald, G.A. On financial market correlation structures and diversification benefits across and within equity sectors. Phys. A Stat. Mech. Its Appl. 2022, 604, 127682. [Google Scholar] [CrossRef]
- Newman, M.E. Assortative mixing in networks. Phys. Rev. Lett. 2002, 89, 208701. [Google Scholar] [CrossRef] [PubMed]
- Guo, Z. Analysis on Financial Statements of Kweichow Moutai Co., Ltd. In Proceedings of the 2021 3rd International Conference on Economic Management and Cultural Industry (ICEMCI 2021), Guangzhou, China, 22–24 October 2021. [Google Scholar]
- Licciardi, A.N., Jr.; Monteiro, L.H.A. A network model of social contacts with small-world and scale-free features, tunable connectivity, and geographic restrictions. Math. Biosci. Eng. 2024, 21, 4801–4813. [Google Scholar] [CrossRef] [PubMed]
- Niebuhr, B.B.; Van Moorter, B.; Stien, A.; Tveraa, T.; Strand, O.; Langeland, K.; Sandström, P.; Alam, M.; Skarin, A.; Panzacchi, M. Estimating the cumulative impact and zone of influence of anthropogenic features on biodiversity. Methods Ecol. Evol. 2023, 14, 2362–2375. [Google Scholar] [CrossRef]
- Ma, J.; Zhao, P.; Li, M.; Niu, J. The evolution of global soybean trade network pattern based on complex network. Appl. Econ. 2024, 56, 3133–3149. [Google Scholar] [CrossRef]
- Najaf, K.; Chin, A. The impact of the China Stock market on global financial markets during COVID-19. Int. J. Public Sect. Perform. Manag. 2024, 13, 100–114. [Google Scholar] [CrossRef]
- Mustafa, S.; Saeed, A.; Zafar, A. The effect of financial leverage and market size on stock returns on the Karachi stock exchange: Evidence from selected stocks in the non-financial sector of Pakistan. Int. J. Bus. Manag. 2017, 5, 246–252. [Google Scholar]
- Ben Ameur, H.; Ftiti, Z.; Louhichi, W.; Prigent, J.-L. Financial crisis and investor behavior. J. Econ. Behav. Organ. 2024, 223, 307–310. [Google Scholar] [CrossRef]

Disclaimer/Publisher’s Note: The statements, opinions and data contained in all publications are solely those of the individual author(s) and contributor(s) and not of MDPI and/or the editor(s). MDPI and/or the editor(s) disclaim responsibility for any injury to people or property resulting from any ideas, methods, instructions or products referred to in the content. |
© 2024 by the authors. Licensee MDPI, Basel, Switzerland. This article is an open access article distributed under the terms and conditions of the Creative Commons Attribution (CC BY) license (https://creativecommons.org/licenses/by/4.0/).