
The Impact of the Digital Economy on Carbon Emissions Based on Regional Development Imbalance


Abstract
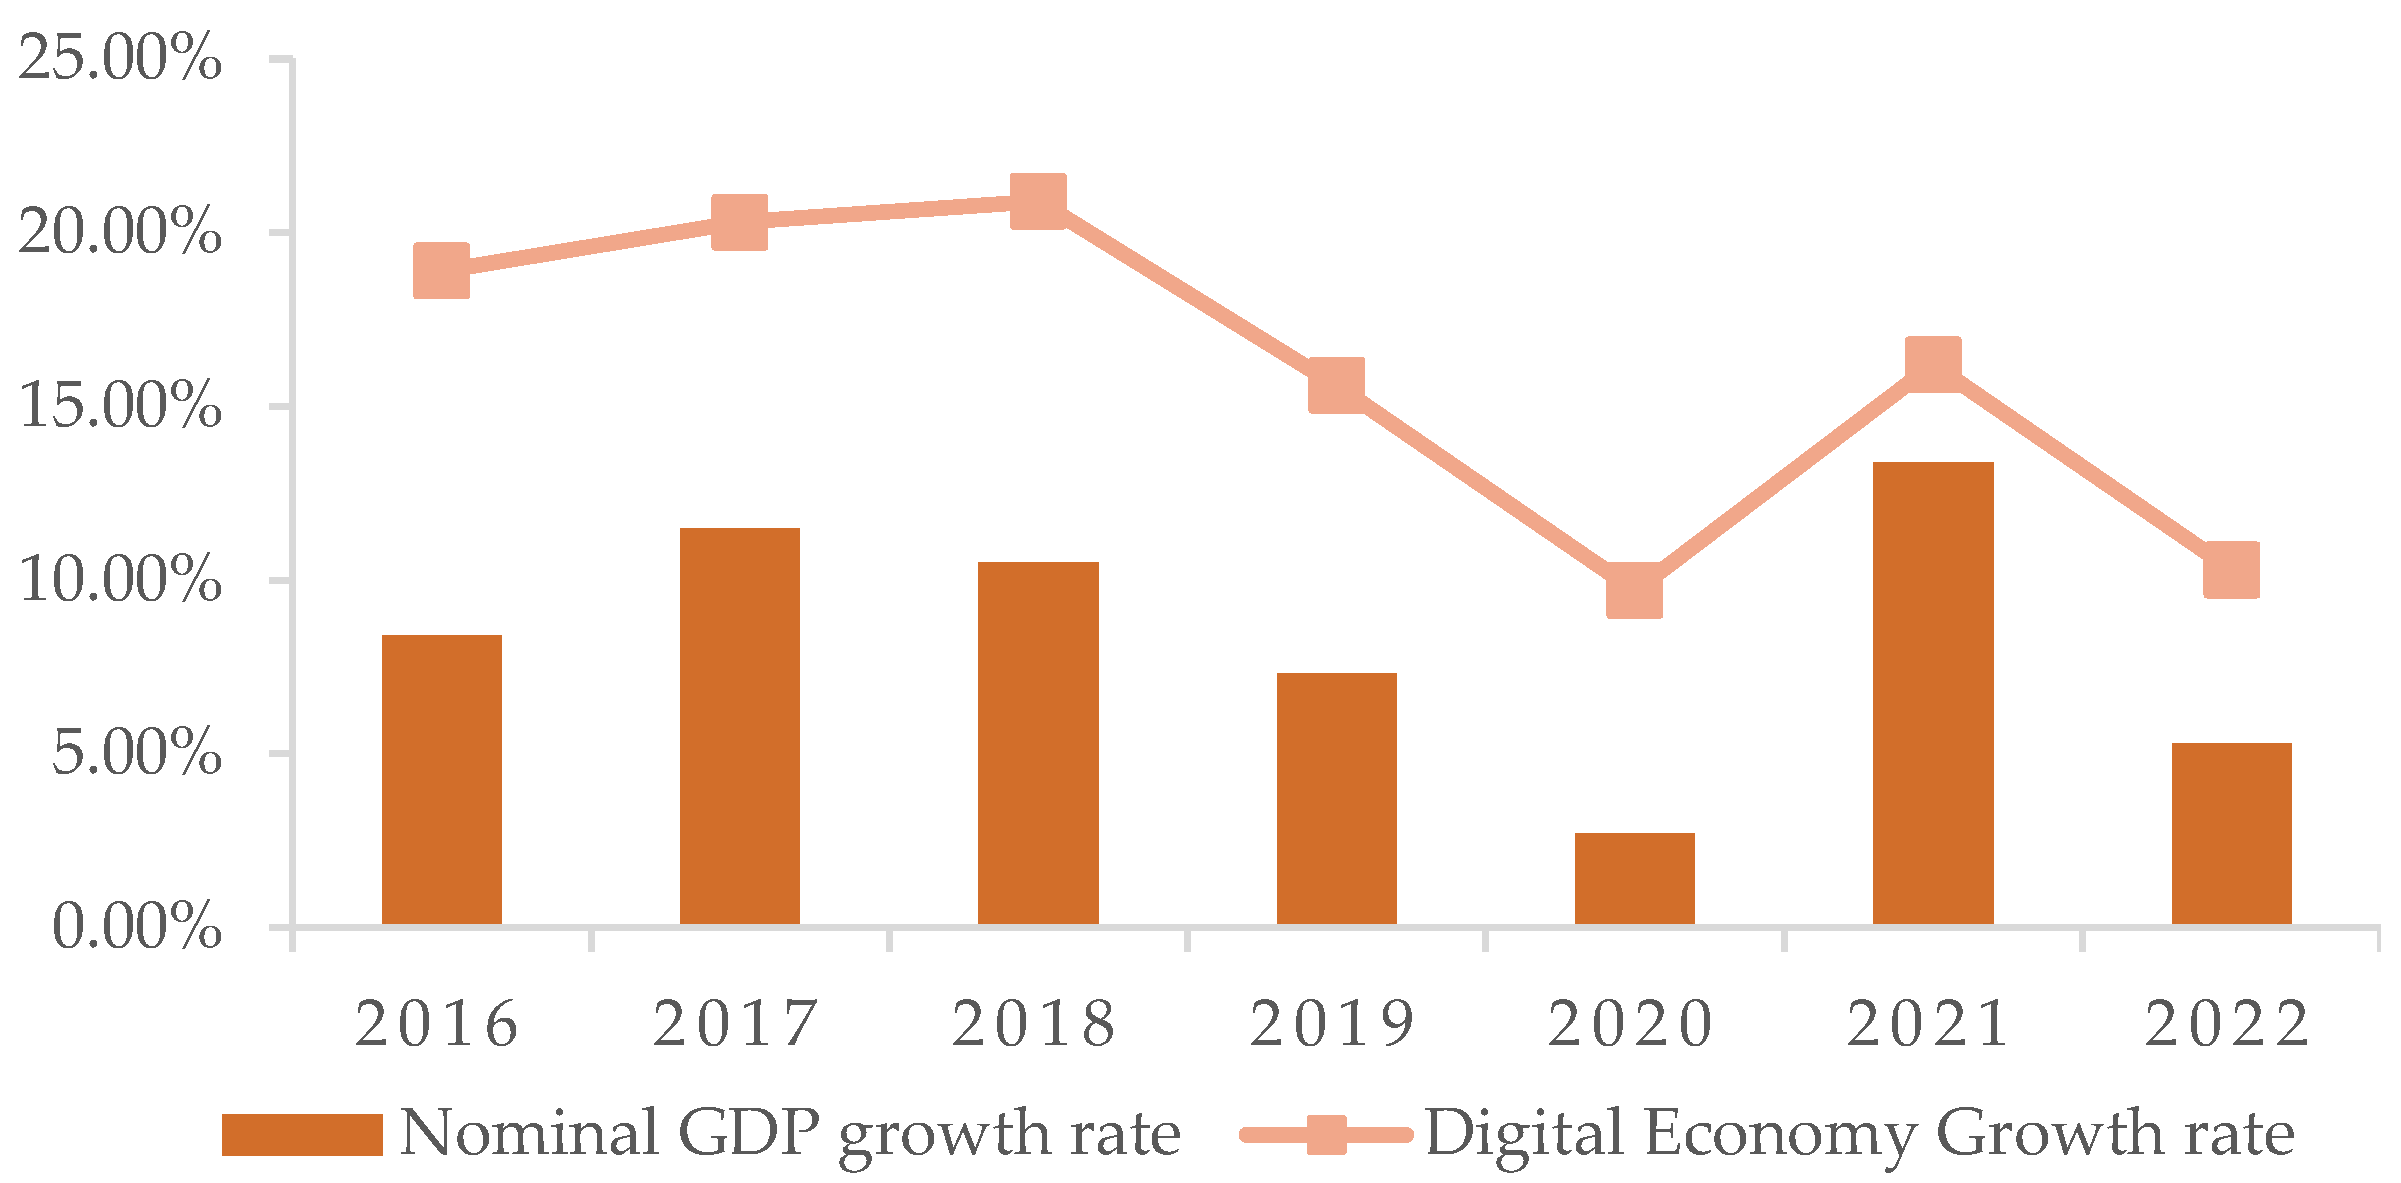
1. Introduction
2. Literature Review and Research Hypothesis
2.1. Digital Economy and Dual Control of Carbon Emission
2.2. Digital Economy, Environmental Regulation, and Dual Control of Carbon
2.3. Digital Economy, R&D Intensity, and Dual Control of Carbon
2.4. Hypotheses Related to Heterogeneity
2.4.1. Regional Imbalances in the Impact of Digital Economy on Carbon Emissions
2.4.2. Differences in the Impact of Digital Economy Segmented Metrics on Carbon Emissions
2.4.3. Heterogeneity Analysis Based on Property Ownership Characteristics
3. Methodology and Data
3.1. Variables Selection and Measurement
3.1.1. Explained Variables
3.1.2. Core Explanatory Variable
3.1.3. Mediating Variable
3.1.4. Moderating Variable
3.1.5. Control Variables
3.2. Data Sources
3.3. Empirical Model Construction
3.3.1. Baseline Econometric Model
3.3.2. Mediating Effects Model
3.3.3. Moderating Effects Model
4. Empirical Results
4.1. Baseline Regression Result
4.1.1. Digital Economy and Total Carbon Emissions
4.1.2. Digital Economy and Carbon Emission Intensity
4.2. Mediating Effects of Environmental Regulation Stringency
4.3. Mediating Effects of R&D Intensity
4.4. Robustness Test and Endogeneity Treatment
4.4.1. Replacing Explained Variables
4.4.2. Excluding Municipality Samples
4.4.3. Adding Control Variables
4.4.4. Endogeneity Treatment
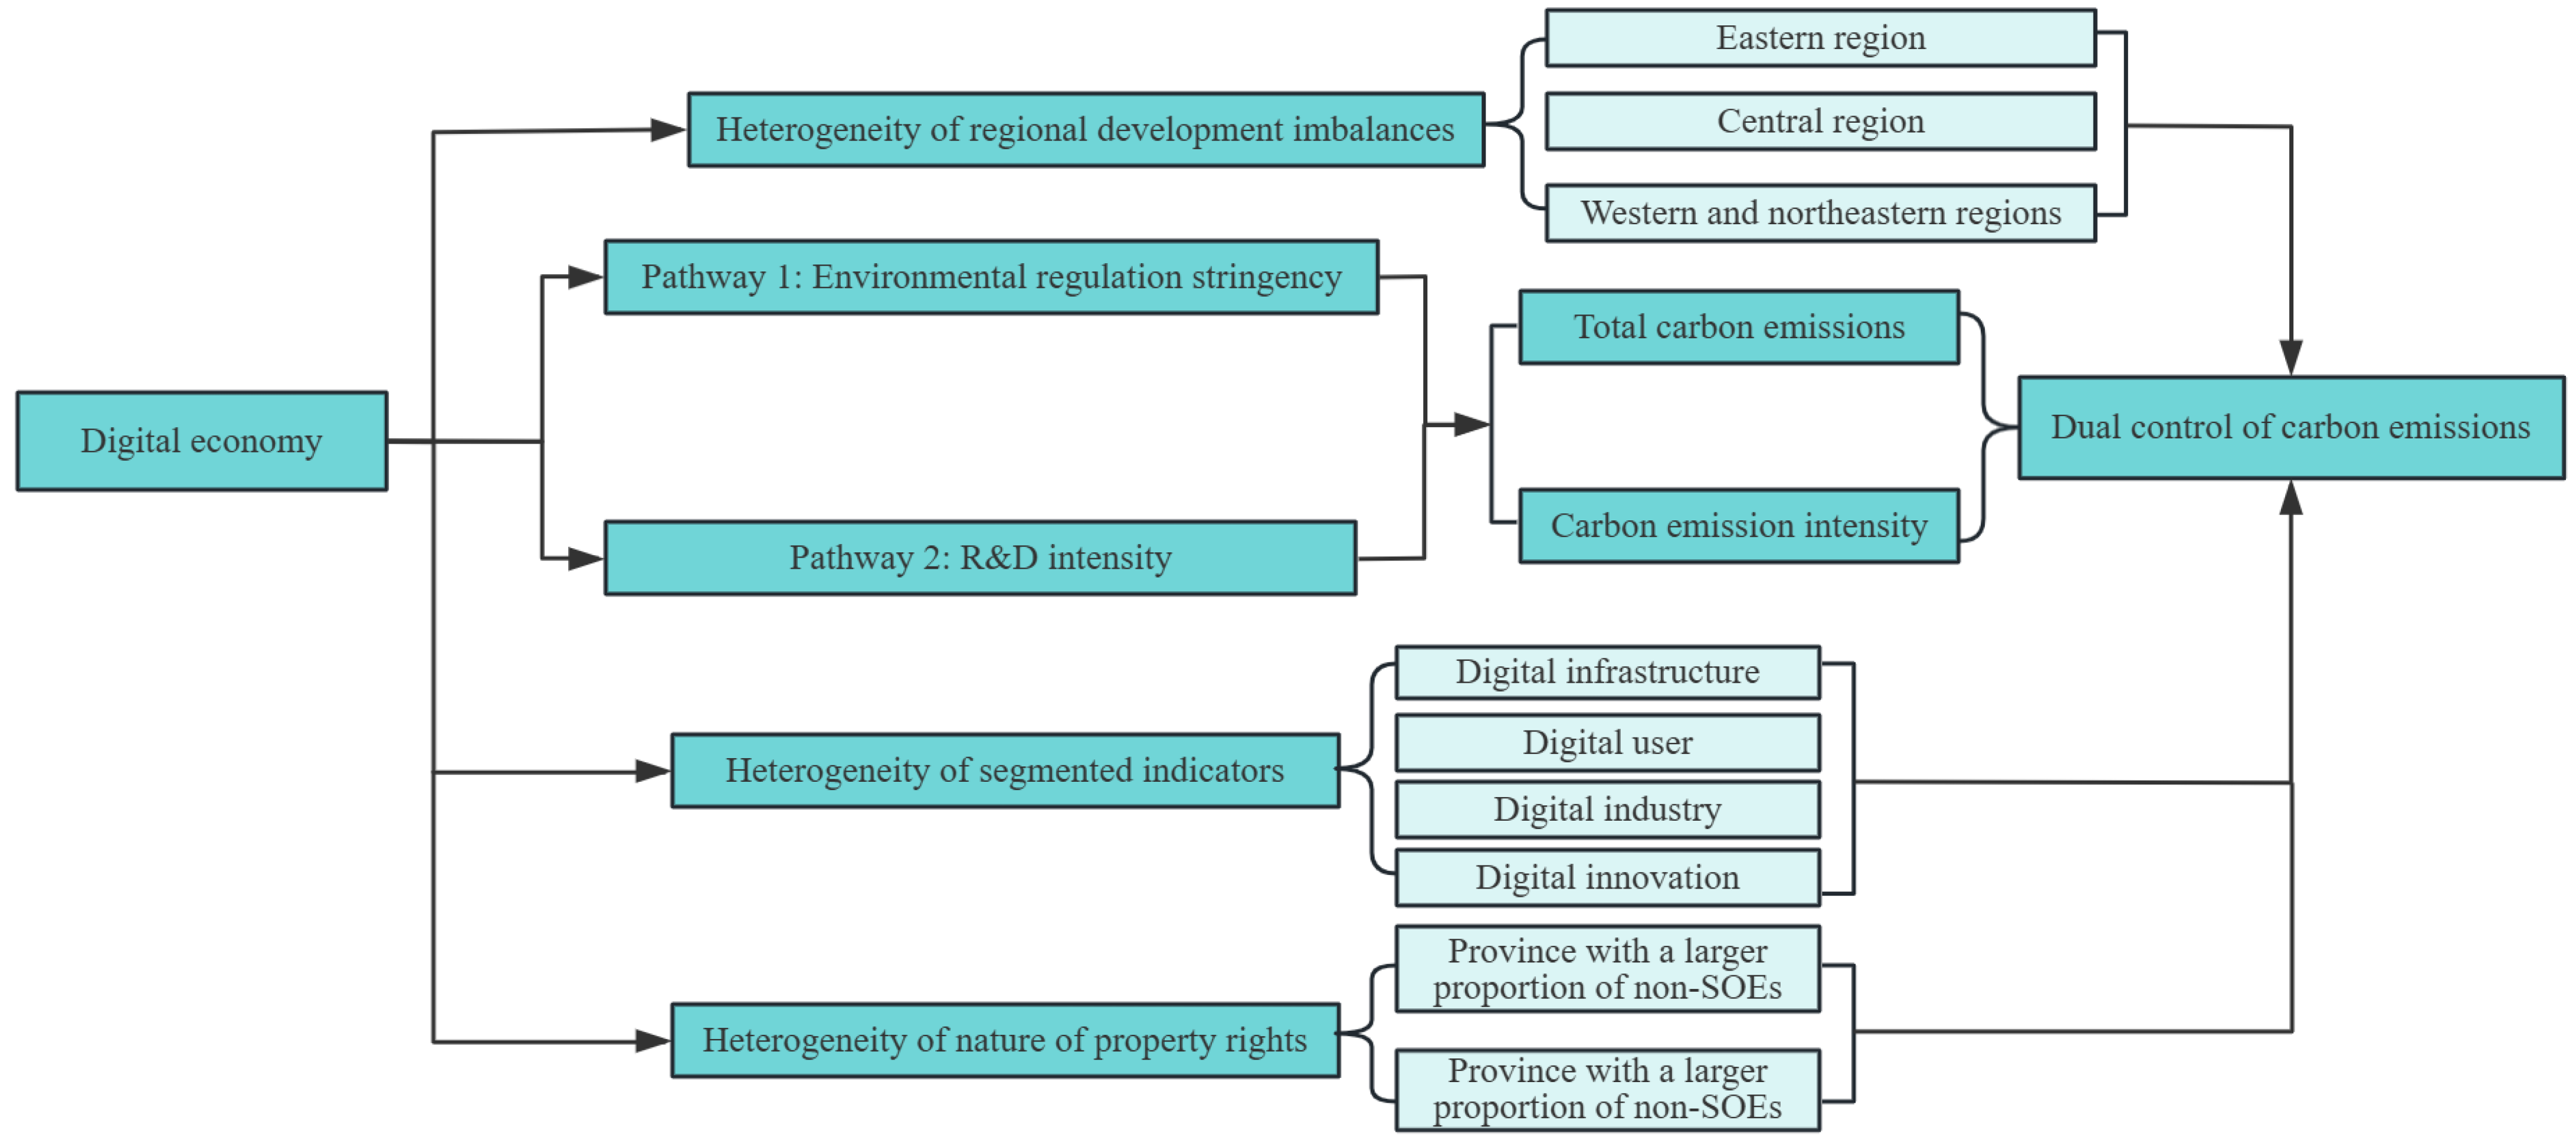
5. Further Analysis
5.1. Heterogeneity Analysis Based on Different Economic Regions
5.2. Heterogeneity Analysis Based on Segmented Indicators of Digital Economy
5.3. Heterogeneity Analysis Based on Property Ownership Characteristics
6. Conclusions and Policy Implications
6.1. Conclusions
6.2. Policy Implications
6.3. Research Deficiencies and Prospects
Author Contributions
Funding
Institutional Review Board Statement
Informed Consent Statement
Data Availability Statement
Conflicts of Interest
References
- Ciarli, T.; Kenney, M.; Massini, S.; Piscitello, L. Digital technologies, innovation, and skills: Emerging trajectories and challenges. Res. Policy 2021, 50, 104289. [Google Scholar] [CrossRef]
- Ma, D.; Zhu, Q. Innovation in emerging economies: Research on the digital economy driving high-quality green development. J. Bus. Res. 2022, 145, 801–813. [Google Scholar] [CrossRef]
- Zhang, R.; Li, Z.; Xiao, C.; You, J. New engines of economic growth: How digital currencies lead the way to growth in the era of digital economy. Econ. Anal. Policy 2023, 80, 1597–1617. [Google Scholar] [CrossRef]
- Yu, Z.; Liu, S.; Li, S. Research on the spatial effect of digital economy development on urban carbon reduction. J. Environ. Manag. 2024, 357, 120764. [Google Scholar] [CrossRef]
- Fan, J.; Wan, W.; Yuan, X.; Ranaei, F. Evolution trends and structural decomposition of China’s green value-added over 40 years of reform and opening-up. Chin. J. Popul. Resour. Environ. 2020, 18, 69–78. [Google Scholar] [CrossRef]
- Song, X.; Zhou, Y.; Jia, W. How do Economic Openness and R&D Investment Affect Green Economic Growth?—Evidence from China. Resour. Conserv. Recycl. 2019, 146, 405–415. [Google Scholar] [CrossRef]
- Du, M.; Wu, F.; Ye, D.; Zhao, Y.; Liao, L. Exploring the effects of energy quota trading policy on carbon emission efficiency: Quasi-experimental evidence from China. Energy Econ. 2023, 124, 106791. [Google Scholar] [CrossRef]
- Nordhaus, W. Can We Control Carbon Dioxide? (From 1975). Am. Econ. Rev. 2019, 109, 2015–2035. [Google Scholar] [CrossRef]
- Hao, Y.; Li, Y.; Guo, Y.; Chai, J.; Yang, C.; Wu, H. Digitalization and electricity consumption: Does internet development contribute to the reduction in electricity intensity in China? Energy Policy 2022, 164, 112912. [Google Scholar] [CrossRef]
- Lyu, Y.; Peng, Y.; Liu, H.; Hwang, J.-J. Impact of Digital Economy on the Provision Efficiency for Public Health Services: Empirical Study of 31 Provinces in China. Int. J. Environ. Res. Public Health 2022, 19, 5978. [Google Scholar] [CrossRef]
- Zhang, W.; Liu, X.; Wang, D.; Zhou, J. Digital economy and carbon emission performance: Evidence at China’s city level. Energy Policy 2022, 165, 112927. [Google Scholar] [CrossRef]
- Williams, E. Environmental effects of information and communications technologies. Nature 2011, 479, 354–358. [Google Scholar] [CrossRef]
- Avom, D.; Nkengfack, H.; Fotio, H.K.; Totouom, A. ICT and environmental quality in Sub-Saharan Africa: Effects and transmission channels. Technol. Forecast. Soc. Chang. 2020, 155, 120028. [Google Scholar] [CrossRef]
- Feng, X.; Zhao, Y.; Yan, R. Does carbon emission trading policy has emission reduction effect?—An empirical study based on quasi-natural experiment method. J. Environ. Manag. 2024, 351, 119791. [Google Scholar] [CrossRef]
- Shapiro, J.S. The Environmental Bias of Trade Policy. Q. J. Econ. 2021, 136, 831–886. [Google Scholar] [CrossRef]
- Zhang, C.; Fang, J.; Ge, S.; Sun, G. Research on the impact of enterprise digital transformation on carbon emissions in the manufacturing industry. Int. Rev. Econ. Financ. 2024, 92, 211–227. [Google Scholar] [CrossRef]
- Liu, B.; Zhan, J.; Zhang, A. Empowering rural human Settlement:Digital Economy’s path to progress. J. Clean. Prod. 2023, 427, 139243. [Google Scholar] [CrossRef]
- Guo, X.; Reimers, K.; Li, M. Growth of Internet Digital Platforms in China: Stages, Trends, and Research Opportunities. In Platforms and Artificial Intelligence: The Next Generation of Competences; Bounfour, A., Ed.; Springer International Publishing: Berlin/Heidelberg, Germany, 2022; pp. 39–50. [Google Scholar]
- Chong, T.T.L.; Wang, S.; Zhang, C. Understanding the digital economy in China: Characteristics, challenges, and prospects. Econ. Political Stud. 2023, 11, 419–440. [Google Scholar] [CrossRef]
- Yang, Y.; Yu, H.; Su, X.; Wang, R. Exploring the role of green finance and natural resource policies in carbon emission efficiency of China’s manufacturing industry in the context of post-COVID-19 period. Resour. Policy 2023, 86, 104243. [Google Scholar] [CrossRef]
- Sun, X.; Liu, X.; Wang, Y.; Yuan, F. The effects of public subsidies on emerging industry: An agent-based model of the electric vehicle industry. Technol. Forecast. Soc. Chang. 2019, 140, 281–295. [Google Scholar] [CrossRef]
- Zhang, H.; Gao, S.; Zhou, P. Role of digitalization in energy storage technological innovation: Evidence from China. Renew. Sustain. Energy Rev. 2023, 171, 113014. [Google Scholar] [CrossRef]
- Zhan, K.; Pu, Z. Does digital technology promote carbon emission reduction in the service industry: Economic logic and empirical evidence from China. Heliyon 2024, 10, e25686. [Google Scholar] [CrossRef] [PubMed]
- Autio, E.; Nambisan, S.; Thomas, L.D.W.; Wright, M. Digital affordances, spatial affordances, and the genesis of entrepreneurial ecosystems. Strateg. Entrep. J. 2018, 12, 72–95. [Google Scholar] [CrossRef]
- Lange, S.; Pohl, J.; Santarius, T. Digitalization and energy consumption. Does ICT reduce energy demand? Ecol. Econ. 2020, 176, 106760. [Google Scholar] [CrossRef]
- Wang, X.; Zhong, M. Can digital economy reduce carbon emission intensity? Empirical evidence from China’s smart city pilot policies. Environ. Sci. Pollut. Res. 2023, 30, 51749–51769. [Google Scholar] [CrossRef] [PubMed]
- Medaglia, R.; Rukanova, B.; Zhang, Z. Digital government and the circular economy transition: An analytical framework and a research agenda. Gov. Inf. Q. 2024, 41, 101904. [Google Scholar] [CrossRef]
- Xie, X.; Han, Y.; Tan, H. Greening China’s digital economy: Exploring the contribution of the East–West Computing Resources Transmission Project to CO2 reduction. Humanit. Soc. Sci. Commun. 2024, 11, 466. [Google Scholar] [CrossRef]
- Guo, A.; Yang, J.; Zhong, F. Carbon emission quotas and a reduction incentive scheme integrating carbon sinks for China’s provinces: An equity perspective. Sustain. Prod. Consum. 2023, 41, 213–227. [Google Scholar] [CrossRef]
- Zheng, Y.; Gong, B. Nexus between natural resources and digital economy: The role of geopolitical risk. Resour. Policy 2024, 89, 104600. [Google Scholar] [CrossRef]
- Fuchs, H.; Shehabi, A.; Ganeshalingam, M.; Desroches, L.-B.; Lim, B.; Roth, K.; Tsao, A. Comparing datasets of volume servers to illuminate their energy use in data centers. Energy Effic. 2020, 13, 379–392. [Google Scholar] [CrossRef]
- Zhu, S.; He, C.; Liu, Y. Going green or going away: Environmental regulation, economic geography and firms’ strategies in China’s pollution-intensive industries. Geoforum 2014, 55, 53–65. [Google Scholar] [CrossRef]
- Feng, Y.; Gao, Y.; Meng, X.; Shi, J.; Shi, K.; Hu, S.; Jia, F. The impacts of casual environmental regulation on carbon intensity in China: Dual mediating pathways of energy low-carbon reconstitution and industrial structure upgrading. Environ. Res. 2023, 238, 117289. [Google Scholar] [CrossRef]
- Wei, Y.; Du, M.; Huang, Z. The effects of energy quota trading on total factor productivity and economic potential in industrial sector: Evidence from China. J. Clean. Prod. 2024, 445, 141227. [Google Scholar] [CrossRef]
- Tao, M.; Poletti, S.; Wen, L.; Sheng, M.S. Modelling the role of industrial structure adjustment on China’s energy efficiency: Insights from technology innovation. J. Clean. Prod. 2024, 441, 140861. [Google Scholar] [CrossRef]
- Ma, C.; Ji, X. R&D globalization and enterprise innovation capability. Financ. Res. Lett. 2024, 65, 105613. [Google Scholar] [CrossRef]
- Tianren, L.; Sufeng, H. Does digital-industrial technology integration reduce corporate carbon emissions? Environ. Res. 2024, 257, 119313. [Google Scholar] [CrossRef] [PubMed]
- Ghasemy Yaghin, R.; Farmani, Z. Planning a low-carbon, price-differentiated supply chain with scenario-based capacities and eco-friendly customers. Int. J. Prod. Econ. 2023, 265, 108986. [Google Scholar] [CrossRef]
- Wang, Y.; Song, C.; Wang, W. Suppliers’ decision on green innovation: A response to customers’ environmental regulation. Financ. Res. Lett. 2023, 58, 104335. [Google Scholar] [CrossRef]
- Wen, H.; Liang, W.; Lee, C.-C. China’s progress toward sustainable development in pursuit of carbon neutrality: Regional differences and dynamic evolution. Environ. Impact Assess. Rev. 2023, 98, 106959. [Google Scholar] [CrossRef]
- Wang, C.; Guo, Y.; Shao, S.; Fan, M.; Chen, S. Regional carbon imbalance within China: An application of the Kaya-Zenga index. J. Environ. Manag. 2020, 262, 110378. [Google Scholar] [CrossRef]
- Xiaobin, W.; Wu, F.; Alharthi, M.; Raza, S.M.F.; Albalawi, O. Natural resources, trade and fintech in the era of digitalization: A study of economies involved in Belt and Road Initiative. Resour. Policy 2024, 93, 105082. [Google Scholar] [CrossRef]
- Guo, Y.; Tong, L.; Mei, L. The effect of industrial agglomeration on green development efficiency in Northeast China since the revitalization. J. Clean. Prod. 2020, 258, 120584. [Google Scholar] [CrossRef]
- Guan, X.; Wei, H.; Lu, S.; Su, H. Mismatch distribution of population and industry in China: Pattern, problems and driving factors. Appl. Geogr. 2018, 97, 61–74. [Google Scholar] [CrossRef]
- Chen, C.; Li, S.-E.; Wang, L. Can smart cities reduce labor misallocation? Evidence from China. Technol. Forecast. Soc. Chang. 2024, 201, 123264. [Google Scholar] [CrossRef]
- Wang, X.; Qin, C.; Liu, Y.; Tanasescu, C.; Bao, J. Emerging enablers of green low-carbon development: Do digital economy and open innovation matter? Energy Econ. 2023, 127, 107065. [Google Scholar] [CrossRef]
- Richardson, L. Sharing as a postwork style: Digital work and the co-working office. Camb. J. Reg. Econ. Soc. 2017, 10, 297–310. [Google Scholar] [CrossRef]
- Mao, Y.; Hu, N.; Leng, T.; Liu, Y. Digital economy, innovation, and firm value: Evidence from China. Pac. Basin Financ. J. 2024, 85, 102355. [Google Scholar] [CrossRef]
- Chen, X.; Zhou, C.; Tian, Z.; Mao, H.; Luo, Y.; Sun, D.; Fan, J.; Jiang, L.; Deng, J.; Rosen, M.A. Different photovoltaic power potential variations in East and West China. Appl. Energy 2023, 351, 121846. [Google Scholar] [CrossRef]
- Li, Y.; Li, N.; Li, Z. Evolution of carbon emissions in China’s digital economy: An empirical analysis from an entire industry chain perspective. J. Clean. Prod. 2023, 414, 137419. [Google Scholar] [CrossRef]
- Zhao, X.; Weng, Z. Digital dividend or divide: The digital economy and urban entrepreneurial activity. Socio-Econ. Plan. Sci. 2024, 93, 101857. [Google Scholar] [CrossRef]
- Iqbal, Q.; Piwowar-Sulej, K. Technological social responsibility: A stakeholder theory-based measurement scale. Technol. Forecast. Soc. Chang. 2024, 205, 123465. [Google Scholar] [CrossRef]
- Sun, W.; Shen, J. The impact of low-carbon city pilot on carbon emissions of high-polluting enterprises—Based on financing constraint perspective. Energy Rep. 2024, 12, 762–774. [Google Scholar] [CrossRef]
- Acheampong, A.; Elshandidy, T. Do social and environmental disclosures impact information asymmetry? Econ. Lett. 2024, 234, 111487. [Google Scholar] [CrossRef]
- Krueger, A.O. The Political Economy of the Rent-Seeking Society. Am. Econ. Rev. 1974, 64, 291–303. [Google Scholar]
- Du, J.; King, C.; Shi, X. Haste makes waste: Political entrepreneur’s rent-seeking choices in anti-corruption campaign. J. Policy Model. 2022, 44, 617–634. [Google Scholar] [CrossRef]
- Foreman, R.D.; Kleit, A.N. Is prorationing efficiency-enhancing or rent-seeking?: Evidence from a natural experiment. Resour. Policy 2023, 80, 103117. [Google Scholar] [CrossRef]
- Chang, H.; Ding, Q.; Zhao, W.; Hou, N.; Liu, W. The digital economy, industrial structure upgrading, and carbon emission intensity—Empirical evidence from China’s provinces. Energy Strategy Rev. 2023, 50, 101218. [Google Scholar] [CrossRef]
- Li, H.; Zhang, Y.; Li, Y. The impact of the digital economy on the total factor productivity of manufacturing firms: Empirical evidence from China. Technol. Forecast. Soc. Chang. 2024, 207, 123604. [Google Scholar] [CrossRef]
- Xia, H.; Yu, H.; Wang, S.; Yang, H. Digital economy and the urban–rural income gap: Impact, mechanisms, and spatial heterogeneity. J. Innov. Knowl. 2024; in press. [Google Scholar] [CrossRef]
- Lu, Y.; Chen, X. Digital economy, new-type urbanization, and carbon emissions: Evidence from China. Environ. Prog. Sustain. Energy 2023, 42, e14045. [Google Scholar] [CrossRef]
- Zhao, T.; Zhang, Z.; Liang, S. Digital Economy, Entrepreneurship, and High-Quality Economic Development: Empirical Evidence from Urban China. Manag. World 2020, 36, 65–76. [Google Scholar] [CrossRef]
- Song, M.; Xie, Q.; Shen, Z. Impact of green credit on high-efficiency utilization of energy in China considering environmental constraints. Energy Policy 2021, 153, 112267. [Google Scholar] [CrossRef]
- Qin, Z.; Zhang, H.; Zhao, B. Impact of R&D Investment and Network Penetration on Human Development: Evidence from China. Soc. Indic. Res. 2023, 167, 1–25. [Google Scholar] [CrossRef]
- Sun, Q. SOE wage premium in China: New evidence. Empir. Econ. 2023, 64, 1121–1147. [Google Scholar] [CrossRef]
- Chen, L.; Lu, Y.; Meng, Y.; Zhao, W. Research on the nexus between the digital economy and carbon emissions—Evidence at China’s province level. J. Clean. Prod. 2023, 413, 137484. [Google Scholar] [CrossRef]
- Huang, X.; Zhou, J.; Zhou, Y. Digital Economy’s Spatial Implications on Urban Innovation and Its Threshold: Evidence from China. Complexity 2022, 2022, 3436741. [Google Scholar] [CrossRef]
- Wang, S.; Yu, D.; Sun, M. Can internet development improve carbon emission efficiency for manufacturing? The role of market integration. J. Environ. Manag. 2024, 366, 121815. [Google Scholar] [CrossRef]
- Kuziboev, B.; Rajabov, A.; Ibadullaev, E.; Matkarimov, F.; Ataev, J. The role of renewable energy, tax revenue and women governance in environmental degradation for developing Asian countries. Energy Nexus 2024, 13, 100262. [Google Scholar] [CrossRef]

| Explanatory Variable | Primary Indicator | Secondary Indicators | Unit | Indicator Attribute | Weights |
|---|---|---|---|---|---|
| Digital infrastructure | Number of cell phone base stations | 104 pcs | Positive | 0.038 | |
| Number of Internet access ports | 104 pcs | Positive | 0.037 | ||
| Number of websites | 104 pcs | Positive | 0.070 | ||
| Length of fiber optic line | kilometers | Positive | 0.037 | ||
| Digital user | Number of cell phone subscribers | 104 households | Positive | 0.032 | |
| Volume of telecommunication services | CNY 108 | Positive | 0.065 | ||
| Volume of postal operations | CNY 108 | Positive | 0.106 | ||
| Digital Economy | Volume of express mail | 104 pcs | Positive | 0.114 | |
| Digital industry | Investment in fixed assets in the information transmission, computer services, and software industry | CNY 108 | Positive | 0.036 | |
| Revenue from electronic information manufacturing | CNY 108 | Positive | 0.099 | ||
| Revenue from software operations | CNY 108 | Positive | 0.093 | ||
| Number of employees in the information transmission, software, and information technology services industry | 104 pcs | Positive | 0.059 | ||
| Digital Innovation | R&D expenses | CNY 108 | Positive | 0.059 | |
| Number of patents granted for inventions | pcs | Positive | 0.088 | ||
| Gross domestic production | CNY 108 | Positive | 0.037 | ||
| Funding for education | CNY 108 | Positive | 0.030 |
| Variable | Sample Size | Average | Standard Deviation | Minimum | Median | Maximum |
|---|---|---|---|---|---|---|
| CE | 330 | 10.31 | 0.751 | 8.353 | 10.350 | 12.220 |
| CI | 330 | 2.004 | 1.604 | 0.196 | 1.539 | 10.560 |
| DIGE | 330 | 0.111 | 0.113 | 0.002 | 0.072 | 0.595 |
| ER | 330 | 0.003 | 0.004 | 0.000 | 0.002 | 0.031 |
| RDI | 330 | 0.017 | 0.011 | 0.004 | 0.014 | 0.065 |
| PC | 330 | 0.460 | 0.133 | 0.130 | 0.459 | 0.699 |
| IS | 330 | 1.246 | 0.705 | 0.518 | 1.083 | 5.297 |
| UL | 330 | 0.596 | 0.121 | 0.350 | 0.581 | 0.896 |
| FDI | 330 | 0.019 | 0.015 | 0.000 | 0.017 | 0.080 |
| LEOP | 330 | 0.265 | 0.291 | 0.008 | 0.142 | 1.548 |
| TB | 330 | 0.082 | 0.029 | 0.044 | 0.075 | 0.200 |
| Variables | (1) | (2) | (3) | (4) |
|---|---|---|---|---|
| CE | CE | CI | CI | |
| DIGE | −0.884 *** | −1.200 *** | −1.561 ** | −2.978 *** |
| (−4.441) | (−5.946) | (−2.627) | (−3.817) | |
| IS | −0.260 *** | −0.563 ** | ||
| (−5.877) | (−3.290) | |||
| UL | 1.256 * | −9.045 *** | ||
| (2.025) | (−3.774) | |||
| FDI | 0.763 | −0.439 | ||
| (0.894) | (−0.133) | |||
| LEOP | −0.354 ** | −0.372 | ||
| (−3.050) | (−0.831) | |||
| TB | 2.103 ** | 15.976 *** | ||
| (2.723) | (5.352) | |||
| Province fixed effects | YES | YES | YES | YES |
| Time fixed effects | YES | YES | YES | YES |
| Constant | 10.286 *** | 9.791 *** | 2.589 *** | 6.814 *** |
| (444.774) | (28.368) | (28.941) | (5.108) | |
| Observations | 330 | 330 | 330 | 330 |
| R-squared | 0.077 | 0.252 | 0.171 | 0.329 |
| Variables | (1) | (2) | (3) | (4) | (5) |
|---|---|---|---|---|---|
| CE | ER | CE | CI | CI | |
| DIGE | −1.200 *** | 0.018 *** | −1.098 *** | −2.978 *** | −2.445 ** |
| (−5.946) | (3.930) | (−5.330) | (−3.817) | (−3.094) | |
| ER | −5.811 * | −30.147 ** | |||
| (−2.198) | (−2.971) | ||||
| IS | −0.260 *** | 0.000 | −0.260 *** | −0.563 ** | −0.562 *** |
| (−5.877) | (0.034) | (−5.913) | (−3.290) | (−3.329) | |
| UL | 1.256 * | −0.030 * | 1.081 | −9.045 *** | −9.954 *** |
| (2.025) | (−2.181) | (1.740) | (−3.774) | (−4.175) | |
| FDI | 0.763 | 0.019 | 0.876 | −0.439 | 0.146 |
| (0.894) | (1.019) | (1.031) | (−0.133) | (0.045) | |
| LEOP | −0.354 ** | 0.005 | −0.326 ** | −0.372 | −0.232 |
| (−3.050) | (1.803) | (−2.819) | (−0.831) | (−0.521) | |
| TB | 2.103 ** | −0.019 | 1.995 ** | 15.976 *** | 15.414 *** |
| (2.723) | (−1.082) | (2.595) | (5.352) | (5.224) | |
| Province fixed effects | YES | YES | YES | YES | YES |
| Time fixed effects | YES | YES | YES | YES | YES |
| Constant | 9.791 *** | 0.018 * | 9.894 *** | 6.814 *** | 7.349 *** |
| (28.368) | (2.303) | (28.593) | (5.108) | (5.533) | |
| Observations | 330 | 330 | 330 | 330 | 330 |
| R-squared | 0.252 | 0.266 | 0.262 | 0.329 | 0.347 |
| Variables | (1) | (2) | (3) | (4) | (5) |
|---|---|---|---|---|---|
| CE | RDI | CE | CI | CI | |
| DIGE | −1.200 *** | 0.015 *** | −0.568 ** | −2.978 *** | −1.799 * |
| (−5.946) | (6.468) | (−3.216) | (−3.817) | (−2.588) | |
| RDI | −20.569 *** | −37.517 * | |||
| (−4.775) | (−2.214) | ||||
| IS | −0.260 *** | −0.001 | −0.590 *** | −0.563 ** | −0.590 *** |
| (−5.877) | (−1.317) | (−3.440) | (−3.290) | (−3.440) | |
| UL | 1.256 * | −0.007 | −8.940 *** | −9.045 *** | −8.940 *** |
| (2.025) | (−0.866) | (−3.749) | (−3.774) | (−3.749) | |
| FDI | 0.763 | 0.001 | −0.992 | −0.439 | −0.992 |
| (0.894) | (0.078) | (−0.302) | (−0.133) | (−0.302) | |
| LEOP | −0.354 ** | 0.001 | −0.418 | −0.372 | −0.418 |
| (−3.050) | (0.459) | (−0.916) | (−0.831) | (−0.916) | |
| TB | 2.103 ** | 0.012 | 16.836 *** | 15.976 *** | 16.836 *** |
| (2.723) | (1.155) | (5.635) | (5.352) | (5.635) | |
| Province fixed effects | YES | YES | YES | YES | YES |
| Time fixed effects | YES | YES | YES | YES | YES |
| Constant | 9.791 *** | 0.061 *** | 9.894 *** | 6.814 *** | 7.349 *** |
| (28.368) | (7.866) | (28.593) | (5.108) | (5.533) | |
| Observations | 330 | 330 | 330 | 330 | 330 |
| R-squared | 0.252 | 0.886 | 0.883 | 0.329 | 0.841 |
| Replacing Explained Variables | Excluding Municipality Samples | Adding Control Variables | |||
|---|---|---|---|---|---|
| CI | CE | CI | CE | CI | |
| (1) | (2) | (3) | (4) | (5) | |
| DIGE | 2.733 *** | −1.138 *** | −3.747 *** | −1.332 *** | −2.812 *** |
| (10.699) | (−6.028) | (−5.344) | (−6.498) | (−3.529) | |
| IS | 0.181 ** | −0.329 *** | −0.886 *** | −0.238 *** | −0.641 *** |
| (3.239) | (−6.211) | (−4.505) | (−5.274) | (−3.657) | |
| UR | −4.173 *** | 1.010 | −13.121 *** | 0.914 | −8.473 *** |
| (−5.317) | (1.189) | (−4.158) | (1.461) | (−3.482) | |
| FDI | 3.984 *** | 0.786 | −3.601 | 0.247 | −1.436 |
| (3.687) | (0.687) | (−0.847) | (0.282) | (−0.422) | |
| LEOP | −0.638 *** | −0.416 * | −0.169 | −0.236 | −0.349 |
| (−4.352) | (−2.526) | (−0.276) | (−1.931) | (−0.736) | |
| TB | −11.893 *** | 1.123 | 19.435 *** | 3.119 ** | 10.760 ** |
| (−12.166) | (1.093) | (5.094) | (3.124) | (2.772) | |
| GI | 3.119 ** | 10.760 ** | |||
| (3.124) | (2.772) | ||||
| ED | 0.233 | 3.622 * | |||
| (0.528) | (2.112) | ||||
| Province fixed effects | YES | YES | YES | YES | YES |
| Time fixed effects | YES | YES | YES | YES | YES |
| Constant | 3.523 *** | 10.162 *** | 8.814 *** | 6.632 *** | 3.442 |
| (8.065) | (22.757) | (5.313) | (5.169) | (0.690) | |
| Observations | 330 | 286 | 286 | 330 | 330 |
| R-squared | 0.809 | 0.270 | 0.394 | 0.268 | 0.337 |
| DIGE(CE) | CE | DIGE(CI) | CI | |
|---|---|---|---|---|
| (1) | (2) | (3) | (4) | |
| DIGE | −1.111 *** | −2.911 *** | ||
| Control variables | YES | YES | YES | YES |
| DIGE_1 | 1.017 *** | 1.015 *** | ||
| Province fixed effects | YES | YES | YES | YES |
| Time fixed effects | YES | YES | YES | YES |
| Kleibergen–Paap rk LM statistic | 31.36 *** | 31.87 *** | ||
| Kleibergen–Paap Wald rk F statistic | 305.92 | 316.83 |
| CE | CI | |||||
|---|---|---|---|---|---|---|
| Eastern Region | Central Region | Western and Northeastern Region | Eastern Region | Central Region | Western and Northeastern Region | |
| (1) | (2) | (3) | (4) | (5) | (6) | |
| DIGE | 0.052 | −7.361 *** | −1.726 ** | 0.712 * | −26.380 *** | −1.748 * |
| (0.321) | (−6.427) | (−2.824) | (2.544) | (−4.319) | (−1.972) | |
| IS | −0.030 | −0.742 *** | −0.218 ** | 0.005 | −2.958 ** | −0.184 |
| (−0.827) | (−3.926) | (−2.994) | (0.075) | (−2.936) | (−0.859) | |
| UR | 1.937 *** | 6.773 * | 1.754 | −3.656 *** | 14.761 | −13.283 *** |
| (4.100) | (2.184) | (1.557) | (−4.484) | (0.892) | (−4.007) | |
| FDI | −0.851 | −19.079 ** | 1.728 | −2.638 * | −58.544 | −3.890 |
| (−1.227) | (−3.267) | (1.315) | (−2.204) | (−1.880) | (−1.006) | |
| LEOP | −0.132 | 1.986 | −0.212 | −0.010 | 9.619 | −1.043 |
| (−1.466) | (1.311) | (−0.622) | (−0.067) | (1.191) | (−1.040) | |
| TB | 0.773 | −4.654 | 2.080 | 2.029 | 0.331 | 20.041 *** |
| (1.287) | (−1.290) | (1.504) | (1.958) | (0.017) | (4.925) | |
| Province fixed effects | YES | YES | YES | YES | YES | YES |
| Time fixed effects | YES | YES | YES | YES | YES | YES |
| Constant | 9.068 *** | 8.700 *** | 9.295 *** | 3.715 *** | −0.998 | 8.332 *** |
| (30.315) | (6.417) | (15.566) | (7.197) | (−0.138) | (4.743) | |
| Observations | 110 | 66 | 154 | 110 | 66 | 154 |
| R-squared | 0.206 | 0.623 | 0.310 | 0.887 | 0.464 | 0.559 |
| CE | CI | |||||||
|---|---|---|---|---|---|---|---|---|
| (1) | (2) | (3) | (4) | (5) | (6) | (7) | (8) | |
| DINF | −0.674 ** | −1.097 * | ||||||
| (−2.603) | (−2.298) | |||||||
| DU | −0.575 *** | −2.015 *** | ||||||
| (−4.215) | (−3.941) | |||||||
| DIND | −0.966 *** | −2.079 ** | ||||||
| (−5.192) | (−2.897) | |||||||
| DINN | −0.538 ** | −1.418 | ||||||
| (−2.597) | (−1.822) | |||||||
| IS | −0.240 *** | −0.252 *** | −0.239 *** | −0.192 *** | −0.471 ** | −0.604 *** | −0.494 ** | −0.394 * |
| (−5.465) | (−5.445) | (−5.400) | (−4.288) | (−2.752) | (−3.485) | (−2.899) | (−2.340) | |
| UR | 1.713 ** | 1.438 * | 1.100 | 1.395 * | −8.053 ** | −8.703 *** | −9.283 *** | −8.723 *** |
| (2.746) | (2.260) | (1.740) | (2.144) | (−3.314) | (−3.646) | (−3.810) | (−3.567) | |
| FDI | 0.364 | 0.326 | 0.742 | 0.814 | −1.451 | −1.537 | −0.624 | −0.239 |
| (0.424) | (0.373) | (0.857) | (0.894) | (−0.434) | (−0.468) | (−0.187) | (−0.070) | |
| LEOP | −0.273 * | −0.287 * | −0.397 ** | −0.157 | −0.060 | −0.358 | −0.396 | 0.114 |
| (−2.403) | (−2.421) | (−3.252) | (−1.353) | (−0.136) | (−0.804) | (−0.841) | (0.263) | |
| TB | 2.172 ** | 2.582 ** | 1.652 * | 1.520 | 15.913 *** | 17.865 *** | 14.938 *** | 14.470 *** |
| (2.787) | (3.187) | (2.109) | (1.850) | (5.242) | (5.879) | (4.948) | (4.684) | |
| Province fixed effects | YES | YES | YES | YES | YES | YES | YES | YES |
| Time fixed effects | YES | YES | YES | YES | YES | YES | YES | YES |
| Constant | 9.489 *** | 9.586 *** | 9.890 *** | 9.627 *** | 6.047 *** | 6.424 *** | 6.919 *** | 6.431 *** |
| (27.615) | (27.251) | (27.871) | (26.564) | (4.518) | (4.869) | (5.060) | (4.721) | |
| Observations | 330 | 330 | 330 | 330 | 330 | 330 | 330 | 330 |
| R-squared | 0.239 | 0.208 | 0.231 | 0.178 | 0.308 | 0.332 | 0.315 | 0.303 |
| Provinces with a Larger Proportion of Non-SOEs | Provinces with a Larger Proportion of SOEs | |||
|---|---|---|---|---|
| CE | CI | CE | CI | |
| DIGE | −0.994 *** | −2.233 *** | 0.020 | −3.563 |
| (−4.043) | (−3.608) | (0.015) | (−0.625) | |
| PC | −2.424 * | −0.106 | 5.258 | −0.080 |
| (−2.263) | (−0.058) | (1.907) | (−0.011) | |
| Interaction | −3.444 ** | −5.930 * | 4.311 | 8.499 |
| (−3.226) | (−2.172) | (0.537) | (0.248) | |
| IS | −0.181 *** | −0.134 | −0.367 *** | −0.827 * |
| (−4.409) | (−1.397) | (−4.255) | (−2.335) | |
| UL | 0.036 | −4.391 *** | 1.229 | −6.329 |
| (0.064) | (−3.311) | (1.084) | (−1.579) | |
| FDI | 0.524 | −5.990 ** | 3.351 | 7.677 |
| (0.630) | (−2.826) | (1.835) | (1.012) | |
| LEOP | −0.154 | −0.473 | −0.537 | −1.450 |
| (−1.333) | (−1.634) | (−1.381) | (−0.880) | |
| TB | 0.740 | 10.276 *** | 4.657 ** | 28.345 *** |
| (0.915) | (5.036) | (2.737) | (3.996) | |
| Constant | 11.572 *** | 4.269 *** | 6.261 *** | 5.023 |
| (22.884) | (4.423) | (3.573) | (1.005) | |
| Observations | 187 | 187 | 143 | 143 |
| R-squared | 11.572 *** | 4.269 *** | 0.4815 | 0.3712 |
Disclaimer/Publisher’s Note: The statements, opinions and data contained in all publications are solely those of the individual author(s) and contributor(s) and not of MDPI and/or the editor(s). MDPI and/or the editor(s) disclaim responsibility for any injury to people or property resulting from any ideas, methods, instructions or products referred to in the content. |
© 2024 by the authors. Licensee MDPI, Basel, Switzerland. This article is an open access article distributed under the terms and conditions of the Creative Commons Attribution (CC BY) license (https://creativecommons.org/licenses/by/4.0/).
Share and Cite
Jia, X.; Guang, W. The Impact of the Digital Economy on Carbon Emissions Based on Regional Development Imbalance. Systems 2024, 12, 291. https://doi.org/10.3390/systems12080291
Jia X, Guang W. The Impact of the Digital Economy on Carbon Emissions Based on Regional Development Imbalance. Systems. 2024; 12(8):291. https://doi.org/10.3390/systems12080291
Chicago/Turabian StyleJia, Xiaoxia, and Weiyi Guang. 2024. "The Impact of the Digital Economy on Carbon Emissions Based on Regional Development Imbalance" Systems 12, no. 8: 291. https://doi.org/10.3390/systems12080291
APA StyleJia, X., & Guang, W. (2024). The Impact of the Digital Economy on Carbon Emissions Based on Regional Development Imbalance. Systems, 12(8), 291. https://doi.org/10.3390/systems12080291