Article

Improving Transfer Connectivity in Railway Timetables Based on Closeness Centrality: The Case of the European International Network

by
Laura Calzada-Infante
,
Belarmino Adenso-Díaz
* and
Santiago García Carbajal
Escuela Politécnica de Ingeniería, Universidad de Oviedo, 33204 Gijón, Spain
*
Author to whom correspondence should be addressed.
Systems 2024, 12(9), 327; https://doi.org/10.3390/systems12090327
Submission received: 25 June 2024 / Revised: 13 August 2024 / Accepted: 20 August 2024 / Published: 26 August 2024
(This article belongs to the Special Issue Data-Driven Decision Making for Complex Systems)

Abstract

:
Could the connectivity of a global railway network increase through small changes in the timetable services? When designing railway schedules, transfer connections to intermediate stations may not be the primary focus considered. However, they may have an important influence on connectivity. In this paper, we study the potential improvement in connections by introducing small changes to the current schedules, using real timetables from all international railway services in Europe. The modelling was completed using the Complex Networks methodology and performance was measured based on total closeness centrality. Various factors are considered to calibrate the necessary amendments to provide a better traveller service, including connection times at stations and different allowed levels of schedule changes. The results indicate that by changing the schedule of only 1% of the services by at most 10 min, the connectivity improvement is remarkable. Railway companies should consider this result in order to expand the potential use of the international railway service at a time when public transportation must be encouraged.

1. Introduction

Railway services have a significant influence on both the economic development and environmental sustainability of any region. Railways are one of the cleanest and fastest modes of transport, and therefore one of the core components of the Trans-European Network (TEN-T) to improve the cohesion of Europe. Many nations consider railways critical infrastructure needed for the basic operation of society [1]. However, railway services require expensive infrastructure and have high operating costs.
Railways improve the connectivity of regions by carrying both passengers and freight, contributing to economic growth. They are the mode of passenger transportation with the lowest greenhouse gas emissions compared to air travel, buses, or cars. In 2019, the European Commission presented the European Green Deal, aiming to reduce emissions by at least 55% by 2030 compared to 1990 levels. One of its five priorities for the period 2021–2027 is “a greener, low-carbon transitioning towards a net zero carbon economy” [2]. With this goal in mind, the European Commission fosters investments in the Trans-European Network with the Cohesion Fund and the European Regional Development Fund (ERDF). The 2014–2020 programming period planned to invest around EUR 18 billion in rail projects [3].
The European Commission is constantly promoting the use of railway services. In 2018, over 8 billion passengers journeyed throughout the European Union, and for each country, international rail passengers represented less than 8% of the total passenger count [4]. When users have multiple means of transport to reach their destination, demand is correlated with the quality of service. Although other variables could be considered (cleanliness, punctuality, etc.), the quality of rail service provided at a station depends on four factors, according to Debrezion et al. [5]: first, the duration of travellers’ wait before starting their journey, based on the frequency of the trains; second, the connectivity of the station within the network, based on the number of direct connections from the station and the number of transfers required to reach the destination; third, the relative position of the station in the network; and last but not least, the cost. It is important to highlight that the frequency of trains affects not only how long the travellers have to wait to start their trip, but also the transfer time.
The importance of studying the design of transportation networks with consideration for the transfer factor has been emphasized by many authors. [6] concluded that users’ willingness to consider transfer routes depends on the extent to which these connections have been planned in detail, including the relevant trip information, the convenience of the facilities, price integration, and of course waiting times. It should be noted that providing better alternatives for passenger connections would improve mobility that benefits communities, the economy, and the environment [7].
Different methodologies have been used to design railway transportation timetables, and some of them aim to reduce transfer times by coordinating public transport timetables [8,9]. We can find heuristic rule-based approaches, mathematical programming, analytical modelling, and simulation [10]. Additionally, there are other approaches, such as Complex Network Analysis (CNA), which models each system as a network to understand its structure and robustness by studying its topology. In this case, each network is composed of nodes that represent the entities, and edges that establish any type of relationship among them [11]. To evaluate the connectivity of the stations in the railway network using CNA, railway services (scheduled trains) are suitable relationships to model.
The structure of railway networks and the connectivity of each station are commonly described using various metrics to define their topological characteristics. However, no study has yet explored how these metrics could be optimized to provide a better service to passengers. Could small changes to existing timetables improve their level of service based on the connectivity of the cities? This research aims to investigate precisely this question: whether there is significant potential to enhance the connectivity of the railway network (using the European case as an example) without introducing major modifications, but simply through minor adjustments. These changes would increase opportunities for passenger transfers between services, and the impact of this improvement can be measured using the closeness centrality metric. Different parameters (such as maximum waiting time at the station, the number of services modified, and the maximum time span to amend each service in the current schedule) are also considered to analyse how these changes could be made with minimal alterations to existing timetables. This result suggests that a much greater emphasis is required from the railway operators, as better connectivity could be achieved by making small improvements to the timetables.
The structure of the paper is as follows: Section 2 provides a literature review of railway scheduling; Section 3 details the methodology, explaining the experiments and the algorithm designed to improve schedules based on the proposed metric; and Section 4 presents the results of all the treatments considered to evaluate the proposed approach. Finally, Section 5 offers the conclusion of this paper.

2. Literature Review

Many studies have been published analysing railway networks in various parts of the world using CNA. For instance, topological characterisation was employed to assess the performance of different recovery strategies for the Indian Railway Network [12]. In China, a topological characterisation of the China Railway Network has been conducted, and its core–periphery structure has been studied using a gravity model approach and a weighted k-core decomposition analysis to examine the relationship between urban agglomerations and China’s railway infrastructure [13]. Xu et al. [14] evaluate the impact of the planned Chinese high-speed rail network for 2030 on the connectivity of its cities based on their populations, and conduct a topological analysis in two different periods to compare its evolution.
In Europe, But and Prokhorchenko [15] perform a similar characterisation of Ukraine’s railway network and classify stations into clusters based on closeness centrality. The topological characterisation of the entire European railway network has been studied and compared with the Chinese network in two cases: when passengers are able to make transfer connections, and when they are not [11]. In a multimodal study, Feng et al. [16] compare the topological structure of different high-speed rail and aviation networks in China, highlighting the transfer network P-space, as it better emulates the travel process of passengers. Note that in the P-space representation, a link between a pair of nodes indicates that those stations are connected by some service, even if there are intermediate stations between them, whereas in the L-space representation, only neighbouring and connected stations have a link in the network [17].
One of the critical tasks in the planning process for railway companies is timetable generation. As mentioned, timetables constrain the number of potential passengers and, therefore, the income of railway transportation companies. The planning process in public transport for defining timetables is split into two major stages: strategic planning and operational planning [18]. The first stage has a planning horizon of 5–15 years and uses travel demand estimation to provide the necessary infrastructure for enabling efficient transportation. It also establishes the transportation routes that connect the stations and sets the timetables. The operational planning stage spans up to one year and involves determining vehicle and crew scheduling. Other authors divide this process into three stages: strategic, tactical, and operational levels [19]. In the first framework, train timetabling is considered part of the operational level, while in the second framework, it is part of the tactical level. Nevertheless, in both frameworks, train timetabling begins once the lines are defined, followed by rolling stock scheduling, crew scheduling, and real-time management [19].
There are two types of timetables, namely periodic and aperiodic. The first is composed of routes repeated with a certain frequency. This type of timetable is frequently used in Europe. The first Periodic Event Scheduling Problem was proposed by Serafini and Ukovich [20]. Polinder et al. [21] use a quadratic mixed integer program to define this type of timetable synchronising the lines based on the demand among stations. The objective is to minimise the average perceived travel time of passengers by synchronising the lines and introducing the waiting time at the origin station in the objective function. Liebchen [22] applies an integer programming model based on graph theory to the Berlin subway, achieving the same goal of reducing the transfer waiting time, but also simultaneously reducing train operations and dwell time at the stations.
Drábek et al. [23] identify two main approaches for designing schedules for high-speed lines, describing the characteristics observed in the networks of different European countries: the Line/Service approach, which is mostly radial and not focused on facilitating connections at the central station; and the Network approach, which features some degree of periodicity and anticipates transfer connections. According to their results, the Line/Service approach is typically used in countries with significant central agglomerations.
Regarding aperiodic timetables, they adjust to passenger demand without following regular train path sequences [24]. Multiple approaches, such as branch-and-bound, Lagrangian relaxation, and graph theory [25] have been used to find optimal timetables that meet operational and/or capacity constraints defined for specific demand.
Although most of the studies on passenger transfer deal with multimodality and urban mobility (see for instance [26] that model commuters’ behaviour in a Chinese city), the importance of waiting time has been highlighted by almost all authors. Schakenbos et al. [27], studying the transfers between bus/tram/metro to train in the Netherlands, observed that a reduction of 15 to 8 min of waiting transfer time reduces notably the passengers’ total transfer disutility. Shorter transfer waiting times reduce the perceived burden of making transfers, and therefore, according to Park and Chowdhury [28], transfer planning should be designed in advance by schedulers to make it more attractive to passengers.
Regarding the transfer of railway passengers between services connecting in a station, in recent years new approaches appear to have dealt with the transfer coordination design problem independently of the mode of transportation. Liu et al. [10] conducted a literature review that includes multiple extensions of this problem. The first-train timetable coordination approach aims to minimise the transfer time of passengers, reducing their waiting time at the boarding and transfer stations. On the other hand, the last-train timetable coordination approach aims to reduce the missed connections enhancing the reliability of railway services. Liu et al. [10] note an increasing interest in this latter topic. Yu et al. [29] use a bi-objective model, minimising the number of passengers who missed the transfer and the difference between the original and optimal timetables and apply it to the Beijing subway. Vansteenwegen and Van Oudheusden [30] propose a linear programming model to reduce the waiting times for transfers of the entire intercity network of the Belgian railways, reducing not only the waiting time but also the missed connections.
As can be seen, while the reduction in waiting times for passenger transfers has received attention in the literature, no studies have been carried out dealing with the potential increase in the global connectivity of the network based on small modifications in the timetables of real operating services at the continental level, as this paper aims to do.

3. Methodology

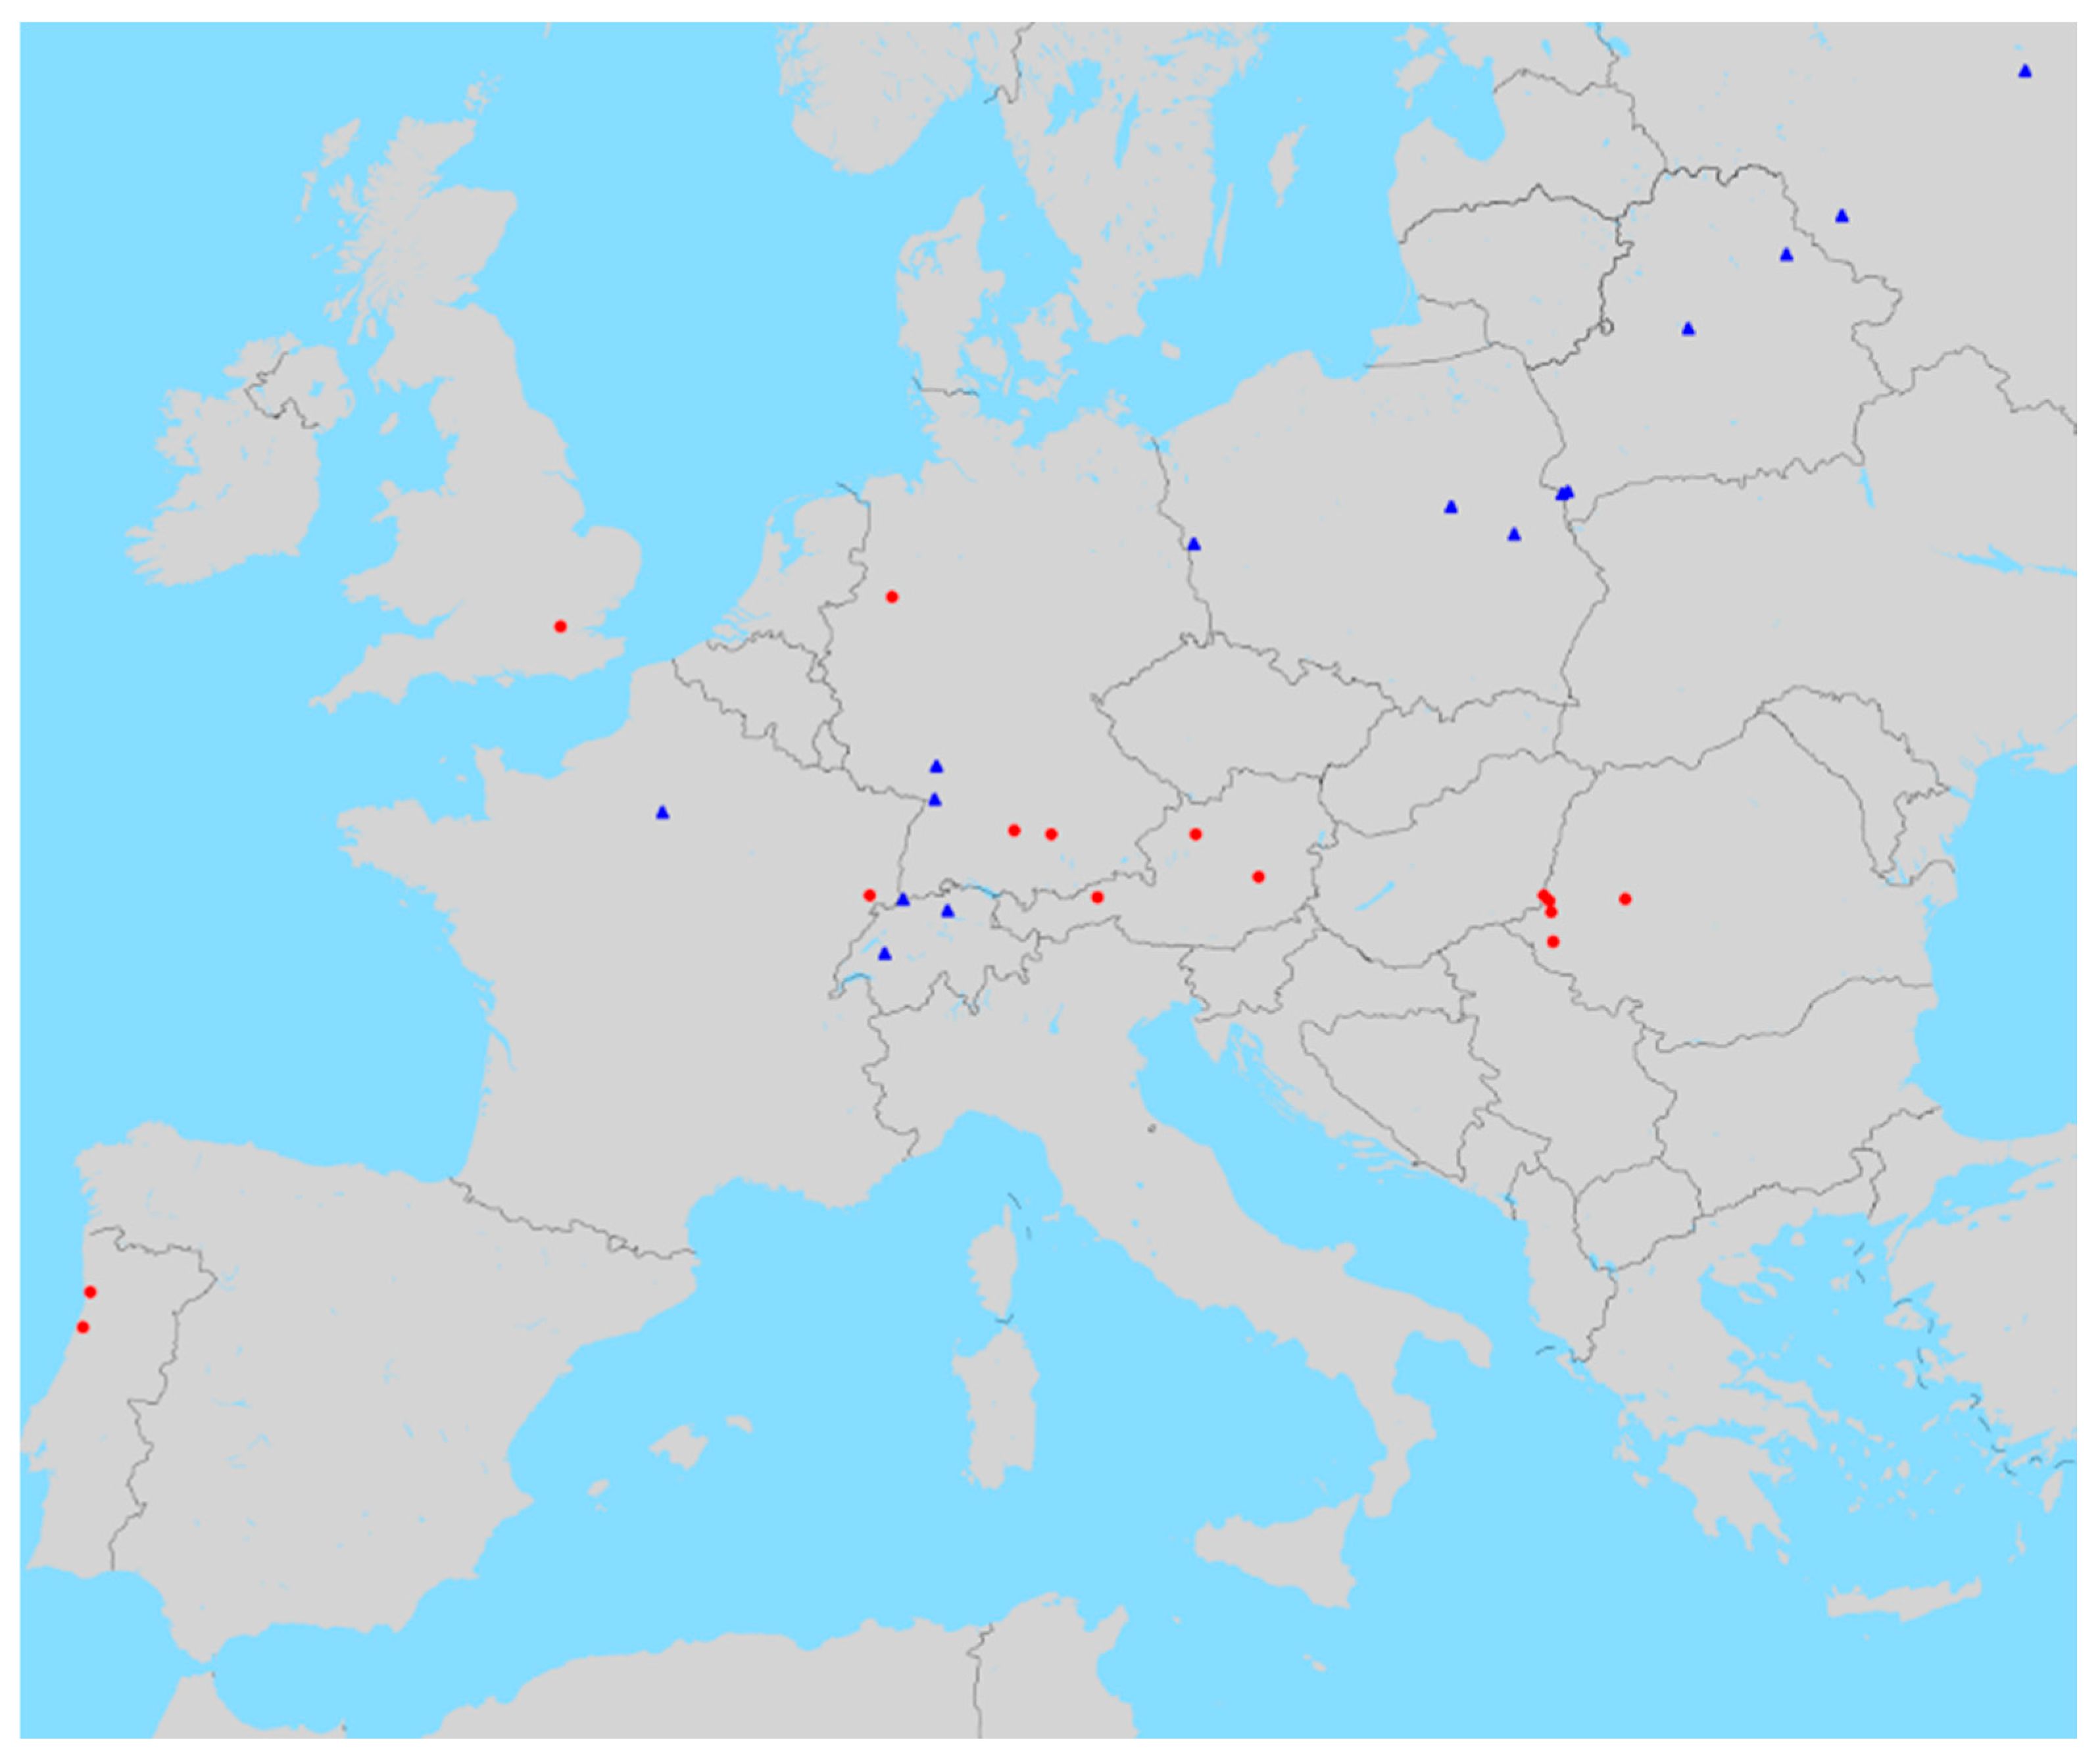
3.1. The European Railway Network

To analyse the potential improvement in the connectivity of the international railway service by modifying current schedules, the European international railway transportation services timetable is considered [31], considering a time horizon of six months. Services are depicted in Figure 1, only showing the direct connections between the evaluated stations to reduce the plot clutter.
As mentioned in Section 2, the most natural way to model railway traffic is to consider it as a network. Modelled as a Complex Network G(V,E) following a P-space representation, the set of nodes, V, represents the stations, while the set E of links in the network represent the existence of a train service that connects two stations, even when they are not consecutive stops in the line service. Each link e = (v1,v2)∈E is weighted by the weekly frequency fv1,v2 of the services joining stations v1 and v2. Defining S as the set of international railway services considered in this study, in our case card(S) = 2367, card(V) = 412 stations, and card(E) = 7732 pairs of connected stations. This network is called the EIRN (European International Railway Network).
However, a more realistic connectivity network than the EIRN could be defined. Considering a maximum transfer time (MX_TR_WAI) in intermediate stations served by different services, more cities could be considered as connected if a passenger waiting at the station could complete a transfer connection from one service to the other. The resulting complex network G(V,Et) is called the European International Railway Network with transfer (EIRNt), where, obviously, more connections and services are expected compared with the EIRN. For instance, for MX_TR_WAI = 30 min, it is card(Et) = 27,449 (i.e., more than three times the available trips in the EIRN).
Note that the definition of the EIRNt is based on two factors: MX_TR_WAI, and the maximum travel time that an international passenger on the railway system is expected to reasonably consider for this mode of transport. As other alternative transportation modes exist for long trips, in this paper the maximum travel time is supposed to be limited to 15 h.
To characterise the topological structure of any complex network, multiple metrics have been defined in the literature [32], each one focusing on different characteristics of the network [33]. A detailed analysis of the EIRN and EIRNt for MX_TR_WAI = 60 min can be seen in [11], including the description of metrics both at the network level (degree, betweenness centrality, clustering coefficient, among others) and at node level (assessing its degree distribution, the correlation between degree distribution vs. clustering coefficient, degree vs. strength, etc.).
In terms of checking the accessibility of the nodes, Closeness Centrality is the most commonly used metric. For instance, in different studies that evaluate the high-speed rail network (HSR) of China, its trunk lines were analysed by Weighted Degree and Weighted Closeness Centrality [34], while its core and secondary routes were studied using Closeness Centrality and Betweenness Centrality [35]. In addition, Liu et al. [36] observed how city accessibility in the HSR of China measured by degree and Closeness Centrality significantly influence housing prices.
The Closeness Centrality of a node v, CC(v), measures how close the node is with respect to the rest of the network [37]. This metric is based on the geodesic distance d(v,v′) ∀v,v′∈V that measures the minimum distance between every pair of nodes in the network. In our case, where the links’ weight is the number of services connecting two stations (fv,v), the distance d(v,v′) should be defined as the inverse of the number of services, d(v,v′) = 1/fv,v (i.e., the higher number of services, the “closer” are both stations). This metric is normalised by kv, the number of nodes that are accessible from v :
C C v = k v f v , v 0 d ( v , v )           v V
Closeness Centrality is a good metric when dealing with connected graphs. When, as in our case, not all nodes are connected, the number kv of summands in the denominator of (1) can be different for each node v. Therefore, closeness centrality is not linear with the total number of services in the network. In fact, assigning more services to the stations with fewer services improves the total centrality of the network more than assigning the same number of services to best-covered stations: letting K be any constant, p a specific frequency, and Δ ≥ 1, in the denominator of Equation (1) it holds that K + 1/(p + 1) + 1/(p + Δ) < K + 1/p + 1/((p + Δ) + 1). That is, CC(v) is larger if we increase by one the frequency of a station with frequency p, than the frequency of a station with frequency p + Δ > p.
Different authors have proposed different alternatives to deal with unconnected graphs when calculating closeness centrality [38]. Some of them have a difficult practical interpretation in our network. For that reason, we have considered a slight modification of (1) that avoids the problem of monotonicity and encourages increasing the number of cities connected:
C C v = k v v V 1 / ( f v , v + 1 )           v V
As stated above, the purpose of this paper is to evaluate how small changes in the current International European Railway services timetable [31] could improve the total Closeness Centrality of the EIRNt. Of course, the expected results depend on how “small changes” are defined, and the number of services that are subject to changes in their timetables: changing to a large extent the schedule of a service or a big number of services would be a disturbance for regular travellers, therefore some sort of limitation should be set. In this paper we consider three levels for the factor MX_T_MOD, namely, allowing changes in the departure time of a service to a maximum of ±10, ±20, or ±30 min with respect to the current schedule, in steps of 10 min (that is, for the second level allowed changes are −20, −10, 10, and 20). This is in the range of values considered for domestic trips in the UK (see Wheat and Wardman [39]).
Another factor, NUM_S_MOD, limits the number of services for which the schedule can be modified to at most 1%, 5%, or 10% of the 2367 services in the network. As mentioned, for MX_TR_WAI only two levels are considered (waiting at most 30 or 60 min for a connection, meaning that it will be understood that services j and i connect at a station if the time between the arrival of one and the departure of the other is within the interval [5; MX_TR_WAI]). In this way, the number of treatments in our analysis becomes 3 × 3 × 2 = 18. Note that each treatment represents a different strategy to try to improve the connectivity, so an analysis of its effects will be of interest.

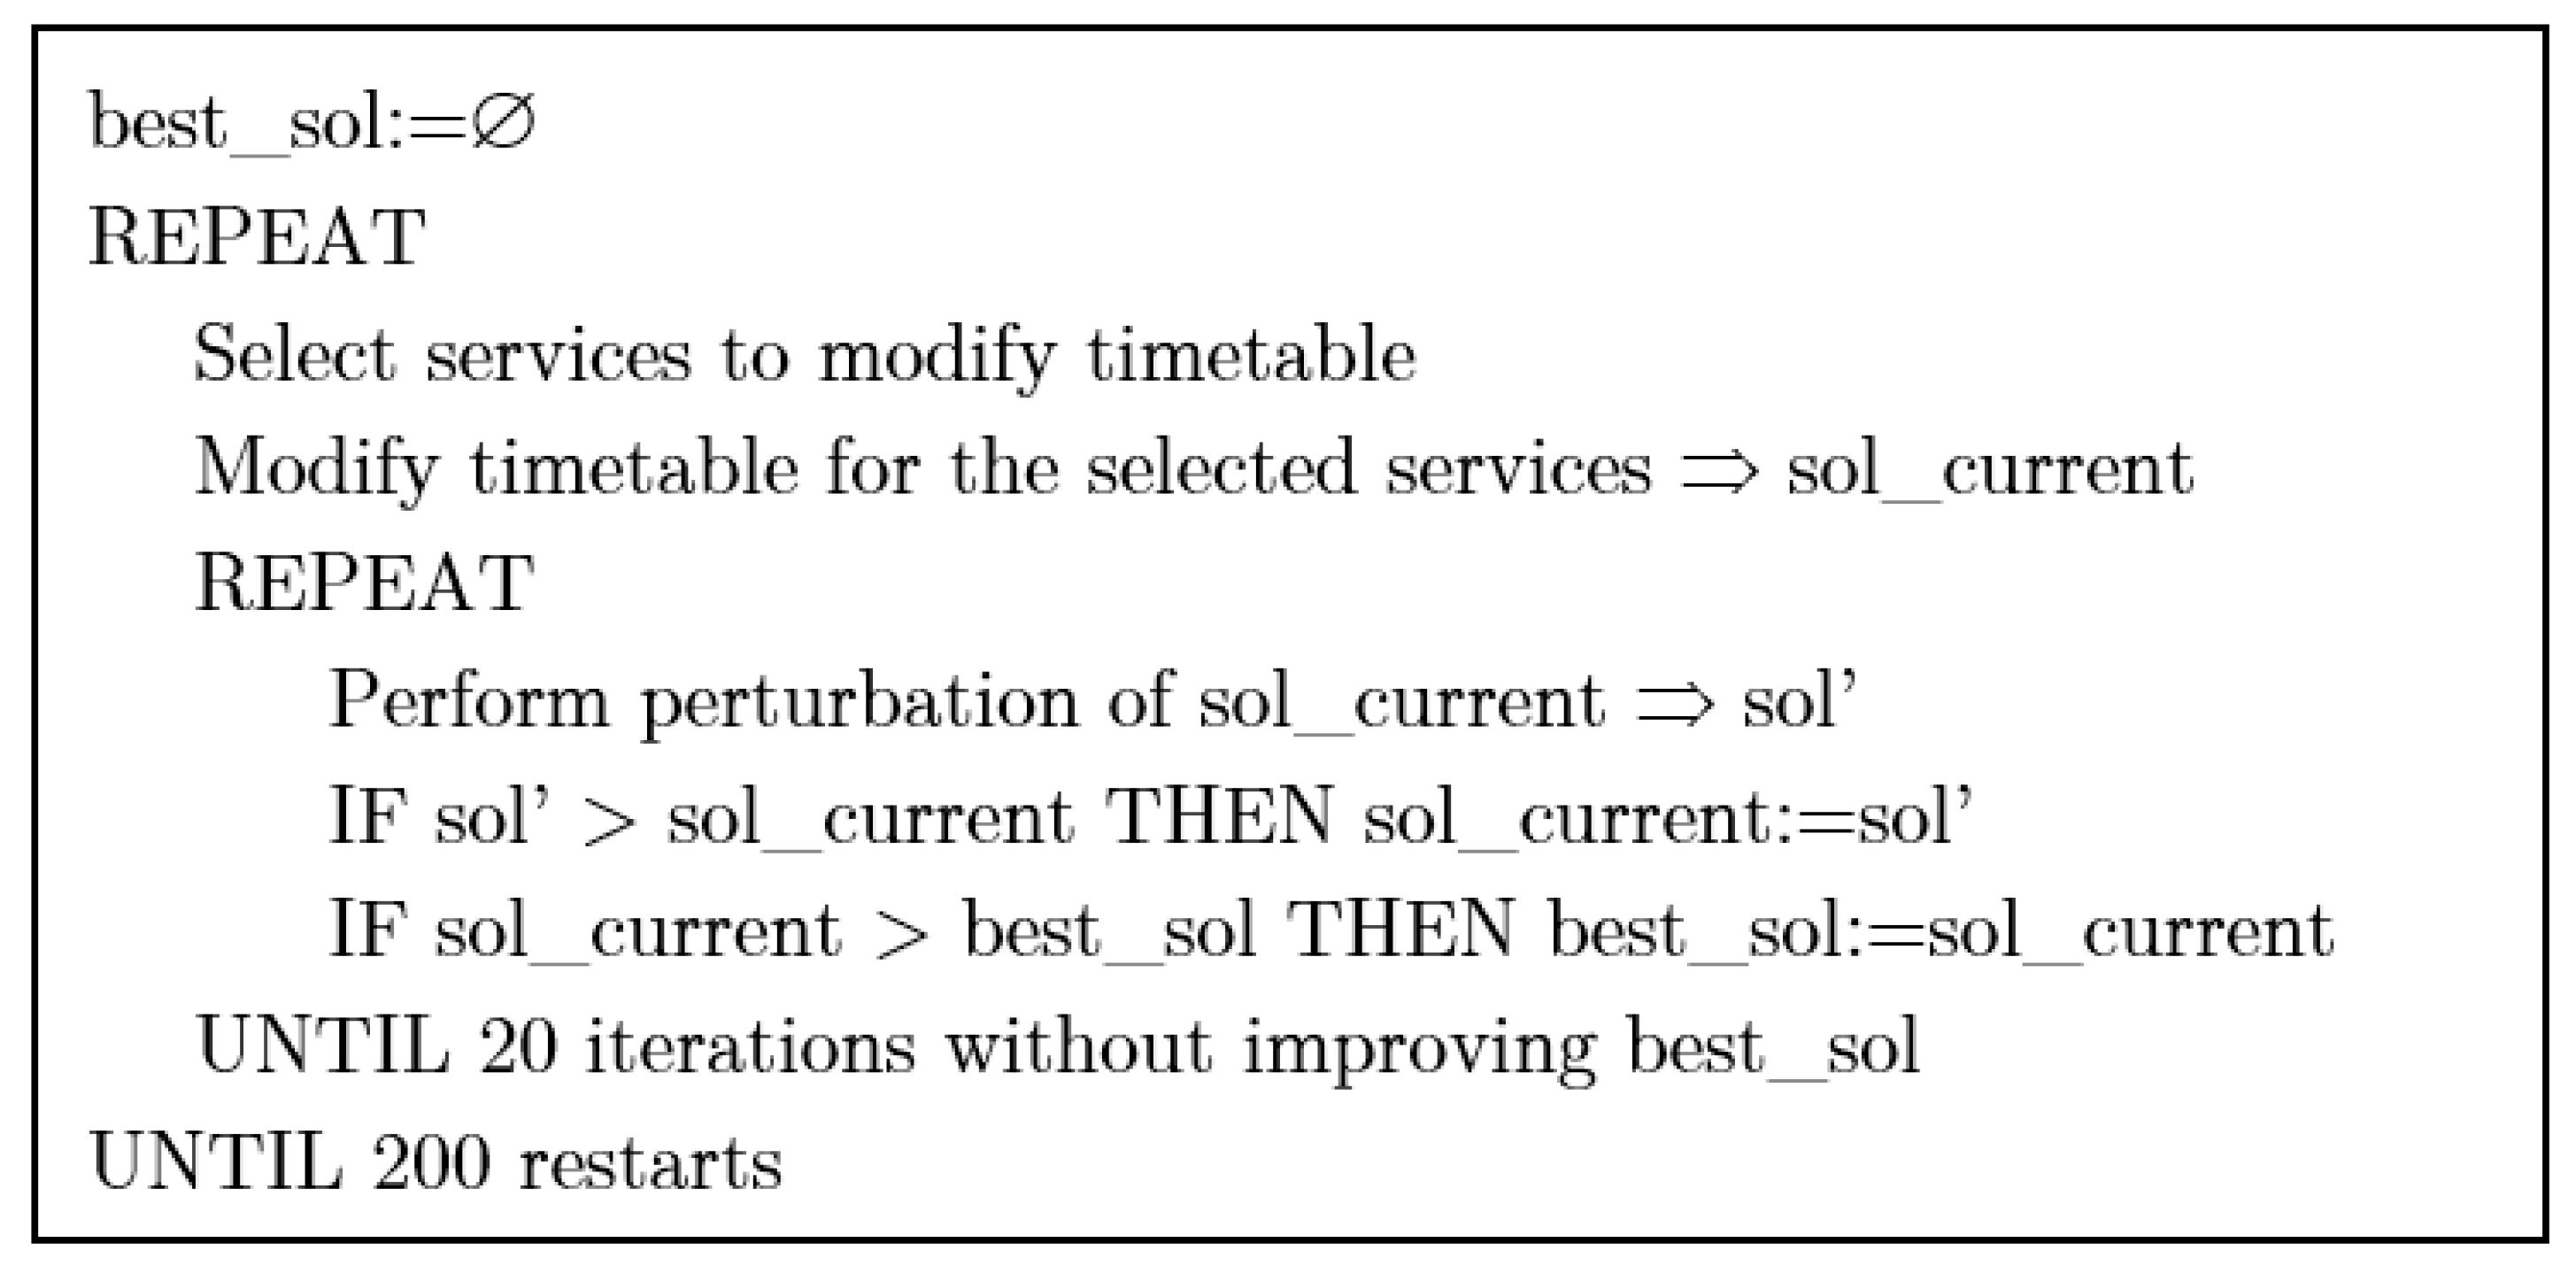
3.2. Algorithm to Find Better Schedules
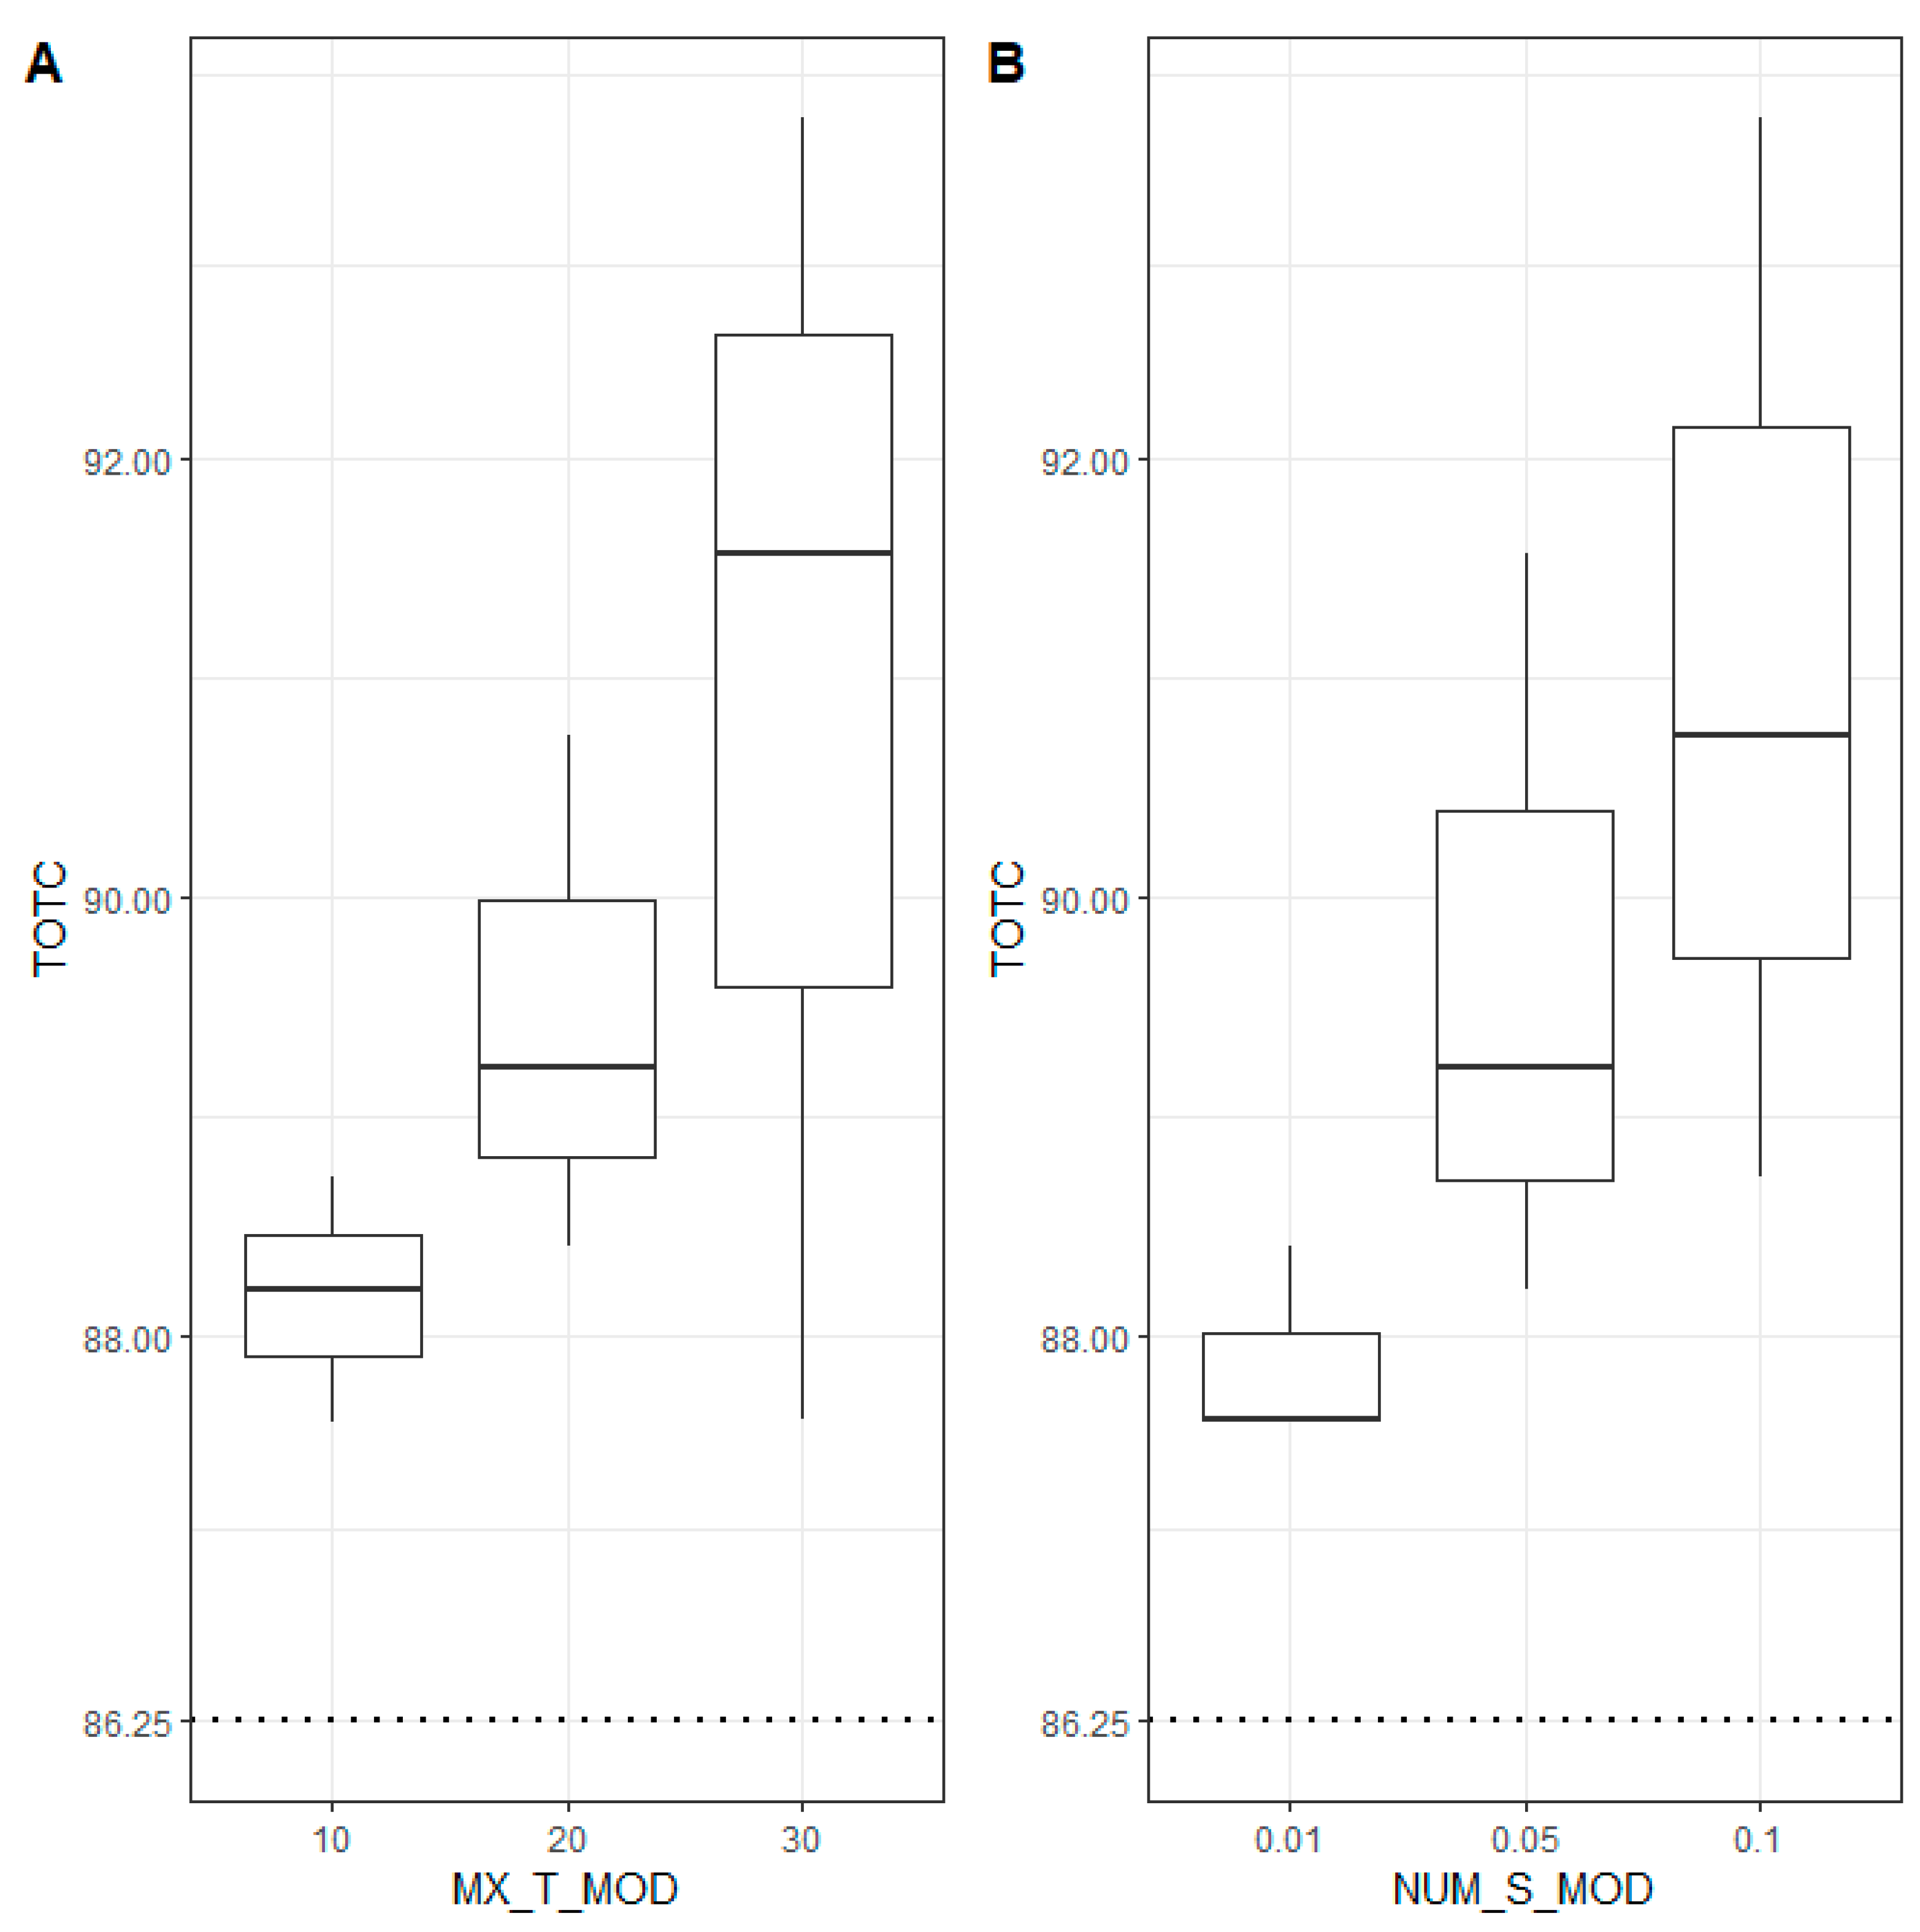
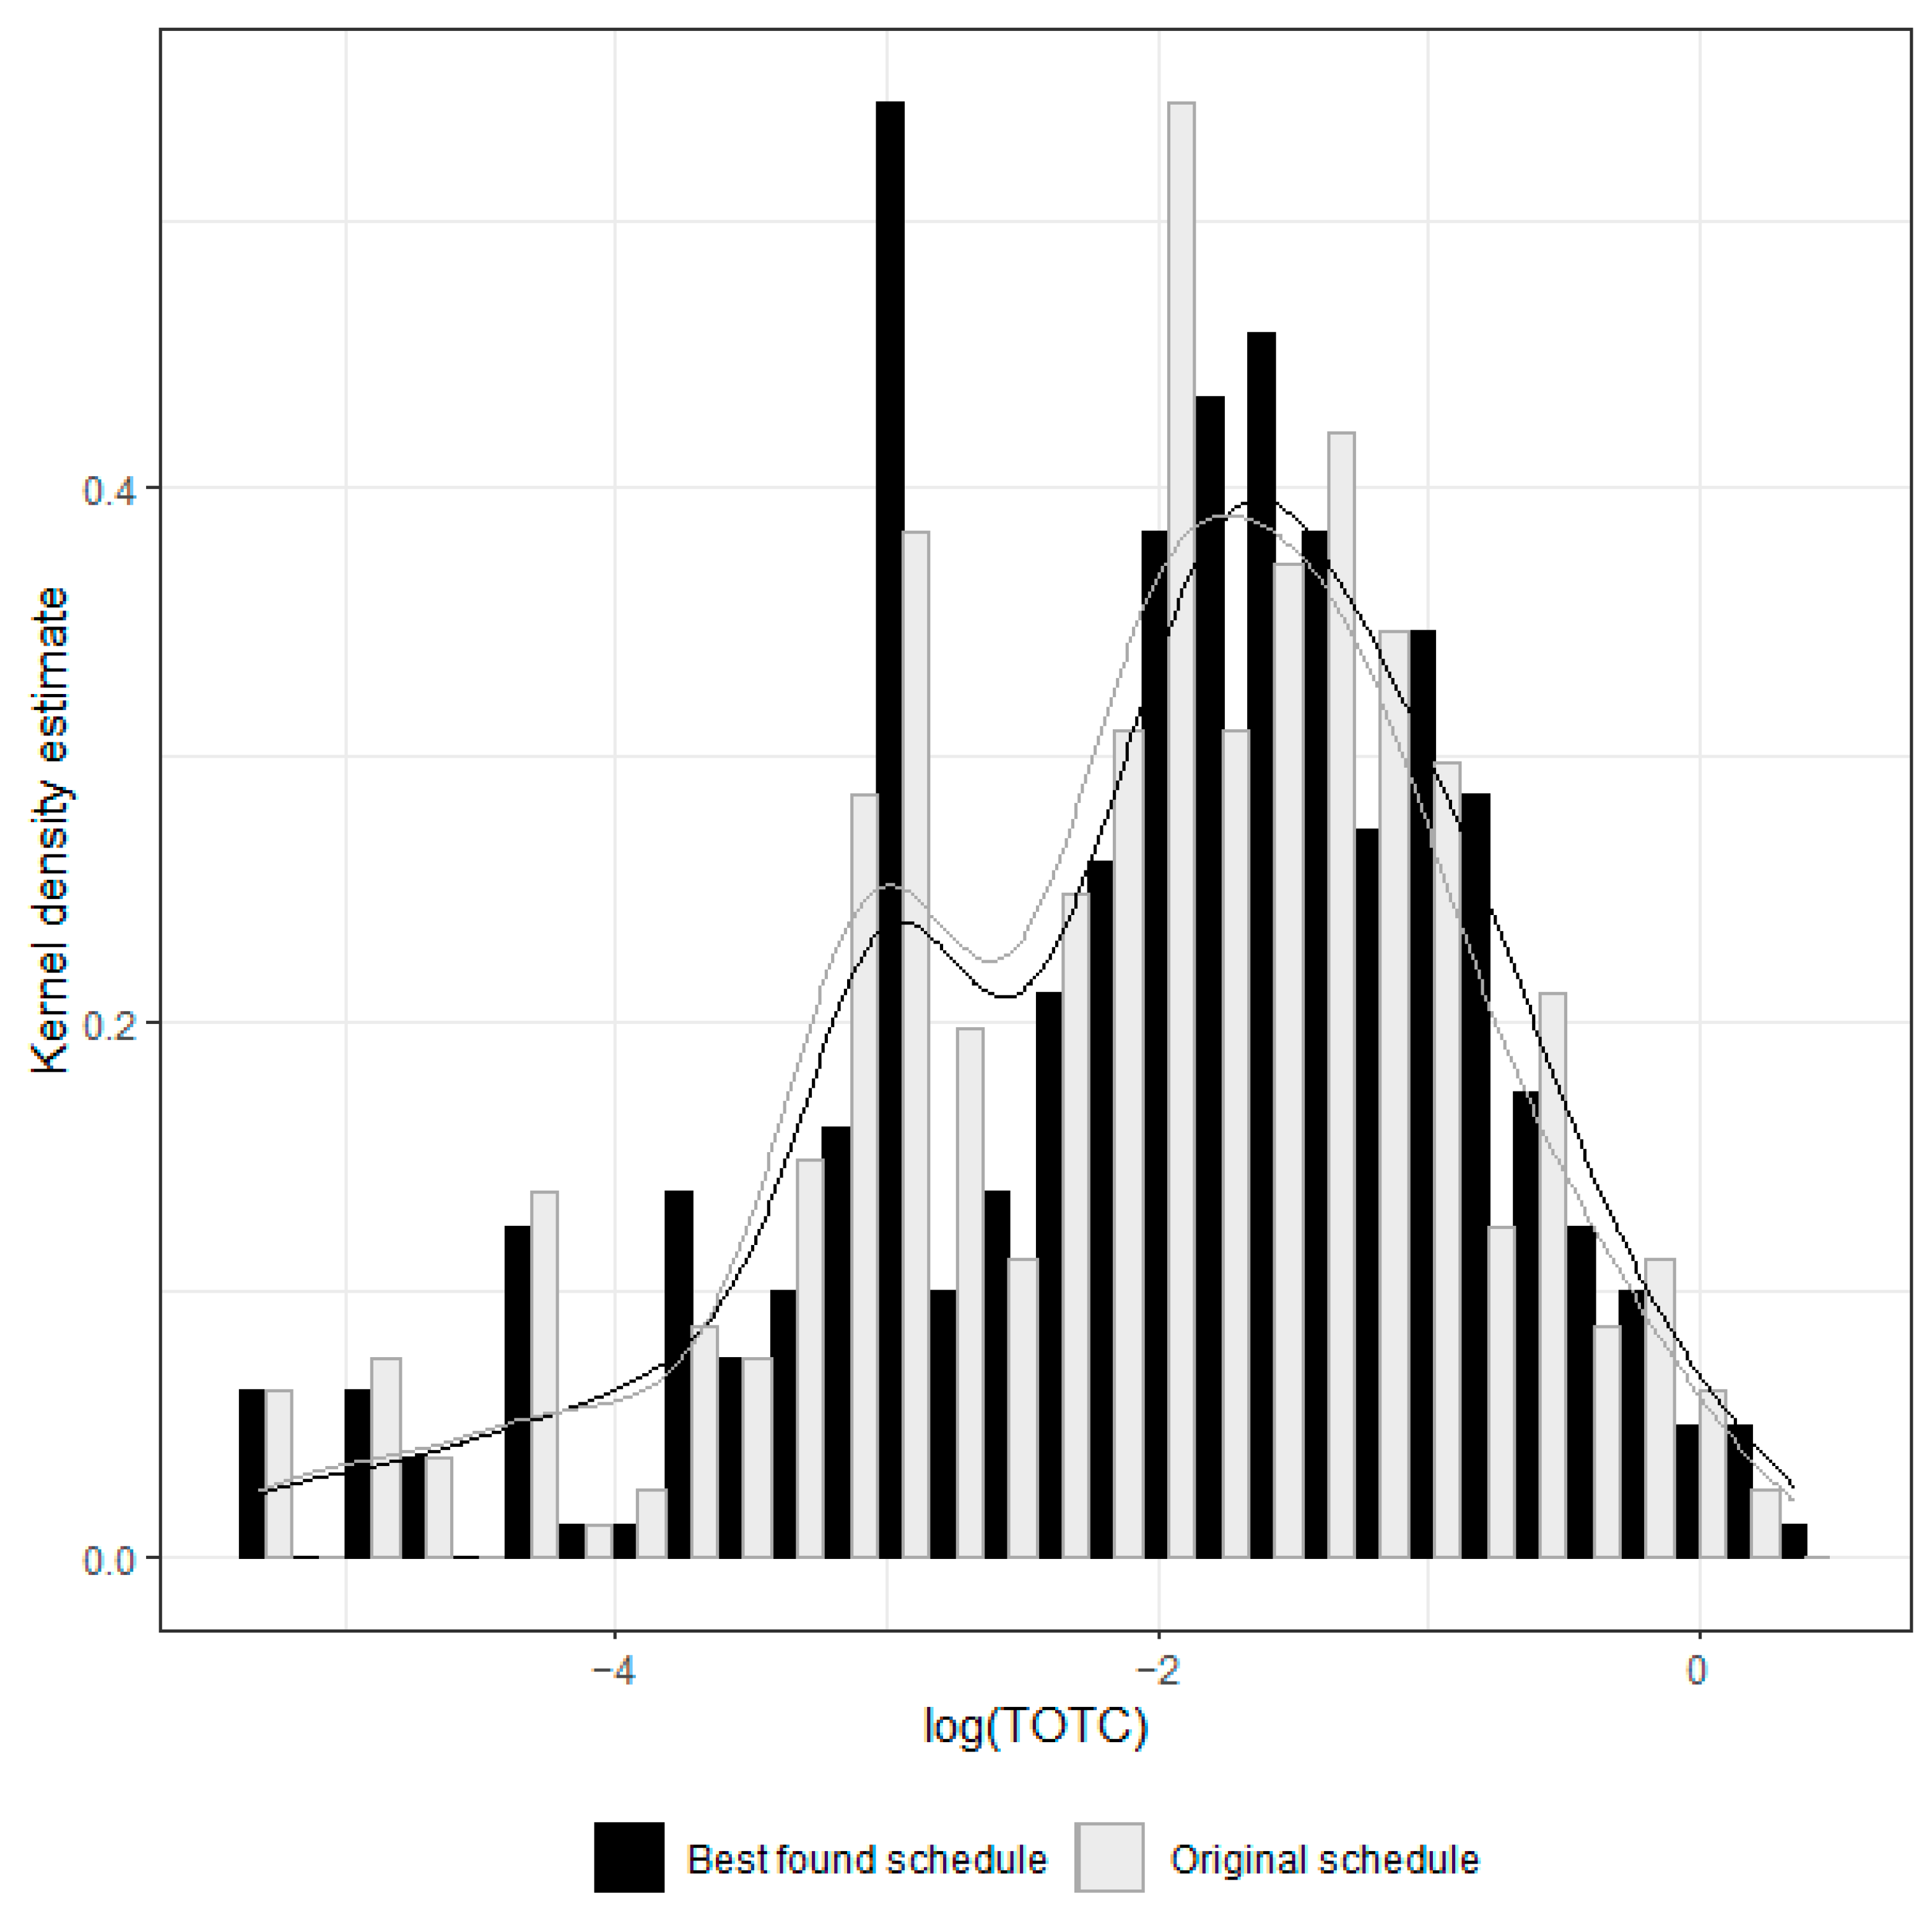
Given the current schedule of the services considered, it is straightforward to calculate a V × V matrix A where av,v counts the number of weekly services directly connecting city v and v’ without requiring passengers to change trains. In the same way, matrix B of order V × V could count the number of additional connections available between two cities, considering the time of calling at each station and taking into account an acceptable waiting transfer time of MX_TR_WAI minutes to another service. In this way, the total number of weekly services between any two cities can be evaluated as fv,v’ = av,v’ + bv,v’, and the corresponding closeness centrality CC(v) is evaluated for each station.
Of course, since the routes of the services are not modified, changing the departure time of a service will not change values av,v, but it can indeed change bij as connections among services could be different. Therefore, a solution in our case will be a vector sol of size S where sol[s]∈±MX_T_MOD forces that service s will depart with a delay of sol[s] with respect to the current departure time. As a result, associated with a solution sol a measure of its connectivity can be defined as the total Closeness Centrality TOTCsol = Σv CC(v).
Given the computational burden of evaluating the centrality of so many different networks when looking for a positive solution, it was necessary to define an algorithm that could make a good exploration of the solution space, not in an exhaustive way. With that purpose, a heuristic procedure inspired by the logic of Iterated Local Search (ILS) [40] was designed (see Figure 2). It forces a number of restarts (200), each starting with a selection of services whose departure time is to be modified (selected in an adaptive way considering the services selected in the previous iteration). The number of services to be modified is defined by parameter NUM_S_MOD. Then, an initial solution is defined modifying the schedules of those services in the range ±MX_T_MOD, taking into account the cities that each service is calling at and the centrality of those cities.
Starting from this current solution, a perturbation is induced in the schedule, obtaining a new solution sol’. If that solution is better (i.e., it results in a higher total centrality of the cities), sol’ becomes the current solution (otherwise, sol’ is ignored) and this process is repeated until 20 of these perturbations in a row are not able to find a better solution than the best found so far. Value TOTCsol* for the best sol* found is recorded for each treatment. The experiments were conducted on an NVIDIA® Jetson AGX Xavier™ device (NVIDIA, Santa Clara, CA, USA) running Ubuntu 18.04. It should be noted that the objective of this paper is to demonstrate the existence of potential improvements in connectivity with slight modifications to the current schedules. Therefore, it has not been considered necessary to analyse the quality of the developed algorithm or to make comparisons with other possible optimisation alternatives.

4. Results

Comparing the EIRN and EIRNt networks introduced in Section 3, the EIRNt results are more than three times denser (16.2% vs. 4.59%) than the EIRN results. The cities connected to more cities by the EIRN (namely, vertices with higher degrees) are Paris (228 cities), Wien (218), and Frankfurt (199). When transfers with less than 30 min waiting are considered, the three best-connected cities are Frankfurt (527 stations), Zurich (496) and Paris (489). If the frequency of connections is included in the ranking, the three stations with the greatest strength in the EIRN are Frankfurt, Wien and Köln, while in the EIRN-t they are Frankfurt, Köln, and Brussels.
After running the search algorithm for the 18 treatments identified in Section 3.1, Table 1 shows the total centralities and the number of pairs of stations connected to both initially, and after modifying the original schedules with the limitation forced in each treatment. Note that Total Closeness Centrality is directly related to the number of paired connected cities; however, it also takes into account the frequency of the services that connect each pair of cities.
We observe that in the original schedule, the TOTC is 86.25 if the maximum waiting time is set to 30 min, and 117.66 for 60 min of waiting time. All treatments show an improvement in the total Closeness Centrality as well as in the number of new pairs of cities connected (i.e., the number of links in the network, card(E)). The treatments with the highest increments of TOTC are for MX_TR_WAI = 30 min, MX_T_MOD = 30 min, and NUM_S_MOD ≥ 0.05, with an increase of up to 8.46% in the network centrality, and 2004 new pairs of cities connected.
A detailed description of the centrality for each station in the 18 treatments can be seen in Figure 3. Although a better schedule than the current one is found for all the treatments (i.e., having a larger TOTC meaning that most stations increase connectivity), it can be seen that in each case a number of stations reduce their centrality by an average of 19.2% per treatment. The worst case was the city of Oslo, with a ratio of 0.33 (treatment 30/30/0.05), while on the other hand, some cities increased their ratios by up to 680%, as in the case of Caceres-Spain in treatment 30/30/0.10. The results show that only one station, Giurgiu—Romania, has reduced its CC(v) in all the treatments, while 10 stations seem to be immune to this procedure and have not seen a modification of their CC(v) in any treatment (this was seen in Cambridge—UK, Vilnius—Lithuania, and Patra—Greece, for instance).
On the other hand, when looking for the services most capable of improving the connectivity of the network—that is, having more potential to expedite transfer connections by changing their timetables—Figure 4 shows which 50 services have had the most influence on improving the schedules, considering all 18 treatments.
Table 1 also shows the number of communities (sets of stations with a stronger connection among them) in each treatment, applying the Walktrap algorithm [41], based on a hierarchical clustering algorithm to merge connected communities whose similarity metric is based on random walks. Comparing the initial and final configuration for each treatment, for MX_TR_WAI = 30 min, the number of communities tends to remain stable at 26 communities, while for MX_TR_WAI = 60 min the number of communities tends to slightly decrease.
Comparing the impact of the different factors on total centrality, the Wilcoxon test shows significant differences for the MX_TR_WAI factor (p ≈ 0.0). Although improved closeness centrality when the maximum waiting time is 60 min is clearly higher (μ = 119.49 min) than for 30 min (μ = 89.52), for MX_TR_WAI = 30 min the percentage increase in TOTC is proportionally higher. As this scenario is also more convenient for passenger comfort, we will now focus on treatments with MX_TR_WAI equal to 30 min. Regarding the other two factors, MX_T_MOD and NUM_S_MOD, a Kruskal–Wallis test does not show any significant differences on CC(v) (resp. p = 0.84, p = 0.76).
Obviously, as the number of services modified or the size of the change in the schedules increases, Closeness Centrality improves. Even with small changes in these factors (modification of only ±10 min or affecting only 1% of the services), the metric shows a notable impact (Figure 5), which is more evident in the case of the range of the minutes modified than in the number of services.
Focusing on the treatment with a higher increment in centrality (namely treatment 30/30/0.10), Figure 6 shows the distribution of the centralities in the case of the current schedule and the best-found solution. As can be seen, there is a shift to the right of the curve as the centralities have been improved. The 15 cities that have experienced a higher increment in their Closeness Centrality and those with a higher reduction are displayed in Figure 7.
Finally, so far, we have been considering that any international railway trip is limited to a maximum of 15 h travel. In a further asymptotic analysis, comparing the improvement in the centrality, if there were no limitation in the length of the trip, it was observed that only in the case of factor MX_TR_WAI would the potential improvement in centrality be even higher (p ≈ 0.0). For the other two factors, there is no significant improvement (p = 0.57, p = 0.38).

5. Discussion

Looking at the results using the data from the international European railway network, all 18 treatments show important opportunities for improvement. Even for the more restrictive scenarios, hundreds of new connections can be set by changing the departure time of a few services by just ten minutes. This indicates that current timetables were not defined for good connectivity among services, but for the point-to-point demand of each railway service. Given that public transportation must be promoted due to the increase in energy costs and wider environmental concerns, it is important to expand available destinations to passengers, and this can be achieved with a small effort as proven. It has been shown that changing the departure time of only 5% of the European international services by at most 30 min could offer nearly 1500 new connections to travellers weekly.
The higher percentage of improvements is obtained under the hypothesis that passengers are willing to wait 30 min at an intermediate station for transfers. Considering longer waiting times, although the centralities are much higher, the potential benefits of changing timetables are not so important.
These measures must be developed from a global point of view. It is natural that improving the total connectivity implies that while most of the stations benefit from the changes, some others reduce their connections. In fact, an average of 19% of the stations are expected to not benefit from this action. However, total closeness centrality can be increased by up to 8.5%.
Looking at which services have more potential to improve connectivity by changing schedules, most are located in northern and eastern France and central Europe. This is unsurprising, as their central positioning in the network means they can easily serve as a bridge with more services.
Under the current deregulated European railway industry, the train operating companies (TOCs) compete on the track for the customer by offering a good service, which includes a good timetable. However, they also compete for the market through tendering, in return for a subsidy from a national authority [42]. This mechanism could be useful for the coordination that this research shows is needed.

6. Conclusions

The Closeness Centrality is a good metric for measuring the connectivity of the railway network. In the experimental framework developed in this paper, different treatments have shown the impact on TOTC from the three factors considered (number of services affected, intensity of the timetable change, and the waiting time a passenger is willing to accept for transfers in a station). The latter is the only significant factor improving TOTC, and, assuming a waiting time of 30 min, even small changes in the schedules imply a remarkable connectivity improvement. Limiting the total length of the international trip to 15 h resulted in no hard constraint in the results.
These results should induce railway operators to pay special attention to the timetables of passenger services in order to facilitate interconnections among them. Good coordination, involving few changes to the current timetables, could easily mean improvements of 10% in the connectivity of the network, easing the travel of the passengers and offering a wider range of potential destinations.
Once the level of improvement that could be achieved with small schedule changes has been established through the experimentation carried out, the next question that might arise is to what extent these improvements are actually attainable through the effective implementation of the changes. Of course, changing timetables, even if only by a few minutes, requires verifications to be implemented that have to do with line occupancy or the availability of other resources. In any case, these results give an idea of the potential for improvement that could be achieved, and the importance of considering these transfer aspects.
A further study could take into consideration the population affected by the changes in the schedules. As not all the cities in the network are of similar size, perhaps the objective could be to increase the potential connectivity of some of the cities, particularly the most populated, showing an even higher weighted centrality of the whole network after the timetables change.

Author Contributions

Conceptualization, B.A.-D.; methodology, L.C.-I.; software, S.G.C.; validation, S.G.C.; formal analysis, L.C.-I.; investigation, S.G.C.; resources, B.A.-D.; data curation, S.G.C.; writing—original draft preparation, L.C.-I.; writing—review and editing, B.A.-D.; visualization, L.C.-I.; supervision, B.A.-D.; project administration, B.A.-D.; funding acquisition, B.A.-D. All authors have read and agreed to the published version of the manuscript.

Funding

This research was carried out with the financial support of Grant PID2021-123515NB-I00 funded by MICIU/AEI/10.13039/501100011033 and by ERDF/EU.

Data Availability Statement

Data can be requested to the authors.

Conflicts of Interest

The authors declare no conflict of interest.

References

  1. Zhang, Z.; Li, X.; Li, H. A quantitative approach for assessing the critical nodal and linear elements of a railway infrastructure. Int. J. Crit. Infrastruct. Prot. 2015, 8, 3–15. [Google Scholar] [CrossRef]
  2. European Commision. Priorities for 2021–2027. Available online: https://ec.europa.eu/regional_policy/policy/how/priorities_en?etrans=hr (accessed on 8 February 2022).
  3. European Commission. Cohesion Policy Investments on Track for Rail Transport. 2021. Available online: https://ec.europa.eu/regional_policy/en/newsroom/panorama/2021/03/03-12-2021-cohesion-policy-investments-on-track-for-rail-transport (accessed on 19 August 2024).
  4. EUROSTAT. Energy, Transport and Environment Statistics: 2020 Edition; European Union: Luxembourg, 2020. [Google Scholar]
  5. Debrezion, G.; Pels, E.; Rietveld, P. Modelling the joint access mode and railway station choice. Transp. Res. Part E 2009, 45, 270–283. [Google Scholar] [CrossRef]
  6. Chowdhury, S.; Ceder, A. Definition of Planned and Unplanned Transfer of Public Transport Service and User Decisions to Use Routes with Transfers. J. Public Transp. 2013, 16, 1–20. [Google Scholar] [CrossRef]
  7. Etgen, B. Connecting with Transit: Using Connectivity to Align and Schedule Transit Service. J. Public Transp. 2022, 24, 100012. [Google Scholar] [CrossRef]
  8. Hu, Y.; Li, S.; Dessouky, M.M.; Yang, L.; Gao, Z. Computationally efficient train timetable generation of metro networks with uncertain transfer walking time to reduce passenger waiting time: A generalized Benders decomposition-based method. Transp. Res. Part B 2022, 163, 210–231. [Google Scholar] [CrossRef]
  9. Roy, S.; Maji, A. High-Speed Rail Station Location Optimization Using Customized Utility Functions. IEEE Intell. Transp. Syst. Mag. 2023, 15, 26–35. [Google Scholar] [CrossRef]
  10. Liu, T.; Cats, O.; Gkiotsalitis, K. A review of public transport transfer coordination at the tactical planning phase. Transp. Res. Part C Emerg. Technol. 2021, 133, 103450. [Google Scholar] [CrossRef]
  11. Calzada-Infante, L.; Adenso-Díaz, B.; García Carbajal, S. Analysis of the European international railway network and passenger transfers. Chaos Solitons Fractals 2020, 141, 110357. [Google Scholar] [CrossRef]
  12. Bhatia, U.; Kumar, D.; Kodra, E.; Ganguly, A.R. Network science based quantification of resilience demonstrated on the indian railways network. PLoS ONE 2015, 10, e0141890. [Google Scholar] [CrossRef]
  13. Wang, W.; Cai, K.; Du, W.; Wu, X.; Tong, L.C.; Zhu, X.; Cao, X. Analysis of the Chinese railway system as a complex network. Chaos Solitons Fractals 2020, 130, 1–13. [Google Scholar] [CrossRef]
  14. Xu, W.A.; Zhou, J.; Qiu, G. China’s high-speed rail network construction and planning over time: A network analysis. J. Transp. Geogr. 2018, 70, 40–54. [Google Scholar] [CrossRef]
  15. But, T.; Prokhorchenko, A. Investigation into Train Flow System on Ukraine’s Railways with Methods of Complex Network Analysis. Am. J. Ind. Eng. 2013, 1, 41–45. [Google Scholar]
  16. Feng, X.; He, S.; Li, G.; Chi, J. Transfer network of high-speed rail and aviation: Structure and critical components. Phys. A Stat. Mech. Its Appl. 2021, 581, 126197. [Google Scholar] [CrossRef]
  17. Lin, J.; Ban, Y. Complex Network Topology of Transportation Systems. Transp. Rev. 2013, 33, 658–685. [Google Scholar] [CrossRef]
  18. Kinder, M. Models for Periodic Timetabling. Master’s Thesis, Technische Universität Berlin, Berlin, Germany, 2008. [Google Scholar]
  19. Li, Y.; Han, B.; Zhao, P.; Yang, R. Collaborative optimization for train stop planning and train timetabling on high-speed railways based on passenger demand. PLoS ONE 2023, 18, e0284747. [Google Scholar] [CrossRef] [PubMed]
  20. Serafini, P.; Ukovich, W. A mathematical model for periodic scheduling problems. SIAM J. Discret. Math. 1989, 2, 550–581. [Google Scholar] [CrossRef]
  21. Polinder, G.J.; Schmidt, M.; Huisman, D. Timetabling for strategic passenger railway planning. Transp. Res. Part B Methodol. 2021, 146, 111–135. [Google Scholar] [CrossRef]
  22. Liebchen, C. The First Optimized Railway Timetable in Practice. Transp. Sci. 2008, 42, 420–435. [Google Scholar] [CrossRef]
  23. Drábek, M.; Mazel, D.; Pospíšil, J. High-speed rail network and periodic timetable: A comparative analysis of operational concepts. Acta Polytech. CTU Proc. 2021, 31, 5–9. [Google Scholar] [CrossRef]
  24. Cacchiani, V.; Huisman, D.; Kidd, M.; Kroon, L.; Toth, P.; Veelenturf, L.; Wagenaar, J. An overview of recovery models and algorithms for real-time railway rescheduling. Transp. Res. Part B Methodol. 2014, 63, 15–37. [Google Scholar] [CrossRef]
  25. Caprara, A.; Monaci, M.; Toth, P.; Guida, P.L. A Lagrangian heuristic algorithm for a real-world train timetabling problem. Discret. Appl. Math. 2006, 154, 738–753. [Google Scholar] [CrossRef]
  26. Huan, N.; Hess, S.; Yao, E. Understanding the effects of travel demand management on metro commuters’ behavioural loyalty: A hybrid choice modelling approach. Transportation. 2022, 49, 343–372. [Google Scholar] [CrossRef]
  27. Schakenbos, R.; Paix, L.L.; Nijenstein, S.; Geurs, K.T. Valuation of a Transfer in a Multimodal Public Transport Trip. Transp. Policy 2016, 46, 72–81. [Google Scholar] [CrossRef]
  28. Park, J.; Chowdhury, S. Investigating the Needs of People with Disabilities to Ride Public Transport Routes Involving Transfers. J. Public Transp. 2022, 24, 100010. [Google Scholar] [CrossRef]
  29. Yu, D.; Xu, H.; Chen, W.; Yao, J. Synchronized optimization of last trains’ timetables in mass rail transit networks based on extra dwell time. J. Phys. Conf. Ser. 2019, 1176, 052034. [Google Scholar] [CrossRef]
  30. Vansteenwegen, P.; Van Oudheusden, D. Decreasing the passenger waiting time for an intercity rail network. Transp. Res. Part B Methodol. 2007, 41, 478–492. [Google Scholar] [CrossRef]
  31. Potter, J. European Rail Timetable Limited; Woodcock, C., Ed.; Issue May; CPI Group (UK) Ltd.: Croydon, UK, 2018. [Google Scholar]
  32. Das, K.; Samanta, S.; Pal, M. Study on centrality measures in social networks: A survey. Soc. Netw. Anal. Min. 2018, 8, 13. [Google Scholar] [CrossRef]
  33. Prabhakar, N.; Anbarasi, L.J. Exploration of the global air transport network using social network analysis. Soc. Netw. Anal. Min. 2021, 11, 12. [Google Scholar] [CrossRef]
  34. Jiao, J.; Wang, J.; Jin, F. Impacts of high-speed rail lines on the city network in China. J. Transp. Geogr. 2017, 60, 257–266. [Google Scholar] [CrossRef]
  35. Wei, S.; Teng, S.N.; Li, H.J.; Xu, J.; Ma, H.; Luan, X.L.; Yang, X.; Shen, D.; Liu, M.; Huang, Z.Y.X.; et al. Hierarchical structure in the world’s largest high-speed rail network. PLoS ONE 2019, 14, e0211052. [Google Scholar] [CrossRef]
  36. Liu, X.; Jiang, C.; Wang, F.; Yao, S. The impact of high-speed railway on urban housing prices in China: A network accessibility perspective. Transp. Res. Part A Policy Pract. 2021, 152, 84–99. [Google Scholar] [CrossRef]
  37. Chen, J.; Li, W.; Wu, B.; Yu, Z. Does High-Speed Railway Promote the Quality of Urbanization? From a Dynamic Network Perspective. Systems 2023, 11, 523. [Google Scholar] [CrossRef]
  38. Dangalchev, C. Residual closeness in networks. Phys. A Stat. Mech. Its Appl. 2006, 365, 556–564. [Google Scholar] [CrossRef]
  39. Wheat, P.; Wardman, M. Effects of timetable related service quality on rail demand. Transp. Res. Part A 2017, 95, 96–108. [Google Scholar] [CrossRef]
  40. Hoos, A.H.; Stützle, T. Stochastic Local Search Foundations and Applications; Morgan Kaufmann Pub.: San Francisco, CA, USA, 2005. [Google Scholar]
  41. Pons, P.; Latapy, M. Computing communities in large networks using random walks. J. Graph Algorithms Appl. 2006, 10, 191–218. [Google Scholar] [CrossRef]
  42. Perennes, P. Use of combinatorial auctions in the railway industry: Can the ‘invisible hand’ draw the railway timetable? Transp. Res. Part A 2014, 67, 175–187. [Google Scholar] [CrossRef]
Figure 1. Map of Europe with the international routes considered [31].
Systems 12 00327 g001
Figure 2. Schematic logic of the search process.
Systems 12 00327 g002
Figure 3. Ratio between the Closeness Centrality of the best-found solution and the original schedule for each station for the 18 treatments.
Systems 12 00327 g003
Figure 4. Map of Europe showing the 50 railway services whose timetable modification contributes more to increase the average Closeness Centrality over the 18 scenarios.
Systems 12 00327 g004
Figure 5. Boxplot of total Closeness Centrality according to factors (A) MX_T_MOD and (B) NUM_S_MOD (transfer time of 30 min).
Systems 12 00327 g005
Figure 6. Kernel density estimate of the log-Centralities for the original schedule and in the best-found solution for the treatment 30/30/0.10.
Systems 12 00327 g006
Figure 7. Map of Europe showing the 15 cities with the largest increment (blue triangle) and the largest decrement (red circle) of Closeness Centrality in the best solution found for treatment 30/30/0.1.
Systems 12 00327 g007
Table 1. Closeness Centrality and number of connections for the baseline and the best-found solution for the 18 treatments (into brackets the percentage of increase from the original schedule).
MX_
TR_
WAI
MX_
T_
MOD
NUM_
S_
MOD
Original ScheduleBest Schedule Found
TOTC Pairs of Cities ConnectedC (*)TOTCPairs of Cities ConnectedC (*)
30100.0186.2527,4492687.60 [1.57%]27,853 [1.47%]26
0.052688.21 [2.27%]27,961 [1.87%]26
0.102688.72 [2.86%]28,133 [2.49%]25
200.012688.41 [2.50%]28,055 [2.21%]26
0.052689.22 [3.44%]28,303 [3.11%]26
0.102690.73 [5.19%]28,804 [4.94%]25
300.012687.63 [1.60%]27,804 [1.29%]26
0.052691.57 [6.17%]28,957 [5.49%]26
0.102693.55 [8.46%]29,453 [7.30%]27
60100.01117.6635,005 25118.80 [0.97%]35,290 [0.81%]25
0.0525118.74 [0.92%]35,249 [0.70%]24
0.1025119.49 [1.56%]35,447 [1.26%]23
200.0125118.84 [1.00%]35,287 [0.81%]25
0.0525119.70 [1.73%]35,466 [1.32%]24
0.1025119.90 [1.90%]35,538 [1.52%]23
300.0125119.16 [1.27%]35,400 [1.13%]24
0.0525119.86 [1.87%]35,490 [1.39%]24
0.1025120.90 [2.75%]35,767 [2.18%]25
(*) Total number of communities identified in the network.
Disclaimer/Publisher’s Note: The statements, opinions and data contained in all publications are solely those of the individual author(s) and contributor(s) and not of MDPI and/or the editor(s). MDPI and/or the editor(s) disclaim responsibility for any injury to people or property resulting from any ideas, methods, instructions or products referred to in the content.

