Abstract
Although the adoption of green innovation has been explored in various contexts, there is still a lack of research on the determinants of green technology innovation adoption (GTIA) in the third-party logistics (3PL) industry of emerging economies and the resulting economic, environmental, operational, and intangible outcomes. This study aims to investigate the influence of different determinants of technological, organizational, and environmental factors in the TOE-DOI framework on the adoption of green technology innovation, as well as the outcomes of such adoption. The study utilizes sample data from 544 Chinese 3PL firms and employs two-stage structural equation modeling and artificial neural network analysis. Partial least squares structural equation modeling (PLS-SEM) explains 85.4% of the variance in green technology innovation adoption, 21% in environmental outcomes, 18.5% in economic outcomes, 20.8% in operational outcomes, and 22.3% in intangible outcomes. The artificial neural network (ANN) model ranks the standardized importance of each predictive variable. The results indicate that institutional pressure is the most significant determinant of GTIA. Additionally, 3PL firms should consider the positive impact of green supplier integration and relative advantage. Complexity does not have a positive impact on GTIA. The longer a company has been established, the more experience and resources it accumulates, and the more opportunities it has to adopt green technology innovation. This study contributes to the existing research on emerging economies and other regions. Furthermore, this is the first study to successfully validate the nonlinear relationship within the Technology-Organization-Environment (TOE) framework and diffusion of innovation (DOI) theory, namely the TOE-DOI framework. The research findings further enhance the current understanding of green technology innovation adoption and its impact. This study provides valuable insights for managers and policymakers in the 3PL industry to achieve various effects, such as environmental, economic, operational, and intangible outcomes.
1. Introduction
The objective of the United Nations Climate Change Conference (2021) resolution is to achieve carbon neutrality by 2050. From the standpoint of carbon neutrality, green development has become a shared vision among countries [1]. Business operations, including procurement, manufacturing, and logistics, are the primary contributors to environmental concerns [2]. Logistics and transportation activities make substantial contributions to global greenhouse gas emissions [3]. With the continuous integration of transportation and logistics systems, their impact on the natural environment will become a major concern [4]. This is because the transportation sector is one of the major contributors to global energy consumption and air emissions, accounting for approximately 24% of the world’s carbon dioxide emissions from fuel combustion [5]. Additionally, the logistics industry leads all sectors in oil consumption [6]. Within this sector, road transportation accounts for three-quarters of the total transportation emissions, with trucks that are used for freight transport contributing 29.4% [5].
Green technology innovation (GTI) and clean energy are significant factors in achieving carbon neutrality objectives [7]. Given the dual constraints of resources and the environment, the urgency of GTI is increasing. [8]. GTI and clean energy are significant factors in achieving carbon neutrality objectives. Duly, recent advancements in green and innovative technologies have driven more innovation in manufacturing operations, thus further accelerating sustainable development [9]. An increasing number of organizations have integrated green innovation as a crucial component of their strategies to mitigate the negative impacts of traditional growth models [6]. Correspondingly, Müller’s study on political economy emphasizes that innovation and nature play a pivotal role in achieving sustainable economic development, which in turn relies on the efforts of organizations, institutions, and policies, such as the implementation of stricter environmental regulations that promote environmental innovation by enhancing firms’ technical efficiency, thereby fostering sustainable economic growth. These efforts aim to increase and improve wealth in a manner that ensures long-term environmental, social, and economic well-being [10]. In comparison to traditional economic development models, GTI plays a crucial role in attaining sustainable development goals [11] and has the least adverse impact on the natural environment [12]. The significance of green technology innovation for sustainable development has been widely acknowledged [13,14,15]. More importantly, green innovation will be a crucial driver for achieving sustainable economic growth in developing countries [16,17]. Moreover, GTI has the potential to address environmental pollution issues [16].
However, the development of green technology entails a lengthy exploration process, does not guarantee immediate success, and may involve numerous exploratory failures [18]. Firms often have weak incentives to engage in green innovation [19]. The complexity and specificity of green technology, along with the immaturity of the green market, lead to higher costs, increased market risks, and longer investment return cycles for companies that are engaged in green technology innovation activities [20]. Some managers within organizations view the adoption of environmental practices as a burden and adopt a passive approach to these practices [21]. For instance, in comparison to general innovation, green innovation carries greater risks, requires greater investment, and has a longer return on investment period [22]. Therefore, for companies to successfully integrate green technology initiatives into their operations, they must understand the factors that will enhance the stakeholders’ social acceptance [9]. Additionally, it is crucial for businesses to comprehend the impact of these factors on the economy, operations, and intangible aspects. Nevertheless, there is limited empirical research on the determinants and outcomes of green innovation within the service sector [23].
Currently, the participation of emerging-market countries in environmental protection is becoming increasingly crucial for the global economy’s sustainable development [24]. Emerging economies typically refer to countries and regions that are experiencing rapid economic growth and significant market potential but are still in the developmental stage. Emerging economies are currently transitioning towards developed economies by improving production efficiency, enhancing regulatory institutions, and refining market mechanisms. They are in the process of transforming from underdeveloped, low-income traditional economies into modern, advanced industrial economies [25]. China, as the world’s largest emerging economy, is often regarded as a heavily polluted nation and faces tremendous pressure [26] to tackle environmental challenges and reduce carbon emissions [27]. China’s environmental performance and air quality are far below the global average, and since 2008, its environmental performance rankings have consistently been below the top 100 worldwide [28], with a worsening trend annually [29]. China is one of the fastest-growing countries in terms of carbon emissions, with an increase of about 40% in carbon emissions from 2011 to 2020 (China statistical yearbook, 2012–2021). Furthermore, influenced by China’s economic policies and market demands, the logistics industry has developed rapidly in recent years, leading to a gradual increase in carbon emissions [30,31]. Currently, the logistics industry accounts for the largest share of carbon emissions in China’s total energy consumption, mainly from transportation and warehousing activities [31]. China has committed to a more ambitious timeline for achieving carbon neutrality [3]. In pursuit of this goal, China has effectively implemented various environmental policies and regulations to reduce energy consumption and pollution and promote innovation in green technology [1]. For instance, China has achieved some success in imposing environmental protection taxes on businesses [32]. Despite making significant progress in environmental patents and green development, China is still a long way from a future that solely relies on green technology [30]. In the manufacturing industry, green innovation adoption (GIA) faces significant challenges in achieving sustainable development due to various decision factors [9]. Noticeably, research on the determinants of green innovation adoption in the service industry, particularly in the logistics industry, is limited. To address this gap, this study selected Chinese 3PL firms as research subjects to investigate the determining factors and outcomes of green technology innovation adoption in the 3PL industry.
The analysis of China’s 3PL industry provides intriguing insights. The reasons for selecting China’s 3PL industry as the research subject are as follows: (i) China possesses the most intricate natural environment and socioeconomic conditions globally, which pose unprecedented challenges in achieving sustainable green development [33]; (ii) according to IEA [34] statistics, transportation contributes 37% of CO2 emissions in the final user sector due to its dependence on fossil fuels, and China encounters the most significant obstacles in enhancing CO2 reduction, necessitating substantial additional efforts [3]; and (iii) conducting empirical research on China can be compared to other case studies of emerging countries that have been examined in the literature.
This study aimed to address the following research questions: (1) What are the key factors influencing the adoption of green technology innovation among 3PL firms in China? (2) What are the economic, environmental, operational, and intangible outcomes of green technology innovation adoption? (3) How do control variables such as firm size and age affect these relationships? A comprehensive examination of these issues undoubtedly holds significant theoretical implications and policy insights.
The significance of this study lies in its ability to assist 3PL participants in identifying the factors that contribute to the successful adoption of green technology innovations. This knowledge can enable them to gain economic, environmental, operational, and intangible benefits in a highly competitive market environment. Additionally, the adoption of green technology innovations can help organizations address environmental sustainability and foster their own economic and operational growth while also establishing a positive corporate image. This study aimed to achieve the following three objectives.
RO1: This study aimed to investigate the determining factors that influence the adoption of green technology innovations by 3PL utilizing the TOE framework and DOI framework. Additionally, the study sought to rank the importance of these factors.
RO2: The study aimed to explore the potential economic, environmental, operational, and intangible benefits that companies can gain from adopting green technology innovations.
RO3: This objective aimed to analyze the confounding effects of control variables, such as organization size, age, and ownership type, on the adoption of green technology innovations.
The study first introduces the concept of green technology innovation, followed by a review of the relevant literature on green technology innovation adoption. Subsequently, the research model is presented, and several hypotheses are proposed. The findings are then discussed based on the analysis results. Furthermore, the theoretical and practical contributions of the study are elaborated upon. Finally, the article concludes by addressing the limitations of the research and suggesting future directions for further investigations.
2. Theoretical Background, Proposed Research Model, and Hypothesis Development
2.1. Green Technology Innovation Adoption
According to Rogers [35], innovation is “an idea, practice, or object that is perceived as new by an individual or other unit of adoption”. While innovation can refer to abstract things, such as ideas, it can also manifest through new technologies [36]. Research on GTI began to gradually emerge in the 1950s and 1960s, but the academic community has not yet formed a unified concept [8]. A series of discussions about GTI is currently underway, with the term “environmentally sound technologies” being considered the earliest concept [37]. This concept was introduced in 1992 in “Agenda 21” (UNEP, 2012) and pertains to a comprehensive system that emphasizes the promotion of environmental sustainability [38]. Additionally, scholars have noted that GTI is defined as an innovation encompassing pollution prevention and control, waste recycling and utilization, green product development, and environmental governance [39].
Due to the increasing recognition of the value of green innovation in achieving sustainable development [40], an increasing number of organizations have adopted green innovation (GI) as a key component of their strategies to mitigate the negative impacts of traditional growth patterns [11]. Green technology innovation, as an important component of green innovation, has received sustained attention due to growing concern for the environment [41]. Green technology innovation is a means for firms to mitigate the environmental externalities of their production activities and enhance their green competitive advantage [29]. Scholars have pointed out that green technology innovation can mitigate adverse environmental impacts on the production, use, and disposal processes of products [42]. It is the core means of addressing global environmental pollution issues [43]. The adoption of green technologies achieves a win-win situation because they are not only “green” but also offer practical combinations of green technologies, energy, and policies to countries, as well as arrangements for policy incentives [7]. Some organizations have embraced GI as a crucial element of their strategies to alleviate the adverse effects of conventional growth models [11]. Nevertheless, green innovation activities possess certain characteristics, including being knowledge-intensive, having lengthy investment cycles, having high levels of uncertainty, and receiving unrestricted funding from governments [44].
In recent years, the question of whether “green” initiatives are truly worthwhile has been a central topic of debate in both the business and academic communities [45]. Stakeholder pressure, including regulatory influence, positively impacts green product and process innovation and leads to better environmental performance [32]. Firms prefer strategic green innovations that are easier to implement. In China, green innovation in small and medium-sized enterprises (SMEs) mediate the relationship between digital financial inclusion and reduced regional carbon emissions [46]. Digital transformation significantly boosts green innovation by increasing resource investment and lowering debt costs in manufacturing firms. Companies are required to report CSR that outperforms others in green innovation, especially in regions with stricter environmental laws and higher media scrutiny [47]. Yang et al. [31] have revealed a U-shaped relationship between environmental, social, and governance (ESG) ratings and green innovation through which, initially, ESG improvements may reduce innovation; however, collaborative efforts mitigate this effect [48]. Green innovation not only helps firms gain a competitive advantage in the market but also facilitates the connection and coordination between firms and external environments (such as policies, regulations, and market demands), thereby enhancing overall competitiveness [49]. Environmental regulations are also found to positively influence green innovation [50].
Understanding and enhancing the factors that drive green innovation is vital for sustainable development [16]. Several studies have demonstrated that the adoption of green technology and green dynamic capabilities has a significant impact on green product innovation and the competitive advantage of companies [51]. Numerous research contributions have aimed to identify the underlying factors, known as determinants, of green technology innovation, as it is valuable to thoroughly investigate the background factors [1]. Environmental laws and regulations [52], environmental regulations that provide “market incentives” [52], external stakeholders [53], green finance [52], and customer demands [37] can encourage or assist companies in engaging in green technology innovation [53]. Specifically, environmental regulations, technological driving forces, market pull, and firm-specific factors collectively serve as the primary drivers of green innovation [54].
There has been increasing emphasis on researching how factors that are driven by innovation influence ecological innovation behavior and other related variables at the industry level [55]. When incorporating green innovation into a corporate strategy, it is crucial to understand its driving factors and mechanisms to make appropriate adjustments [24]. Currently, a significant amount of research has been conducted on the determinants of green innovation adoption. Some researchers have examined the factors that influence green technology innovation, such as technological capabilities, environmental organizational capabilities, market conditions, competitive pressures, and customer demands for green products [56]. The drivers of green innovation using machine learning algorithms applied to a large dataset from China covering 2010–2019. The findings indicate that ESG ratings are the most significant determinant of green innovation, followed by internationalization, CEO compensation, company sales, industry size, research and development intensity, and CEO education. These studies primarily focus on the capabilities of the organization itself or a specific aspect of the external environment [24]. These studies primarily focus on the capabilities of the organization itself or a specific aspect of the external environment. However, there is limited research on the comprehensive impact of technology, organizations, and the environment on green innovation. Most existing research on green innovation adoption primarily focuses on identifying the impact of one or several determinants of its adoption. For example, some studies have explored the influence of green relational capital in the external environment on the adoption of environmental innovation [57], while many studies have concentrated on the manufacturing sector [9,57]. Given the significance of shippers and logistics service providers in the supply chain, the factors that drive their involvement in green logistics (purchasing or providing) are receiving increasing attention in the academic community [58]. According to Zailani et al. [4], green innovation has had a substantial influence on mitigating the environmental impact of the transportation industry, especially in relation to pollution and greenhouse gas emissions. It is crucial to adopt green initiatives in the logistics sector [59]. Therefore, it is imperative to incorporate green innovation into logistics [60].
For the 3PL sector, the adoption of green practices by 3PL providers can be viewed as an innovative process [60]. Regardless of their origin, any environmental management practices implemented by 3PL providers are considered innovative [61]. Chu et al. [61] conducted a literature review and concluded that the green innovation practices of 3PL firms encompass not only energy-saving practices but also pollution-reduction practices, such as the use of recyclable and reusable materials for packaging and the optimization of transportation plans to minimize pollution. According to Zailani et al. [4], technological innovation in the logistics industry includes data acquisition technology (DAT), information technology (IT), and transportation technology (TT). Some scholars argue that there will be significant variations in the implementation and conditions of different technologies, resulting in differences in the factors that influence the adoption of these technologies, depending on their type [62]. Furthermore, the prioritization of determinants of green innovation has not been thoroughly examined. Additionally, the background of 3PL in relation to green innovation has not been fully developed. Some studies have investigated the outcomes of green innovation, such as the relationship between green innovation and firms’ financial performance [63]. The efficiency and performance of GTI in terms of economic outcomes can contribute to reducing environmental pollution and conserving resources [7]. However, there is limited research on the noneconomic outcomes, including intangible outcomes, that are brought about via green innovation. Therefore, this study is the first to investigate the importance of the ranking of determinants of green technology innovation adoption and the four outcomes brought about via green technology innovation, including intangible outcomes.
2.2. The TOE-DOI Framework
Previous research has extensively examined various theories on technology adoption, such as the Technology Acceptance Model (TAM) [64], the Theory of Planned Behavior (TPB) [65], the Unified Theory of Acceptance and Use of Technology (UTAUT) [66], the DOI [67], and the TOE framework [68]. However, only the TOE and DOI frameworks have been utilized in studies focusing on the adoption of information technology in organizations [68].
The TOE framework posits that the adoption of innovation is influenced by organizational, environmental, and technological factors [69]. The technological background encompasses both internal and external technologies that are relevant to an organization, including current practices and equipment within the company, as well as available technologies outside the company. Organizational background refers to the characteristics of the organization, such as its business scope, human resources, and management structure. The environmental background pertains to the characteristics of the environment in which the organization operates, including interactions with its industry, competitors, and government [68]. In studies that are focused on the adoption of advanced technology at the organizational level, many researchers have referred to the DOI model [70,71]. Rogers [67] identified five technological characteristics that are prerequisites for any adoption decision, i.e., relative advantage, compatibility, complexity, trialability, and observability [72]. Innovation characteristics are often examined in combination, using both the TOE framework and DOI theory as variables of technological background [73]. A meta-analysis of 75 diffusion articles conducted by Tornatzky and Klein [74] revealed that only relative advantage, compatibility, and complexity consistently influence innovation adoption. Therefore, in this study, we adopted the TOE-DOI framework and incorporated the three technological characteristics of relative advantage, compatibility, and complexity from DOI theory into the technological dimension of the TOE framework.
To address the research question, a comprehensive literature review was conducted, with a specific emphasis on the TOE framework for technology adoption. Table 1 provides an overview of the key studies on organizational technology adoption, based on the TOE framework (as indicated in Table 1).
Although there have been some studies have been conducted using the TOE-DOI framework, the majority of the literature on technology adoption focuses on ERP or cloud computing. Limited research has been conducted on the adoption of green practices, with only a few studies examining green supply chain management [37] and green practices [75]. Furthermore, several studies [37,75,76,77] have incorporated the innovative aspects of DOI theory into the technological dimension of the TOE framework. This study aimed to investigate the adoption of green technology innovation based on the TOE-DOI framework, encompassing the technological (relative advantage, complexity, and compatibility), organizational (organizational support, quality of human resources, and green internal integration), and environmental (institutional pressures, green supplier integration, and green customer integration) dimensions.

Table 1.
Organizational technological adoption based on the TOE-DOI framework.
Table 1.
Organizational technological adoption based on the TOE-DOI framework.
| Determinants | Technology Adoption | Source | ||
|---|---|---|---|---|
| Technology | RA, TB, SRB, CY, PT | Blockchain | [76] | |
| Organization | TMCs, AC | |||
| Environment | TPI, RS | |||
| Technology | RA, CY | ERP | [78] | |
| Organization | OR, TMCs, training | |||
| Environment | CP, GS | |||
| Technology | RA, CY, CX, cost, observability | GSCM | [37] | |
| Organization | QHR, TMS, CS | |||
| Environment | EU, GS, RP, CP | |||
| Innovation characteristics | RA, CX, trialability, risks | Cloud computing | [79] | |
| Technology | CY, CS | |||
| Organization | Readiness, internal social network, external social network, TMS, | |||
| Environment | Expansion in the number of services, providers, and configurations, regulation, difficulties in information gathering about the cloud market | |||
| Innovation characteristics | RA, CY, SC, Cost saving | Cloud computing | [80] | |
| Technology | TR | |||
| Organization | TMS | |||
| Environment | CP, RS | |||
| Technology | RA, CY | Cloud computing | [77] | |
| Organization | OR, TMS | |||
| Environment | CP, GR | |||
| Sociocultural | Socioeconomics, Polities | |||
| Innovation characteristics | CX, CY, RA | ERP | [81] | |
| Technology | TR | |||
| Organization | TMS, CS, Cloud knowledge | |||
| Environment | CP, RS | |||
| Technology | RA, CX, CY, Cost, Company image | Green practices | [75] | |
| Organization | QHR, OS, CS | |||
| Environment | CP, GS, RP, CP | |||
Note: RA: Relative advantage; TB: transparency benefit; TR: technology readiness; SRB: perceived security-related benefit; CY: compatibility; CX: complexity; PT: perceived trust; TMCs: top management considerations; TMS: top management support; AC: absorptive capacity; TPI: trading partners’ influence; RS: regulatory support; OR: organizational readiness; EU: environmental uncertainty; QHR: quality of human resources; GS: government support, RP: regulatory pressure; CP: competitive pressure; RS: regulatory support; GR: government regulation; OS: organizational support; CS: company size; GSCM: green supply chain management; ERP: enterprise resource planning system.
2.3. Logistics with Green Practices
Hertz and Alfredsson [82] define 3PL as “external providers representing shippers in managing, controlling, and delivering logistics activities”. In the modern business landscape, logistics service providers are of great significance because they offer consumers a wide range of services, ranging from basic transportation to comprehensive supply chain management [83]. Logistics companies provide a diverse array of services, including transportation, warehousing, cross-platform operations, inventory management, packaging, and freight forwarding [84]. Furthermore, 3PL now plays a more crucial role in the supply chain than in the past [85,86]. Moreover, a report from the International Energy Agency [34] highlights that the transportation sector is the primary contributor to carbon emissions, accounting for 37% of global emissions. Additionally, according to data from Kommenda [87], global aviation transportation is the second-largest source of greenhouse gas emissions on the Earth’s surface and in the atmosphere. Moreover, many packaging wastes contain non-biodegradable materials such as polyvinyl chloride (PVC) and polyethylene plastics. The improper disposal of packaging waste can lead to serious environmental problems [88,89]. Given the central role of logistics service providers in the supply chain and the reliance of customers on them, greenhouse gas emissions increase the burden on 3PL firms to accelerate the “greening” of their logistics functions [57].
As stated by Zhu et al. [90], logistics and supply chain managers currently face a trade-off between reducing costs and maintaining good environmental performance [91]. Previous research has focused extensively on green innovation in the transportation sector and 3PL firms [3]. The determinants of green innovation in the logistics and transportation industry have been widely studied because logistics companies need to understand the key factors to effectively utilize innovative green technologies [4]. This study presents a literature review of the determinant factors and performance that are related to green innovation in the logistics and transportation industry, as shown in Table 2. Furthermore, the adoption of green innovation is influenced by three main factors—technology, organization, and the environment. Subsequently, a literature review was conducted on the adoption of environmentally friendly practices by 3PL firms in China.
Table 2.
Review of research targeting green innovation in logistics sectors.
2.4. Proposed Research Model
To enhance predictive capability, this study incorporated control variables such as organization size, organization age, and ownership type. Organization size was quantified according to the number of employees, while organization age was measured using the number of years in operation. To address the research question and bridge the existing research gap, the following research model was proposed (refer to Figure 1).
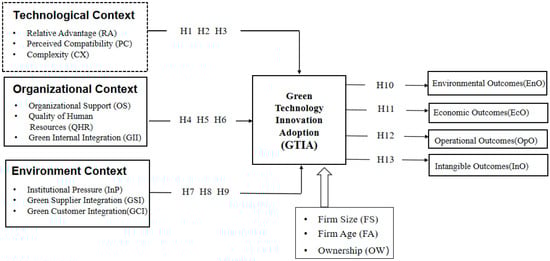
Figure 1.
Research model.
2.5. Hypothesis Development
In the technological dimension of the TOE-DOI framework, relative advantage refers to the perceived extent to which new technology can offer greater benefits for businesses [68]. When users recognize that an innovation can provide advantages over existing practices and systems, it is expected to encourage its adoption of innovation [67]. In other words, if the advantages of technology (such as green technology innovation) surpass the advantages of current practices and procedures [105], a relative advantage will have a positive impact on adoption [78]. Green technology, a novel technological paradigm, can conserve resources, prevent or mitigate environmental pollution, and facilitate the recycling of raw materials and waste [106]. Additionally, it has the potential to enhance both environmental and financial performance while also effectively addressing social and environmental expectations [48]. Therefore, it is anticipated that green technology innovation will bring greater advantages to organizations.
H1.
When the relative advantage is greater, GTIA will be stronger.
Compatibility refers to the extent to which an innovation aligns with the current needs of potential adopters, previous practices, and existing values [68,107]. Previous research has shown that, when there is a high level of compatibility, the chances of adopting innovation increase [72]. If organizations perceive that emerging technologies are in line with their current needs, tasks, and business processes, they are more likely to accept them. Conversely, they are less inclined to adopt new technologies that necessitate process adjustments, extensive learning, and additional investments in equipment [76]. Hence, the assumption was as follows:
H2.
When compatibility is higher, GTIA will be stronger.
Complexity refers to the extent to which an innovation is perceived as challenging to comprehend and utilize [67]. The complexity of technology is indicative of the range of knowledge sources or the quantity of technological components involved. Environmental technology encompasses broader objectives and knowledge inputs [106]. Individuals may lack confidence in adopting green technology innovations due to their relative novelty. Organizations may require a significant amount of time to comprehend and implement such technology. Hence, the assumption was as follows:
H3.
The greater the complexity is, the weaker the GTIA.
From an organizational perspective, the crucial issue is how managers can make wise decisions regarding intervention measures to enhance the acceptance and effective utilization of technology [66]. Top management support, also known as organization support, is crucial for the successful implementation of technology, as it guarantees the availability of adequate resources for the adoption of green practices [75]. The support and commitment of top-level management have a significant impact on the level of acceptance of innovation within an organization [108]. Organizational support plays a crucial role in motivating employees to adopt green practices [37]. For instance, companies demonstrate organizational support by involving employees in decision-making processes related to environmental sustainability and green management, which, in turn, enhances their environmental awareness and encourages efforts toward green management within the organization [109]. Hence, the assumption was as follows:
H4.
When organizational support is higher, GTIA will be stronger.
Tornatzky and Fleischer [69] argue that the quality of human resources is a crucial factor influencing the adoption of technical innovation. The innovative capabilities and competent learning abilities of qualified human resources are beneficial in the process of adopting innovations [59]. Jun et al. [108] argue that the development of green technology necessitates a workforce with advanced skills. The likelihood of a company embracing such technology is enhanced by the presence of competent personnel, modern training facilities, and a well-educated workforce [37]. Lin and Ho [59] conducted a study that also indicated the significant significance of skilled and competent employees in the successful implementation of environmental initiatives. Hence, the assumption was as follows:
H5.
When the quality of human resources is higher, GTIA will be stronger.
Green innovation integration (GII) is the term used to describe the extent of communication, information sharing, and coordination among cross-functional departments in the context of environmental management practices [110,111,112]. It involves the strategic integration of environmental goals into a company’s strategies and management systems [113]. Implementing green innovation or environmental practices is a multifaceted process that necessitates interdisciplinary coordination and substantial modifications to the company’s existing operational procedures [114]. To promote green practices, collaboration among various departments must be fostered [37]. GII refers to the degree to which manufacturers implement environmental management practices within their organization to effectively manage internal processes [115]. Internal green integration comprises three components: (1) the inclusion of environmental goals and responsibilities in business strategies and top management incentives, with the aim of balancing business and environmental objectives to achieve sustainable growth; (2) the establishment of a comprehensive management system that integrates environmental objectives, performance, and responsibilities into its code of conduct, functional business decisions, and human resource decisions across various functions; and (3) cross-functional communication efforts [116]. Increased levels of internal integration can enhance a company’s capacity to develop green innovations and effectively manage internal resources [117]. Therefore, the underlying assumption is as follows:
H6.
When the level of green internal integration is higher, GTIA will be stronger.
Environmental regulation serves as the primary driving force for companies to engage in green technology innovation, and it also serves as an important tool and means for the government to promote the transformation of companies toward green technology [8]. The influence on green technology innovation can be attributed to environmental regulation, the decentralization of environmental authority, and government-funded technological subsidies [118]. Institutional pressure [119,120] is a multifaceted concept that encompasses various dimensions, such as coercive pressure, normative pressure, and mimetic pressure [120,121]. Coercive pressure arises from regulations established by government agencies [122]. Research suggests the need to clarify and promote specific management and policy approaches for ecological innovation [54]. Companies must comply with laws and regulations to obtain government legitimacy. Borghesi et al. [123] emphasize that institutional pressure from government laws and regulations conveys a clear message to companies that they must assume environmental protection responsibilities. The government will strengthen environmental law enforcement, environmental management, and inspections of companies while continuously increasing environmental regulatory pressure, thereby compelling companies to innovate in the field of green technology [124]. Failure to comply with these directives and regulatory controls will result in companies being phased out of the market [125]. Normative pressure arises from customers and nongovernmental organizations [120]. It primarily encompasses values and norms that are closely associated with meeting social moral standards [126]. Mimetic pressure arises from competitors [127]. Additionally, stakeholder pressure is an important factor that triggers companies to adopt ecological innovation [54]. To meet the environmental requirements of consumers (especially in the international market), suppliers, and partners, companies tend to implement green innovation measures to enhance their environmental performance [128]. If a company successfully attracts customers and gains a relative competitive advantage through ecological innovation, other companies will imitate its behavior to maintain their market share [54]. Therefore, the following hypothesis was proposed:
H7.
When institutional pressure is greater, GTIA will be stronger.
Enterprises endeavoring to adopt green innovation often lack certain necessary conditions or incur significant costs to accomplish innovation tasks independently [129]. Integrating and promoting collaboration between organizations is essential for establishing connections, strengthening operations, and accelerating knowledge transfer with partners [130]. Supply chain integration is a restructuring approach that connects and optimizes activities, providing organizations with a framework to efficiently utilize existing resources to achieve strategic goals [131]. Afum et al. [132] reported that, without collaboration between key upstream supply chain partners (such as supplier integration) and downstream supply chain partners (such as customer integration), companies may achieve minimal results when deciding to undertake green initiatives. Additionally, Bonn et al. [133] argue that suppliers’ environmental practices can influence buyers’ environmental decision-making outcomes. Enterprises must effectively utilize these resources and skills to enhance their green innovation performance. For instance, during the green innovation process, an enterprise may need specific components that are in limited supply. However, it can acquire these components from suppliers by fostering strong relationships [93]. Therefore, the following hypothesis was proposed:
H8.
When the level of green supplier integration is higher, GTIA will be stronger.
The supply chain is composed of two components: demand and supply. Customers and suppliers may possess varying information pertaining to green innovation [93]. Although customers of 3PL firms have traditionally been perceived as apathetic to environmental issues that affect end consumers, recent research indicates that these customers are now showing a growing interest in green and sustainable procurement and supply chain practices [92,134]. There is evidence to suggest that collaborating with customers is more effective than collaborating with suppliers in enhancing environmental performance [135]. When customers are dissatisfied with a service as a result of outdated technology, they will discontinue its usage. Customers engage in partnerships with technology-innovative companies with the ultimate goal of deriving benefits from this collaborative relationship [84]. End customers are also increasingly demanding that shippers utilize green and sustainable supply chain management [134]. Previous studies have demonstrated that the integration of green customers enhances cost and environmental performance by means of GPI. The integration of green customers fosters both green product and process innovation [112]. Therefore, the following hypothesis was proposed:
H9.
When the level of green customer integration is higher, GTIA will be stronger.
From the perspective of adopting green technology innovation, the main considerations include environmental outcomes, economic outcomes, operational outcomes, and intangible outcomes. Previous studies have examined the relationship between green innovation and corporate financial performance [62,63]. The adoption of green innovation is positively related to corporate financial performance. Research has also shown that engaging in activities related to environmental sustainability and having a focus on green initiatives contribute to the development of a positive corporate image and impact competitive advantage and long-term survival [136]. By adopting new green products or management processes, companies are more likely to become more environmentally friendly in highly competitive markets, which can lead to future competitive advantages [54]. Additionally, companies may implement environmental processes to achieve their objectives, enhance their reputation, increase competitiveness, and pursue higher goals [9,131,137]. For companies, it is important to thoroughly investigate both the “tangible” benefits (such as improved efficiency and profitability) and the “intangible” benefits (such as an enhanced corporate image) [138]. Companies should implement green process innovations as part of their corporate innovation strategies to enhance their corporate image [47]. Hence, it could conceivably be hypothesized that:
H10.
When GTIA is higher, environmental outcomes will be stronger.
H11.
When GTIA is higher, economic outcomes will be stronger.
H12.
When GTIA is higher, operational outcomes will be stronger.
H13.
When GTIA is higher, intangible outcomes will be stronger.
3. Research Methodology
3.1. Data Collection
The analysis of this survey was based on quantitative data collected through a questionnaire survey of a 3PL firms in China, which is considered an emerging market. The data collection period spanned from November 2023 to February 2024. The simple random sampling framework was adopted, making reference to the China Federation of Logistics & Purchasing (CLFP) and the National Enterprise Credit Information Publicity System. This selection method was chosen to ensure that all individuals had an equal chance of being included in the study, thereby promoting fairness, representativeness, and an equal probability of being selected from the population [139]. The survey questionnaire was distributed online using China’s largest online survey platform, Wen Juan Xing (https://www.wjx.cn) [140]. The distribution process included a cover letter that explained the purpose of the research and assured the confidentiality of the respondents’ data.
First, the information collected from the survey was kept completely confidential and anonymous. Second, the survey tool was divided into three sections—a demographic profile, an organizational profile, and the measurement of the determining factors and outcomes of green technology adoption. The questionnaire was designed in two stages to ensure the content validity of the assessment tool: (1) a preliminary questionnaire was developed through a literature review, i.e., an analysis of comparable theoretical frameworks, and discussions with two experts in environmental management; and (2), to ensure that each item fulfilled the requirements of the logistics department and was deemed valid, the original survey questionnaire was revised based on the suggestions provided by five logistics managers who possessed expertise in implementing green technology innovation in business. Subsequently, the English questionnaire was translated into Chinese using a back-to-back translation method to avoid interpretation bias. In addition, feedback was obtained from five logistics managers to minimize potential cultural bias risks [90]. The translated Chinese version was then compared to the original English text to ensure accuracy, and it underwent necessary adjustments to accurately convey the original intent. Notably, the researchers did not apply any pressure on participants who chose not to take part in the survey. All necessary measures were implemented to ensure the accuracy and reliability of the survey findings. Consequently, a final iteration of the questionnaire was distributed to a sample of 1000 3PL firms. In summary, the survey was conducted using the largest online survey platform in China, Wen Juan Xing, with a total of 544 valid responses collected, resulting in a response rate of 54.4%. To ensure the validity and reliability of the data, expert reviews and pretests were carried out.
In this study, gender, job position, firm location, firm size, firm age, and ownership were measured using nominal scales. Moreover, the variables RA, CX, CY, OS, QHR, GII, InP, GSI, GC, GC, DDC, and GTIA were assessed using a five-point Likert scale. The variables EnO, EcO, OpO, and InO were measured using a seven-point Likert scale. The use of various Likert scales has the potential to mitigate the occurrence of common method bias in research [141].
The demographic information of the participants and the organizational profile (refer to Table 3) were collected from the findings of the field survey.
Table 3.
Respondents’ profiles.
3.2. Common Method Bias (CMB)
Assuming that the research data are collected from a single source, self-presentation becomes the only explanation [142]. This method of data collection is more vulnerable to common method variance (CMV) [143]. Since the responses of both endogenous and exogenous constructs are obtained from the same source [144], CMB may occur and compromise the validity of the research findings. This is considered a significant issue in questionnaire surveys [9]. Various procedural remedies have been implemented to address CMB concerns. According to Kock [145], this study employed a more rigorous testing method for CMB and conducted a thorough collinearity assessment. The resulting variance inflation factor (VIF) values were less than 5 [146]. These findings indicate that CMB is unlikely to be a serious concern.
In addition, the Harman single-factor test is commonly used to determine the presence of common method bias. This test only provides information about the existence of CMV [147], and the method is considered incomplete and insensitive [141]. Lindell and Whitney [143] were pioneers in discussing the use of marker variables to identify and eliminate methodological artifacts in cross-sectional data from the same source [148]. They suggested that, if the relationships between observed variables that are obtained using the same method are influenced by inconsistent CMV, marker variables should be used to identify and separate the variance. Williams used marker variables to test for CMV and to correct for method bias [149]. This method requires designing a variable that has no theoretical relationship with other variables when designing the questionnaire and then estimating it. This study used unmeasured marker variables to assess the fluctuation of R2 values. Considering that the data were collected through self-report questionnaires, particularly when examining the participants’ perspectives on external and internal frameworks [147], evaluating potential biases that are associated with common methods becomes crucial. The general issues regarding marker variables in this study include three items that have been adapted from Oreg [150].
The research findings indicate that the coefficient of determination (R2) experiences a slight increase of less than 10%, suggesting a weak correlation. Consequently, considering the aforementioned evaluation, it can be inferred that CMB is not a significant concern in this study (refer to Table 4 and Table 5). As demonstrated in Table 4 and Table 5, the beta (β) values (ranging from −0.001 to 0.036), p values, and R2 changes (ranging from −0.005 to −0.001) exhibited no statistical significance with increasing marker variables. Consequently, these findings indicate that CMB is unlikely to be a concern.
Table 4.
Comparison of the path coefficient (β) and p value.
Table 5.
Comparison of R2 values.
4. Results
This study employed PLS-SEM and the ANN method for data analysis. The software used for analysis included Smart PLS (version 4.1.0.0) and IBM SPSS Statistics (version 28). The research model consists of a hierarchical component model and a reflective measurement higher-order construct. PLS-SEM was utilized to obtain inferential statistics [151]. According to G*power, a minimum total sample size of 160 is required to achieve an R2 of at least 0.25 at a 5% significance level and 80% predictive power. The sample size for this study was 544, which is sufficient for PLS-SEM analysis. However, while PLS-SEM analysis provides inferential statistics, it is limited in its ability to handle nonlinear relationships [107]. To overcome this limitation, scholars have combined SEM and ANN to explain the nonlinear and no-compensatory relationships between constraints [152]. Furthermore, a two-stage analysis method was employed, through which ANN analysis complemented PLS-SEM analysis [107,153]. In accordance with Shahzad et al. [9], PLS-SEM was used in this study for hypothesis testing, while ANN was used to evaluate the relative importance of variables.
4.1. Measurement Model
4.1.1. First-Order Constructs
Table 6 displays the indicator loadings and cross-loadings for this study (as shown in Table 6 below). The measurement model was assessed based on the reliability and validity of its structure [154]. Reflective indicators were evaluated using item reliability, internal consistency reliability, convergent validity, and discriminant validity [155]. If the composite reliability of a structure is 0.7 or higher, the reliability of that structure can be determined [155]. Similarly, a construct’s convergent validity is considered reliable when the extracted average variance is 0.5 or greater [156].
Table 6.
Indicator loadings and cross-loadings.
4.1.2. Measurement Model for Second-Order Constructs
This study employed the disjoint two-stage approach as recommended by Hair et al. [146] for assessing second-order structures. The second-order model proposes that distinct yet interconnected structures can be explained by one or more higher-order common structures. Higher-order structures provide researchers with a framework for modeling structures in more abstract dimensions (referred to as higher-order components) and more specific subdimensions (referred to as lower-order components) [157].
This study consisted of two second-order constructs that are reflective–reflective structures: InP (including RP, NP, and CP) and GTIAs (DAT, IT, and TT) (see Table 7). The constructs RP, NP, and CP represented broader higher-order constructs of the lower-order constructs of lnP. RP was measured with four indicators (RP1, RP2, RP3, and RP4), NP was measured with three indicators (NP1, NP2, and NP3), and CP was measured with three indicators (CP1, CP2, and CP3). Additionally, the DAT, IT, and TT constructs represented broader higher-order GTIA constructs. DAT was measured with six indicators (DAT1, DAT2, DAT3, DAT4, DAT5, and DAT6), IT was measured with four indicators (IT1, IT2, IT3, and IT4), and TT was measured with four indicators (TT1, TT2, TT3, and TT4).
Table 7.
Measurement model for the second-order constructs.
To assess discriminant validity, it is crucial to carefully examine the indicators within specific frameworks, as they provide a comprehensive representation of the underlying structure [146]. Additionally, previous research has primarily utilized two main evaluation techniques to measure the effectiveness of discrimination: (1) the Fornell–Lacker criterion [158] and (2) the HTMT [159]. The Fornell–Lacker criterion is typically evaluated by assessing the square root of the AVE and the correlations between the focal structure and other structures [160]. The concept of discriminant validity is related to the distinctions between structural indicators and other theoretical frameworks [161]. HTMT is a statistical measure used to quantify the correlation between factors. Henseler et al. [162] proposed the superiority of this method through a Monte Carlo simulation study, which revealed that HTMT achieves greater specificity and sensitivity (97% to 99%) than the cross-loading criterion (0.00%) and Fornell–Lacker criterion (20.82%) [163]. Therefore, this study adopts the HTMT to test discriminant validity. According to Henseler et al. [162], ideally, the HTMT should be less than 1. According to Hair et al. [38], an HTMT value of 0.9 or below indicates discriminant validity. Table 8 demonstrates discriminant validity, as all HTMT values are below 0.9, and all indicators load heavily on their constructs.
Table 8.
Discriminant validity (HTMT ratio).
4.2. The Structural Model Assessment
Following the recommendations of Becker et al. [164], we reported the path coefficients, standard errors, t values, and p values of the structural model using 10,000 resampled bootstrap samples [165]. Table 9 presents the performance indicators of the structural model, specifically the predictive accuracy (represented by R2), predictive relevance (represented by Q2), and effect size (represented by f2) (refer to Table 9). R2 values of 0.02, 0.13, and 0.26 indicate low, medium, and high predictive accuracy, respectively [146], while Q2 values of 0.50, 0.25, and 0 indicate large, medium, and small degrees of predictive relevance, respectively [38]. In terms of effect size, Henseler et al. [162] considered f2 values of 0.35, 0.15, and 0.02 to indicate high, medium, and low levels of impact, respectively [166].
Table 9.
Predictive accuracy, predictive relevance, and effect size.
Table 10 shows that Hypotheses H1, H2, H4, H5, H6, H7, H8, H9, H10, H11, H12, and H13 were supported. H3 was not supported (refer to Table 10). Among the control variables, firm age had a significant impact on GTIA. The control variables of firm size and ownership form did not significantly affect the results. Within the TOE-DOI framework, InP was identified as the most important predictor of green technology innovation adoption (β = 0.220, p < 0.001, f2 = 0.078), followed by RA (β = 0.177, p < 0.001, f2 = 0.067) and GSI (β = 0.160, p < 0.001, f2 = 0.045). On the other hand, GTIA was found to lead to the following outcomes: EnO (β = 0.459, p < 0.001, f2 = 0.268), EcO (β = 0.431, p < 0.001, f2 = 0.229), OpO (β = 0.458, p < 0.001, f2 = 0.265), and InO (β = 0.473, p < 0.001, f2 = 0.289). Overall, the research model demonstrated a strong correlation in predicting GTIA (R2 = 0.854, Q2 = 0.848), indicating a high level of predictive accuracy.
Table 10.
Results of hypothesis testing.
4.3. ANN Analysis
Similar to the study by Shahzad et al. [9], the present study also employed ANN to determine the relative significance of each variable and strengthen the findings of structural equation modeling (SEM). ANN are computational models that utilize parallel information-processing structures to elucidate outcomes. Moreover, they have the capability to adapt the framework to improve the robustness of the model [167]. The ANN model is capable of revealing the non-compensatory and nonlinear correlation between independent and dependent variables. It captures the nonlinear interactions between antecedent and outcome variables [168,169]. In addition, artificial neural networks are robust to noise, outliers, and small sample sizes [144]. Consistent with Leong et al. [144], the 50-fold empirical rule using artificial neural network analysis states that the minimum sample size should be at least 50 times the number of modifiable parameters in a neural network [170]. Similar to the sample size approach used in the ANN model by Leong et al. [107], the 544-sample size in this study was sufficiently large for ANN analysis.
To assess the impact of external factors on GTIA, an ANN model was constructed based on the architecture of a feedforward, backpropagation, multilayer perceptron neural network [144]. The external factors were considered input neurons, while the internal construct GTIA was considered the output neuron. Similar to Hew et al. [171], the activation function was set as the sigmoid function, and the number of hidden neurons in the two hidden layers was automatically calculated using SPSS 28. Previous studies have utilized multilayer perceptron neural networks, which include an input layer, hidden layers, and an output layer [172]. The sigmoid activation function was used to generate nodes for the hidden neurons [173]. To address overfitting, researchers implemented a tenfold cross-validation procedure, where 90% of the available data were used for training and the remaining 10% were used for testing [171]. IBM SPSS 28.0 was used to establish the ANN model in this study (refer to Figure 2). Subsequently, the root mean square error (RMSE), which indicates the model fit [151], was obtained from the analysis and is presented in Table 11. Since all the RMSE values were negligible, the ANN models demonstrated excellent goodness of fit [174].
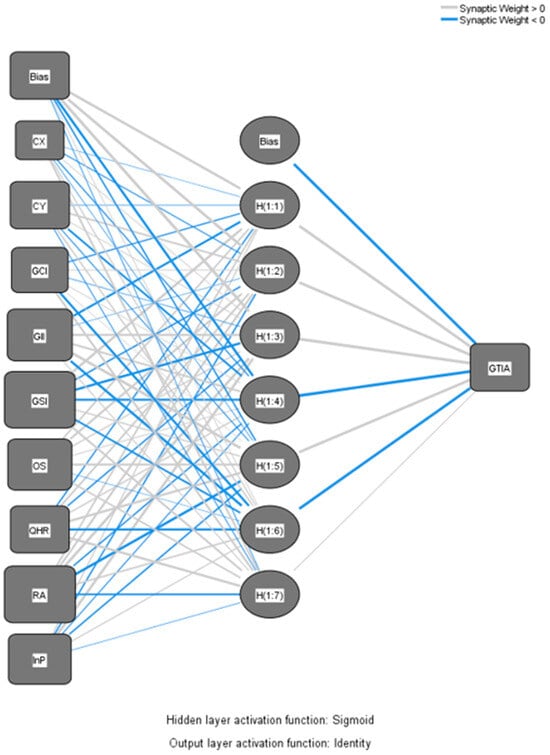
Figure 2.
ANN model.
Table 11.
RMSE values.
To assess the impact of external source structures and determine the predictive strength of each input neuron, a sensitivity analysis was conducted following the approach of Leong et al. [107,174] (refer to Table 12). The normalized importance of input neurons was calculated by dividing their relative importance by the maximum importance and presenting it as a percentage [175]. Table 12 displays the range of normalized importance, ranging from 13.53% to 100%. The results indicate that InP is the most significant predictive factor, followed by the GSI, with a normalized importance of 85.6%. The next most common risk factors were RA (85.07%), CY (70.36%), OS (67.84%), GII (59.84%), and GCI (48%). Compared to the conclusions of the PLS-SEM analysis, the influences of the GSI and RA were inconsistent, while the influences of the remaining factors were consistent. In other words, in PLS-SEM, the influence of RA was greater than that of GSI, whereas in the ANN analysis, the importance of GSI was greater than that of RA. The normalized importance of CX was 13.53%, making it the least important, which aligns with the non-significant conclusion of the hypothesis testing in PLS-SEM.
Table 12.
Sensitivity analysis.
5. Discussion
The objective of this study was to investigate the factors that impact GTIA, namely relative advantage, compatibility, complexity, organizational support, quality of human resources, green internal integration, institutional pressure, green supplier integration, and green customer integration. These influencing factors were categorized into technological, organizational, and environmental dimensions using the TOE-DOI model. Additionally, this study sought to empirically analyze the correlation between GTIA and environmental outcomes, economic outcomes, operational outcomes, and intangible outcomes. This study also reveals the impact of firm size and age as control variables on these relationships. The following sections will discuss the detailed results of the influencing factors under each dimension for GTIA, the outcomes of GTIA, and the effects of the control variables.
5.1. Technological Dimension (Relative Advantage, Compatibility, and Complexity)
Based on the TOE-DOI framework and the technological dimension, H1 of this study proposed that relative advantage has a positive impact on green technology innovation. This is consistent with previous studies [4,176]. The support for hypothesis H2 indicates that compatibility has a positive influence on green technology innovation. Therefore, it can be argued that increasing relative advantage and compatibility can enhance the adoption of green technology innovation by 3PL firms. For example, green technology innovation provides companies with more opportunities and improves their image, which in turn promotes recognition and adoption by 3PL firms. Additionally, by increasing the compatibility of green technology innovation, 3PL firms can more easily integrate it into their existing corporate culture and business processes. However, the complexity of green technology innovation does not decrease its adoption. Hypothesis H3 was not supported. In practice, green technology innovation faces many challenges and complexities, which collectively influence the willingness of 3PL firms to adopt it. However, due to their relative advantage and other benefits, companies are still likely to increase the possibility of adopting them even if they have a higher level of complexity. For 3PL firms, adopting suitable green technological innovations is beneficial. For example, large logistics companies such as Maersk utilize blockchain technology to optimize supply chain management, reducing delays and resource waste in transportation [50]. Furthermore, in the realm of technology, relative advantage emerges as the dominant factor. As stated by Lutfi et al. [78], relative advantage has a positive impact on adoption. Hence, companies should not only consider the influence of their external environment but also prioritize their own organizational and technological dimensions. Therefore, 3PL firms can actively seek the advantages of green technology innovation. Specifically, large logistics firms can prepare monthly and annual reports that highlight the benefits of adopting green technology innovations and present these advantages to stakeholders to gain additional support. Moreover, the relative advantages brought through green technology innovations can enhance the quality of green services in third-party logistics, further increasing satisfaction among environmentally conscious customers.
5.2. Organizational Dimension (Organizational Support, Quality of Human Resources, Green Internal Integration)
In the organizational dimension, an increase of one unit in organizational support is associated with a contribution of 0.127 units in green technology innovation adoption, thus supporting Hypothesis H4. Previous studies have consistently shown that top management support is a significant indicator of technology adoption, which aligns with the aforementioned research findings [37,177]. Similarly, an increase of one unit in the quality of human resources is associated with a contribution of 0.066 units in green technology innovation adoption, supporting Hypothesis H5. This finding is consistent with existing research findings [4,108,178]. Furthermore, an increase of one unit in green internal integration is associated with a contribution of 0.086 units in green technology innovation adoption, supporting hypothesis H6. This finding extends the existing research, as there has been limited direct research on the relationship between green internal integration and green innovation adoption. Most studies have focused primarily on the impact of green internal integration on economic and environmental performance [112]. Therefore, we posit that the organizational dimension of green technology innovation adoption in 3PL firms is driven by organizational support, the quality of human resources, and green internal integration. For instance, organizational support plays a crucial role in driving green technology innovation adoption in 3PL firms. Theoretically, if top management provides the necessary tangible and intangible resources to support GTIA, employees will be more inclined to accept and implement green technology innovation within their work scope. By enhancing the quality of human resources through training, communication, and experiential learning, organizations can foster employees’ awareness of green technology innovation and their confidence, knowledge, and skills in adopting this advanced technology. Additionally, we anticipate that green internal integration can facilitate more effective and efficient green technology innovation adoption in 3PL firms. This finding suggests that 3PL firms should prioritize the adoption of green technology innovations starting at the top management level. A top-down approach should be employed, where companies actively provide training on green technology innovations and foster cross-departmental green integration. This strategy is essential in truly promoting the adoption of green technology innovations, thereby achieving environmental, economic, operational, and intangible benefits for 3PL firms.
5.3. Environmental Dimension (Green Internal Integration, Institutional Pressure, and Green Supplier Integration)
In the environmental dimension, each unit increase in institutional pressure contributes the most significantly to an increase of 0.220 units, supporting Hypothesis H7. This aligns with the perspective of Borghesi et al. [123], as companies typically lack the incentive to implement environmental innovation unless they are compelled to do so because of appropriate environmental regulations. This conclusion is also consistent with previous research showing that government pressure, in the form of command-and-control tools, has a significant positive impact on the adoption of EI practices [125]. Therefore, this study hypothesized that higher levels of institutional pressure would result in a greater inclination to adopt green technology innovation. For instance, by creating a regulatory environment that is favorable to 3PL, resistance to adopting green technology innovation decreases. Moreover, if the government provides support in the form of fiscal incentives, low-interest loans, and special subsidies necessary for this integration, companies will be motivated to embrace green technology innovation. Conversely, from a theoretical standpoint, high levels of competitive pressure will prompt companies to adopt green technology innovation to avoid being outperformed by their rivals. Institutional pressure for the adoption of green technology innovation is crucial. In the specific context of environmental regulation in China, the central government has decentralized certain powers, such as environmental approval and regulation, to local governments. By granting more authority in environmental management to local governments, they can enhance their own environmental management practices, actively collaborate with the central government in implementing environmental management policies, fully utilize local knowledge, and intensify efforts in environmental pollution control [179]. Consequently, this facilitates the promotion of green technology innovation within enterprises and enhances the effectiveness of environmental pollution control [43]. Organizations can achieve a competitive advantage by embracing advanced and environmentally friendly technologies, such as green technology innovation, which have the potential to decrease waste and expenses [137]. Therefore, the findings of this study suggest that institutional pressure plays a significant role in driving green technology innovation. Similarly, the incorporation of green suppliers is crucial in the environmental sector, as collaborating with suppliers on environmental aspects can lead to improved green innovation [36].
5.4. Outcomes of GTIA
Furthermore, each additional unit of green technology innovation adoption contributes 0.459 units of environmental outcomes, 0.431 units of economic outcomes, 0.458 units of operational outcomes, and 0.473 units of intangible outcomes. This finding supports hypotheses H10-H13, which align with the research results of Perotti et al. [138] and Eltayeb et al. [180]. Theoretically, if SMEs adopt green technology innovation, they can achieve economic, environmental, operational, and intangible benefits. The Porter hypothesis suggests that environmental policies can encourage regulated firms to engage in technological innovation activities and yield more advantages, potentially leading to higher profits in the future [42]. This is because the benefits of innovation outweigh the costs of environmental regulations, and through the compensation effect of innovation, firms are incentivized to pursue green technology innovation [8]. Through green technology innovation, SMEs can reduce operational costs and improve operational performance, market recognition, and positive image evaluation. Green technology can enhance a company’s reputation and market share, thereby increasing profits. Additionally, green technology facilitates environmental standard certification [108]. The conclusions of this study confirm those of previous research. Firm age positively influences the adoption of green technology innovation. This suggests that the longer a firm has been established, the more experience and resources it accumulates, providing more opportunities for adopting green technology innovation. Established companies seeking to gain advantages through green technology innovation differ significantly from younger companies. However, the control variables of organizational size and ownership type do not appear to contribute to the adoption of green technology innovation. Therefore, we speculate that organizational size and ownership do not influence the adoption of green technology innovation. Considering this, all the determining factors for the adoption of green technology innovation remain robust, regardless of these two organizational attributes. Next, the researchers included environmental outcomes, economic outcomes, operational outcomes, and intangible outcomes as dependent variables in the GTIA model to examine the impact of GTIA on these variables. The results of H10 indicate that companies that adopt green technology innovation can reduce their resource consumption, decrease their environmental impact, and improve their overall environmental performance. The results of H11 suggest that companies that adopt green technology innovation can increase their market share and revenue, reduce their waste disposal costs, and lower their costs. The results of H12 demonstrate that companies that adopt green technology innovation can enhance service quality and equipment utilization and reduce waste rates, thereby contributing to operational outcomes. This conclusion aligns with the research findings of Perotti et al. [138] on the operational performance of green supply chain practices in Italian 3PL firms. The results of H13 indicate that adopting green technology innovation contributes to the enhancement of corporate image and intangible outcomes such as customer loyalty and satisfaction. Previous research on the adoption of green innovation and its intangible outcomes, such as studies on green supply chain initiatives and their intangible outcomes in the industrial sector, has been limited [180]. H13 suggested that the adoption of green technology innovation not only benefits the economic outcomes of companies but also has positive implications for noneconomic outcomes. In the expanding green economy, companies should prioritize green technology innovation as a strategic initiative because GTIA enables companies to stand out in the market, attract environmentally conscious customers [23], and gain competitive advantages [15]. By adopting green technological innovations, 3PL firms can establish a more socially responsible image throughout their supply chain, thereby enhancing their corporate value and reputation.
5.5. ANN Analysis
The analysis conducted using ANN revealed some significant findings. According to the results obtained from PLS-SEM, the top three factors that determine GTIA are InP, RA, and GSI. The analysis performed using artificial neural networks also revealed the determining factors in terms of importance, with InP, GSI, and RA being identified as the most influential factors. However, both PLS-SEM and ANN consistently highlight InP as the key factor in determining GTIA. These intriguing findings can be attributed to the unique capabilities of artificial neural networks in conducting in-depth analyses of nonlinear correlations, as observed in the study conducted by Leong et al. [107]. These findings can further guide 3PL firms in applying green technology innovations in the following ways: developing and executing green supply chain strategies to ensure that every stage, from raw material procurement to product delivery, meets environmentally friendly standards, and selecting suppliers and partners committed to green practices to ensure the sustainability of the entire supply chain. From a practical perspective, 3PL firms should prioritize the impact of institutional pressure by ensuring a comprehensive understanding of relevant laws and regulations. Internally, fostering a compliance culture is crucial, helping employees recognize the importance of compliance through training and education. Also, 3PL firms should take proactive measures to ensure that their operations meet regulatory requirements and stay updated by regularly reviewing and revising compliance policies in response to the evolving legal landscape. Furthermore, integrating green supply chain practices, particularly green supplier integration, can enhance and improve the adoption of green innovations. Managers of 3PL should develop a mindset and skills for green supply chain integration, especially in green supplier integration. This approach will support the adoption of green technology innovations and further improve the economic, environmental, operational, and intangible outcomes resulting from these innovations.
5.6. Control Variables
Finally, we discuss the control variables, specifically company size, company age, and ownership. Zhu and Sarkis [181] emphasize that regulatory and market pressures may have an impact on large companies, while small companies are more likely to be influenced by competitive pressures. In the logistics industry, Kudla and Klaas-Wissing [182] argue, large logistics providers face slightly greater market pressures for sustainable actions than small and medium-sized providers. This study finds that company size does not have a significant impact on the adoption of green technology innovation. This finding suggests that there is no significant difference in the adoption of green technology innovation between large companies and small firms. Therefore, small and medium-sized 3PL firms should also place greater emphasis on GTIA, using it to enhance their economic, operational, and intangible outcomes.
6. Implications of the Research
6.1. Policy Implications
Focusing on green innovation serves as a policy tool to alleviate increasing environmental pressures, as such innovations help reduce overall pollution emissions [183]. Furthermore, green innovation offers an alternative strategy that can advance economic progress and environmental sustainability [49]. To promote the adoption of green technology innovations in 3PL firms through green supplier integration, policymakers can employ the following strategies.
3PL firms can utilize information technologies such as big data analytics and artificial intelligence to monitor and optimize logistics processes, thereby enhancing resource utilization. Training on environmental awareness and skills can be provided to employees, fostering a green corporate culture and encouraging active participation in green innovation activities. Policymakers can also communicate the results and plans of green innovations with customers, investors, and other stakeholders to build a strong green brand image. This approach helps 3PL firms achieve enhanced environmental, operational, and intangible benefits.
Additionally, policymakers should implement and refine stringent environmental regulations to clarify corporate responsibilities regarding green innovation. For 3PL firms, policymakers can establish stringent pollutant emission standards and impose severe penalties for non-compliance. They should also create a robust green intellectual property protection system to encourage the adoption of green technologies. Furthermore, policymakers can promote green supplier integration through policy measures, driving the entire industry chain towards more sustainable practices. This approach helps eliminate high-pollution suppliers, improves resource efficiency, and reduces environmental impact. Support for green supplier integration will lead firms to invest more in green innovations, such as adopting eco-friendly transportation and packaging, emphasizing reverse logistics, and enhancing collaboration with green suppliers. Policymakers can also enhance education and training on green innovation for human resources, promoting its benefits and integrating it into corporate culture and employee awareness. They should actively seek employee feedback on green innovation and provide training courses and consulting services to keep employees informed about the latest green technologies and management practices.
6.2. Theoretical Contributions
This study makes valuable theoretical contributions. First, it has identified the key determinants of green technology innovation using the TOE-DOI framework. These determinants include relative advantage, compatibility, complexity, organizational support, quality of human resources, green internal integration, institutional pressure, green supplier integration, and green customer integration. The study has also comprehensively analyzed the interactions between these determinants and the adoption of green technology innovation. Furthermore, it has examined the environmental, economic, operational, and intangible outcomes resulting from such adoption, enhancing the understanding of the relationships between these variables. The results emphasize the significance of green technology innovation in the context of sustainable development and market success for 3PL firms, leading to economic, operational, and intangible benefits. Additionally, this study expands the TOE-DOI framework by introducing green internal integration as an organizational dimension, as well as green supplier integration and green customer integration as environmental dimensions. This provides a new perspective for the research framework, helping us understand how companies can integrate green supply chains and adopt green technology innovation to establish a competitive advantage. The study also indicates that institutional pressure from the government is a crucial predictor of green technology innovation adoption in the environmental dimension. Identifying the advantages brought about through the implementation of environmental policies can assist company managers in gaining a better understanding of their impact on the company’s operations [138]. This suggests that, theoretically, institutional pressure from government agencies is the most important factor driving the adoption of green technology innovation by 3PL firms in China, which aligns with the country’s situation.
Second, the study also validates the impact of adopting green technology innovation on the organizational economy, environment, operations, and intangible outcomes. This provides strong empirical evidence that can enhance organizational confidence in adopting green technology innovation. Previously, there has been limited theoretical research on the impact of adopting green technology innovation on intangible outcomes, particularly in the context of 3PL firms. Most studies have focused on the impact of adopting green technology innovation on organizational competitiveness, finance, and sustainability. Therefore, this study establishes the necessary theoretical foundation to further expand the understanding of adopting green technology innovation and its impact. Additionally, the study has evaluated the confounding effects of control variables, specifically company size, company age, and ownership type. The results indicate that company size and ownership type do not influence the adoption of green technology innovation by companies. However, the longer a company has been established, the more likely it is to adopt green technology innovation. Based on this finding, it can be inferred that the TOE-DOI framework is robust in terms of differences in company size and ownership type.
Finally, in contrast to the existing TOE-DOI framework, which uses linear models and theoretically assumes all relationships to be linear, this study has employed ANN analysis to validate and explain the nonlinear relationships present in the TOE-DOI framework. This provides unprecedented new theoretical insights and perspectives. Therefore, theoretically, the researchers have validated the nonlinear relationships in the TOE-DOI framework, as this study provides the empirical evidence required to support this new theoretical understanding. The ranking of the second-order constructs based on ANN analysis does not necessarily align with the ranking of the direct effects in PLS-SEM. By demonstrating the use of ANN analysis based on deep learning to rank the impact of second-order structures, this study establishes a new methodological foundation.
6.3. Managerial Implications
This research has multiple impacts on the 3PL lending industry. From a managerial perspective, this study provides feasible recommendations for managers to strengthen their sustainable development strategies. The research findings will enable organizational managers and other stakeholders to make better decisions on how to adopt green technology innovations within an organization. This research offers viable insights for those seeking to adopt green technology innovations, bringing economic, environmental, operational, and intangible benefits. For example, decision-makers can pay more attention to institutional pressures and shift from a passive to an active approach by supporting their organization and enhancing employees’ technological capabilities, further improving their understanding of the relative advantages of green technology innovations and increasing their compatibility. From an organizational standpoint, the quality of human resources can be enhanced through training, examination, and learning, and green internal integration can be emphasized. From the perspective of the organizational environment, implementing external integration with green suppliers and green customers to increase the adoption rate of green technology innovations ultimately contributes to obtaining more economic, environmental, operational, and intangible outcomes.
Furthermore, decision-makers can pay more attention to organizational support through internal training, cross-departmental “green” dialogs, green integration, and motivational measures to enhance the quality of human resources. Decision-makers should prioritize external institutional pressures, including mandatory pressure, normative pressure, and mimetic pressure, in the environmental dimension. The Chinese government should enhance the enforcement of environmental laws and regulations and implement market-based environmental regulatory measures, such as emission reduction subsidies. When facing institutional pressures, companies should allocate idle resources, such as materials, cash, and talent, for innovation and combine them with environmental practices. This will increase the likelihood of adopting green technology innovations and achieving positive environmental outcomes. Organizations should not implement innovative practices in isolation; they need to complement them with creative thinking and knowledge [93]. By adopting innovative green technologies, 3PL companies can differentiate themselves from competitors, attract environmentally conscious customers, and increase their market share. The integration of green suppliers and green customers can facilitate the integration of green thinking and knowledge with external supply chain partners, which further contributes to the adoption of green technology innovations.
Finally, from the government or country’s perspective, policymakers can utilize the findings of this study to facilitate the advancement and innovation of green technologies. This approach can cultivate a competitive environment that encourages environmental responsibility and sustainable development in the logistics sector. The research results are advantageous for the sustainable development of the environment because organizations in the 3PL industry can achieve economic, operational, and intangible benefits by adopting GTI. This can further incentivize other non-adopting companies to adopt this updated GTI, ultimately resulting in positive environmental outcomes. In the long term, this brings greater benefits to the overall societal environment.
6.4. Limitations and Future Research Directions
Due to its exclusive focus on Chinese 3PL firms, this study was influenced by factors such as national geographic location and culture. Therefore, the findings of this study may differ from those of research conducted in other regions. Therefore, there is an opportunity for future research in different regions or for conducting comparative studies in diverse areas to better capture cultural and geographical variations. In this study, nine determining factors were chosen for empirical research based on the TOE-DOI framework. In the future, a more comprehensive selection of various factors can be made to address these research gaps. Additionally, while this study concentrated on 3PL firms in the service industry, it can be expanded to encompass other service industries, such as construction, engineering, and technology. Finally, to compare and enhance the explanatory power of the dependent variable, GTIA, in the model, researchers can consider incorporating other relevant variables and boundary conditions and refining the proposed model.
7. Conclusions
This study aimed to identify the determinants within the TOE-DOI research framework that influence the adoption of green technology innovation in the Chinese third-party logistics industry. The determinants include technological dimensions (relative advantage, compatibility, and complexity), organizational dimensions (organizational support, quality of human resources, and green internal integration), and environmental dimensions (institutional pressure, green supplier integration, and green customer integration). The study also examined the economic, environmental, operational, and intangible outcomes that result from the adoption of green technology innovation in these companies. The primary data for this assessment were provided by the managers of Chinese 3PL. The main objective of this study was to test hypotheses and analyze the relationships between variables. The effectiveness, reliability, and structural model of the study were evaluated using PLS-SEM technology in a two-stage evaluation. Additionally, ANN technology was used to analyze the impact ranking of exogenous construction and first-order construction. The results supported 12 out of 13 hypotheses, with one hypothesis (H3) being rejected. The study demonstrated a positive correlation between eight independent variables and the dependent variable, as well as between the dependent variable and its four outcome variables. These findings emphasize the significance of relative advantage, compatibility, organizational support, quality of human resources, green internal integration, policy pressure, green supplier integration, and green customer integration in the adoption of green technology innovation. Furthermore, the study highlights the importance of adoption for environmental, economic, operational, and intangible outcomes. The article has also discussed the limitations of the study, potential future research directions, and the theoretical and practical implications of the findings.
This study expands the TOE-DOI framework by incorporating green internal integration, green supplier integration, and green customer integration. Additionally, the analysis of the collected sample data using ANN has revealed nonlinear relationships, which contributes to a new understanding of the TOE-DOI framework. Previous studies primarily utilized linear regression or PLS-SEM for linear analysis. Moreover, the extended TOE-DOI framework plays a crucial role in enhancing the economic, environmental, operational, and intangible outcomes of 3PL firms that adopt green technology innovation. The study demonstrated that relative advantage and compatibility are key technological driving factors for the adoption of green technology innovation. Moreover, organizational support, human resource quality, and green internal integration are significant organizational factors that drive 3PL firms to adopt green technology innovation. Conversely, institutional pressure, green supplier integration, and green customer integration are the primary environmental factors that influence the adoption of green technology innovation. Company age significantly impacts the adoption of green technology innovation, with older companies being more likely to adopt it. However, the organizational size and ownership type of 3PL firms do not appear to influence the adoption of green technology innovation. Furthermore, based on the standardized importance from the sensitivity analysis of the ANN model, the study reveals that the importance of each factor varies, with institutional pressure being the most crucial determining factor. The next factor is the integration of green suppliers. Therefore, decision-makers should prioritize the significance of the external organizational environment, institutional pressure, the importance of green supplier integration, and the relative advantage of green technology innovation. Based on the findings of this study, managers should prioritize institutional pressure and green supplier integration as key areas for strategic development. Managers should adopt a positive mindset towards institutional pressure, recognizing it not merely as “passive acceptance” but as an opportunity to proactively embrace green initiatives. Additionally, they should approach green integration practices among supply chain partners with a long-term perspective. Decision-makers at enterprises can change their mindsets and recognize that any effort to improve the environment is an opportunity for economic, environmental, and corporate image enhancement, rather than an additional cost to their operations. Furthermore, they should allocate different decision factors based on the proportion of existing resources. Future research could further explore the long-term impact of green technology adoption on corporate performance.
Author Contributions
Conceptualization, S.L., R.T. and S.R.H.H.; methodology, S.L.; software, S.L.; validation, S.L.; formal analysis, S.L.; investigation, S.L.; resources, R.T. and S.R.H.H.; data curation, S.L.; writing—original draft preparation, S.L.; writing—review and editing, S.L. and S.R.H.H.; visualization, S.L.; supervision, R.T. All authors have read and agreed to the published version of the manuscript.
Funding
This research received no external funding.
Data Availability Statement
The original contributions of this study are detailed in the article. For further inquiries, please contact the author.
Acknowledgments
The authors would like to thank the editors and the anonymous reviewers for their insightful suggestions, which have significantly improved the quality of this paper.
Conflicts of Interest
The authors declare no conflicts of interest.
Abbreviations
The following abbreviations are used in this manuscript:
| GTIA | Green technology innovation adoption |
| 3PL | Third-party logistics |
| DOI | Diffusion of Innovation |
| SMEs | Small and Medium-sized Enterprises |
| NP | Normative Pressures |
| CP | Normative Pressures |
| RP | Regulative Pressure |
| TT | Regulative Pressure |
| DAT | Data acquisition Information |
| IT | Information Technology |
| TOE | Technology–Organization–Environment |
| PLS-SEM | Partial least squares structural equation modeling |
| ANN | Artificial neural network |
| RA | Relative advantage |
| CX | Complexity |
| CY | Compatibility |
| OS | Organizational support |
| QHR | Quality of human resources |
| GII | Green internal integration |
| InP | Institutional pressure |
| GSI | Green supplier integration |
| GCI | Green customer integration |
| GC | Green creativity |
| DDC | Data-driven culture |
| EnO | Environmental outcomes |
| EcO | Economic outcomes |
| OpO | Operational outcomes |
| InO | Intangible outcomes |
References
- Zhang, M.; Yan, T.; Gao, W.; Xie, W.; Yu, Z. How does environmental regulation affect real green technology innovation and strategic green technology innovation? Sci. Total Environ. 2023, 872, 162221. [Google Scholar] [CrossRef] [PubMed]
- Beamon, B.M. Designing the green supply chain. Logist. Inf. Manag. 1999, 12, 332–342. [Google Scholar] [CrossRef]
- Mak, S.-L.; Wong, Y.-M.; Ho, K.-C.; Lee, C.-C. Contemporary green solutions for the logistics and transportation industry—With case illustration of a leading global 3PL based in Hong Kong. Sustainability 2022, 14, 8777. [Google Scholar] [CrossRef]
- Zailani, S.; Iranmanesh, M.; Nikbin, D.; Jumadi, H.B. Determinants and environmental outcome of green technology innovation adoption in the transportation industry in Malaysia. Asian J. Technol. Innov. 2014, 22, 286–301. [Google Scholar] [CrossRef]
- Ritchie, H.; Roser, M. How Much CO2 Can the World Emit while Keeping Warming below 1.5 °C and 2 °C? Our World in Data. 2023. Available online: https://ourworldindata.org/how-much-co2-can-the-world-emit-while-keeping-warming-below-15c-and-2c?utm_campaign=Collective%20Intelligece&utm_source=hs_email&utm_medium=email&_hsenc=p2ANqtz-_sSMo9UCiEEhq%20XPZ0ohjm38xlE4kZye4yLVBjMq4aZsEup7LfQmG0tZxHkSvt3HoQr__0a (accessed on 15 August 2024).
- Guo, X.; Wang, D. Analysis of the spatial relevance and influencing factors of carbon emissions in the logistics industry from China. Environ. Sci. Pollut. Res. 2022, 29, 2672–2684. [Google Scholar] [CrossRef]
- Shan, S.; Genç, S.Y.; Kamran, H.W.; Dinca, G. Role of green technology innovation and renewable energy in carbon neutrality: A sustainable investigation from Turkey. J. Environ. Manag. 2021, 294, 113004. [Google Scholar] [CrossRef]
- Lv, C.; Shao, C.; Lee, C.-C. Green technology innovation and financial development: Do environmental regulation and innovation output matter? Energy Econ. 2021, 98, 105237. [Google Scholar] [CrossRef]
- Shahzad, M.; Qu, Y.; Rehman, S.U.; Zafar, A.U. Adoption of green innovation technology to accelerate sustainable development among manufacturing industry. J. Innov. Knowl. 2022, 7, 100231. [Google Scholar] [CrossRef]
- Meramveliotakis, G.; Manioudis, M. History, knowledge, and sustainable economic development: The contribution of john stuart mill’s grand stage theory. Sustainability 2021, 13, 1468. [Google Scholar] [CrossRef]
- Guo, R.; Lv, S.; Liao, T.; Xi, F.; Zhang, J.; Zuo, X.; Cao, X.; Feng, Z.; Zhang, Y. Classifying green technologies for sustainable innovation and investment. Resour. Conserv. Recycl. 2020, 153, 104580. [Google Scholar] [CrossRef]
- Wu, H.; Li, Y.; Hao, Y.; Ren, S.; Zhang, P. Environmental decentralization, local government competition, and regional green development: Evidence from China. Sci. Total Environ. 2020, 708, 135085. [Google Scholar] [CrossRef]
- Chen, Y.-S.; Chang, C.-H. The determinants of green product development performance: Green dynamic capabilities, green transformational leadership, and green creativity. J. Bus. Ethics 2013, 116, 107–119. [Google Scholar] [CrossRef]
- Qiu, L.; Jie, X.; Wang, Y.; Zhao, M. Green product innovation, green dynamic capability, and competitive advantage: Evidence from Chinese manufacturing enterprises. Corp. Soc. Responsib. Environ. Manag. 2020, 27, 146–165. [Google Scholar] [CrossRef]
- Zhu, Y.; Zhang, H.; Siddik, A.B.; Zheng, Y.; Sobhani, F.A. Understanding Corporate Green Competitive Advantage through Green Technology Adoption and Green Dynamic Capabilities: Does Green Product Innovation Matter? Systems 2023, 11, 461. [Google Scholar] [CrossRef]
- Liu, X.; Liu, F.; Ren, X. Firms’ digitalization in manufacturing and the structure and direction of green innovation. J. Environ. Manag. 2023, 335, 117525. [Google Scholar] [CrossRef]
- Sun, Y.; Gao, P.; Tian, W.; Guan, W. Green innovation for resource efficiency and sustainability: Empirical analysis and policy. Resour. Policy 2023, 81, 103369. [Google Scholar] [CrossRef]
- Wicki, S.; Hansen, E.G. Green technology innovation: Anatomy of exploration processes from a learning perspective. Bus. Strategy Environ. 2019, 28, 970–988. [Google Scholar] [CrossRef]
- Ren, S.; Huang, M.; Liu, D.; Yan, J. Understanding the impact of mandatory CSR disclosure on green innovation: Evidence from Chinese listed firms. Br. J. Manag. 2023, 34, 576–594. [Google Scholar] [CrossRef]
- Hottenrott, H.; Peters, B. Innovative capability and financing constraints for innovation: More money, more innovation? Rev. Econ. Stat. 2012, 94, 1126–1142. [Google Scholar] [CrossRef]
- Yang, D.; Jiang, W.; Zhao, W. Proactive environmental strategy, innovation capability, and stakeholder integration capability: A mediation analysis. Bus. Strateg. Environ. 2019, 28, 1534–1547. [Google Scholar] [CrossRef]
- Adams, R.; Jeanrenaud, S.; Bessant, J.; Denyer, D.; Overy, P. Sustainability-Oriented Innovation: A Systematic Review. Int. J. Manag. Rev. 2016, 18, 180–205. [Google Scholar] [CrossRef]
- Huang, Y.-C.; Huang, C.-H. Exploring institutional pressure, the top management team’s response, green innovation adoption, and firm performance: Evidence from Taiwan’s electrical and electronics industry. Eur. J. Innov. Manag. 2024, 27, 800–824. [Google Scholar] [CrossRef]
- Liu, F.; Wang, R.; Fang, M. Mapping green innovation with machine learning: Evidence from China. Technol. Forecast. Soc. Change 2024, 200, 123107. [Google Scholar] [CrossRef]
- Luthra, S.; Kumar, A.; Sharma, M.; Garza-Reyes, J.A.; Kumar, V. An analysis of operational behavioural factors and circular economy practices in SMEs: An emerging economy perspective. J. Bus. Res. 2022, 141, 321–336. [Google Scholar] [CrossRef]
- Hu, J.; Wu, H.; Ying, S.X. Environmental regulation, market forces, and corporate environmental responsibility: Evidence from the implementation of cleaner production standards in China. J. Bus. Res. 2022, 150, 606–622. [Google Scholar] [CrossRef]
- Wang, X.; Dong, F. The dynamic relationships among growth in the logistics industry, energy consumption, and carbon emission: Recent evidence from China. J. Pet. Explor. Prod. Technol. 2023, 13, 487–502. [Google Scholar] [CrossRef]
- Wendling, Z.; Emerson, J.W.; de Sherbinin, A.; Esty, D.C. Environmental Performance Index; Yale Center for Environmental Law & Policy: New Haven, CT, USA, 2020. [Google Scholar] [CrossRef]
- Hu, J.; Hu, M.; Zhang, H. Has the construction of ecological civilization promoted green technology innovation? Environ. Technol. Innov. 2023, 29, 102960. [Google Scholar] [CrossRef]
- Wang, Q.; Qu, J.; Wang, B.; Wang, P.; Yang, T. Green technology innovation development in China in 1990–2015. Sci. Total Environ. 2019, 696, 134008. [Google Scholar] [CrossRef]
- Yang, C.; Zhu, C.; Albitar, K. ESG ratings and green innovation: AU-shaped journey towards sustainable development. Bus. Strateg. Environ. 2024. [Google Scholar] [CrossRef]
- Xie, Z. China’s historical evolution of environmental protection along with the forty years’ reform and opening-up. Environ. Sci. Ecotechnology 2020, 1, 100001. [Google Scholar] [CrossRef]
- ADB. Asian Development Outlook 2012; ADB. 2012. Available online: https://www.adb.org/sites/default/files/publication/29704/ado2012.pdf (accessed on 24 August 2024).
- International Energy Agency (IEA). Improving the Sustainability of Passenger and Freight Transport. Available online: https://www.iea.org/events/iea-cop26-rethinking-the-built-environment-s-potential-in-connection-with-our-energy-system (accessed on 5 April 2022).
- Rogers, E.M. Diffusion of Innovations: Modifications of a Model for Telecommunications 1995; Springer: New York, NY, USA, 1995. [Google Scholar]
- Clohessy, T.; Acton, T. Investigating the influence of organizational factors on blockchain adoption: An innovation theory perspective. Ind. Manag. Data Syst. 2019, 119, 1457–1491. [Google Scholar] [CrossRef]
- Lin, C.-Y.; Alam, S.S.; Ho, Y.-H.; Al-Shaikh, M.E.; Sultan, P. Adoption of green supply chain management among SMEs in Malaysia. Sustainability 2020, 12, 6454. [Google Scholar] [CrossRef]
- Hair, J.F.; Risher, J.J.; Sarstedt, M.; Ringle, C.M. When to use and how to report the results of PLS-SEM. Eur. Bus. Rev. 2019, 31, 2–24. [Google Scholar] [CrossRef]
- Huang, Z.; Liao, G.; Li, Z. Loaning scale and government subsidy for promoting green innovation. Technol. Forecast. Soc. Change 2019, 144, 148–156. [Google Scholar] [CrossRef]
- Chen, X.; Yi, N.; Zhang, L.; Li, D. Does institutional pressure foster corporate green innovation? Evidence from China’s top 100 companies. J. Clean Prod. 2018, 188, 304–311. [Google Scholar] [CrossRef]
- Abdullah, M.; Zailani, S.; Iranmanesh, M.; Jayaraman, K. Barriers to green innovation initiatives among manufacturers: The Malaysian case. Rev. Manag. Sci. 2016, 10, 683–709. [Google Scholar] [CrossRef]
- Porter, M.E.; Linde, C.v.d. Toward a new conception of the environment-competitiveness relationship. J. Econ. Perspect. 1995, 9, 97–118. [Google Scholar] [CrossRef]
- Feng, S.; Zhang, R.; Li, G. Environmental decentralization, digital finance and green technology innovation. Struct. Change Econ. Dyn. 2022, 61, 70–83. [Google Scholar] [CrossRef]
- Ma, K. Digital inclusive finance and corporate green technology innovation. Financ. Res. Lett. 2023, 55, 104015. [Google Scholar] [CrossRef]
- Qing, L.; Chun, D.; Dagestani, A.A.; Li, P. Does proactive green technology innovation improve financial performance? Evidence from listed companies with semiconductor concepts stock in China. Sustainability 2022, 14, 4600. [Google Scholar] [CrossRef]
- Wang, Y.; Zhao, Z.; Zhang, S.; Su, Y. Research on the impact of digital inclusive finance on regional carbon emissions: Based on the sustainable green innovation of small and medium-sized enterprises. J. Clean Prod. 2023, 428, 139513. [Google Scholar] [CrossRef]
- Ogiemwonyi, O.; Alam, M.N.; Hago, I.E.; Azizan, N.A.; Hashim, F.; Hossain, M.S. Green innovation behaviour: Impact of industry 4.0 and open innovation. Heliyon 2023, 9, e16524. [Google Scholar] [CrossRef] [PubMed]
- Etzion, D. Research on organizations and the natural environment, 1992-present: A review. J. Manag. 2007, 33, 637–664. [Google Scholar] [CrossRef]
- Farooq, U.; Wen, J.; Tabash, M.I.; Fadoul, M. Environmental regulations and capital investment: Does green innovation allow to grow? Int. Rev. Econ. Financ. 2024, 89, 878–893. [Google Scholar] [CrossRef]
- Wong, S.; Yeung, J.K.-W.; Lau, Y.-Y.; Kawasaki, T. A case study of how Maersk adopts cloud-based blockchain integrated with machine learning for sustainable practices. Sustainability 2023, 15, 7305. [Google Scholar] [CrossRef]
- Fang, Y.; Shao, Z. Whether green finance can effectively moderate the green technology innovation effect of heterogeneous environmental regulation. Int. J. Environ. Res. Public Health 2022, 19, 3646. [Google Scholar] [CrossRef]
- Singh, S.K.; Del Giudice, M.; Chiappetta Jabbour, C.J.; Latan, H.; Sohal, A.S. Stakeholder pressure, green innovation, and performance in small and medium-sized enterprises: The role of green dynamic capabilities. Bus. Strateg. Environ. 2022, 31, 500–514. [Google Scholar] [CrossRef]
- Horbach, J.; Rammer, C.; Rennings, K. Determinants of eco-innovations by type of environmental impact—The role of regulatory push/pull, technology push and market pull. Ecol. Econ. 2012, 78, 112–122. [Google Scholar] [CrossRef]
- Cai, W.; Li, G. The drivers of eco-innovation and its impact on performance: Evidence from China. J. Clean Prod. 2018, 176, 110–118. [Google Scholar] [CrossRef]
- Lv, H.; Li, D. Impacts of heterogeneous green consumers on green innovation in electric vehicle and charging pile firms. Sustain. Prod. Consum. 2021, 28, 1216–1231. [Google Scholar] [CrossRef]
- Long, S.; Liao, Z. Green relational capital, integration capabilities and environmental innovation adoption: The moderating role of normative pressures. Sustain. Dev. 2023, 31, 1570–1580. [Google Scholar] [CrossRef]
- Jazairy, A.; von Haartman, R. Analysing the institutional pressures on shippers and logistics service providers to implement green supply chain management practices. Int. J. Logist. Res. Appl. 2020, 23, 44–84. [Google Scholar] [CrossRef]
- Sharma, M.; Luthra, S.; Joshi, S.; Kumar, A.; Jain, A. Green logistics driven circular practices adoption in industry 4.0 Era: A moderating effect of institution pressure and supply chain flexibility. J. Clean Prod. 2023, 383, 135284. [Google Scholar] [CrossRef]
- Lin, C.-Y.; Ho, Y.-H. An empirical study on logistics service providers’ intention to adopt green innovations. J. Technol. Manag. Innov. 2008, 3, 17–26. Available online: https://www.redalyc.org/pdf/847/84730103.pdf (accessed on 18 May 2024).
- Chu, Z.; Wang, L.; Lai, F. Customer pressure and green innovations at third party logistics providers in China: The moderation effect of organizational culture. Int. J. Logist. Manag. 2019, 30, 57–75. [Google Scholar] [CrossRef]
- Tseng, M.-L.; Chiu, A.S.; Liang, D. Sustainable consumption and production in business decision-making models. Resour. Conserv. Recycl. 2018, 128, 118–121. [Google Scholar] [CrossRef]
- Aguilera-Caracuel, J.; Ortiz-de-Mandojana, N. Green innovation and financial performance: An institutional approach. Organ. Environ. 2013, 26, 365–385. [Google Scholar] [CrossRef]
- Johl, S.K.; Toha, M.A. The nexus between proactive eco-innovation and firm financial performance: A circular economy perspective. Sustainability 2021, 13, 6253. [Google Scholar] [CrossRef]
- Davis, F.D. Perceived usefulness, perceived ease of use, and user acceptance of information technology. MIS Q. 1989, 13, 319–340. [Google Scholar] [CrossRef]
- Ajzen, I. The theory of planned behavior. Organ. Behav. Hum. Decis. Process. 1991, 50, 179–211. [Google Scholar] [CrossRef]
- Venkatesh, V.; Bala, H. Technology acceptance model 3 and a research agenda on interventions. Decis. Sci. 2008, 39, 273–315. [Google Scholar] [CrossRef]
- Rogers, E.M. Diffusion of Innovations 2003, 5th ed.; Free Press: New York, NY, USA, 2003. [Google Scholar]
- Yoon, C.; Lim, D.; Park, C. Factors affecting adoption of smart farms: The case of Korea. Comput. Hum. Behav. 2020, 108, 106309. [Google Scholar] [CrossRef]
- Tornatzky, L.G.; Fleischer, M.; Chakrabarti, A.K. Processes of Technological Innovation; Lexington Books: Lanham, MD, USA, 1990. [Google Scholar]
- AlBar, A.M.; Hoque, M.R. Factors affecting cloud ERP adoption in Saudi Arabia: An empirical study. Inf. Dev. 2019, 35, 150–164. [Google Scholar] [CrossRef]
- Ali, O.; Shrestha, A.; Osmanaj, V.; Muhammed, S. Cloud computing technology adoption: An evaluation of key factors in local governments. Inf. Technol. People 2020, 34, 666–703. [Google Scholar] [CrossRef]
- Wang, Y.-M.; Wang, Y.-S.; Yang, Y.-F. Understanding the determinants of RFID adoption in the manufacturing industry. Technol. Forecast. Soc. Change 2010, 77, 803–815. [Google Scholar] [CrossRef]
- Alshamaila, Y.; Papagiannidis, S.; Li, F. Cloud computing adoption by SMEs in the north east of England: A multi-perspective framework. J. Enterp. Inf. Manag. 2013, 26, 250–275. [Google Scholar] [CrossRef]
- Tornatzky, L.G.; Klein, K.J. Innovation characteristics and innovation adoption-implementation: A meta-analysis of findings. IEEE Trans. Eng. Manag. 1982, EM-29, 28–45. [Google Scholar] [CrossRef]
- Piaralal, S.K.; Nair, S.R.; Yahya, N.; Karim, J.A. An integrated model of the likelihood and extent of adoption of green practices in small and medium sized logistics firms. Am. J. Econ. 2015, 5, 251–258. [Google Scholar] [CrossRef]
- Nath, S.D.; Khayer, A.; Majumder, J.; Barua, S. Factors affecting blockchain adoption in apparel supply chains: Does sustainability-oriented supplier development play a moderating role? Ind. Manag. Data Syst. 2022, 122, 1183–1214. [Google Scholar] [CrossRef]
- Hiran, K.K.; Henten, A. An integrated TOE–DOI framework for cloud computing adoption in the higher education sector: Case study of Sub-Saharan Africa, Ethiopia. Int. J. Syst. Assur. Eng. Manag. 2020, 11, 441–449. [Google Scholar] [CrossRef]
- Lutfi, A.; Alshira’h, A.F.; Alshirah, M.H.; Al-Okaily, M.; Alqudah, H.; Saad, M.; Ibrahim, N.; Abdelmaksoud, O. Antecedents and impacts of enterprise resource planning system adoption among Jordanian SMEs. Sustainability 2022, 14, 3508. [Google Scholar] [CrossRef]
- Alkhalil, A.; Sahandi, R.; John, D. An exploration of the determinants for decision to migrate existing resources to cloud computing using an integrated TOE-DOI model. J. Cloud Comput. 2017, 6, 1–20. [Google Scholar] [CrossRef]
- Amini, M.; Bakri, A. Cloud computing adoption by SMEs in the Malaysia: A multi-perspective framework based on DOI theory and TOE framework. J. Inf. Technol. Inf. Syst. Res. (JITISR) 2015, 9, 121–135. Available online: https://ssrn.com/abstract=2841175 (accessed on 27 June 2024).
- Usman, U.M.Z.; Ahmad, M.N.; Zakaria, N.H. The determinants of adoption of cloud-based ERP of Nigerian’s SMEs manufacturing sector using TOE framework and DOI theory. Int. J. Enterp. Inf. Syst. (IJEIS) 2019, 15, 27–43. [Google Scholar] [CrossRef]
- Hertz, S.; Alfredsson, M. Strategic development of third party logistics providers. Ind. Mark. Manag. 2003, 32, 139–149. [Google Scholar] [CrossRef]
- Giusti, R.; Manerba, D.; Bruno, G.; Tadei, R. Synchromodal logistics: An overview of critical success factors, enabling technologies, and open research issues. Transp. Res. Part E Logist. Transp. Rev. 2019, 129, 92–110. [Google Scholar] [CrossRef]
- Hao, J.; Shi, H.; Shi, V.; Yang, C. Adoption of automatic warehousing systems in logistics firms: A technology–organization–environment framework. Sustainability 2020, 12, 5185. [Google Scholar] [CrossRef]
- Perotti, S.; Micheli, G.J.; Cagno, E. Motivations and barriers to the adoption of green supply chain practices among 3PLs. Int. J. Logist. Syst. Manag. 2015, 20, 179–198. [Google Scholar] [CrossRef]
- Zhang, Y.; Li, X.; Wang, L.; Zhao, X.; Gao, J. Financing capital-constrained third party logistic firms: Fourth party logistic driven financing mode vs. private lending driven financing mode. Int. J. Prod. Res. 2022, 60, 2963–2982. [Google Scholar] [CrossRef]
- Kommenda, N. How your flight emits as much CO2 as many people do in a year. The Guardian, 19 July 2019; p. 19. [Google Scholar]
- Li, D.; Zheng, M.; Cao, C.; Chen, X.; Ren, S.; Huang, M. The impact of legitimacy pressure and corporate profitability on green innovation: Evidence from China top 100. J. Clean Prod. 2017, 141, 41–49. [Google Scholar] [CrossRef]
- Janjevic, M.; Knoppen, D.; Winkenbach, M. Integrated decision-making framework for urban freight logistics policy-making. Transp. Res. Part D Transp. Environ. 2019, 72, 333–357. [Google Scholar] [CrossRef]
- Zhu, Q.; Sarkis, J.; Lai, K.-h. Institutional-based antecedents and performance outcomes of internal and external green supply chain management practices. J. Purch. Supply Manag. 2013, 19, 106–117. [Google Scholar] [CrossRef]
- Pagell, M. Understanding the factors that enable and inhibit the integration of operations, purchasing and logistics. J. Oper. Manag. 2004, 22, 459–487. [Google Scholar] [CrossRef]
- Chu, Z.; Xu, J.; Lai, F.; Collins, B.J. Institutional theory and environmental pressures: The moderating effect of market uncertainty on innovation and firm performance. IEEE Trans. Eng. Manag. 2018, 65, 392–403. [Google Scholar] [CrossRef]
- Du, L.; Zhang, Z.; Feng, T. Linking green customer and supplier integration with green innovation performance: The role of internal integration. Bus. Strateg. Environ. 2018, 27, 1583–1595. [Google Scholar] [CrossRef]
- Hartmann, J.; Inkpen, A.; Ramaswamy, K. An FsQCA exploration of multiple paths to ecological innovation adoption in European transportation. J. World Bus. 2022, 57, 101327. [Google Scholar] [CrossRef]
- Cosimato, S.; Troisi, O. Stakeholder engagement and social media communication in banking industry: Monte dei Paschi di Siena case study. J. Bus. Econ. 2015, 6, 249–258. [Google Scholar] [CrossRef]
- Orji, I.J.; Kusi-Sarpong, S.; Gupta, H.; Okwu, M. Evaluating challenges to implementing eco-innovation for freight logistics sustainability in Nigeria. Transp. Res. Part A Policy Pract. 2019, 129, 288–305. [Google Scholar] [CrossRef]
- Zhang, J.; Liang, G.; Feng, T.; Yuan, C.; Jiang, W. Green innovation to respond to environmental regulation: How external knowledge adoption and green absorptive capacity matter? Bus. Strateg. Environ. 2020, 29, 39–53. [Google Scholar] [CrossRef]
- Ližbetinová, L.; Lejsková, P.; Nedeliaková, E.; Caha, Z.; Hitka, M. The growing importance of ecological factors to employees in the transport and logistics sector. Ekon. Istraz. 2022, 35, 4379–4403. [Google Scholar] [CrossRef]
- Chen, X.; Chen, Y.; Zhang, X.; He, Q. Green transformational leadership and green innovation in megaprojects: Is green knowledge sharing a missing link? Eng. Constr. Archit. Manag. 2023. [Google Scholar] [CrossRef]
- Ngo, Q.-H. The adoption of green market orientation in logistic industries—Empirical evidence from Vietnamese SMEs. J. Open Innov. Technol. Mark. Complex. 2022, 8, 199. [Google Scholar] [CrossRef]
- El Baz, J.; Laguir, I. Third-party logistics providers (TPLs) and environmental sustainability practices in developing countries: The case of Morocco. Int. J. Oper. Prod. Manag. 2017, 37, 1451–1474. [Google Scholar] [CrossRef]
- Rossi, S.; Colicchia, C.; Cozzolino, A.; Christopher, M. The logistics service providers in eco-efficiency innovation: An empirical study. Supply Chain. Manag. Int. J. 2013, 18, 583–603. [Google Scholar] [CrossRef]
- García-Pozo, A.; Marchante-Mera, A.J.; Campos-Soria, J.A. Innovation, environment, and productivity in the Spanish service sector: An implementation of a CDM structural model. J. Clean Prod. 2018, 171, 1049–1057. [Google Scholar] [CrossRef]
- Beltrán-Esteve, M.; Picazo-Tadeo, A.J. Assessing environmental performance trends in the transport industry: Eco-innovation or catching-up? Energy Econ. 2015, 51, 570–580. [Google Scholar] [CrossRef]
- Ifinedo, P. Internet/e-business technologies acceptance in Canada’s SMEs: An exploratory investigation. Internet Res. 2011, 21, 255–281. [Google Scholar] [CrossRef]
- Barbieri, N.; Marzucchi, A.; Rizzo, U. Knowledge sources and impacts on subsequent inventions: Do green technologies differ from non-green ones? Res. Policy 2020, 49, 103901. [Google Scholar] [CrossRef]
- Leong, L.-Y.; Hew, J.-J.; Lee, V.-H.; Tan, G.W.-H.; Ooi, K.-B.; Rana, N.P. An SEM-ANN analysis of the impacts of Blockchain on competitive advantage. Ind. Manag. Data Syst. 2023, 123, 967–1004. [Google Scholar] [CrossRef]
- Jun, W.; Ali, W.; Bhutto, M.Y.; Hussain, H.; Khan, N.A. Examining the determinants of green innovation adoption in SMEs: A PLS-SEM approach. Eur. J. Innov. Manag. 2021, 24, 67–87. [Google Scholar] [CrossRef]
- Aboramadan, M.; Karatepe, O.M. Green human resource management, perceived green organizational support and their effects on hotel employees’ behavioral outcomes. Int. J. Contemp. Hosp. Manag. 2021, 33, 3199–3222. [Google Scholar] [CrossRef]
- Wolf, J. Sustainable supply chain management integration: A qualitative analysis of the German manufacturing industry. J. Bus. Ethics 2011, 102, 221–235. [Google Scholar] [CrossRef]
- Yu, W.; Chavez, R.; Feng, M.; Wiengarten, F. Integrated green supply chain management and operational performance. Supply Chain. Manag. Int. J. 2014, 19, 683–696. [Google Scholar] [CrossRef]
- Wong, C.Y.; Wong, C.W.; Boon-itt, S. Effects of green supply chain integration and green innovation on environmental and cost performance. Int. J. Prod. Res. 2020, 58, 4589–4609. [Google Scholar] [CrossRef]
- Lo, S.M.; Zhang, S.; Wang, Z.; Zhao, X. The impact of relationship quality and supplier development on green supply chain integration: A mediation and moderation analysis. J. Clean Prod. 2018, 202, 524–535. [Google Scholar] [CrossRef]
- Russo, M.V.; Fouts, P.A. A resource-based perspective on corporate environmental performance and profitability. Acad. Manag. J. 1997, 40, 534–559. [Google Scholar] [CrossRef]
- Kong, T.; Feng, T.; Huo, B. Green supply chain integration and financial performance: A social contagion and information sharing perspective. Bus. Strateg. Environ. 2021, 30, 2255–2270. [Google Scholar] [CrossRef]
- Li, L.; Msaad, H.; Sun, H.; Tan, M.X.; Lu, Y.; Lau, A.K. Green innovation and business sustainability: New evidence from energy intensive industry in China. Int. J. Environ. Res. Public Health 2020, 17, 7826. [Google Scholar] [CrossRef]
- Sun, Y.; Sun, H. Green innovation strategy and ambidextrous green innovation: The mediating effects of green supply chain integration. Sustainability 2021, 13, 4876. [Google Scholar] [CrossRef]
- Arranz, N.; Arguello, N.L.; de Arroyabe, J.C.F. How do internal, market and institutional factors affect the development of eco-innovation in firms? J. Clean Prod. 2021, 297, 126692. [Google Scholar] [CrossRef]
- Liao, Z. Institutional pressure, knowledge acquisition and a firm’s environmental innovation. Bus. Strateg. Environ. 2018, 27, 849–857. [Google Scholar] [CrossRef]
- Berrone, P.; Fosfuri, A.; Gelabert, L.; Gomez-Mejia, L.R. Necessity as the mother of ‘green’inventions: Institutional pressures and environmental innovations. Strateg. Manag. J. 2013, 34, 891–909. [Google Scholar] [CrossRef]
- DiMaggio, P.J.; Powell, W.W. The iron cage revisited: Institutional isomorphism and collective rationality in organizational fields. Am. Sociol. Rev. 1983, 48, 147–160. [Google Scholar] [CrossRef]
- Prajogo, D.; Tang, A.K.; Lai, K.-H. Do firms get what they want from ISO 14001 adoption?: An Australian perspective. J. Clean Prod. 2012, 33, 117–126. [Google Scholar] [CrossRef]
- Borghesi, S.; Cainelli, G.; Mazzanti, M. Linking emission trading to environmental innovation: Evidence from the Italian manufacturing industry. Res. Policy 2015, 44, 669–683. [Google Scholar] [CrossRef]
- Nie, Y.; Cheng, D.; Liu, K. The effectiveness of environmental authoritarianism: Evidence from China’s administrative inquiry for environmental protection. Energy Econ. 2020, 88, 104777. [Google Scholar] [CrossRef]
- Li, Y. Environmental innovation practices and performance: Moderating effect of resource commitment. J. Clean Prod. 2014, 66, 450–458. [Google Scholar] [CrossRef]
- Zhang, B.; Wang, Z.; Lai, K.-h. Mediating effect of managers’ environmental concern: Bridge between external pressures and firms’ practices of energy conservation in China. J. Environ. Psychol. 2015, 43, 203–215. [Google Scholar] [CrossRef]
- Daddi, T.; Testa, F.; Frey, M.; Iraldo, F. Exploring the link between institutional pressures and environmental management systems effectiveness: An empirical study. J. Environ. Manag. 2016, 183, 647–656. [Google Scholar] [CrossRef]
- Huang, X.-X.; Hu, Z.-P.; Liu, C.-S.; Yu, D.-J.; Yu, L.-F. The relationships between regulatory and customer pressure, green organizational responses, and green innovation performance. J. Clean Prod. 2016, 112, 3423–3433. [Google Scholar] [CrossRef]
- Chang, Y.; Chen, L.; Zhou, Y.; Meng, Q. Elements, characteristics, and performances of inter-enterprise knowledge recombination: Empirical research on green innovation adoption in China’s heavily polluting industry. J. Environ. Manag. 2022, 310, 114736. [Google Scholar] [CrossRef] [PubMed]
- Yang, S.-Y.; Tsai, K.-H. Lifting the veil on the link between absorptive capacity and innovation: The roles of cross-functional integration and customer orientation. Ind. Mark. Manag. 2019, 82, 117–130. [Google Scholar] [CrossRef]
- Agan, Y.; Acar, M.F.; Borodin, A. Drivers of environmental processes and their impact on performance: A study of Turkish SMEs. J. Clean Prod. 2013, 51, 23–33. [Google Scholar] [CrossRef]
- Afum, E.; Osei-Ahenkan, V.Y.; Agyabeng-Mensah, Y.; Owusu, J.A.; Kusi, L.Y.; Ankomah, J. Green manufacturing practices and sustainable performance among Ghanaian manufacturing SMEs: The explanatory link of green supply chain integration. Manag. Environ. Qual. Int. J. 2020, 31, 1457–1475. [Google Scholar] [CrossRef]
- Bonn, M.A.; Cronin, J.J., Jr.; Cho, M. Do environmental sustainable practices of organic wine suppliers affect consumers’ behavioral intentions? The moderating role of trust. Cornell Hosp. Q. 2016, 57, 21–37. [Google Scholar] [CrossRef]
- Van den Berg, R.; De Langen, P.W. Environmental sustainability in container transport: The attitudes of shippers and forwarders. Int. J. Logist. Res. Appl. 2017, 20, 146–162. [Google Scholar] [CrossRef]
- de Sousa Jabbour, A.B.L.; Vazquez-Brust, D.; Jabbour, C.J.C.; Latan, H. Green supply chain practices and environmental performance in Brazil: Survey, case studies, and implications for B2B. Ind. Mark. Manag. 2017, 66, 13–28. [Google Scholar] [CrossRef]
- Yong, J.Y.; Yusliza, M.-Y.; Fawehinmi, O.O. Green human resource management: A systematic literature review from 2007 to 2019. Benchmarking Int. J. 2020, 27, 2005–2027. [Google Scholar] [CrossRef]
- Anser, M.K.; Yousaf, Z.; Zaman, K. Green technology acceptance model and green logistics operations: “To see which way the wind is blowing”. Front. Sustain. 2020, 1, 3. [Google Scholar] [CrossRef]
- Perotti, S.; Zorzini, M.; Cagno, E.; Micheli, G.J. Green supply chain practices and company performance: The case of 3PLs in Italy. Int. J. Phys. Distrib. Logist. Manag. 2012, 42, 640–672. [Google Scholar] [CrossRef]
- Noor, S.; Tajik, O.; Golzar, J. Simple random sampling. Int. J. Educ. Lang. Stud. 2022, 1, 78–82. [Google Scholar] [CrossRef]
- Yin, X.; Gong, Y.; Sun, N.; Li, D.; Wu, J.; Wang, J.; Qiu, L.; Li, H. Prevalence of inappropriate use behaviors of antibiotics and related factors among chinese antibiotic users: An online cross-sectional survey. BMC Infect. Dis. 2022, 22, 689. [Google Scholar] [CrossRef]
- Podsakoff, P.M.; MacKenzie, S.B.; Lee, J.-Y.; Podsakoff, N.P. Common method biases in behavioral research: A critical review of the literature and recommended remedies. J. Appl. Psychol. 2003, 88, 879. [Google Scholar] [CrossRef] [PubMed]
- Han, M.S.; Chen, W. Determinants of eco-innovation adoption of small and medium enterprises: An empirical analysis in Myanmar. Technol. Forecast. Soc. Change 2021, 173, 121146. [Google Scholar] [CrossRef]
- Lindell, M.K.; Whitney, D.J. Accounting for common method variance in cross-sectional research designs. J. Appl. Psychol. 2001, 86, 114. [Google Scholar] [CrossRef] [PubMed]
- Leong, L.-Y.; Hew, T.-S.; Ooi, K.-B.; Wei, J. Predicting mobile wallet resistance: A two-staged structural equation modeling-artificial neural network approach. Int. J. Inf. Manag. 2020, 51, 102047. [Google Scholar] [CrossRef]
- Kock, N. Common method bias in PLS-SEM: A full collinearity assessment approach. Int. J. e-Collab. (IJeC) 2015, 11, 1–10. [Google Scholar] [CrossRef]
- Hair, J.F.; Hult, G.T.M.; Ringle, C.M.; Sarstedt, M. A Primer on Partial Least Squares Structural Equation Modeling (PLS-SEM), 3rd ed.; Sage: Thousand Oaks, CA, USA, 2022. [Google Scholar]
- Tehseen, S.; Ramayah, T.; Sajilan, S. Testing and controlling for common method variance: A review of available methods. J. Manag. Sci. 2017, 4, 142–168. [Google Scholar] [CrossRef]
- Simmering, M.J.; Fuller, C.M.; Richardson, H.A.; Ocal, Y.; Atinc, G.M. Marker variable choice, reporting, and interpretation in the detection of common method variance: A review and demonstration. Organ. Res. Methods 2015, 18, 473–511. [Google Scholar] [CrossRef]
- Williams, L.J.; Hartman, N.; Cavazotte, F. Method variance and marker variables: A review and comprehensive CFA marker technique. Organ. Res. Methods 2010, 13, 477–514. [Google Scholar] [CrossRef]
- Oreg, S. Resistance to change: Developing an individual differences measure. J. Appl. Psychol. 2003, 88, 680. [Google Scholar] [CrossRef]
- Hair, J.F.; Hult, G.T.M.; Ringle, C.M.; Sarstedt, M.; Thiele, K.O. Mirror, mirror on the wall: A comparative evaluation of composite-based structural equation modeling methods. J. Acad. Mark. Sci. 2017, 45, 616–632. [Google Scholar] [CrossRef]
- Binsawad, M.H. Corporate social responsibility in higher education: A PLS-SEM neural network approach. IEEE Access 2020, 8, 29125–29131. [Google Scholar] [CrossRef]
- Leong, L.-Y.; Hew, T.-S.; Ooi, K.-B.; Lee, V.-H.; Hew, J.-J. A hybrid SEM-neural network analysis of social media addiction. Expert Syst. Appl. 2019, 133, 296–316. [Google Scholar] [CrossRef]
- Kumar, D.S.; Purani, K. Model specification issues in PLS-SEM: Illustrating linear and non-linear models in hospitality services context. J. Hosp. Tour. Technol. 2018, 9, 338–353. [Google Scholar] [CrossRef]
- Hair, J.F.; Ringle, C.M.; Sarstedt, M. PLS-SEM: Indeed a silver bullet. J. Mark. Theory Pract. 2011, 19, 139–152. [Google Scholar] [CrossRef]
- Hair, J.F., Jr.; Howard, M.C.; Nitzl, C. Assessing measurement model quality in PLS-SEM using confirmatory composite analysis. J. Bus. Res. 2020, 109, 101–110. [Google Scholar] [CrossRef]
- Sarstedt, M.; Ringle, C.M.; Hair, J.F. Partial least squares structural equation modeling. In Handbook of Market Research; Springer International Publishing: Cham, Switzerland, 2021; pp. 587–632. [Google Scholar]
- Fornell, C.; Larcker, D.F. Evaluating structural equation models with unobservable variables and measurement error. J. Mark. Res. 1981, 18, 39–50. [Google Scholar] [CrossRef]
- Henseler, J.; Hubona, G.; Ray, P.A. Using PLS path modeling in new technology research: Updated guidelines. Ind. Manag. Data Syst. 2016, 116, 2–20. [Google Scholar] [CrossRef]
- Peng, D.X.; Lai, F. Using partial least squares in operations management research: A practical guideline and summary of past research. J. Oper. Manag. 2012, 30, 467–480. [Google Scholar] [CrossRef]
- Hulland, J. Use of partial least squares (PLS) in strategic management research: A review of four recent studies. Strateg. Manag. J. 1999, 20, 195–204. [Google Scholar] [CrossRef]
- Henseler, J.; Ringle, C.M.; Sarstedt, M. A new criterion for assessing discriminant validity in variance-based structural equation modeling. J. Acad. Mark. Sci. 2015, 43, 115–135. [Google Scholar] [CrossRef]
- Ab Hamid, M.R.; Sami, W.; Sidek, M.M. Discriminant validity assessment: Use of Fornell & Larcker criterion versus HTMT criterion. Proc. J. Phys. Conf. Ser. 2017, 890, 012163. [Google Scholar] [CrossRef]
- Becker, J.-M.; Cheah, J.-H.; Gholamzade, R.; Ringle, C.M.; Sarstedt, M. PLS-SEM’s most wanted guidance. Int. J. Contemp. Hosp. Manag. 2023, 35, 321–346. [Google Scholar] [CrossRef]
- Ramayah, T.; Cheah, J.; Chuah, F.; Ting, H.; Memon, M.A. Partial least squares structural equation modeling (PLS-SEM) using smartPLS 3.0. In An Updated Guide and Practical Guide to Statistical Analysis; Springe: Berlin, German, 2018; pp. 967–978. [Google Scholar]
- Cohen, J. Statistical Power Analysis for the Social Sciences, 2nd ed.; Lawrence Erlbaum Associates, Publishers: Hillsdale, NJ, USA, 1988. [Google Scholar]
- Somers, M.J.; Casal, J.C. Using artificial neural networks to model nonlinearity: The case of the job satisfaction—Job performance relationship. Organ. Res. Methods 2009, 12, 403–417. [Google Scholar] [CrossRef]
- Albahri, A.; Alnoor, A.; Zaidan, A.; Albahri, O.; Hameed, H.; Zaidan, B.; Peh, S.; Zain, A.; Siraj, S.; Alamoodi, A. Based on the multi-assessment model: Towards a new context of combining the artificial neural network and structural equation modelling: A review. Chaos Solitons Fractals 2021, 153, 111445. [Google Scholar] [CrossRef]
- Alnoor, A.; Tiberius, V.; Atiyah, A.G.; Khaw, K.W.; Yin, T.S.; Chew, X.; Abbas, S. How positive and negative electronic word of mouth (eWOM) affects customers’ intention to use social commerce? A dual-stage multi group-SEM and ANN analysis. Int. J. Hum.–Comput. Interact. 2024, 40, 808–837. [Google Scholar] [CrossRef]
- Alwosheel, A.; van Cranenburgh, S.; Chorus, C.G. Is your dataset big enough? Sample size requirements when using artificial neural networks for discrete choice analysis. J. Choice Model. 2018, 28, 167–182. [Google Scholar] [CrossRef]
- Hew, J.J.; Leong, L.Y.; Tan, G.W.H.; Ooi, K.B.; Lee, V.H. The age of mobile social commerce: An Artificial Neural Network analysis on its resistances. Technol. Forecast. Soc. Change 2019, 144, 311–324. [Google Scholar] [CrossRef]
- Lee, K.Y.; Chung, N.; Hwang, S. Application of an artificial neural network (ANN) model for predicting mosquito abundances in urban areas. Ecol. Inform. 2016, 36, 172–180. [Google Scholar] [CrossRef]
- Lee, V.-H.; Hew, J.-J.; Leong, L.-Y.; Tan, G.W.-H.; Ooi, K.-B. Wearable payment: A deep learning-based dual-stage SEM-ANN analysis. Expert Syst. Appl. 2020, 157, 113477. [Google Scholar] [CrossRef]
- Leong, L.-Y.; Hew, T.-S.; Ooi, K.-B.; Dwivedi, Y.K. Predicting trust in online advertising with an SEM-artificial neural network approach. Expert Syst. Appl. 2020, 162, 113849. [Google Scholar] [CrossRef]
- Karaca, Y.; Moonis, M.; Zhang, Y.-D.; Gezgez, C. Mobile cloud computing based stroke healthcare system. Int. J. Inf. Manag. 2019, 45, 250–261. [Google Scholar] [CrossRef]
- Lin, C.Y.; Ho, Y.H. Determinants of green practice adoption for logistics companies in China. J. Bus. Ethics 2011, 98, 67–83. [Google Scholar] [CrossRef]
- Wang, W.-T.; Lai, Y.-J. Examining the adoption of KMS in organizations from an integrated perspective of technology, individual, and organization. Comput. Hum. Behav. 2014, 38, 55–67. [Google Scholar] [CrossRef]
- Weng, M.-H.; Lin, C.-Y. Determinants of green innovation adoption for small and medium-size enterprises (SMES). Afr. J. Bus. Manag. 2011, 5, 9154. [Google Scholar]
- Li, G.; Guo, F.; Di, D. Regional competition, environmental decentralization, and target selection of local governments. Sci. Total Environ. 2021, 755, 142536. [Google Scholar] [CrossRef]
- Eltayeb, T.K.; Zailani, S.; Ramayah, T. Green supply chain initiatives among certified companies in Malaysia and environmental sustainability: Investigating the outcomes. Resour. Conserv. Recycl. 2011, 55, 495–506. [Google Scholar] [CrossRef]
- Zhu, Q.; Sarkis, J. The moderating effects of institutional pressures on emergent green supply chain practices and performance. Int. J. Prod. Res. 2007, 45, 4333–4355. [Google Scholar] [CrossRef]
- Kudla, N.L.; Klaas-Wissing, T. Sustainability in shipper-logistics service provider relationships: A tentative taxonomy based on agency theory and stimulus-response analysis. J. Purch. Supply Manag. 2012, 18, 218–231. [Google Scholar] [CrossRef]
- Albitar, K.; Borgi, H.; Khan, M.; Zahra, A. Business environmental innovation and CO2 emissions: The moderating role of environmental governance. Bus. Strateg. Environ. 2023, 32, 1996–2007. [Google Scholar] [CrossRef]
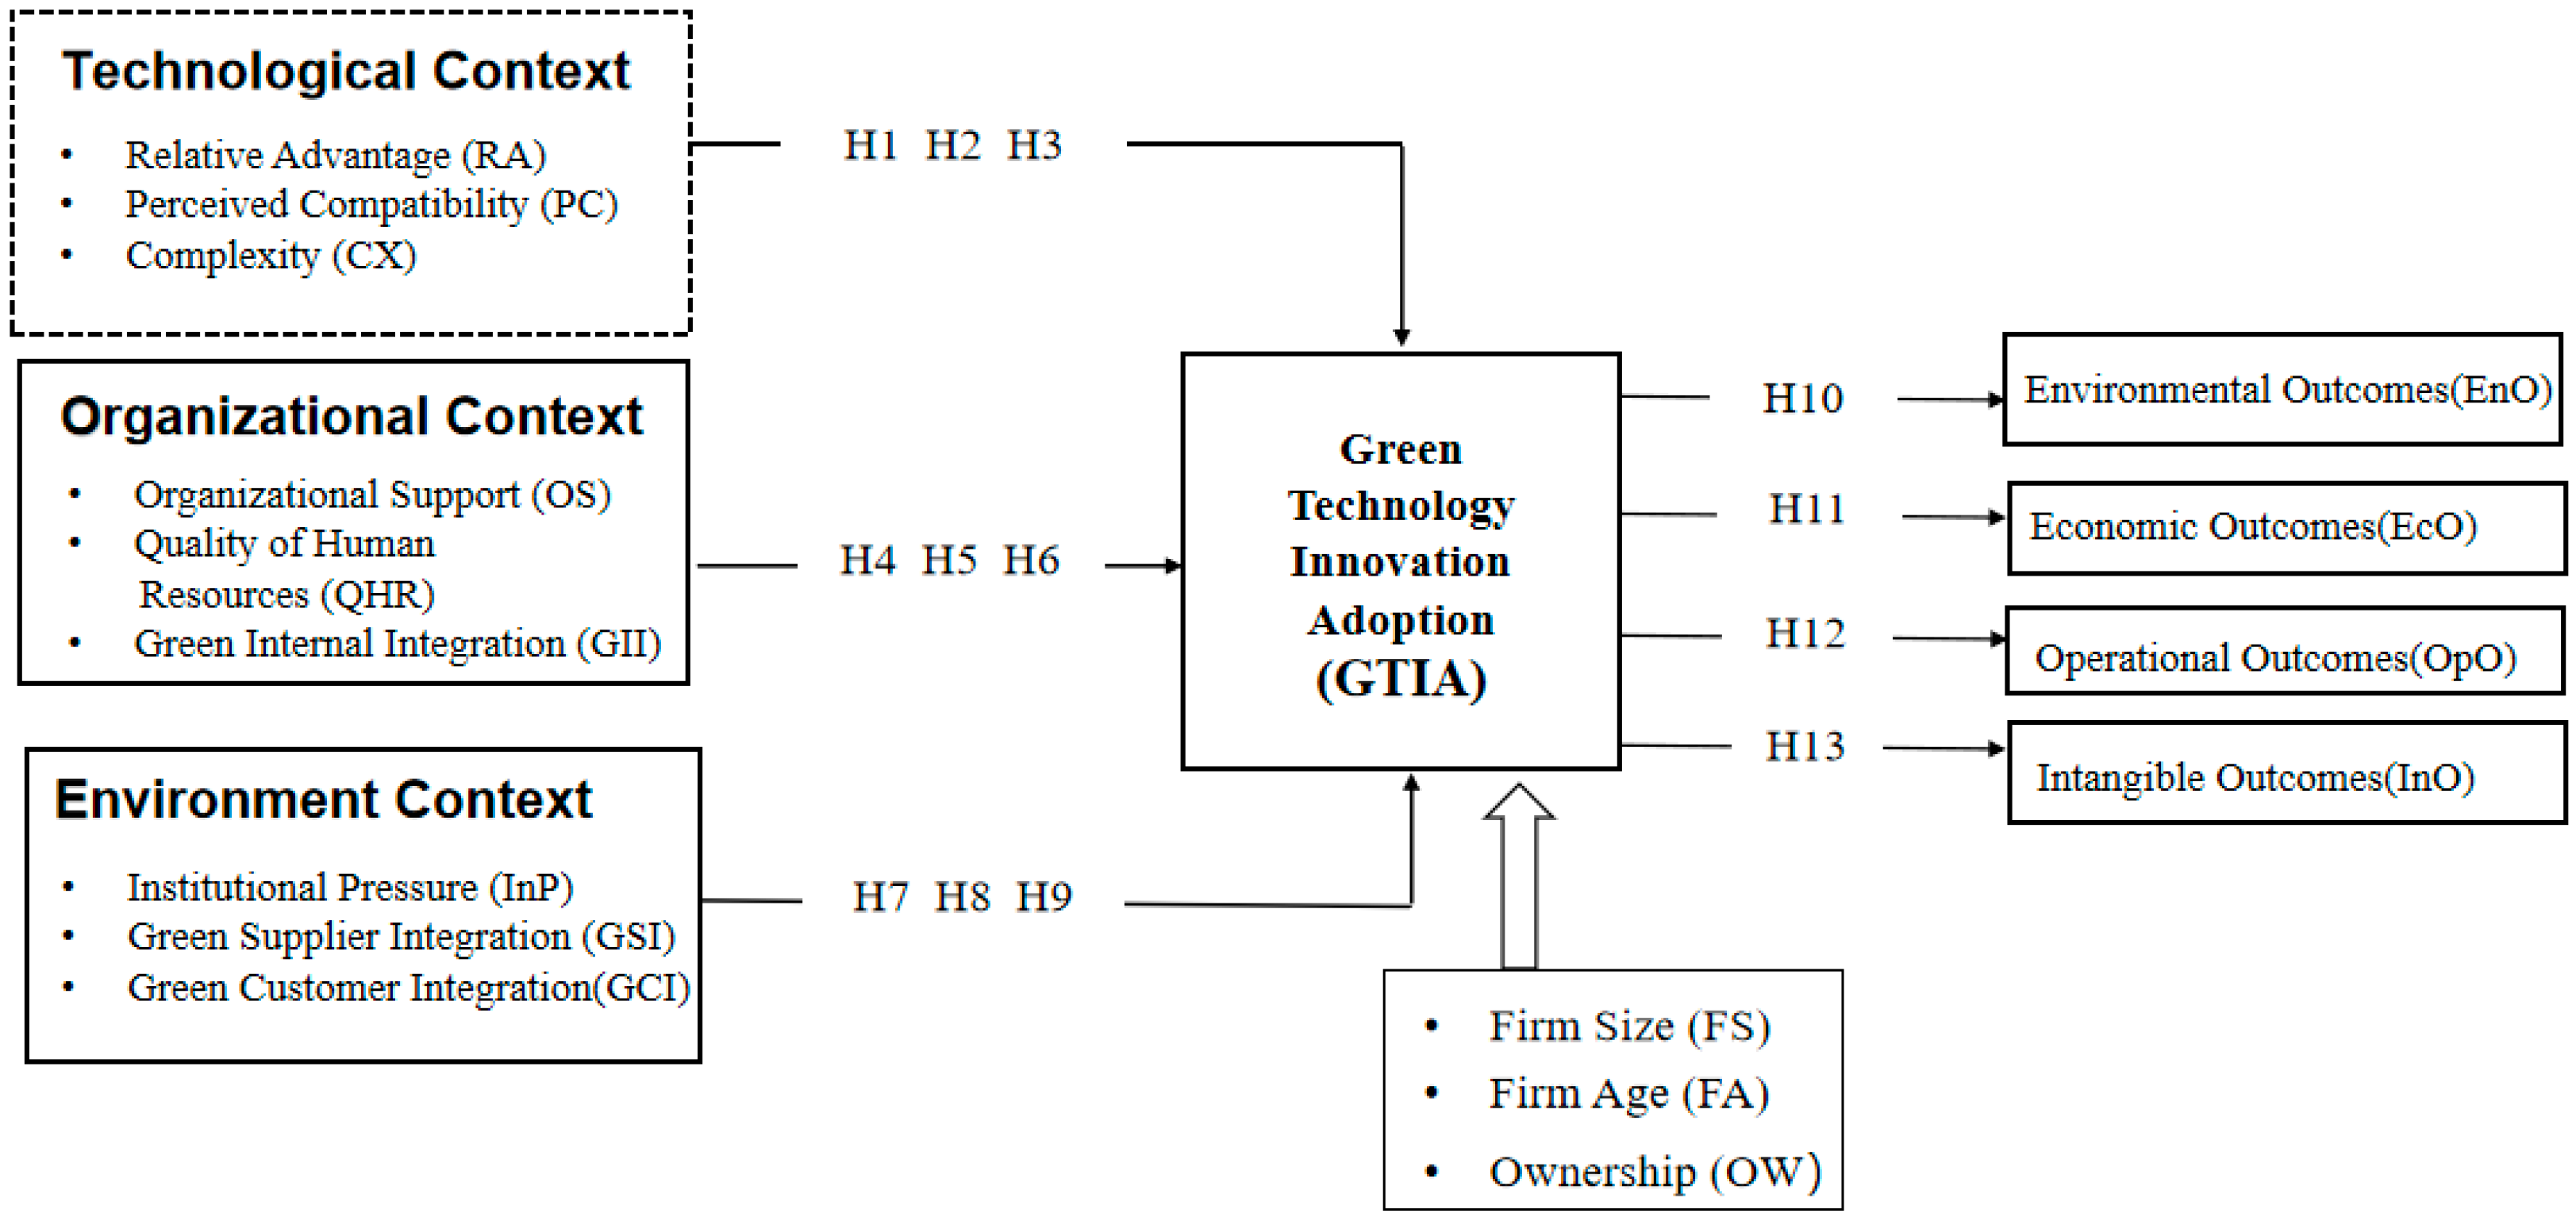
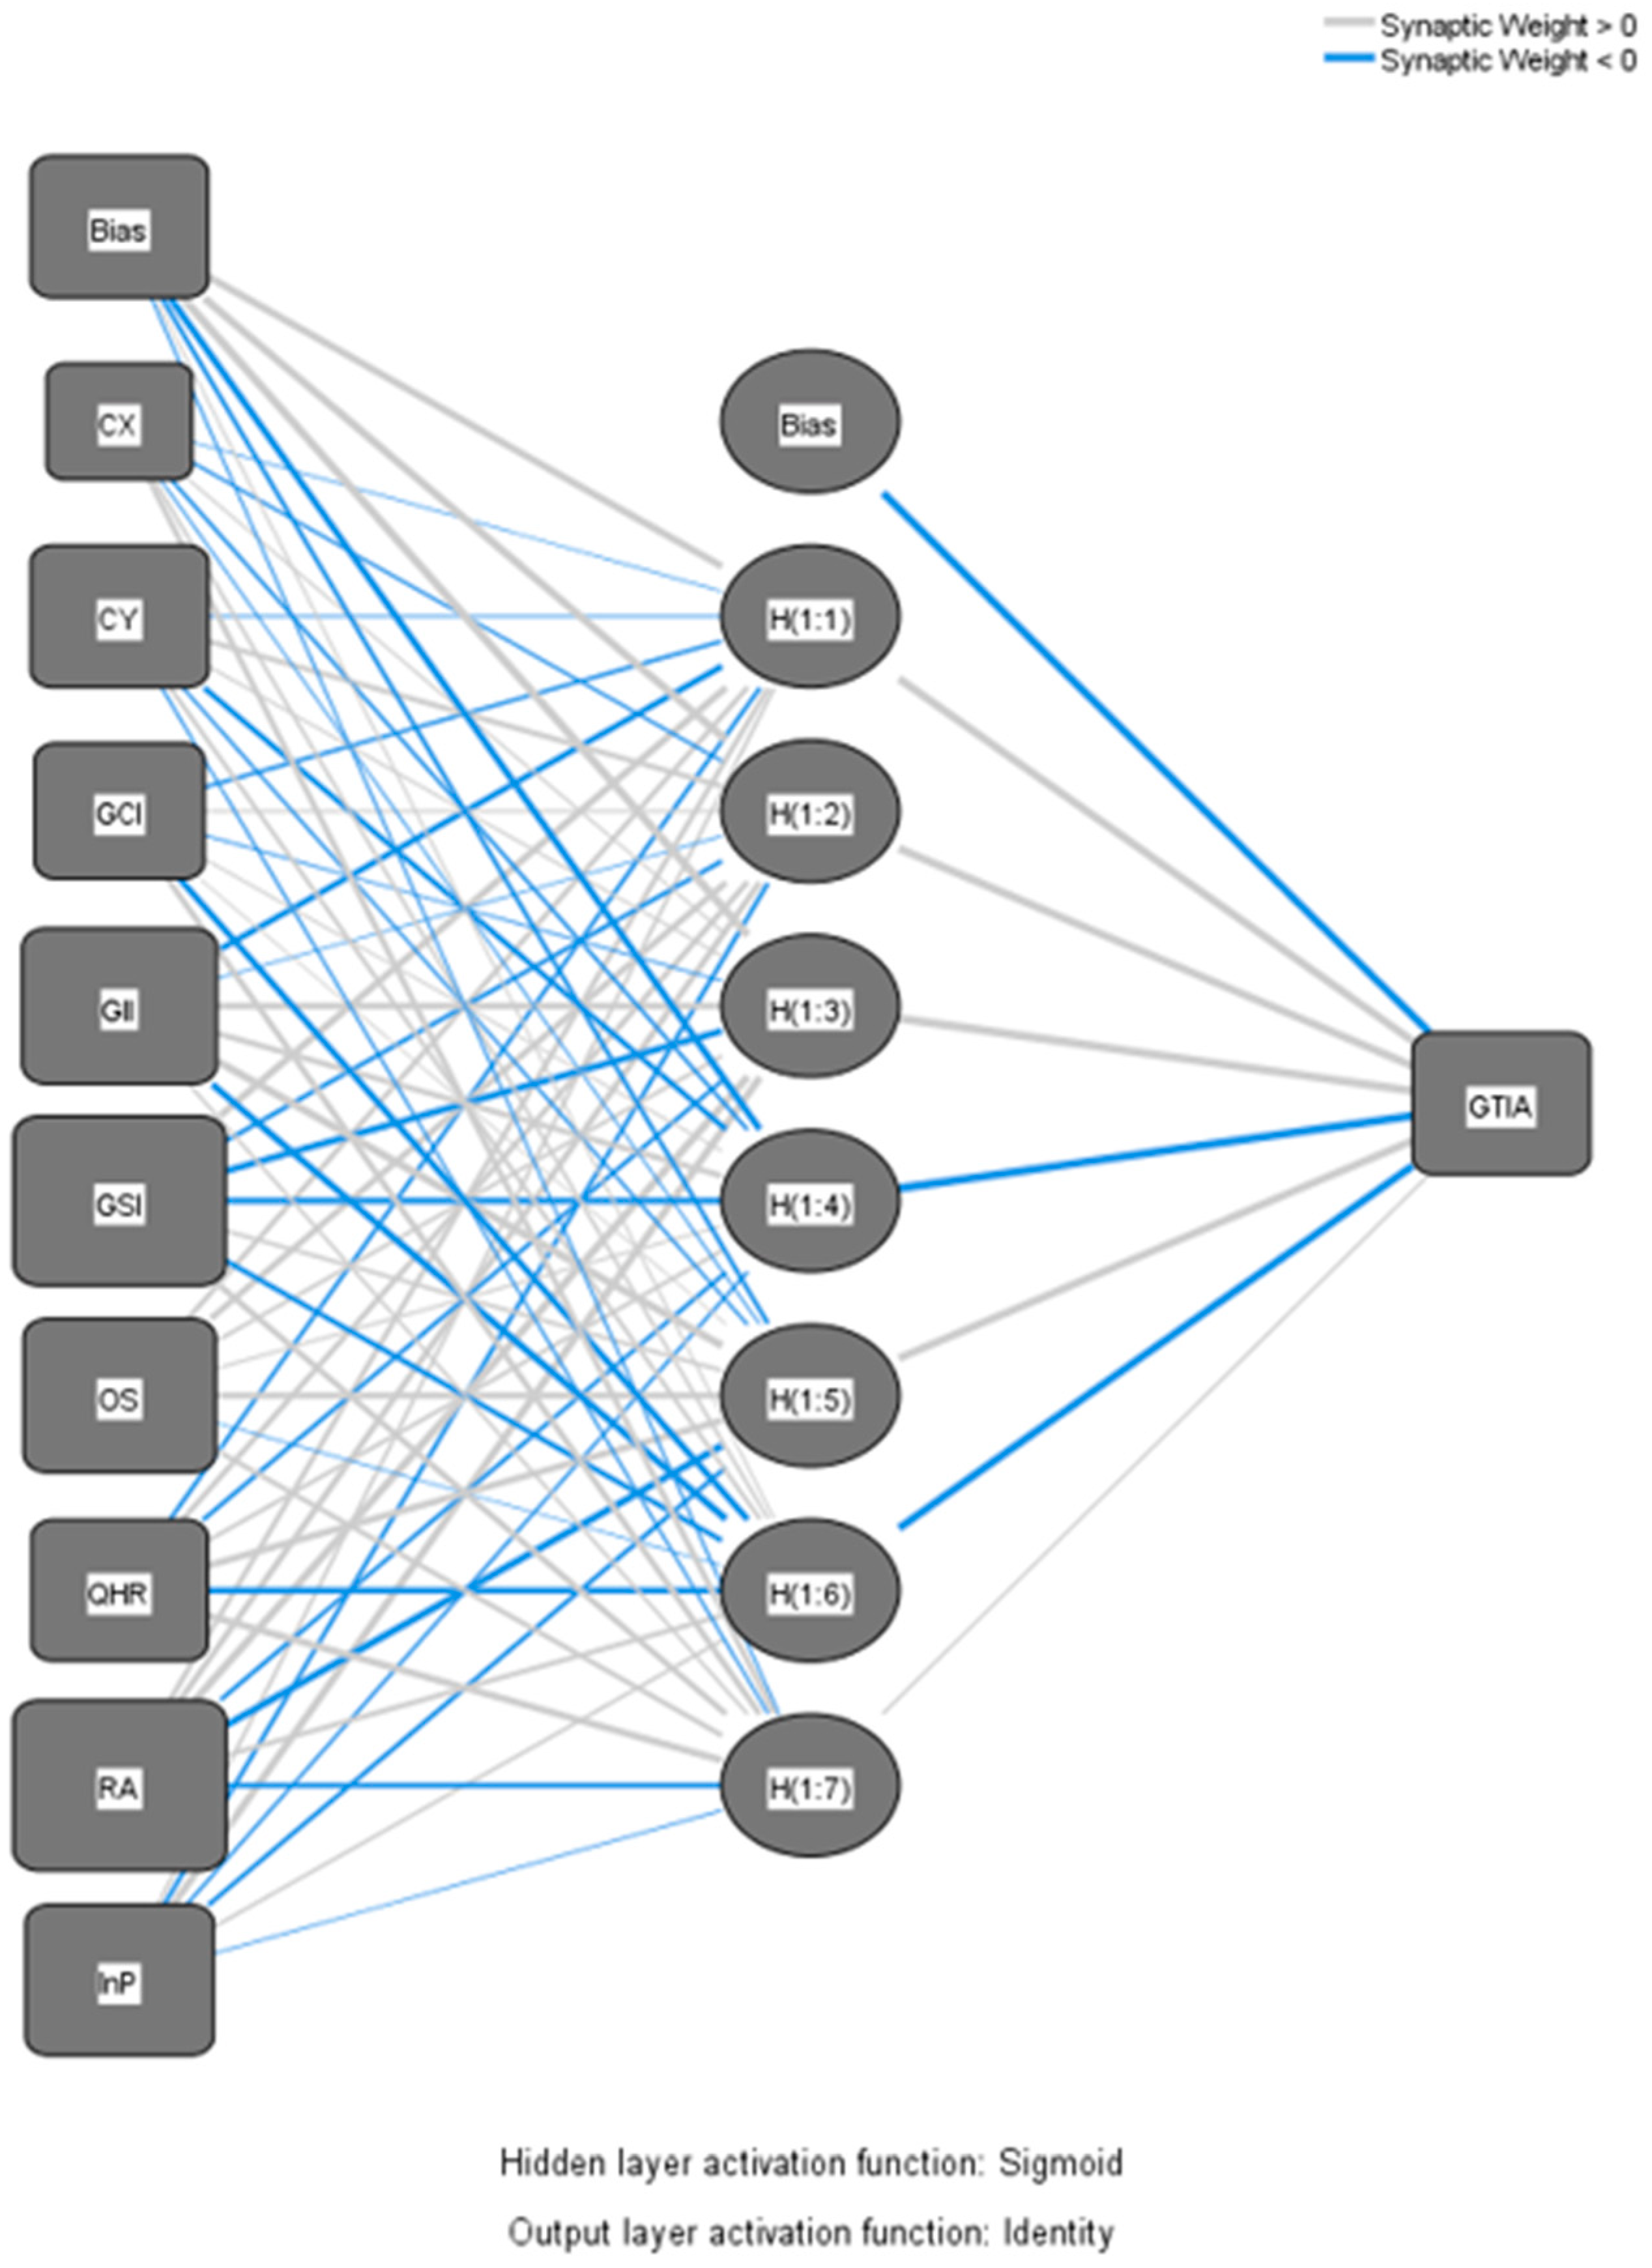
Disclaimer/Publisher’s Note: The statements, opinions and data contained in all publications are solely those of the individual author(s) and contributor(s) and not of MDPI and/or the editor(s). MDPI and/or the editor(s) disclaim responsibility for any injury to people or property resulting from any ideas, methods, instructions or products referred to in the content. |
© 2024 by the authors. Licensee MDPI, Basel, Switzerland. This article is an open access article distributed under the terms and conditions of the Creative Commons Attribution (CC BY) license (https://creativecommons.org/licenses/by/4.0/).