Article

A New Stochastic Petri Net Modeling Approach for the Evolution of Online Public Opinion on Emergencies: Based on Four Real-Life Cases

1
School of Safety Science and Emergency Management, Wuhan University of Technology, Wuhan 430070, China
2
School of Economics and Management, Zhongyuan University of Technology, Zhengzhou 450007, China
*
Author to whom correspondence should be addressed.
Systems 2024, 12(9), 333; https://doi.org/10.3390/systems12090333
Submission received: 17 July 2024 / Revised: 24 August 2024 / Accepted: 26 August 2024 / Published: 29 August 2024

Abstract

:
In this study, we analyzed the evolution of online public opinion on emergencies using a new Stochastic Petri Net modeling approach. First, an intuitive description of the emergency online public opinion development process was conceptualized from the life cycle evolution law perspective. Then, based on Petri net theory, a Stochastic Petri Net isomorphic Markov chain model was constructed to simulate the evolution of online public opinion on emergencies. Finally, four real-life cases were selected to validate and analyze the model, demonstrating that the evolutionary leaps, complexity, critical nodes, evolutionary rate, and execution time differ across different online public opinions on emergencies. The study results indicate that this modeling approach has certain advantages in examining the evolution based on multi-factor coupling and quantifying the evolution law in online public opinion on emergencies.

1. Introduction

The rapid development, vitality, and resilience of the internet and social media have broken public opinion dissemination’s time and space boundaries. The network system’s highly centralized group dissemination and interactive behaviors [1] can easily trigger public opinion crises. Unforeseen events, such as natural disasters, major accidents, and social incidents, often lead to extensive online discussions, forming a unique public opinion environment. Social media is a valuable data source after emergencies, enabling the public to learn the truth, share information, seek social support, etc. Public opinion topics triggered by emergencies continue evolving online, leading to rapid and widespread changes in public sentiment. Government agencies can also use online public opinion to study public reactions, respond promptly, or provide a basis for resolution through network information. Therefore, in-depth research on the evolutionary trends, paths, and laws of online public opinion during emergencies, as well as an accurate and clear grasp of their causes, is crucial for improving the ability to guide and control such situations, ultimately making it more effective to address the challenges arising from online public opinion on emergencies.

2. Literature Review

2.1. Public Opinion on Emergencies

Online public opinion on emergencies has been a topic of interest in various studies. The current research mainly focuses on four aspects, as outlined below.

2.1.1. Influencing Factors of Public Opinion on Emergencies

The first aspect involves the determination of influencing factors. Guan et al. [2] utilized ecological and system dynamics theory to analyze the evolution mechanism of online public opinion dissemination from self-organization and hetero-organization perspectives. Wang et al. [3], based on deep learning technology, analyzed the topic distribution of different sentiments of netizens on Weibo. Fang et al. [4] developed a group persuasion force of populism model to analyze and predict the evolution of network public opinion based on individual interaction tendencies. Liu et al. [5] emphasized the importance of science and technology dissemination in guiding public opinion during health emergencies with agenda-setting theory and case study methods, focusing on event development, government response, and public concerns. Yao et al. [6] highlighted the role of critical nodes in the spread of microblogging opinions during emergencies using the social network analysis method. Yang and Sun [7] analyzed the agenda-setting power dynamics between professional mass media organizations and individual opinion leaders, using agenda-setting theory as their framework. Lim et al. [8] applied the issue–attention cycle theory and examined the impact of decisions on technological science and risk issues on the public and politicians.

2.1.2. The Stages of Evolution of Public Opinion on Emergencies

The second aspect involves the division of evolutionary stages. Online public opinion follows a complete life cycle and exhibits distinct stages, as it reflects various public expressions regarding public events over a given period, using information as a carrier—including opinions, emotions, and discussions [9]. Due to different measurement standards, the division results also differ. Some models propose three stages [10,11,12], others four stages [13], and still others six stages [14]. Burkholder [15] introduced the traditional three-stage propagation model. Liu et al. [16] used the “Da Liang Shan fire event in Sichuan province” as a case study to propose a three-stage public opinion communication model. Zhang et al. [13] divided the public opinion on the “Zika virus event” into four periods.

2.1.3. Modeling of Public Opinion on Emergencies

The third aspect involves modeling. Various models exist, including time series models, neural network models, and support vector machine models. Qiu et al. [17] introduced a novel approach utilizing time series forecasting models. Li et al. [10] constructed an SIR epidemic model to simulate the interactions among netizens, media, and government. He et al. [18] developed a public opinion evolution model based on a scale-free network structure, highlighting the influence of individual relationships on public opinion changes. Pohl et al. [19] used a clustering algorithm to identify crisis-related sub-events. From the perspective of information alienation, Lan et al. [20] created a mathematical model to determine the derivative effects of online public opinion based on a logistic model. Zhang et al. [21] proposed a two-layer coupled SEIR public opinion dissemination model applicable to topics that arise during news dissemination. Zhou [22] applied a self-distillation contrastive learning method to automatically recognize users’ review sentiments. To solve the problems associated with fake news detection, Lai et al. [23] presented a “Rumor Large Language Model” approach. Cheng et al. [24] used a Langevin stochastic resonance model to reveal the resonance phenomenon caused by public health emergencies. In the policy field, Yang et al. [25] proposed a multi-layer defense mechanism model for new media public opinion evolution in emergencies, focusing on crisis prevention and control strategies. It is worth noting that the abovementioned modeling studies have rarely considered the correlation and evolutionary equilibrium between different evolutionary states caused by temporal differences.

2.1.4. Empirical Evidence for Critical Incident Cases

The fourth aspect pertains to empirical evidence for specific critical incident cases. Many scholars have focused on public health emergencies to verify evolution mechanisms in public opinion diffusion [26,27,28]. Zhang [29] selected the Henan rainstorm event as a case study and extracted thematic characteristics using the latent Dirichlet allocation (LDA) model. Cui et al. [30] highlighted the growing importance of addressing network public opinion in college settings. Ye et al. [31] investigated the factors influencing college students’ behaviors in spreading online public opinions during university emergencies. In the context of environmental emergencies, Tan et al. [32] analyzed emotional tendencies and thematic evolution across different stages of public opinion following the 3.21 accident in Xiangshui, Jiangsu”, using sentiment analysis and theme extraction models. Additionally, Zhang et al. [33] studied the emotional communication of the “Hurricane Irma case” on microblogs, highlighting the impact of different emotional tones on information dissemination. However, most studies focus on individual cases, with almost no cases involving four types of emergencies (public health events, natural disasters, accidental catastrophes, and social security events) for horizontal comparative analysis.

2.2. Summary

Studying the evolution of online public opinion during emergencies is a fundamental scientific issue in emergency management and network governance. Current research findings are of great significance for identifying the dissemination patterns of network public opinion in emergency events and for formulating effective intervention strategies. However, little attention has been paid to the structured description of the evolution of network public opinion during emergencies and the laws governing the changes in equilibrium states in the evolutionary system. Existing research seldom considers the relationships between associated attributes at different evolutionary stages, and more simulation studies are needed to explore the structure and dynamic processes of the whole system.
Petri nets are a mathematical modeling tool used for describing and analyzing distributed systems or concurrent processes [34,35,36]. The Petri net is particularly suitable for analyzing control flow and information flow in systems with asynchronous and concurrent activities. It has demonstrated outstanding performance in modeling, analyzing, and optimizing discrete event systems. Petri nets can be used as a chain structure to reflect network public opinion’s evolution, propagation, and configuration during crises. A library usually represents the system state, and transitions with random occurrence times represent the triggering factors for the transitions between different states of the system. This approach is suitable for describing the multi-evolutionary states of public opinion during emergencies and the random interventions of different motivational agents that trigger transitions between states. Although Petri nets perform well in accurately simulating system behavior, they have limitations in quantifying the underlying parameters of the system behavior and explaining the complexity present in the system. A Markov chain is a stochastic process in which the future state of a system is only related to the current rather than the past state. Owing to this characteristic, Markov chains are widely used in the mathematical modeling of dynamical systems, information retrieval, queuing theory, and market behavior. To compensate for the limitations of Petri nets, they can be transformed into Markov chain models, utilizing the associated theory and methods to analyze the long-term behavior and stability of the system, thus providing a deeper understanding and more accurate predictions.
Therefore, based on the structural description of the essential laws governing the evolution of online public opinion during emergencies, we construct a Stochastic Petri Net model and an equivalent Markov chain model of public opinion on emergencies according to Petri net theory. Four real-life cases are then selected to verify and analyze the model.

3. Methods and Design

3.1. Stages in the Evolution of Public Opinion

3.1.1. Formation Period

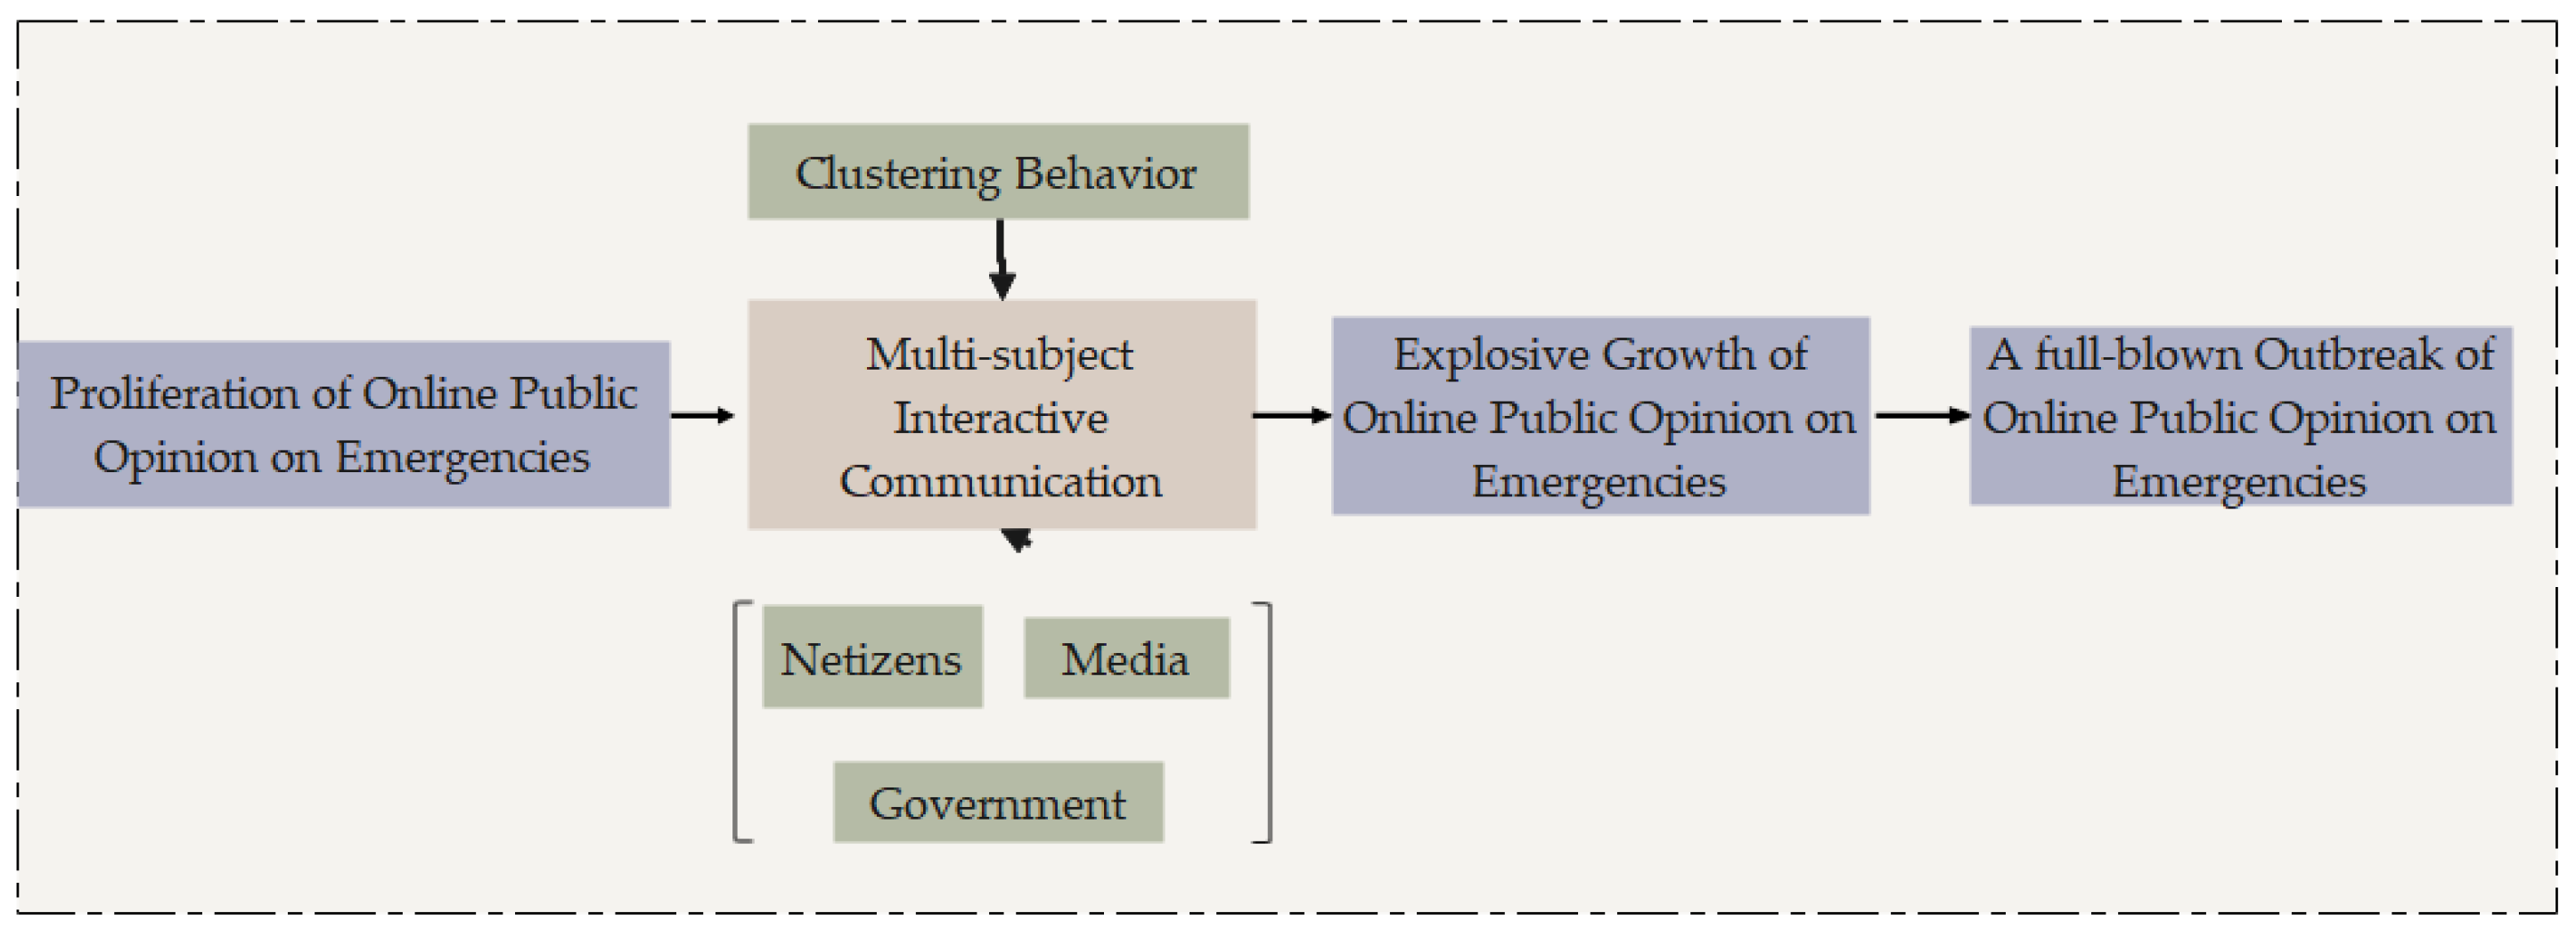
The initial period of formation is a process in which public opinion constantly changes. Generally speaking, online public opinion primarily conveys potential public opinion, which materializes based on online expression and offline dissemination and diffusion, through which emotional focus is generated.
In an online environment, netizens are the main actors and play a vital role. This period is generally relatively short, often leading to missed opportunities for governance. Changes in social policies aggravate the escalation of social conflicts to a certain extent, and some social–psychological imbalances and social disorders occur frequently. Due to the popularity of the internet and the immediacy and openness of online platforms, public opinion spreads rapidly in cyberspace. Individuals not only express their will and opinions through online dialogue but also discuss views with the surrounding public offline, prompting more participation. The combination of online and offline means leads to an increase in the expression of public opinion. The desire to determine the truth behind an event tends to complicate its development; thus, network public opinion on emergencies is gradually formed, as shown in Figure 1.

3.1.2. Diffusion Period

After its initial formation, internet public opinion enters a long period of development and evolution. The diffusion period is one of the critical development stages. During this stage, the intensity increases dramatically compared to the formation period, mainly due to the evolution of online public opinion as the number of participants increases (Figure 2).
Considering the gradual increase in the number of participants, together with the involvement of the media and opinion leaders who play an essential role in the evolution of public opinion, and the appropriate measures taken by the government and other relevant departments, extensive relevant information is generated from public opinion. The participation of netizens, the promotion of related media, the leadership of opinion leaders, and the intervention and guidance of the government all significantly contribute to the evolution of online public opinion during the diffusion period.
Firstly, the broad group of netizens includes the main parties involved in emergencies, some online individuals facing physical or mental health risks, and some bystanders. Secondly, the media, including traditional media and self-media, use their technical advantages to integrate and report information, thus playing a leading role in disseminating public opinion in cyberspace [37]. Thirdly, although mainstream values tend to materialize in internet public opinion during the diffusion stage, netizens often have different views due to a lack of knowledge or information due to the massive information generated. This highlights the guiding role of opinion leaders. Compared with traditional opinion leaders, internet opinion leaders in the new era are more diversified, and the relationship between netizens and opinion leaders is no longer a single mode of acceptance in the past but an emerging mode of interaction. Fourthly, regarding government control, the timely response of relevant government departments and their active guidance and understanding of public views are significant in ensuring the normal development of internet public opinion.

3.1.3. Explosion Period

This stage refers to the period when, after the initial formation and dissemination of online public opinion, multiple individuals, such as the involved parties, media, and opinion leaders, continue to pay attention to and discuss the event using their resources, which leads to a collision of various opinions and a rapid increase in the event’s impact, thus generating eruption forces similar to a volcano effect. This is also when expressing views is most likely to cause harm [38]. Generally speaking, the eruption period is relatively short, but it can severely damage society [39]. The process involves the diffusion of public opinion and the interaction of different individuals, leading to exponential growth in information and a full-scale eruption of public opinion. After entering this stage, the influence of public opinion rapidly escalates to the threshold value, and network clustering is significant. The original stable state of network groups to safeguard their interests deteriorates, thus escalating public opinion. During this phase, the participation of media, netizens, and opinion leaders reaches its maximum; views are exchanged through lively debates; and the existing conflicts rapidly intensify, leading to explosive growth in the expression of online public opinion, which is difficult to control, as shown in Figure 3.
During the high-risk period of disseminating online public opinion on emergencies, the degree and scope of the influence of an emergency event reach their maximum after the formation and spread of public sentiments. At this stage, people’s attitudes, views, and emotions toward emergencies accumulate to the highest level [40]. The evolution of resonance law during this phase involves an interactive phenomenon in which netizens’ emotions resonate with the primary heat of online public opinion on critical incidents, including the associated topics that netizens reflect on and their causes. These particular issues stimulate netizens’ subconscious minds and prompt the formation of relevant emotions. Regarding online public opinion issues, the heat and duration of public opinion risk evolution, the heat of netizens’ discussions, and the heat of online public opinion issues show the same resonance trend. After public opinion on emergencies undergoes the formation and diffusion periods, the heat of netizens’ issues stays within the normal fluctuation range. Nevertheless, public opinion risks are likely due to the abnormally high intensity of netizens’ sentiments. This leads to the rapid spread and eruption of public opinion risks. Eventually, as netizens’ sentiments on the incident increase to a relative saturation point, public opinion risks are maximized. The resonance between netizens’ sentiments and the heat of public opinion issues influences the evolution of the risks, which consequently reach a climax.

3.1.4. Declining Period

After the first three stages, online public opinion gradually enters a period of decline, which eventually ends after the duration of the outbreak is over. However, the end of public opinion does not mean the outbreak is over. During this period, netizens’ attention to emergencies gradually decreases or is shifted by new public opinion hotspots resulting from the practical guidance of the main parties involved in the emergency response. In this stage, risks exhibit a gradually decreasing trend. This means that while resources, energy, and information are constantly devoted to the topic related to emergencies, the responses to emergencies and online public opinion are also continually outputting matter, power, and information. Under multiple parties’ continuous exchange and transformation, public opinion risks gradually weaken and enter a receding state, but new threats associated with public opinion may also appear. However, this means that the heat of public opinion decreases and enters a latent state, as shown in Figure 4.
When public opinion reaches an outbreak point, the outbreak duration is usually relatively short. The government will cooperate with the official media and relevant online governmental organizations to maintain the regular operation of social order. The official press will release positive information, eliminate false public opinion, and guide the general public in forming correct public opinion values. Over time, the truth behind the incident will gradually become more apparent, and the government will add facts. With the supervision of relevant departments and the dissemination of positive reports by official media, the blind extreme emotions of netizens are eliminated, public opinion’s attention will be significantly weakened, the number of participants will gradually decrease, and public opinion will decline. The influence of online public opinion will be reduced considerably during this period, and the number of discussions on related topics will also decrease significantly. Although some potentially relevant comments remain, the overall impact will be insignificant. Moreover, as new events emerge, public opinion regarding the original incident will give way to new discussions. However, it is worth noting that although public opinion on the event enters a recession period, and the number of remaining topics has little impact, it has not entirely disappeared, so it is necessary to pay attention to the “backlash effect” of public opinion. The original event only reaches an equilibrium to a certain extent; thus, considering the emergence of new triggers is necessary. With the occurrence of a secondary crisis related to the event itself or the reoccurrence of a similar event, secondary views are likely generated, thus shaping secondary public opinion more rapidly and efficiently.
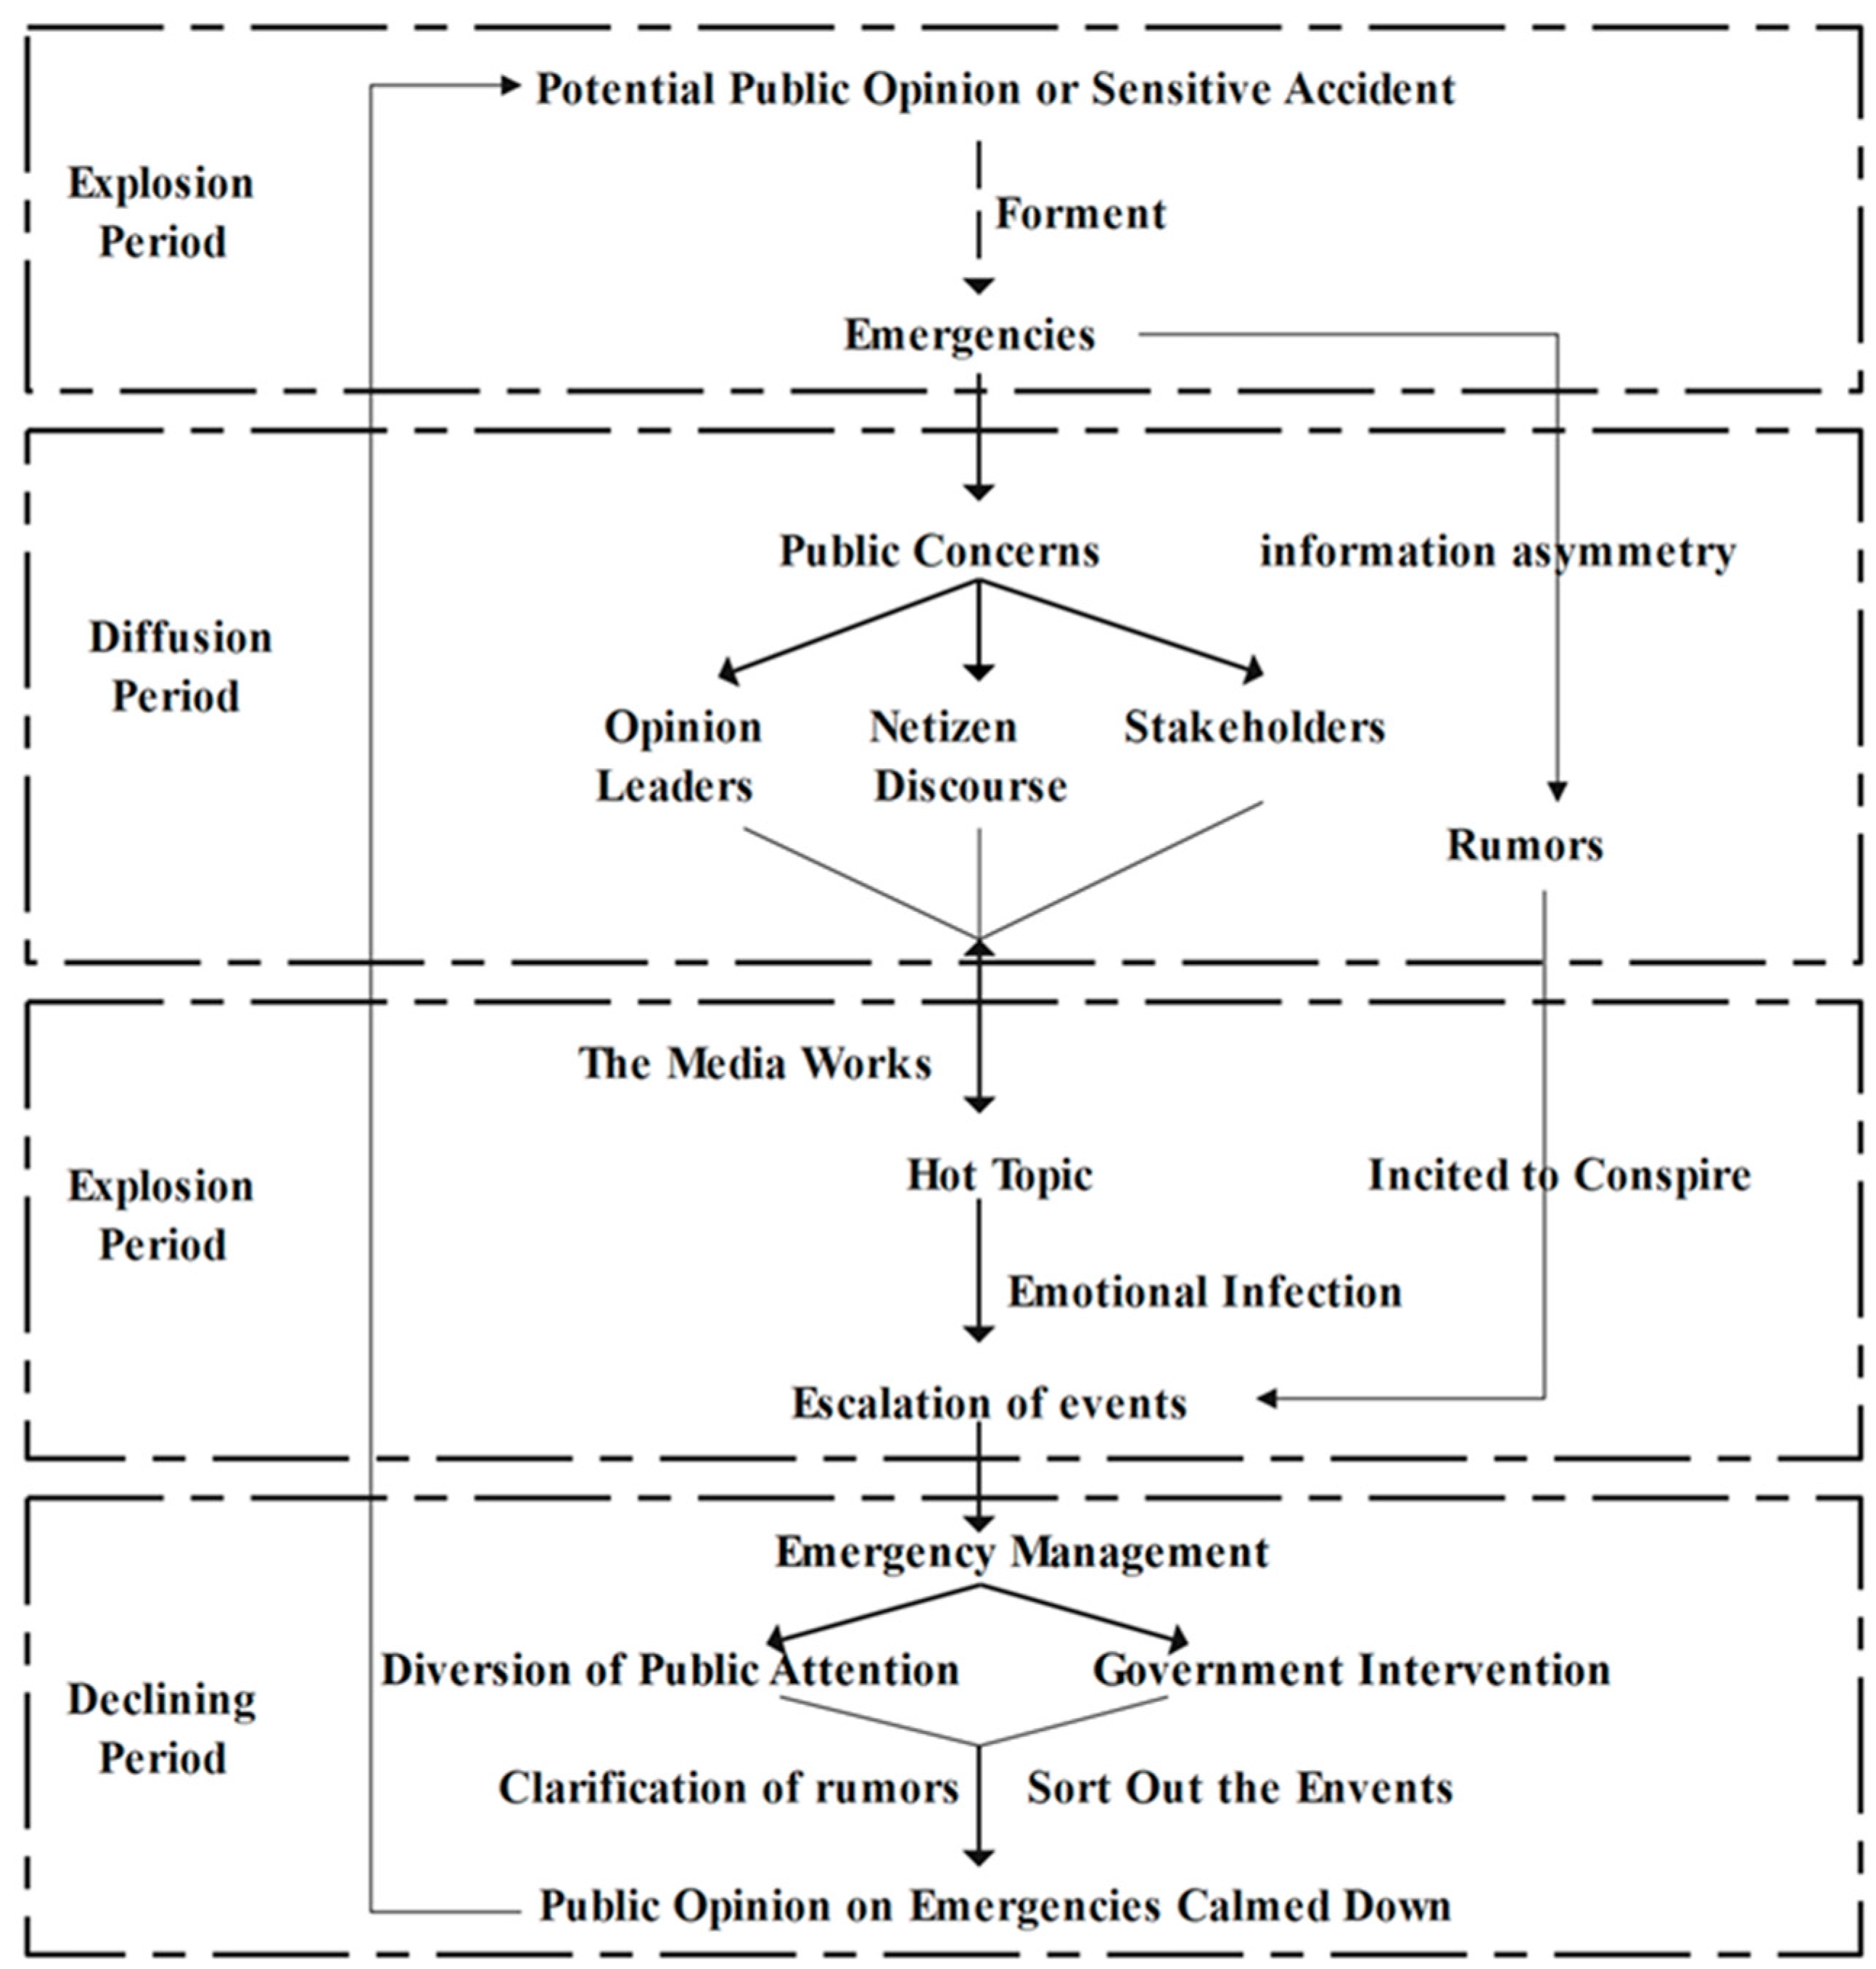
A system diagram regarding the characteristics of the evolutionary process of online public opinion on emergencies is presented in Figure 5.

3.2. Modeling

The evolutionary process of public opinion on emergencies is characterized by its rapidity, dynamism, and uncertainty. Information spreads rapidly on social media and online platforms, leading to rapid formation and changes in public opinion. This process is influenced by various factors, including the development of the event itself, media reports, public sentiments, and online interactions, highlighting the significant unpredictability associated with public opinion. At the same time, public opinion shows a clear tendency to become emotional and polarized, and different groups may react differently to the same event. In addition, the filtering, distortion, and emotional dissemination of information often affect the public’s perception and judgment of events. Overall, online public opinion triggered by emergencies is complicated, volatile, and challenging, reflecting the complexity of information dissemination and social interaction in contemporary online society.

3.2.1. Model Design

Discrete events are commonly designed using state-based formalisms, like state diagrams and Petri nets [41]. Petri nets are a mathematical modeling tool for describing and analyzing multiple concurrent processes in a system.
In the early 1980s, scholars proposed a Stochastic Petri Net model based on the original Petri net by introducing time parameters, further improving the theory and application of Petri nets [42]. A Stochastic Petri Net (SPN) is a random delay time model that indicates the association between each implementable transition and its implementation in a Petri net. The currently popular method is the continuous-time SPN proposed by Molly, where the implementation time of each transition follows an exponential distribution [43].
Considered a variant of Petri nets, they are more suitable for modeling systems with uncertainty and variability, such as those encountered with online public opinion. These models are often regarded as a particular type of directed graph, with the following main features:
(1)
Places: These are the state tokens of a Petri net, usually represented by circles. Places can contain any number of tokens to indicate the system’s state.
(2)
Transitions: Events representing changes in the system’s state are usually presented as rectangles or bars. When a transition occurs, the markers in the positions connected to it change according to specific rules.
(3)
Tokens: These are entities placed at different locations to indicate some resource or state of the system. The distribution of tokens defines the current state of the Petri net.
(4)
Input Arcs: These are arrows pointing from a location to a change, indicating the conditions or resources required for the change to occur.
(5)
Output Arcs: These are arrows pointing from a change that occurs to a location, indicating the results or resources generated after the change.
(6)
Weights: These are labeled on the arcs to indicate the number of markers moving from position to variation or vice versa. Weights in simple Petri nets are usually 1, but weights can represent more complex relationships in more complicated models.
A Markov chain is a stochastic process in which the future state of a system is only related to the current state and not to the past state. To compensate for the limitations of Stochastic Petri Nets, they can be transformed into Markov chain models, which utilize the theory and methods of Markov chains to analyze the long-term behavior and stability of the system, thereby providing a deeper understanding and more accurate prediction. This conversion process includes creating a state table and transition matrix, as well as determining transition probability, to provide more reliable analysis results.
(1)
State table: describes the possible states defined in the Stochastic Petri Net model.
(2)
Transition matrix: represents the possible transitions between states. For any state sequence, a Markov chain is used to calculate the probability of each state. In a Stochastic Petri Net model, state transitions occur with a deterministic probability. By transforming the Stochastic Petri Net model into a Markov chain, we can obtain a probability model that guides the system’s state transition.
Through the transformation of Stochastic Petri Net isomorphic Markov chains, the system behavior can be more accurately estimated, and the complexity present in the system can be better explained.
Based on the above, the specific steps of model design are as follows:
Step 1: An SPN model is developed according to Figure 5 (systematic diagram of the evolutionary process of online public opinion on emergencies.), and the time delays are associated with the corresponding variations.
Step 2: An isomorphic Markov chain is constructed. The set of reachable identifiers R(M) is determined and an isomorphic Markov chain is constructed for each arc of the SPN model, given the variation utilization rate corresponding to that arc.
Step 3: The Markov chain is solved, and the SPN model is systematically analyzed based on the steady-state probability of the Markov chain. Since the SPN model is isomorphic to the time-continuous Markov chain, the steady-state probability of the SPN model can be obtained when the constructed Markov chain has a smooth distribution.

3.2.2. Constructing the SPN Model

(1) SPN model
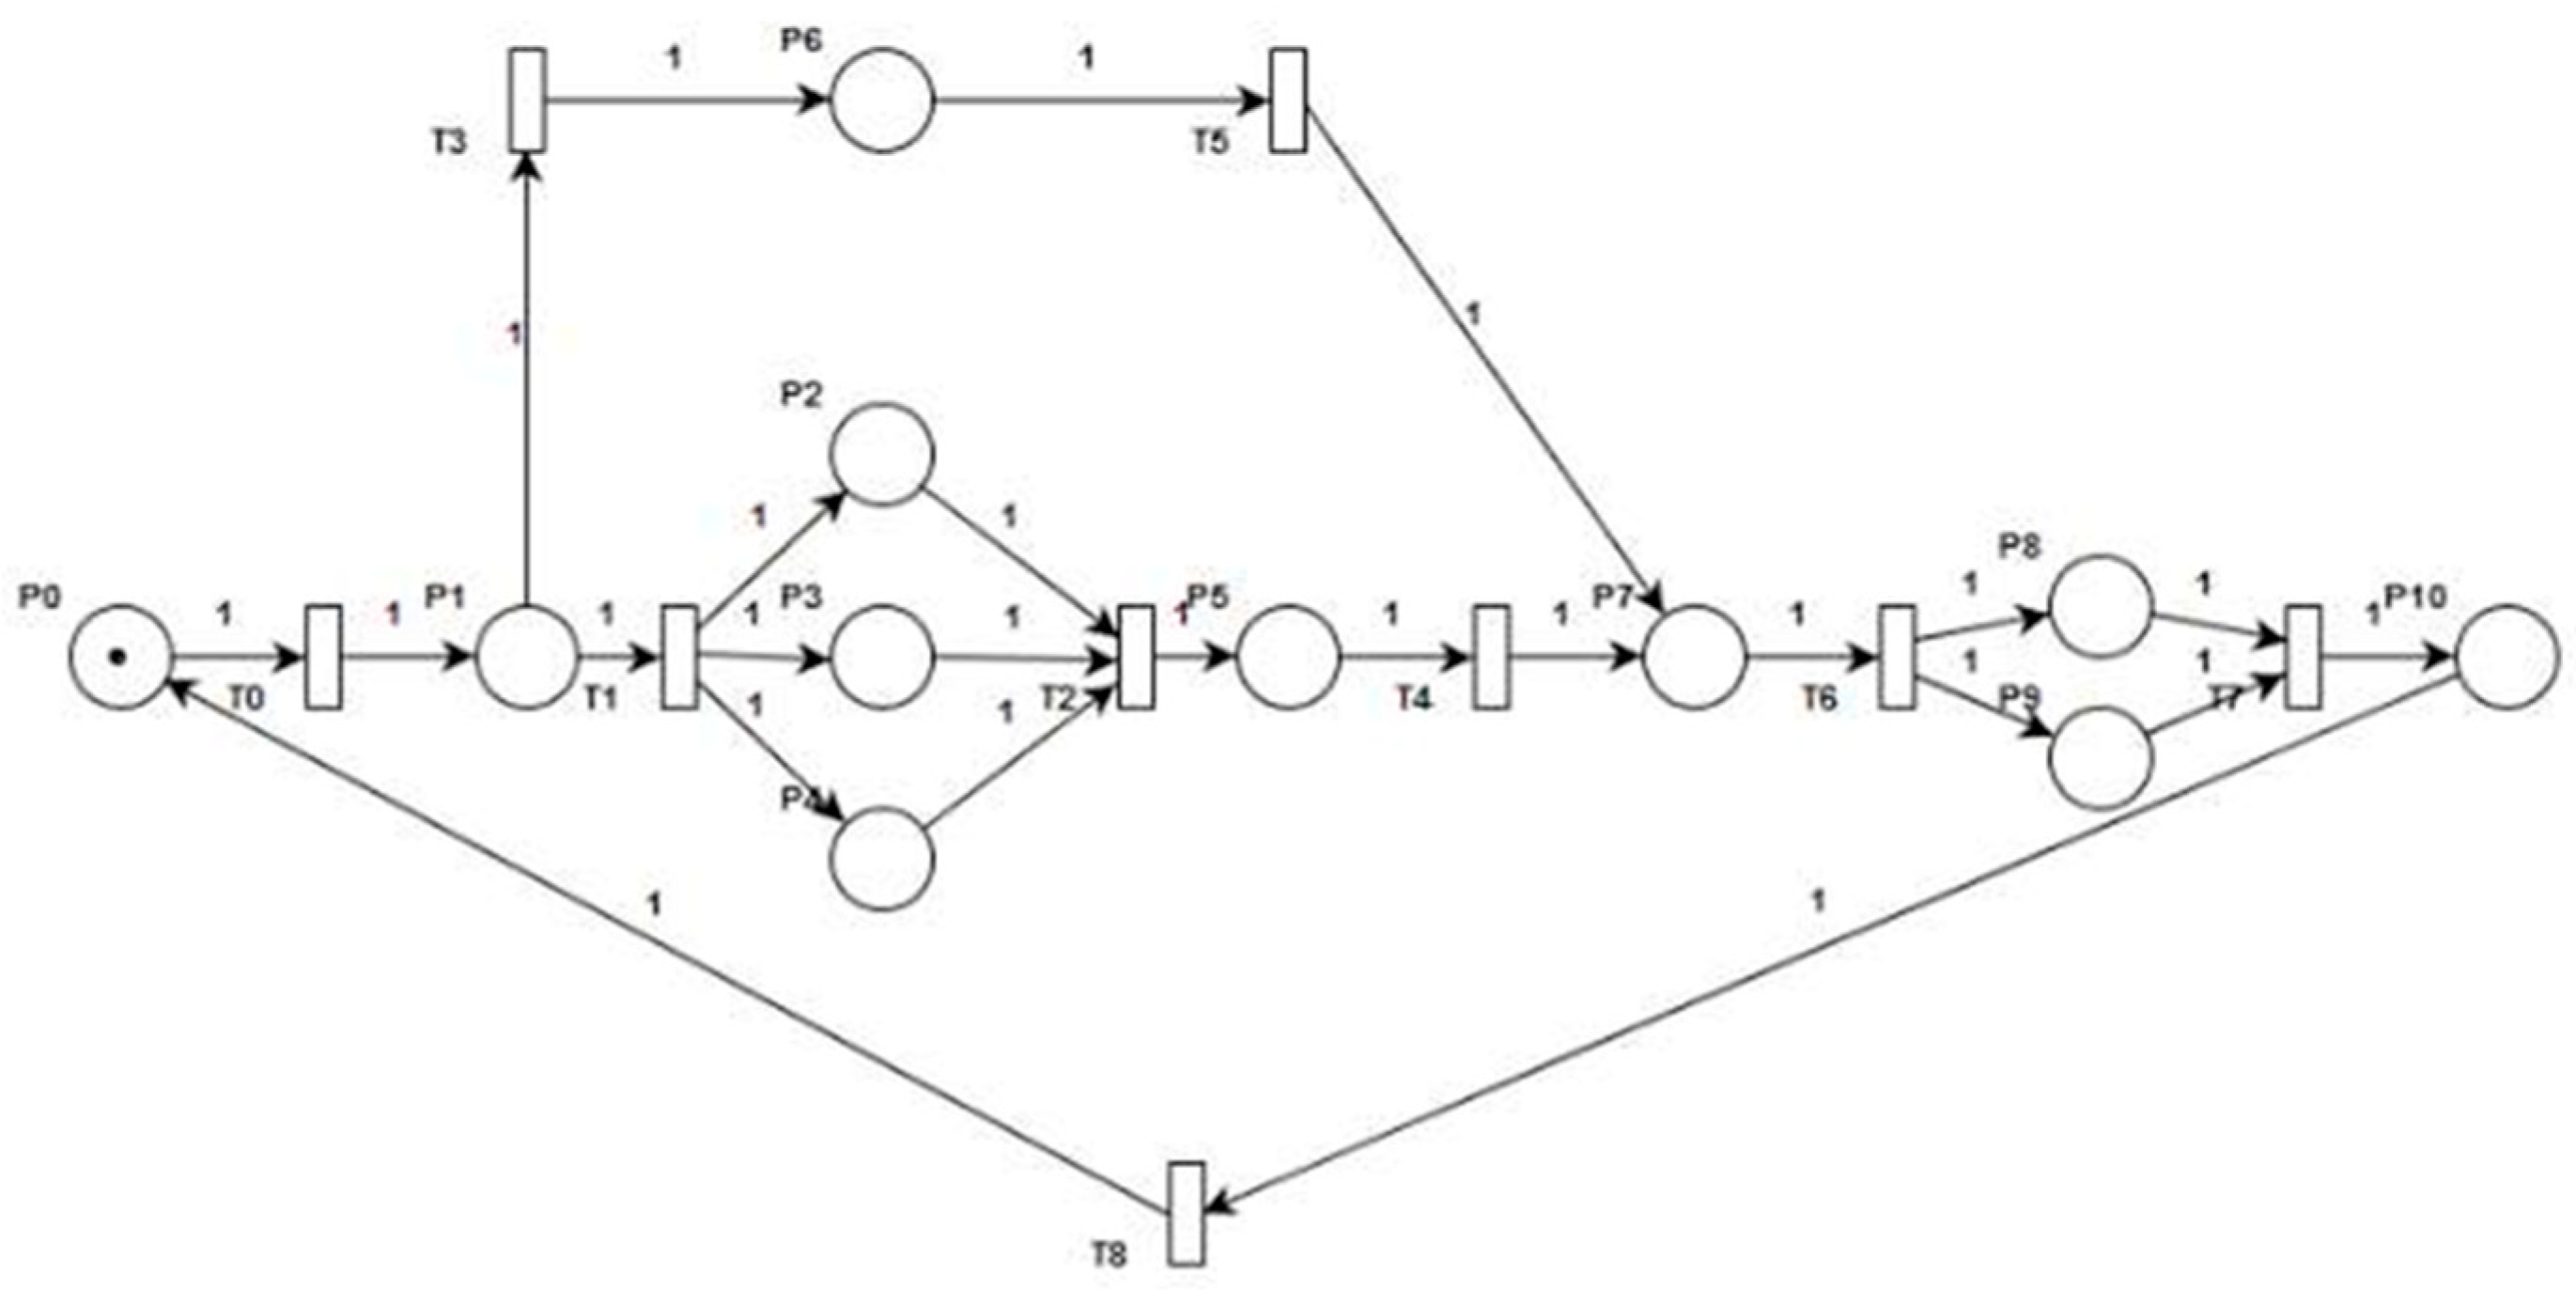
Definition: An SPN is a directed graph consisting of six elements, i.e., SPN = (P, T, F, W, M, λ), where (P, T, F, W, M, λ) is a P/T system and λ is the set of variation implementation rates, if, and only if, (1) P T ϕ ; (2) P T ϕ ; (3) F ( P × T ) ( T × P ) ; (4) M 0 is the initial identifier; (5) dom ( F ) c o d ( F ) = P T ; (6) the time interval between the feasible implementation time and the implementation time t T is a continuous random variable and follows a distribution function F t ( x ) = P ( x t x ) = 1 e λ t t . The actual parameter λ t > 0 is the average implementation rate of transition t considering values of x 0 . As shown in Figure 6.
P = ( P 0 ,   P 1 , ,   P 10 ) denotes the position in the system, with 11 positions in total, as shown in Table 1;
T = ( T 0 , T 2 , , T 8 ) denotes the finite set of transitions in the system, with a total of 9 transition numbers, as shown in Table 1;
F I O denotes the set of directed arcs in the system, where I P × T denotes the set of variable input arcs, and o T × P denotes the set of variation output arcs.   F indicates that there can be forbidden arcs in the system, which only exist in arcs pointing from a location to a change;
W : F N + is the arc weight function;
M : S N is the identity of the Stochastic Petri Net and a vector in which i is the number of markers in the first position, and M 0 is the initial marker, which indicates the initial state of the system.
(2) SPN model validation
In Stochastic Petri Nets (SPNs), the association matrix A is a critical mathematical tool for representing a system’s relationship between locations and transitions. The association matrix is usually defined as A = D + D , where D + is a positive association matrix (representing arcs from locations to transitions), and D is a negative association matrix (representing arcs from transitions to locations).
The correlation matrix B of the SPN model is calculated according to Equation (1), and the results are shown in Table 2.
D = D + D D + = 1 ( T i , P j ) F 0 o t h e r s D = 1 ( P i , T j ) F 0 o t h e r s
Here, D + denotes the elements of the input matrix I; D denotes the elements of the output matrix B; and F represents the flow relationships between repositories and variations.
Solving the system of linear equations reveals non-negative integer values; thus, the following conclusions are drawn: (1) Specific resources in the model (e.g., information, user attention) can maintain a homeostatic state in the evolutionary process of online public opinion. This reflects an equilibrium or repetitive pattern in opinion formation; (2) Self-organization is an essential feature in the evolution of online public opinion. The non-negative integer solution indicates that the system can reach a state of self-equilibrium without external regulation; (3) This points to the stable pattern of information flow or influence distribution in online public opinion. Some important nodes (e.g., individuals, communities, or media) play a vital role in the evolution of public opinion.

3.2.3. SPN Model Isomorphic to a Markov Chain

The specific transformation process is as follows:
Step 1: To obtain a reachable graph according to the SPN model, the reachable identification set and the identification state M i of each repository are determined. Each identification state of the SPN model of the evolutionary process of online public opinion on emergencies is expressed as follows:
M 0 = ( 1,0 , 0,0 , 0,0 , 0,0 , 0,0 , 0 ) M 1 = ( 0,1 , 0,0 , 0,0 , 0,0 , 0,0 , 0 ) M 2 = ( 0,0 , 0,0 , 0,0 , 0,1 , 0,0 , 0 ) M 3 = ( 0,0 , 0,1 , 1,1 , 0,0 , 0,0 , 0 ) M 4 = ( 0,0 , 0,0 , 0,0 , 0,0 , 1,0 , 0 ) M 5 = 0,0 , 0,0 , 0,0 , 1,0 , 0,0 , 0 M 6 = ( 0,0 , 0,0 , 0,0 , 0,0 , 0,1 , 1 ) M 7 = ( 0,0 , 1,0 , 0,0 , 0,0 , 0,0 , 0 )
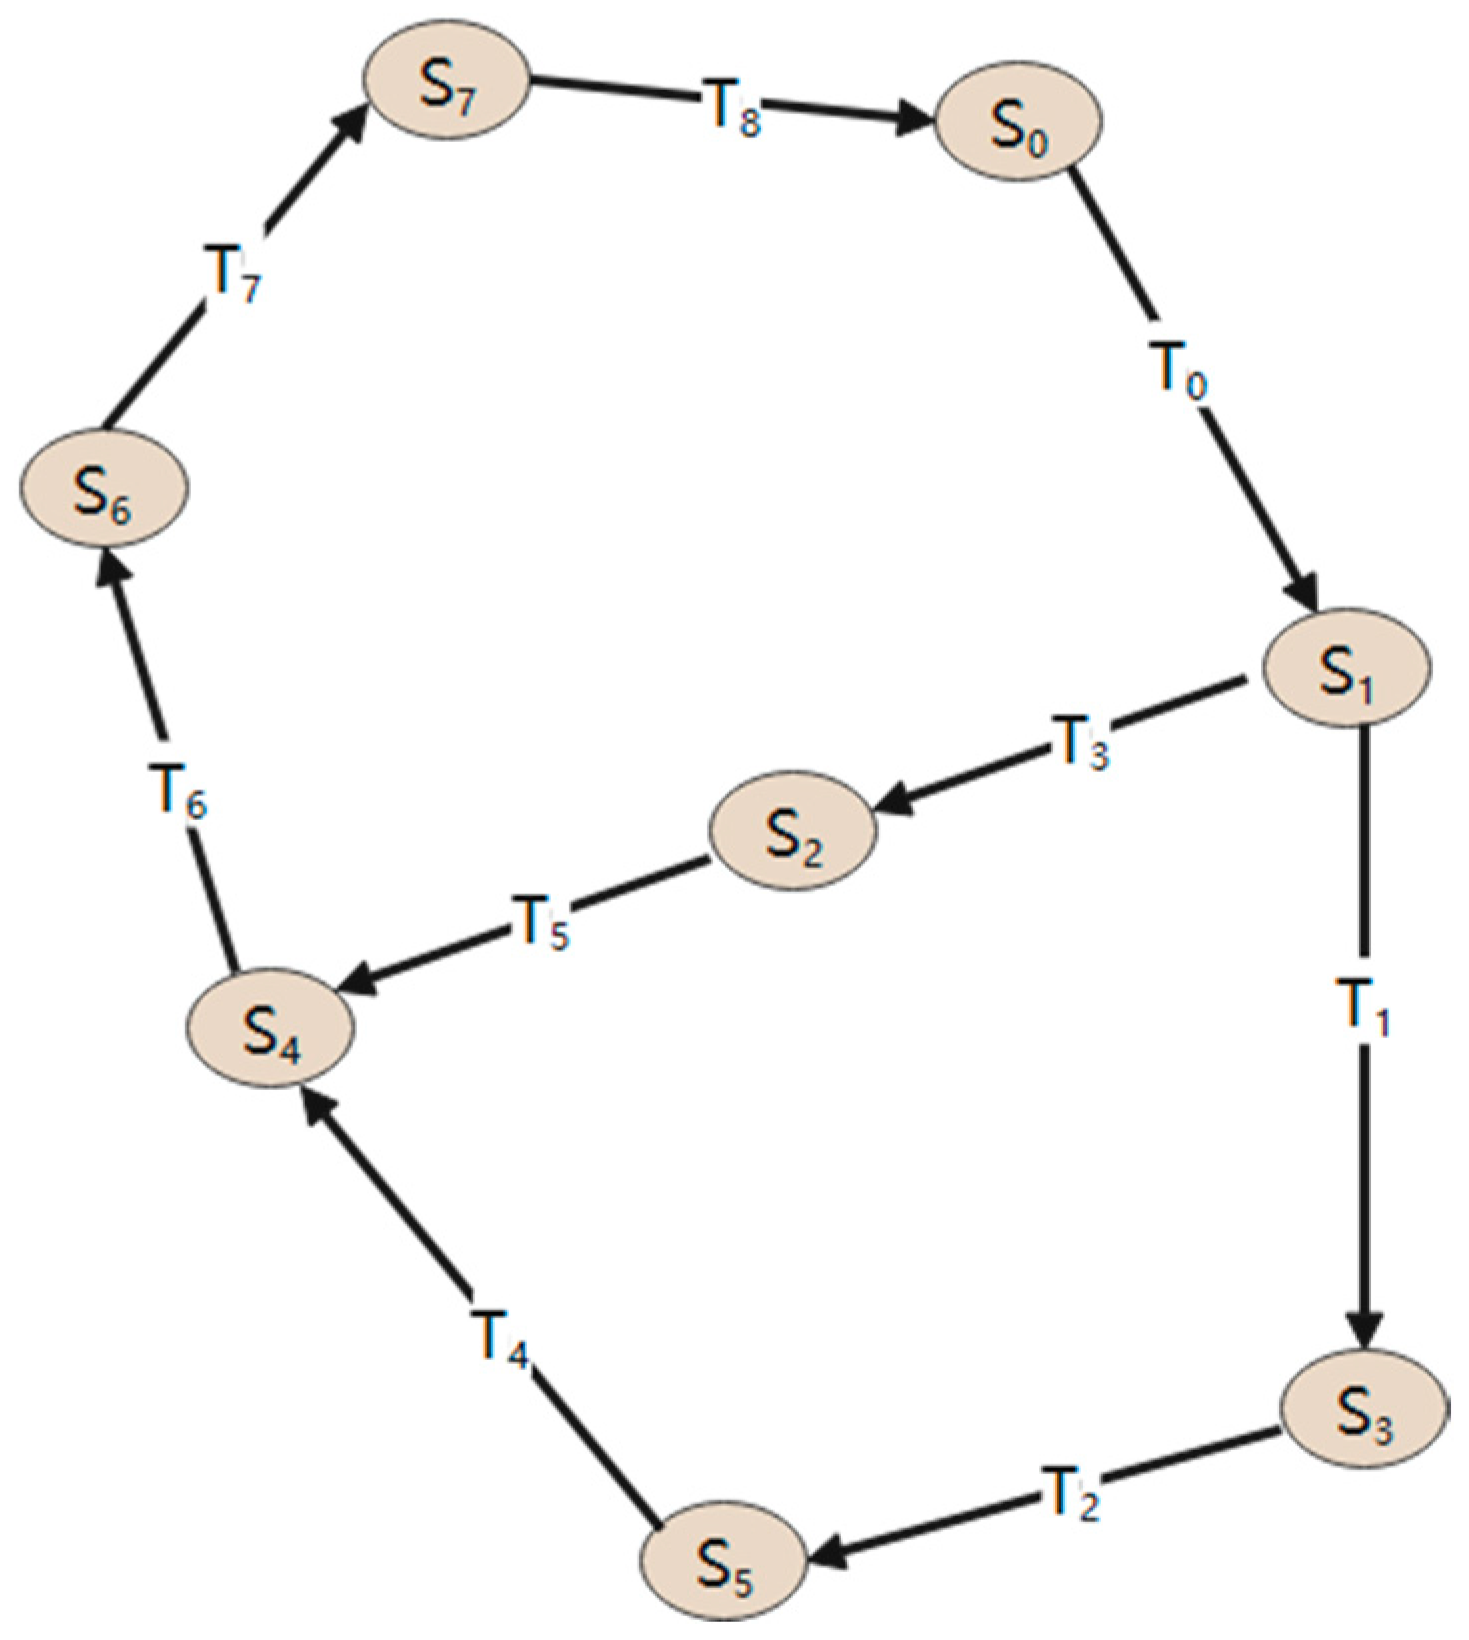
This process mainly involves identifying all the states in the SPN model and mapping them to the states of the Markov chain while defining the transfer probabilities between them, which is accomplished by analyzing the variation and labeling distributions in the SPN model to construct a state transfer matrix that reflects all possible state transfers and their probabilities. In this way, the SPN model is transformed into a Markov chain to obtain an isomorphic Markov chain for this model, which facilitates Markov chain analysis for predicting and evaluating the system behavior, as shown in Figure 7. The following text will refer to it as the SPN-MC model for short.
The SPN-MC model demonstrates excellent performance in simulating online public opinion regarding critical incidents. The reachability of all states and the smooth transitions between neighboring states confirm that the model is structurally free of anomalies and meets the stability and reliability requirements. Together, these features confirm the validity and practicality of the model in modeling online public opinion on critical incidents.

3.3. Indicator Selection and Calculation Methodology

Based on the above, in a continuous-time Stochastic Petri Net, the time interval X between the implementable transition and the implementation of a change t obeys the exponential distribution function F = 1 e λ t , where is the average implementation rate of a change t , and the time of each position ( P ) transition is a random variable. It obeys an exponential distribution, in which the average implementation rate of a change t is λ . Considering eight states in the SPN-MC model, namely M 0 ,   M 1 , ,   M 7 , where directed arcs denote the transitions from one state of online public opinion on incidents to another, and λ denotes the average implementation rate of the state transitions. Let p ( M ) be the probability that the SPN-MC model of the evolutionary process of online public opinion on emergencies is in state M .
In this study, we mainly focused on the analysis of the stage, node, and duration of the evolutionary process of online public opinion, so we selected the stable probability of reachable marking, the busy probability of locations, the utilization rate of variation, the marking flow rate of variation, and the average execution time of the system for calculation.
(1) Stability probability of reachable markings
All equilibrium state equations are first listed according to the isomorphic Markov chain as follows:
j λ j x j = k λ k x k
where i x i = 1 ; thus, the stabilization probability of each reachable marking x i can be determined, which is the basis of the system model performance indicator.
This indicator can describe the characteristics and trends of the evolution of public opinion in different types of emergencies. It can reflect the characteristics of event development, public response, information dissemination, and emergency response under various emergencies.
(2) Busy probability of places
P [ M p i = j ] determines locations p i with j , which is the probability of a token; then, the busy probability of locations is expressed as follows:
P M ( p i ) = j = P M s
(3) Variable utilization rate
Let U t i be the variation utilization rate; then, U t i is equal to the sum of the stable probabilities of transforming t i . The variable utilization rate is computed as follows:
U ( t i ) = M E P ( M )  
where E is the set of t i , through which the set of all reachable identifiers is determined.
The probability of the places being busy and the variation utilization rate are relevant indicators for the degree of variation in the model. It indicates how often or to what extent a particular change is implemented during the simulation. A higher variant utilization rate suggests that the variant plays a more critical or frequent role in the model dynamics, and processes with high variant utilization rates are also the focus of specification and optimization. The variation utilization rate distribution can reflect each key node’s activity and importance. This helps to understand the key aspects of online public opinion regarding critical incidents and the focus of subsequent optimization.
(4) Marked flow rate of variation
The marker flow rate for the variation T i is the average number of markers per unit of time flowing into T i with position P per unit time R ( T , P ) . The formula is expressed as follows:
R ( T , P ) = W ( T , P ) × U ( T ) × λ
where λ is the average implementation rate of the change.
The marker flow rate of variation is the rate at which a marker moves between a particular variant and the repository in the SPN-MC model. It reflects the efficiency or frequency with which a specific variant processes markers in the model, with a high marker flow rate indicating that the variant is more active or critical in the model dynamics. It also indicates the importance of processing at each essential stage in the evolution of public opinion on emergencies. These data can help identify the critical links in public opinion management and the areas that should be focused on and optimized in different scenarios.
(5) Average system implementation time
The average execution time of the system is determined as follows:
T = N / R ( T , P )
where N denotes the average number of markers in the position set at steady state.
The difference in the average execution time of the system reflects the efficiency and complexity of the model processing public opinion toward different events. The results can also be compared with accurate case data to verify the model’s effectiveness.

4. Case Studies

Based on the above discussion, to verify the simulation results of the model and assess the effectiveness of online public opinion subjected to different evolutionary speeds, four typical empirical cases of various types of public health crises, natural disasters, accidental catastrophes, and social security incidents were selected for analysis, and event simulation was conducted according to the speed of their development, as well as their intensity and duration.
Considering the representativeness and generalizability of the cases, as well as the difficulty of collecting data, four events with significant impact in recent years were selected, which were as follows:
(1)
Public Health Event: The arrival of a person released from a prison in Wuhan with a confirmed diagnosis of new coronavirus to Beijing;
(2)
Natural Disasters: The Henan Zhengzhou 7.20 rainstorm;
(3)
Accidental Catastrophes: Guangdong Province, MeiDai Expressway, Tai Po section of the collapse;
(4)
Social Security Incidents: CCTV exposure of the “bad meat” incident in “Braised Pork with Preserved Vegetable in Soya Sauce”.

4.1. Overview of Cases

These four cases are summarized in Table 3.

4.2. Model Parameterization

According to the set parameters, the opinion evolution system is simulated by varying a parameter λ i separately, according to Equation (7).
λ i = 1 T i , T i 0 0 , T i = 0
In the above formula, λ i is the average implementation rate of the variation t i , and T i is the execution time of the link represented by the variation t i . T i = 0 indicates that the public opinion processing process does not involve this link.
UiBot was used for the crawling, filtering, and organization of the relevant data to determine the appropriate parameters. The average implementation rate of change under each event was calculated, and the results are presented in Table 4.
As shown in Table 4, Event 1 developed quickly and lasted for a short period. It was characterized by rapid development and resolution, efficient management, and rapid aftercare. Specifically, T 0 (fermentation of the incident) and T 1 (leading netizens’ attention) had high implementation rates (0.5), indicating that public opinion erupted quickly and attracted attention. T 4 (emotional dissemination) had the highest rate (1), indicating that emotions spread quickly, while T 6 (emergency response) and T 7 (problem-solving, rumor clarification) were also high (both 0.5), implying effective emergency response and problem-solving.   T 8 (aftercare) exhibited a lower rate (0.175), but this was sufficient to result in a rapid resolution of the situation. Event 2 was a fast-moving and long-lasting incident, exhibiting the characteristics of a persistent problem and a more complex situation. Specifically, the rates of T 0 and T 2 (the role of the media) were relatively low (0.2), whereas the rate of T 6 was high (0.5), indicating that the problem persisted despite proper emergency response. The rates of T 1 and T 3 (information opacity), as well as   T 5 (rumor instigation), were low, which may be attributable to the complexity of the problem or the improper handling of the information, leading to the persistent dissemination of public opinion. Event 3 developed slowly and lasted for a short period; thus, it could be gradually controlled. The low rates of T 0 and T 1 (0.175 and 0.5) indicate that public opinion developed slowly but raised concern. The high rates of T 3 and T 4 (0.33) point to the high level of transparency of information and control of emotions, which contributed to the rapid resolution. Event 4 was slow to develop and long in duration. The generally low rates for all variations, especially T 0 and T 2 , indicate the slow development of public opinion and insignificant mediation. Lower rates (e.g., T 3 and T 4 ) may indicate slower information processing and poor emotional control, leading to persistent problems.
These rates reflect the effectiveness of developing and managing public opinion toward different events. Events 1 and 3 involved faster response and effective management, while Events 2 and 4 reflect the complexity and long-term nature of public opinion management, as shown in Table 5.

4.3. Analyzing Results

4.3.1. Evolutionary Leaps

Based on the SPN-MC model, the stability probability of reachable markers is the basis of the system model’s performance index. The stability probability of reachable markers in each event can reflect the characteristics and trends of different evolutionary scenarios related to public opinion, highlighting various aspects of event development, public response, information dissemination, and emergency response. These analyses provide guidance for understanding and responding to different types of online public opinion.
Using Equation (2), a system of equations is formulated as follows:
λ T 0 x 0 = λ T 8 x 7 λ T 1 + λ T 3 x 1 = λ T 0 x 0 λ T 5 x 2 = λ T 3 x 1 λ T 2 x 3 = λ T 1 x 1 λ T 5 x 4 = λ T 4 x 5 + λ T 5 x 2 λ T 4 x 5 = λ T 2 x 3 λ T 7 x 6 = λ T 6 x 4 λ T 8 x 7 = λ T 7 x 6 i = 0 7 x i = 1
Solving the system of equations yields stable probability results of reachable markers in each event, as shown in Table 6.
Considering the average implementation rate of the variation ( λ ) and the likelihood of the states ( M 0 ,   M 1 , ,   M 7 ), the probabilities ( p ( M ) ) of specific events can be determined.
The highest probability (0.3263) of M 7 in Event 1 indicates that the incident was resolved, and rumors were eliminated faster, reflecting rapid and effective public opinion management and emergency response. The higher probability (0.1806) of M 4 suggests that emotional dissemination during the outbreak stage of public opinion was more significant among stakeholders, but it was then effectively controlled. The higher probability (0.1803) of M 6 in Event 2 indicates that the emergency response continued. Nevertheless, the problem was not fully resolved, suggesting the persistence of public opinion and the complexity of management. The relatively higher probability of M 1 and M 4 indicates that the incident continuously raised public concern and emotional response. The highest probability (0.2181) for M 0 in Event 3 indicates a slow progression of the event, but in combination with the relatively high probabilities for M 6 and M 7 , it suggests that the incident was ultimately controlled and resolved effectively. The lower M 5 and M 6 probabilities indicate the insignificant impact of rumors and hot topics, reflecting effective information management. The highest probability (0.2499) for M 0 in Event 4 reflects the continued attention directed toward sensitive events. The relatively balanced probability distribution suggests the continuous and slow evolution of public opinion and the lack of sufficient attention or effective management measures.

4.3.2. Complexity

The busy probability of locations and the number of markers in the repository are crucial for analyzing the SPN-MC model, as they directly affect the activation of variations and the whole system’s behavior. The initial marker distribution (i.e., the initial number of markers in the repository) and their distribution over time in different simulation or analysis scenarios are crucial to understanding and explaining the system behavior.
(1) Probability of the places being busy (labeled probability density function)
Using Equation (3), this factor is expressed as follows:
Event 1:
P M ( p 0 ) = 0 = 0.8915 P M ( p 0 ) = 1 = 0.1085 P M ( p 1 ) = 0 = 0.9319 P M ( p 1 ) = 1 = 0.0681 P M ( p 2 ) = 0 = 0.6737 P M ( p 2 ) = 1 = 0.3263 P M ( p 3 ) = 0 = 0.9092 P M ( p 3 ) = 1 = 0.0908 P M ( p 4 ) = 0 = 0.9092 P M ( p 4 ) = 1 = 0.0908 P M ( p 5 ) = 0 = 0.9092 P M ( p 5 ) = 1 = 0.0908 P M ( p 6 ) = 0 = 0.9737 P M ( p 6 ) = 1 = 0.0263 P M ( p 7 ) = 0 = 0.9254 P M ( p 7 ) = 1 = 0.0746 P M ( p 8 ) = 0 = 0.8194 P M ( p 8 ) = 1 = 0.1806 P M ( p 9 ) = 0 = 0.8813 P M ( p 9 ) = 1 = 0.1187 P M ( p 10 ) = 0 = 0.8813 P M ( p 10 ) = 1 = 0.1187
Event 2:
P M ( p 0 ) = 0 = 0.8915 P M ( p 0 ) = 1 = 0.1039 P M ( p 1 ) = 0 = 0.8933 P M ( p 1 ) = 1 = 0.1067 P M ( p 2 ) = 0 = 0.7769 P M ( p 2 ) = 1 = 0.2231 P M ( p 3 ) = 0 = 0.9106 P M ( p 3 ) = 1 = 0.0894 P M ( p 4 ) = 0 = 0.9106 P M ( p 4 ) = 1 = 0.0894 P M ( p 5 ) = 0 = 0.9106 P M ( p 5 ) = 1 = 0.0894 P M ( p 6 ) = 0 = 0.9178 P M ( p 6 ) = 1 = 0.0822 P M ( p 7 ) = 0 = 0.9106 P M ( p 7 ) = 1 = 0.0894 P M ( p 8 ) = 0 = 0.8751 P M ( p 8 ) = 1 = 0.1249 P M ( p 9 ) = 0 = 0.8197 P M ( p 9 ) = 1 = 0.1803 P M ( p 10 ) = 0 = 0.8197 P M ( p 10 ) = 1 = 0.1803
Event 3:
P M ( p 0 ) = 0 = 0.8915 P M ( p 0 ) = 1 = 0.2181 P M ( p 1 ) = 0 = 0.9546 P M ( p 1 ) = 1 = 0.0454 P M ( p 2 ) = 0 = 0.9224 P M ( p 2 ) = 1 = 0.0776 P M ( p 3 ) = 0 = 0.8882 P M ( p 3 ) = 1 = 0.1118 P M ( p 4 ) = 0 = 0.8882 P M ( p 4 ) = 1 = 0.1118 P M ( p 5 ) = 0 = 0.8882 P M ( p 5 ) = 1 = 0.1118 P M ( p 6 ) = 0 = 0.9328 P M ( p 6 ) = 1 = 0.0672 P M ( p 7 ) = 0 = 0.9195 P M ( p 7 ) = 1 = 0.0805 P M ( p 8 ) = 0 = 0.7985 P M ( p 8 ) = 1 = 0.2015 P M ( p 9 ) = 0 = 0.8022 P M ( p 9 ) = 1 = 0.1978 P M ( p 10 ) = 0 = 0.8022 P M ( p 10 ) = 1 = 0.1978
Event 4:
P M ( p 0 ) = 0 = 0.8915 P M ( p 0 ) = 1 = 0.2499 P M ( p 1 ) = 0 = 0.9401 P M ( p 1 ) = 1 = 0.0599 P M ( p 2 ) = 0 = 0.8457 P M ( p 2 ) = 1 = 0.1543 P M ( p 3 ) = 0 = 0.8817 P M ( p 3 ) = 1 = 0.1183 P M ( p 4 ) = 0 = 0.8817 P M ( p 4 ) = 1 = 0.1183 P M ( p 5 ) = 0 = 0.8817 P M ( p 5 ) = 1 = 0.1183 P M ( p 6 ) = 0 = 0.8767 P M ( p 6 ) = 1 = 0.1233 P M ( p 7 ) = 0 = 0.9559 P M ( p 7 ) = 1 = 0.0441 P M ( p 8 ) = 0 = 0.8746 P M ( p 8 ) = 1 = 0.1254 P M ( p 9 ) = 0 = 0.8753 P M ( p 9 ) = 1 = 0.1247 P M ( p 10 ) = 0 = 0.8753 P M ( p 10 ) = 1 = 0.1247
(2) Average number of markers in the places
From the busy probability of locations, the average number of markers in the locations for each scenario can be obtained, as shown in Table 7.
The results in Table 7 indicate that the mean number of markers for P 2 (escalation of the incident) in Event 1 is the highest (0.3263), indicating that the incident escalated rapidly during this event. The number of markers for P 8 (government intervention), P 9 (diversion of the public’s attention), and P 10 (the incident died down) are also relatively high (0.1806, 0.1187, and 0.1187), indicating that the government’s intervention was effective, public opinion was controlled in time, and the incident was ultimately controlled. The relatively high mean number of markers for P 2 (0.2231) in Event 2 indicates that the incident lasted for a more extended period from its inception to its escalation. The high number of markers for P 9 and P 10 (0.1803 and 0.1803) suggests that the problem persisted despite proper emergency response. P 0 (sensitive incident occurrence) in Event 3 had the highest mean number of markers (0.2181), pointing to the slow development of the incident. The higher number of markers (0.1978 and 0.1978) for P 9 and P 10 suggests that the incident was eventually addressed and it was resolved efficiently, despite its slow development. Event 4 had the highest average marker number (0.2499) for P 0 , reflecting the public’s continued interest in the incident. The distribution of markers across repositories is more balanced, reflecting public opinion’s continuous formation and slow evolution.
The distribution of these markers provides an in-depth understanding of the dynamics of public opinion evolution under different events. In fast-developing and quickly resolved events, the higher number of markers for escalation and government intervention reflects rapid response and effective opinion control. In contrast, sustained attention to sensitive events and evenly distributed markers in slow-developing incidents indicate the long-term and complex nature of public opinion. These findings can help develop public opinion management strategies for different contexts.

4.3.3. Key Nodes

The variant utilization rate is used to measure the influence of the variants on the SPN-MC model. It indicates how often or to what extent a particular variation is implemented during the simulation. A higher variation utilization rate suggests that the variant plays a more critical or frequent role in the model dynamics. The distribution of variation utilization rates can reflect each stage’s degree of activation and importance under different evolutionary scenarios regarding public opinion. This helps to understand the key aspects and priorities in public opinion management during different events. Equation (4) was used to determine the change utilization rate under each event, and the results are provided in Figure 8 and Table 8.
As shown in Table 8, the highest utilization rate (0.3263) of T 8 (aftercare) in Event 1 indicates that aftercare is very frequent and critical in this event. The higher utilization rate (0.1806) of T 6 (emergency response) suggests the rapid management of emergencies. The higher utilization rate (0.1803) of T 7 (solving problems and clarifying rumors) in Event 2 reflects the active problem-solving process. The utilization rate (0.1067) of T 1 (leading netizens’ attention) is also high, indicating that netizens’ attention is consistently attracted to this kind of event. The highest utilization rate (0.2181) of T 0 (fermentation of events) in Event 3 indicates that the fermentation of events is more significant in this type of event. The higher utilization rates (0.2015 and 0.1978) of T 6 and T 7 indicate that contingency management and problem-solving are highly effective despite the slow development. The highest utilization rate (0.2499) for T 0 in Event 4 points to the long-term interest in the event. Variant utilization rates are relatively balanced, with no particularly prominent variant, indicating the relative importance of each component.

4.3.4. Evolutionary Efficiency

The labeled flow rates of changes under each event reflect each stage’s processing efficiency and importance in different evolutionary scenarios involving public opinion. These data can help identify the critical links in public opinion management and the areas that should be focused on and optimized in various scenarios. Using Equation (5), the marker flow rate of change under each event was determined, and the results are shown in Figure 9.
The marker flow rate of a variant is the rate at which a marker moves between a particular variant and the repository in the SPN model. It reflects the efficiency or frequency with which a specific variant processes markers in the model. A high marker flow rate indicates that the variant is more active or critical in the model dynamics. As shown in Table 8, the flow rate R ( T 5 , p 7 ) is the highest (0.1492) in Event 1, indicating that the transition from rumor instigation to incident escalation is very rapid in this case. The flow rates R ( T 6 , p 8 ) and R ( T 6 , p 9 ) are higher (both 0.0601), indicating the effectiveness of the emergency response and the shift in the public’s attention. The high flow rates R ( T 6 , p 8 ) and R ( T 6 , p 9 ) in Event 2 (both 0.0625) reflect long-term public opinion management and public attention. The relatively high flow rate of R ( T 7 , p 10 ) (0.0595) indicates an active problem-solving and rumor clarification process. The relatively balanced flow rates of R ( T 6 , p 8 ) and R ( T 6 , p 9 ) in Event 3 (both 0.0403) point to the moderate effectiveness of the emergency response and changes in public attention. The moderate flow rate of R ( T 7 , p 10 ) (0.0396) suggests that the incident was resolved and rumors were eliminated relatively smoothly. All the flow rates in Event 4 are relatively balanced, with no particularly prominent values, suggesting the management of all aspects of the incident was slow but balanced. R ( T 7 , p 10 ) has a slightly higher flow rate (0.0312), suggesting a continuous problem-solving process.

4.3.5. Length of Implementation

The average system execution time was calculated using Equation (6), with the results under different events presented in Table 9. This parameter was used to measure the average length of time required from the occurrence of an incident to its final resolution, which matches the actual scenarios.
For Event 1, the average system execution time was 21.836 days, the shortest among the four events. This reflects that in Event 1, public opinion could be quickly identified and effectively controlled, and the whole process took less time from occurrence to resolution. The average system execution time for Event 2 was 24.137 days. Although public opinion erupted quickly, the issue’s complexity or the challenge of managing it resulted in the slightly longer duration of the whole process compared to Event 1. However, it was still resolved in a relatively short period. The average system implementation time for Event 3 was 31.497 days. This indicates that although public opinion developed more slowly, the overall processing time was still controlled within a reasonable range, demonstrating effective public opinion management. The average system execution time for Event 4 was 35.848 days, the longest among the four events. This reflects that in Event 4, public opinion management started at a slower pace, and the whole resolution process lasted longer, probably due to the need for sufficient attention or effective handling measures.
In summary, the difference in the average execution time of the system reflects the efficiency and complexity of managing public opinion under different events. Shorter execution times indicate that public opinion can be managed quickly and effectively, whereas longer execution times may point to challenges in the management process or the complexity of public opinion.

4.4. Discussion

The results of the analysis are summarized in Table 10.
The categorization is summarized as follows:
(1) Public health events
Public health events have a significant impact and involve many parties. Therefore, public opinion can be emotionally disseminated, and the transition from rumor instigation to escalation occurs very rapidly. As long as the media releases the information in time and the government intervenes effectively, public opinion can be controlled, and the incident can managed. The critical point in the management of this kind of public opinion is to provide superior aftercare, take the initiative to clarify and disclose information, and present solutions. The evolutionary path that drives online public opinion’s decline is the proactive decrease in which the government and the media work together to solve problems.
(2) Natural disasters
Natural disasters often involve sustained public attention and emotional responses, but the main focus is on emergencies. Public opinion escalates more rapidly and is less likely to be reversed or involve vertical excavation of issues and horizontal association. The critical point in the control of such incidents is to address the emergencies themselves. Although public opinion is effectively managed before the emergency incident is effectively controlled, it will continue to be generated if the incident still needs to be fully resolved. The evolutionary path leading to the weakening of public opinion involves the government’s initiative to solve the problem actively.
(3) Accidents and catastrophes
The influences of rumors, opinion leaders, and hot topics related to accidents and catastrophes are not apparent. The critical point in dealing with such events is controlling public opinion’s fermentation. The public’s attention is not easily diverted by the occurrence of other emergencies and the formation of other public viewpoints. Hence, the emergency response to such public opinion is to achieve sufficient information symmetry, disclose information promptly, and respond to the public’s concerns. The evolutionary path that drives online public opinion’s decline is the proactive decline in the media’s role in actively disclosing information.
(4) Social security incidents
Social security incidents are the most complex. The case studies in this paper could be more representative. However, as a whole, the findings indicate that the critical point of controlling is to prevent the occurrence of sensitive events that will receive attention for a long time and continuously. For example, netizens’ fatigue is apparent regarding persistent social problems such as food safety. Netizens will stop asking questions when an official response fails to solve the substantive issues. Nevertheless, netizens’ venting and expression on online platforms will continue to persist. In some of these events, the views of some netizens involve more emotional venting than rational discussion and truth-seeking. After satisfying their desire for expression and venting their anger, they often have difficulty maintaining continuous attention to the events, leading to a rapid decline in public opinion fervor. However, some public opinion events do not recede quickly and have multiple cycles of public attention. These involve vertical excavation of a single issue and even lead to horizontal links between similar problems. The wave-like movement of online public opinion repeatedly increases the heat of public opinion, prolongs the life cycle of public opinion, and even maintains a certain degree of intensity of the topic after the change in online hotspots.
The evolutionary path of its decline is also the most complicated, with three trends driving the decline: a spontaneous decline based on the life cycle of public opinion, a proactive decline in which the government actively solves problems, and a substitution decline in which new issues replace the original incident.

5. Conclusions

This paper provides an intuitive description of the evolutionary process of online public opinion regarding critical incidents considering the life cycle evolution law. A Petri net isomorphic Markov chain model of the evolution of online public opinion on emergencies was constructed based on Petri net theory. Four real-life cases were selected to validate and analyze the model by determining the steady-state probability, the busy probability of locations, the variation utilization rate, and the average delay time.
(1)
The study findings show that the model has certain advantages in analyzing the evolution of public opinion on emergencies based on multi-factor coupling and quantifying the key nodes involved in this process.
(2)
The analysis of the evolution model revealed different evolutionary leap mechanisms of online public opinion regarding different types of emergencies. Their complexity, key nodes, evolution rate, and execution time were also different. The change law of the equilibrium state and its development path were analyzed with four case studies using the scenario simulation method, and the results indicate that the proposed model can more effectively address the challenges posed by the formation of online public opinion on emergencies.

Author Contributions

Conceptualization, C.G.; methodology, C.G. and Y.S.; software, C.G.; validation, C.G.; formal analysis, C.G. and Y.S.; investigation, C.G.; resources, C.G. and Y.S.; data curation, C.G.; writing—original draft preparation, C.G.; writing—review and editing, C.G.; visualization, C.G.; supervision, Y.S.; project administration, C.G. and Y.S.; funding acquisition, C.G. and Y.S. All authors have read and agreed to the published version of the manuscript.

Funding

This research received no external funding.

Data Availability Statement

Data is contained within the article. The original contributions presented in the study are included in the article material, further inquiries can be directed to the corresponding author.

Conflicts of Interest

The authors declare no conflicts of interest.

References

  1. Lin, Y.; Xie, X.; Zhang, D. Analysis of online public opinion evolution under the influence of complex interaction behaviors. Chin. J. Manag. Sci. 2020, 28, 212–221. [Google Scholar]
  2. Guan, X.; Zhang, Z.; Zhang, S. Evolution Mechanism of The Ecological Dissemination System of Internet Public Opinion. In LISS 2014: Proceedings of 4th International Conference on Logistics, Informatics and Service Science; Springer: Berlin/Heidelberg, Germany, 2015. [Google Scholar]
  3. Wang, N.; Lv, X.L. Research on emotional analysis of netizens and topic distribution under public health emergencies: —A Case Study of COVID-19. In Proceedings of the 2020 International Conference on Public Health and Data Science (ICPHDS), Guangzhou, China, 20–22 November 2020. [Google Scholar] [CrossRef]
  4. Fang, S.; Zhao, N.; Chen, N.; Xiong, F.; Yi, Y. Analyzing and Predicting Network Public Opinion Evolution Based on Group Persuasion Force of Populism. Phys. A Stat. Mech. Its Appl. 2019, 525, 809–824. [Google Scholar] [CrossRef]
  5. Liu, Y.; Liu, R.; Li, R. Public Opinion Guidance and Science and Technology Dissemination for Public Health Emergencies. Disaster Manag. 2013, 133, 303–309. [Google Scholar] [CrossRef]
  6. Yao, C.; He, G. Key Nodes Analysis of Microblogging Public Opinion Spread About Public Emergencies-Such As The Missed Malaysia Flight MH370. In Proceedings of the 2015 International Conference on Modeling, Simulation and Applied Mathematics, Phuket, Thailand, 23–24 August 2015. [Google Scholar] [CrossRef]
  7. Yang, F.; Sun, T. Who has set whose agenda on social media? A dynamic social network analysis of Tweets on Paris attack. Commun. Q. 2021, 69, 341–363. [Google Scholar] [CrossRef]
  8. Lim, S.; Berry, F.S.; Lee, K.-H. Stakeholders in the same bed with different dreams: Semantic network analysis of issue interpretation in risk policy related to mad cow disease. J. Public Adm. Res. Theory 2016, 26, 79–93. [Google Scholar] [CrossRef]
  9. Levitan, K.B. Information resources as “Goods” in the life cycle of information production. J. Am. Soc. Inf. Sci. 1982, 33, 44–54. [Google Scholar] [CrossRef]
  10. Li, S.; Liu, Z.; Li, Y. Temporal and spatial evolution of online public sentiment on emergencies. Inf. Process. Manag. 2020, 57, 102177. [Google Scholar] [CrossRef] [PubMed]
  11. Zhang, Y.; Chen, N.; Du, W.; Yao, S.; Zheng, X. A New Geo-Propagation Model of Event Evolution Chain Based on Public Opinion and Epidemic Coupling. Int. J. Environ. Res. Public Health 2020, 17, 9235. [Google Scholar] [CrossRef]
  12. Li, Y.; Shen, X. Spread of Online Public Opinion of Animal Epidemic Emergency: A Case Study of the H7N9 Incident Based on Healthcare Data Analytics. J. Healthc. Eng. 2021, 2021, 1512742. [Google Scholar] [CrossRef]
  13. Zhang, J.; Chen, Y.; Zhao, Y.; Wolfram, D.; Ma, F. Public health and social media: A study of Zika virus-related posts on Yahoo! Answers. J. Assoc. Inf. Sci. Technol. 2020, 71, 282–299. [Google Scholar] [CrossRef]
  14. Chen, J.; Du, S.; Yang, S. Mining and Evolution Analysis of Network Public Opinion Concerns of Stakeholders in Hot Social Events. Mathematics 2022, 10, 2145. [Google Scholar] [CrossRef]
  15. Burkholder, B.T.; Toole, M.J. Evolution of complex disasters. Lancet 1995, 346, 1012–1015. [Google Scholar] [CrossRef]
  16. Liu, Y.; Zhu, J.; Shao, X.; Adusumilli, N.C.; Wang, F. Diffusion patterns in disaster-induced internet public opinion: Based on a Sina Weibo online discussion about the ‘Liangshan fire’ in China. Environ. Hazards 2020, 20, 163–187. [Google Scholar] [CrossRef]
  17. Qiu, Q.; He, J.; Chen, H.; Qiu, J. Research on The Evolution Law of Emergency Network Public Opinion. In Proceedings of the 2019 12th International Symposium on Computational Intelligence and Design (ISCID), Zhejiang, China, 1 December 2019. [Google Scholar] [CrossRef]
  18. He, M.; Zhang, D.; Wang, H.; Li, X.; Fang, P. Public Opinion Evolution Model with The Variable Topology Structure Based on Scale Free Network. Acta Phys. Sin. 2010, 59, 5175–5181. [Google Scholar]
  19. Pohl, D.; Bouchachia, A.; Hellwagner, H. Social media for crisis management: Clustering approaches for sub-event detection. Multimed. Tools Appl. 2015, 74, 3901–3932. [Google Scholar] [CrossRef]
  20. Lan, Y.; Dong, X.; Zeng, R.; Qi, Z. Research on effects model of derived of network public opinion from the perspective of information alienation. J. Intell. 2015, 34, 139–143. [Google Scholar]
  21. Zhang, Y.; Feng, Y. Two-layer coupled network model for topic derivation in public opinion propagation. China Commun. 2020, 17, 176–187. [Google Scholar] [CrossRef]
  22. Zhou, D.; Shi, L.; Wang, B.; Xu, H.; Huang, W. Are Your Comments Positive? A Self-Distillation Contrastive Learning Method for Analyzing Online Public Opinion. Electronics 2024, 13, 2509. [Google Scholar] [CrossRef]
  23. Lai, J.; Yang, X.; Luo, W.; Zhou, L.; Li, L.; Wang, Y.; Shi, X. RumorLLM: A Rumor Large Language Model-Based Fake-News-Detection Data-Augmentation Approach. Appl. Sci. 2024, 14, 3532. [Google Scholar] [CrossRef]
  24. Cheng, Q.; Zhang, Y.; Li, Y. Topic Relevance of Public Health Emergencies Influence Internet Public Opinion Resonance: Simulation Based on Langevin’s Equation. Math. Probl. Eng. 2021, 2021, 5818346. [Google Scholar] [CrossRef]
  25. Yang, K.; Miao, R. Research on Evolution Model and Crisis Prevention and Control of New Media Public Opinion. In Proceedings of the 2017 International Conference on Education Innovation and Social Science (ICEISS 2017), Jinan, China, 19 November 2017. [Google Scholar]
  26. Wang, L.; Wang, K.; Wu, J. Public Opinion Propagation and Evolution of Public Health Emergencies in Social Media Era: A Case Study of 2018 Vaccine Event. Data Anal. Knowl. Discov. 2019, 3, 42–52. [Google Scholar]
  27. Lian, S.; Li, Z. Public opinion guidance and communication mechanism innovation of public health events based on the multitask learning network in the internet era. Mob. Inf. Syst. 2022, 2022 Pt 4, 7106054.1–7106054.8. [Google Scholar] [CrossRef]
  28. Li, W.; Zeng, F.; Zhou, W.; Chen, Z. Internet public opinion diffusion mechanism in public health emergencies: Based on entropy flow analysis and dissipative structure determination. Front. Public Health 2021, 9, 731080. [Google Scholar] [CrossRef] [PubMed]
  29. Zhang, Y.; Xie, Y.; Shi, V.; Yin, K. Dynamic Characteristics and Evolution analyses of Information Dissemination Theme of Social Networks under Emergencies. Behav. Sci. 2023, 13, 282. [Google Scholar] [CrossRef]
  30. Cui, P.; He, Y. Research on The Dissemination and Response of Network Public Opinion of Emergency Events in Colleges Based on Crowd Intelligence Thinking. Open J. Soc. Sci. 2019, 7, 281. [Google Scholar] [CrossRef]
  31. Ye, P.; Liu, L. Factors Influencing College Students’ Behaviors of Spreading Internet Public Opinions on Emergencies in Universities. Inf. Discov. Deliv. 2021, 50, 75–86. [Google Scholar] [CrossRef]
  32. Tan, K.; Xie, L.; Lin, L. Research on The Evolution Path of Public Opinion in Environmental Emergencies. E3S Web Conf. 2021, 257, 03059. [Google Scholar] [CrossRef]
  33. Zhang, L.; Wei, J.; Boncella, R.J. Emotional communication analysis of emergency microblog based on the evolution life cycle of public opinion. Inf. Discov. Deliv. 2020, 48, 151–163. [Google Scholar] [CrossRef]
  34. Medina-Garcia, S.; Medina-Marin, J.; Montaño-Arango, O.; Gonzalez-Hernandez, M.; Hernandez-Gress, E.S. A Petri Net Approach for Business Process Modeling and Simulation. Appl. Sci. 2023, 13, 11192. [Google Scholar] [CrossRef]
  35. Zhu, H.; Liu, G.; Yu, Z.; Li, Z. Detectability in Discrete Event Systems Using Unbounded Petri Nets. Mathematics 2023, 11, 3862. [Google Scholar] [CrossRef]
  36. Saadaoui, I.; Labed, A.; Li, Z.; El-Sherbeeny, A.M.; Du, H. Language-Based Opacity Verification in Partially Observed Petri Nets through Linear Constraints. Mathematics 2023, 11, 3880. [Google Scholar] [CrossRef]
  37. Ma, D.; Zhang, C.; Zhao, L.; Huang, Q.; Liu, B. An analysis of the Evolution of Public Sentiment and Spatio-Temporal Dynamics Regarding Building Collapse Accidents Based on Sina Weibo Data. ISPRS Int. J. Geo-Inf. 2023, 12, 388. [Google Scholar] [CrossRef]
  38. Yang, S.; Liu, S.; Su, K.; Chen, J. A Rumor Propagation Model Considering Media Effect and Suspicion Mechanism under Public Emergencies. Mathematics 2024, 12, 1906. [Google Scholar] [CrossRef]
  39. Li, W.; Shen, H.; Huang, Z.; Yang, H. Research on the Dynamical Behavior of Public Opinion Triggered by Rumor Based on a Nonlinear Oscillator Model. Entropy 2023, 25, 1614. [Google Scholar] [CrossRef]
  40. Lu, Y. The Influence of Cognitive and Emotional Factors on Social Media Users’ Information-Sharing Behaviors during Crises: The Moderating Role of the Construal Level and the Mediating Role of the Emotional Response. Behav. Sci. 2024, 14, 495. [Google Scholar] [CrossRef]
  41. Gomes, L.; Natário, D.; Costa, A.; Barros, J.-P.; Campos-Rebelo, R. Event-Based Modeling of Input Signal Behaviors for Discrete-Event Controllers. Appl. Sci. 2024, 14, 5289. [Google Scholar] [CrossRef]
  42. Zuberek, W.M. Performance evaluation using unbound timed Petri nets. In Proceedings of the 3rd International Workshop on Petri Nets and Performance Models, Kyoto, Japan, 11–13 December 1989; pp. 180–186.
  43. Molly, M.K. Discrete Time Stochastic. IEEE Trans. Softw. Eng. 1985, 31, 417–423. [Google Scholar] [CrossRef]
Figure 1. The formation period of online public opinion on emergencies.
Systems 12 00333 g001
Figure 2. The diffusion period of the evolution of online public opinion on emergencies.
Systems 12 00333 g002
Figure 3. The evolutionary outbreak period of online public opinion on emergencies.
Systems 12 00333 g003
Figure 4. There is a declining period in the evolution of online public opinion on emergencies.
Systems 12 00333 g004
Figure 5. Systematic diagram of the evolutionary process of online public opinion on emergencies.
Systems 12 00333 g005
Figure 6. SPN model of the evolutionary process of online public opinion on emergencies.
Systems 12 00333 g006
Figure 7. SPN-MC model for the evolutionary process of online public opinion on emergencies.
Systems 12 00333 g007
Figure 8. (a) Utilization of variation under Event 1; (b) utilization of variation under Event 2; (c) utilization of variation under Event 3; (d) utilization of variation under Event 4.
Systems 12 00333 g008
Figure 9. (a) Marker flow rate for Event 1; (b) marker flow rate for Event 2; (c) marker flow rate for Event 3; (d) marker flow rate for Event 4.
Systems 12 00333 g009
Table 1. Elements of the SPN model for the evolutionary process of online public opinion.
Elements of Public OpinionScope of the Impact RelationshipChange TMeaning of Change
P0Sensitive incidents occurT0Festering events
P1ContingencyT1Leading netizens’ attention
P2Opinion leaderT2The media works
P3Netizen’s commentsT3Lack of transparency of information
P4StakeholderT4Emotional contagion
P5Hot topicT5Rumor mongering
P6RumorsT6Emergency management
P7Escalation of eventsT7Solving problems and clarifying rumors
P8Government interventionT8Deal with the aftermath (arising from an accident)
P9Diversion of public attention
P10Die down
Table 2. Correlation matrix B.
T0T1T2T3T4T5T6T7T8
P0−100000001
P11−10000000
P201−1000000
P301−1000000
P401−1000000
P5001−1−10000
P600010−1000
P7000011−100
P80000001−10
P90000001−10
P1000000001−1
Table 3. Description of critical event cases.
EventEvent Description
The arrival of a person released from prison in Wuhan with a confirmed diagnosis of new coronary pneumonia to BeijingOn 26 February 2020, Beijing Dongcheng District WeChat public reported a confirmed case of new coronavirus infection of pneumonia (case 24); media reports indicated that Ms. H was an ex-prisoner in Wuhan who had been advised by family members to drive to Beijing. In the most critical epidemic prevention and control period, This incident violates the traffic control measures in Wuhan and Ezhou, triggering many netizens to discuss the incident. On 27 February, Bai Yansong discussed the event through microblog and Tiktok, stimulated continuous discussion among interested netizens, and the attention continued to increase, leading to the formation of public opinion amid fermentation. On 2 March, a case was filed to investigate whether this constituted a violation of the law. It announced the results of the investigation on the same day. On 16 March, the individual was discharged from the hospital, and on 22 March, police informed this case of a woman who was released from jail and arrived from Wuhan to Beijing.
Henan Zhengzhou 7.20 rainstorm From 17 to 23 July 2021, Henan Province was hit by historically rare hefty rainfall and severe flooding. On 20 July, in particular, Zhengzhou City suffered significant casualties and property damage. The most popular follow-up events that netizens were concerned about included the K226 train requesting emergency support, the flooding of Changzhuang Reservoir, Zhengzhou Metro Line 5, a compartment with many people trapped inside, and the number of people trapped and casualties due to the disaster.
Collapse of the Tai Po section of the Meidai Expressway in Guangdong ProvinceAt around 2:10 a.m. on 1 May 2024, a severe road collapse accident occurred on the Chaoyang section of the Meidai Expressway in Meizhou City, Guangdong Province. The accident caused several vehicles to become trapped, catch fire, and explode. According to reports, the accident resulted in at least 48 deaths and 30 injuries. After the accident, the government quickly organized rescue efforts and set up an on-site command, with about 500 people from public security, emergency response, firefighting, health and hygiene, transport, mine rescue teams, and other departments participating in the on-site rescue.
CCTV exposure of the “bad meat” incident in “Braised Pork with Preserved Vegetable in Soya Sauce”On 15 March 2024, the CCTV 3–15 Evening Party reported that, as a central area for the production of plum and vegetable button-prepared products, some local enterprises in Fuyang City, Anhui Province, used trough-head meat, which had not been strictly treated, to make plum and vegetable button-prepared products. Trough-head meat, also known as lymphatic meat in daily life, is a part of pork recognized as being of poor quality and low in price.
Table 4. Average rate of implementation of changes.
VicissitudesAverage Implementation Rate
Event 1Event 2Event 3Event 4
λ T 0 0.50.50.1750.125
λ T 1 0.50.20.50.33
λ T 2 0.3330.20.20.175
λ T 3 0.250.250.330.2
λ T 4 10.1670.330.167
λ T 5 0.20.250.1750.25
λ T 6 0.3330.50.20.2
λ T 7 0.50.330.20.25
λ T 8 0.1750.250.50.2
Table 5. Evolution of online public opinion on the four events.
EventPace of DevelopmentSpanEvent Description
Event 1The rapid pace of developmentshort
duration
Public opinion erupts and peaks rapidly but is quickly controlled due to effective management or other factors.
Event 2The rapid pace of developmentlong
duration
Public opinion erupts quickly and stays at its peak for longer, possibly because of the issue’s complexity, mismanagement, or continued media attention.
Event 3The slow pace of developmentshort
duration
Public opinion develops slowly but quickly resolves due to effective intervention or other factors.
Event 4The slow pace of developmentlong
duration
Public opinion develops gradually and lasts for an extended period, fading slowly without adequate attention or effective measures to address it.
Table 6. Stabilization probability of reachable markers in each event.
EventMarking Status
M0M1M2M3M4M5M6M7
Event 10.10850.06810.07460.09080.18060.02630.11870.3263
Event 20.10390.10670.08940.08940.12490.08220.18030.2231
Event 30.21810.04540.08050.11180.20150.06720.19780.0776
Event 40.24990.05990.04410.11830.12540.12330.12470.1543
Table 7. Average number of markers in the locations under four types of scenarios.
u 0 ¯ u 1 ¯ u 2 ¯ u 3 ¯ u 4 ¯ u 5 ¯ u 6 ¯ u 7 ¯ u 8 ¯ u 9 ¯ u 10 ¯
Event 10.10850.06810.32630.09080.09080.09080.02630.07460.18060.11870.1187
Event 20.10390.10670.22310.08940.08940.08940.08220.08940.12490.18030.1803
Event 30.21810.04540.07760.11180.11180.11180.06720.08050.20150.19780.1978
Event 40.24990.05990.15430.11830.11830.11830.12330.04410.12540.12470.1247
Table 8. Results of utilization of variation under four types of events.
U   ( T 0 ) U   ( T 1 ) U   ( T 2 ) U   ( T 3 ) U   ( T 4 ) U   ( T 5 ) U   ( T 6 ) U   ( T 8 ) U   ( T 9 )
Event 10.10850.06810.09080.06810.02630.07460.18060.11870.3263
Event 20.10390.10670.08940.10670.08220.08940.12490.18030.2231
Event 30.21810.04540.11180.04540.06720.08050.20150.19780.0776
Event 40.24990.05990.11830.05990.12330.04410.12540.12470.1543
Table 9. Average system execution time by events.
Event 1Event 2Event 3Event 4
Average system implementation time/day21.83624.13731.49735.848
Table 10. Conclusions from the analysis of the four events.
EventEvolutionary LeapComplexity LevelKey NodeEvolutionary EfficiencyExecution Time
Event 1Netizens’ emotional dissemination is more pronounced; incidents are resolved, and rumors are clarified quicklyRapid escalation of the incident, timely media release, effective government intervention, timely control of public opinion, and calming of the incidentAddress the aftermath (arising from an accident)Fast turnaround rate from rumor-mongering to escalation, efficient emergency response, and public distractionPublic opinion has the shortest execution time and is effectively identified and handled
Event 2The incident caused continuous public concern and emotional reaction, and public opinion was effectively managed until the issue was entirely resolvedSlow escalation of incidents and continuing problemsAddressing critical incidents per seRemainders of long-lasting public concern; efficient in clarifying rumors and resolving issuesThe incident triggering the formation of public opinion is relatively short; however, it is not fully resolved, and therefore, public opinion continues to be of concern
Event 3The impact of rumors and hot topics was not evident, but the incident was ultimately addressed and resolved effectivelyFrequent sensitive incidents, slow development of public opinion, and eventual effective resolutionControlling the fermentation of public opinionAverage efficiency in emergency response and public distractionThe slow pace of development, reasonably controlled timing, evidence of adequate public opinion management
Event 4Sensitive incidents continue to receive attention but lack sufficient measures to address themIncidents continue to receive attention, and public opinion continues to develop slowlyControl of sensitive incidentsSlow and balancedSlow onset and evolution, long duration
Disclaimer/Publisher’s Note: The statements, opinions and data contained in all publications are solely those of the individual author(s) and contributor(s) and not of MDPI and/or the editor(s). MDPI and/or the editor(s) disclaim responsibility for any injury to people or property resulting from any ideas, methods, instructions or products referred to in the content.