Abstract
Socio-technical systems (STSs) are systems of systems, synthesising human and IT components that jointly operate to achieve specific goals. Such systems are overly complex but, if designed optimally, they can significantly improve STS performance. Critical phases in STS design are defining the functional requirements for automated or software-supported human activities and addressing social and human interaction issues. To define automation support for human operations, STS designers need to ensure that specifications will satisfy not only the non-functional requirements (NFR) of the system but also of its human actors such as human reliability/workload. However, such human factors aspects are not addressed sufficiently with traditional STS design approaches, which could lead to STS failure or rejection. This paper proposes a new STS design method that addresses this problem and introduces a novel type of requirements, namely, Task Support Requirements (TSR) that assists in specifying the functionality that IT systems should have to support human agents in undertaking their tasks by addressing human limitations. The proposed method synthesises a requirements/software engineering approach to STS design with functional allocation and an HCI perspective, which facilitates the application of human factors knowledge in conceptual models and evaluation through VR simulation. A case study methodology is employed in this work that allows in-depth, multi-faceted explorations of the complex issues that characterise STSs. Two case studies are presented in this work; the first is a detailed illustration of how the method is applied during the design of an in-vehicle information system to enhance drivers’ situation awareness. The second is an empirical evaluation of the method using participants that apply it to design a mobile application to minimise the risk of pedestrian travellers conceiving a contagious disease while commuting in public space. The results from the empirical evaluation showed that the method positively contributes to STS design by addressing human factors issues effectively.
1. Introduction
Socio-technical systems (STSs), such as organisations, industrial facilities, transportation systems etc., are systems composed of sub-systems that exhibit technical and social complexity and, hence, are more difficult to specify than software or hardware systems alone [1,2]. Sub-systems in STSs have complex interactions, and changes in one lead to intended or unintended effects in others. Due to this, the identification of suitable specifications for STS is far from easy [3,4]. Capturing requirements constitutes a central activity in STS design and implementation. Failing to thoroughly capture and validate requirements is a key reason for system failure [5,6]. During the capture of requirements, designers need to decide on the most suitable level of automation, also referred to as functional allocation (FA). During this activity, technology should be viewed as a tool to assist humans to meet their goals, rather than implemented because of assumed efficiency or cost-savings [7]. Functional allocation and other human factors issues, which refer to the technological, environmental and organisational aspects that influence human performance, are rarely modelled and linked to requirements in STS design [8]. The need to address human factors in STSs has been highlighted in domains such as healthcare [9], transportation [10,11], the military [12], city design [13], policy design [14], and business [15], with [16] emphasising that designers should consider human psychology, throughout the STS design. Methods that address STS requirements focus on work processes [17] and apply formal modelling such as REASSURE [18], which may utilise input from experts, although they do not explicitly address human factors.
Practitioners in STS design [16,19,20] have requested methods that are not just descriptive but explanatory or predictive in nature and with the ability to test the integrated human activity and task-support through computer-based models and simulations, such as system dynamics [21,22], agent-based modelling, or digital twins in virtual settings [23]. These techniques, however, have not been used effectively for designing STSs with human factors in mind. New simulation approaches are required to link the top-level aspects of systems with low-level specifications that support human factors concerns [21]. Evidence from the application of two popular deign methods used by human factors experts [24], the cognitive work analysis and its successor, the cognitive work analysis design toolkit [7], highlight that software tools, simulations, and computer-based modelling are needed for evaluating the effects of different designs. In this paper, we address this limitation through the application of VR (virtual reality) simulation while also introducing a new requirement to bridge the gap between the human and technical facets of STSs. We define these as Task Support Requirements (TSRs) to explicitly describe how technology can support human activity (tasks) and performance while addressing human cognitive limitations. TSRs aim to also provide a ‘lingua franca’ for software engineers and HF experts to discuss requirements that relate to functional allocation and other HF issues.
The proposed method utilises virtual prototyping based on [25] and it is related to simulation-based requirements validation methods [26,27,28], which utilise Bayesian networks and evolutionary computing to validate non-functional requirements (NFR) and optimise requirements specifications in complex STSs. Alternative methods such as physical prototyping could be used to test TSRs, but they are expensive to implement, whereas simulated environments can reduce validation costs, especially for complex systems [29,30].
The contribution of this paper is a new STS method that incorporates TSRs as a representation to bridge the gap between what people do (tasks) and what the computer will provide (functional requirements) through the shared user interface, to support the human tasks. The method combines existing requirements engineering notations (i*, goal trees from goal-oriented requirements engineering -GORE, and design rationale) through a framework for considering design alternatives that are influenced by human limitations. The problem addressed is the lack of methods that explicitly consider human factors when specifying requirements to support human limitations. Unlike other STS approaches such as [19,31,32,33,34,35,36] that are based on conceptual models or address functional allocation in a limited manner, the proposed method aims to optimise human activity while validating solutions experimentally by virtual prototyping.
The proposed method is evaluated using case study methodology in two phases. The first phase provides a detailed application of the method during the early stages of designing a smart in-vehicle information system (IVIS). The second phase provides an empirical evaluation with expert and novice designers in the specification of a road planning application to enhance pedestrian safety. The research questions addressed are as follows:
- (1)
- Does the introduction of TSRs and the STS design method improve quality of the system design?
- (2)
- Does the proposed methodology produce designs that are useful?
The paper is organised as follows. First, we review the literature on STS design, requirements analysis approaches, and human factors issues: situation awareness (SA), workload, and functional allocation. Next, we define TSRs and the proposed methodology that utilises TSRs. A detailed case study is presented showing an application of the method during the design and validation of an in-vehicle information system. Next, the empirical evaluation of the method is presented using a different case study (risks from contagious diseases during pedestrians commuting). The paper concludes with the lessons learned, a discussion of the implications of this method, and the findings.
2. Related Work
The digitisation of organisations has shown a low success rate due to lack of attention on human and organisational issues [37]. This led to STS approaches that aim to consider both the technical and social components and design the social and technical systems in a way that could maximised throughput and quality while satisfying human needs [38]. This goal, however, is not easily attained.
Methods for STS design attempt to elicit user needs either through understanding the problem or designing an optimum solution given the properties of constituent system parts [38,39]. Two of the earliest STS design methods, ETHICS [40,41] and QUICKethics [42], claim to give the same attention to the needs of the people involved as to the demands of the technology; however, they have been criticised for being slow and costly, with the involvement of unskilled users in the design process [43] and the lack of tool support [44]. Hickey et al. [45] tried to integrate ETHICS with agile approaches such as Extreme Programming, Dynamic Systems Development Method, and Scrum [46], which incorporate user involvement to address user needs; however, agile approaches are mostly concerned with end-user requirements with no reference to human factors that inherently affect user performance. Soft Systems Methodology [47,48] takes into account stakeholders’ differing viewpoints to solve a defined problem, but also ignores human factors. Cognitive Work Analysis (CWA) [36,49] aims to predict what a STS could do, and refers to actors’ cognitive skills but not their cognitive limitations. Also, the ability of CWA to directly inform design has been questioned. This led to an extension, the Cognitive Work Analysis Design Toolkit (CWA-DT) [22]. This extension however lacks quantitative evaluation of designs and mainly relies on subjective input. Cognitive systems engineering [34,35] deals with the analysis of organisational issues based on human factors; however, it lacks the technical systems design dimension. Human-centred design [50] is based on understandings users’ needs and requirements and explicitly refers to social and cultural factors, including working practices and organisational structure, by applying human factors/ergonomics and usability knowledge and techniques. The main criticism of this method is that the analysis tends to view human activities as a static sequential process [51]. The System-Scenarios-Tool is a user-centred methodology for designing or re-designing work systems that uses human and machine properties. Its main limitation is that is largely a conceptual method without tool support for modelling and simulation [4]. Other systems engineering methods for STS design include adaptive socio-technical systems [31], which uses a requirements-driven approach to self-reconfigurable designs using Tropos goal modelling; and the Functional Resonance Analysis Method (FRAM) [19], which is based on resilience engineering and analyses possible emergent behaviour in complex systems.
An important limitation in the above methods is the lack of simulation capability for quantitative evaluation of “to-be” designs. Simulating STS prototypes prior to implementation can reduce risks by identifying design problems early. Despite this need, the two broad categories of methods for STS prototyping, as identified by [37], are the graphical and textual methods. The former use conceptual models and the latter use written scenarios. However, empirical evidence on the effectiveness and efficiency by which these methods support STS design processes is rare. A study by [37] addressed the differences of the two categories in terms of which one helps participants create a more accurate mental model of a “to-be” STS, and concluded that the graphical methods require less cognitive effort.
Overall, STS design methods use evaluation tools based on static or simplified conceptual models or mock-ups that do not explicitly take into consideration how human factors should be addressed during the functional specification of interactive software. However, the majority of human factors analyses investigate the human factors alone and not how they can be used to specify solutions to support people working practices [52,53,54]. These shortcomings highlight the need to improve STS to address the complexity of human–system interaction [26] and to optimise the level of automation (functional allocation) [55,56,57] that could exist in any of the eight different levels defined in [58]. When allocating tasks between the human operators and the automated system, inefficient automation design often arises from a lack of consideration of the role and limitations of human operators and of their interaction with the automated system [59]. Early FA methods such as the Fitts heuristics [7] aid the allocation of functions between human operators and machines, by defining tasks that machines tend to perform “better” than humans and those that humans perform “better” than machines. Fitts suggested that machines perform better routine tasks that require high speed, force, and computational power, while humans undertake tasks that require judgment and creativity. They also acknowledge the limitations of humans in correctly employing these capabilities when overloaded with excessive task demands or maintaining alertness due to fatigue. Fitts’ MABA (machines are best as) list, despite its age, has persisted throughout the history of functional allocation [60]. FA options, however, require validation prior to being implemented and this is currently lacking in STS design methods.
One strategy is to increase automation and design out human error; however, this comes with its own penalty of impoverished situation awareness (SA), the ability of a human agent to know what is happening around him/her. This, in turn, leads to subsequent errors from leaving the human agent out of the loop [54]. The use of software in safety-critical areas such as intelligent transport systems has increased significantly, so software failures can impair system safety [61]. This highlights the need for better allocation of functionality between human and technology and optimum specification of functionality (software) to be automated. Results from the analysis of accident causality indicate that more rigour is needed in analysing HF requirements in safety-related systems [62]. Inadequate or misunderstood requirements [63] relating to HF is a major cause of accidents [62]. Methods for partitioning functions among automation, human-only operation, and cooperative human–computer functions have been proposed in Human–Computer Interaction [64] and need to be addressed explicitly and strategically at an early stage of STS design to maximise chances of success [8].
We argue that requirements analysis should incorporate FA to specify software requirements to support human tasks, capabilities, and skills. Previous work such as task descriptions [65] define what user and system must do together [66] using problem space analysis to identify requirements [67]. Work on the integration of goal-oriented and problem-oriented requirements engineering addresses a wider scope of the to-be system [68]; however, they fail to address the human factors part that need to be supported to minimise STS failure.
Human factors concerns have been partially addressed in i* modelling [32] through skills and human agent capabilities and goals–skills matching [33]. However, i* does not address mapping human activities and capabilities to system requirements that support human action and cognition (SA, workload, etc.). Past NFR frameworks [69] with Softgoal Interdependency Graphs [69] using the i* notation [32] have addressed issues such as reliability/performance; however, criteria for their satisfaction are judged without reference to human factors.
In [70], the authors use Quantified Softgoal Interdependency Graphs (QSIGs) to assess the degree of soft goal satisfaction. However, the assessment is based on subjective estimates of the degree of interdependencies among soft goals. Virtual prototypes [52,71,72] have provided designers with multiple viewpoints of the system’s functionality that assists in requirements validation, e.g., the Immersive Scenario-based Requirements Engineering method [25]. In the automotive industry, VR (virtual reality) is used to test the safety of a vehicle while minimising design costs [73]. The advantages of VR and simulation, however, have not been fully leveraged for STS design due to the complexities of such systems. Recently, the concept of digital twins, which is a virtual representation of a real-world system, is adopting STS theory to address the social aspects of systems [74]. However, digital twins has not been investigated in designs for first-of-a-kind systems (i.e., those that do not currently exist).
Based on the above review of the literature, it is evident that there is a need for STS design methods that could provide the means for quantitative validation of future designs, and jointly address FA and HF during design to support humans in undertaking their tasks (TSR) through an optimum level of automation. The method proposed in this work is aligned with this need.
3. TSR Definition
Task Support Requirements (TSRs) are requirements for software that interacts with people and directly supports their tasks or jobs. Tasks in HCI (and HF) are actions and procedures linked to goals in a hierarchy. In goal-oriented requirements, engineering (GORE) goals are also modelled in a hierarchy, although Requirements Engineering tends to focus on what the design should do (functional requirements), whereas HCI/HF describes what people do. TSRs are, therefore, a sub-class of Functional Requirements (FRs) and directly support users, similar to problem-oriented specification in [67], and, hence, exclude fully automated functions and embedded systems. TSRs specify the interface between the user and the system (UI), which can vary from simple information displays to complex simulations. For example, in a tourist information system, the UI could display a simple map of nearby locations of interest, or an interactive map through which the user can request more details via a touch screen informed by a recommender engine. TSRs also describe the human performance and qualities that should be satisfied for the system to operate effectively. Associated NFRs may specify properties of operation such as safety and privacy or the desired level of human–system reliability. These can be refined into measures such as the maximal acceptable error rate, learning times, usability problems, etc. TSRs, therefore, involve the specification of (1) software support for the human operator, (2) the user interface that delivers system support, and (3) human factors criteria that affect system performance.
4. Proposed STS Design Method
The method proposed in this paper is a combination of goal modelling [75], TSR specification, functional allocation [55,56], design rationale [76], and virtual prototyping [25,77]. It is similar to [78], which utilises objectives, design specification, and evaluation through a design rationale framework, and [79], which uses goal hierarchy to derive function allocation for the design of an adaptive automation system. However, in contrast to these methods, we propose the use of VR simulation, when appropriate, to evaluate prototype designs that emerge from the proposed approach. The simulated VR environment is suitable for highly dynamic scenarios (e.g., traffic situations) where prototypes are difficult to create and analyse using traditional techniques such as Wizard of Oz, paper-based sketches, and mock-ups.
An initial version of methodology was based on the existing literature and the authors’ experience in STS design.
A process model of the methodology is presented in Figure 1 that initiates with the problem decomposition, followed by functional allocation and TSR specification at different levels of granularity. Phase 1 answers the question, “what is the problem, and which human tasks should be supported through technology”; phase 2, “what is the optimum specification of the STS to support these tasks”; and phase 3, “does the proposed STS provide sufficient task support to solve the problem?”.
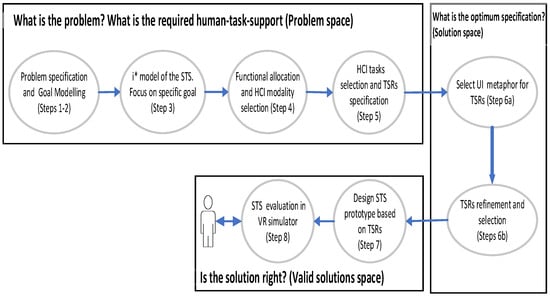
Figure 1.
Overview of proposed method initiating with problem analysis (human factors perspective), how the problem can be addressed through a TSR specification, and if the proposed solution is satisfactory.
Central to our method is the notion of functional allocation (FA) that addresses the distribution of functions to human (manual task), computer (full automation), or human–computer cooperation. Different frameworks have been proposed for the distribution of functions between human and automation [80,81,82,83,84,85]. Common to all these models is the assumption that automation constitutes a continuum from no support to full automation of all functions. Adverse effects of inappropriate functional allocation may become apparent when the human operator is taken out of the active decision-making loop, leading to a loss of situation awareness and the inability to respond to unexpected events.
At a lower level of granularity, the method is decomposed in the following steps:
- Analysis of the problem domain and the main human factors issues that need to be considered during STS design.
- Decomposition of the problem into sub-problems until goals become apparent and can be realised through technology. This goal hierarchy analysis is performed using the GORE method [68]. Goals are statements of the intentions and desired outcomes of a system that have different levels of abstraction. During this step, goals are refined into sub-goals up until the human factors issues become apparent.
- i* modelling focusing on a sub-problem from the goal hierarchy of step 2. The key human factors that need to be satisfied are specified as NFR (soft goals) realised through functional requirements. The i* framework is a goal-oriented requirement engineering technique that models relationships between different actors in the STS and is used in the early phase of system modelling [32]. Soft goals in i* are satisfied when their sub-goals are satisfied. Tasks refer to activities performed by human or machine agents in the STS. The i*diagram elaborates on the tasks, goals, soft goals, and resources required for the selected sub-problem.
- Functional allocation (FA) analysis of the selected goal from the i* diagram, to identify the best automation scheme. The selected FA scheme is refined into different human–machine interaction options. Different human factors evaluation criteria are used (i.e., situation awareness, reliability) to analyse the effect of each HCI modality on human performance. To visualise the influence of each evaluation criterion, we chose the Questions, Options, and Criteria (QOC) notation [76], since it is expressive and deals directly with evaluation of system features [86]. Questions in QOC represent key issues (goals in i*), “Options” are alternative functional allocation solutions/modality responding to a question, while “Criteria” represent the desirable properties of the system that it must satisfy, for instance, cost of development, safety, or human factors criteria. The output from this step is the best functional allocation scheme.
- This step focuses on the decomposition of selected functional allocation option into low-level tasks that need to be performed either by IT or human to satisfy the goal associated with it in i*. These tasks are either not fully manual or cannot be fully automated (and, thus, are HCI tasks). For these tasks, users’ information needs are identified and the information requirements (TSRs) of the technology that will support the human in performing the tasks without failing are specified.
- This step uses design space exploration and design rationale to identify optimum designs based on the information requirements specified in the previous step.
- 6a
- Design space exploration is used to identify candidate user interface (UI) metaphors (representing familiar analogies e.g., radar analogy). Design rationale is used to explain the reasons behind the design decisions made. The QOC approach is used, with options being alternative design solutions, criteria represent the desirable properties (NFR/Softgoals) of the technology and the requirements that it must satisfy. The links between options and criteria make trade-offs explicit and turn the focus on to the purpose of the design.
- 6b
- The TSRs identified at step 5 are refined into low level TSRs. Design rationale is used to select TSRs to be used for VR prototyping (next step), based on how well they can satisfy a set of non-functional requirements (criteria).
- VR prototypes of each candidate are implemented design using TSRs’ specification from step 6. Scenarios to be used during the experimental evaluation of the to-be STS in the VR simulation, are defined and implemented. NFR criteria and metrics that will be used to evaluate the design are specified. A description of the simulator (used in the smart in-vehicle information system case study) and its validation prior to conducting experiments with participants is presented in Appendix C.
- Experiments are conducted with participants using the VR prototypes. human NFR (e.g., situation awareness) is assessed explicitly during the experiments using different metrics (e.g., electroencephalography-EEG, Eye tracking’s Eye fixations, Heart Rate, Respiration etc). If the performance of the design is not satisfactory (evaluation criteria not satisfied), the TSRs are refined, and the process is repeated.
5. Detailed Application of the Proposed Method
A case study illustrates an application of the STS design method in the context of smart in-vehicle information systems. The aim is the design of an STS to support drivers’ situation awareness (problem). The process starts with the specification of drivers’ information needs in terms of goals. It identifies the optimum distribution of tasks between the driver and potential software technology (functional allocation) to address these needs, refines the selected FA option into TSRs, and validates the TSRs through VR simulation.
- Step 1.
- Problem specification: Driver safety and support systems
The design of In-Vehicle Information Systems (IVIS) and Advanced Driver Assistance Systems (ADAS) to assist drivers with the complex demands associated with the driving task [87] has explored technologies such as lane departure warning, lane departure prevention, active lane keeping, front crash prevention, blind spot monitoring, rear-cross traffic alert, and driver monitoring systems [88]. Automotive design guidelines describe desirable practices that are not mandatory and, hence, are less strict than standards [89].
In traffic safety, situation awareness (SA) and workload constitute critical safety factors as associated non-functional requirements. Situation awareness enables the driver to anticipate events under the perceived driving and environmental conditions [90], and is defined as the process of perceiving information (level 1) from the environment, comprehending its meaning (level 2), and projecting it into the future (level 3). This is linked to the three-level model of driving (operational/tactical/strategic) [91], referring to actions for stable control, manoeuvring, and route planning. Work by [92,93] stresses that operational driving tasks such as steering and braking responses primarily require level 1 situation awareness support, although level 2 situation awareness may also be involved [92]. For IVIS to improve drivers’ situation awareness, it is essential to enhance their ability to perceive and interpret traffic and environmental information (situation awareness levels 1 and 2) to support the tactical and operational tasks of driving.
Notifications can assist drivers’ tasks and changes in their environment [94]; however, the design of effective notifications is challenging [95] since notifications can also be distractors. In the same vein, workload is linked to situation awareness and refers to the limited cognitive resources of humans and how this can affect human reliability. So, if a hazardous situation emerges when the driver is overloaded, the risk of committing an error is increased.
- Step 2.
- Goal modelling and high-level TSR specification
Goals in this model refer to the three-level model of driving tasks: strategic, tactical, and operational [91]. The first is associated with strategic driver decisions and tasks that relate to the selection of the best route to arrive at the destination. The criterion here could be travel time, scenery, etc. At the tactical level, goals are associated with actions of the driver that relate to the desired manoeuvres to achieve short-term objectives such as overtaking. At the operational level are goals relating to manoeuvres to control the basic operations of driving such as acceleration, deceleration (speed control), and lateral deviations (direction control). Figure 2 depicts the goal hierarchy graph.
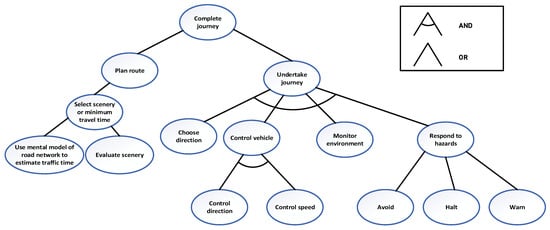
Figure 2.
Goal hierarchy for driving tasks associated with the problem of completing a journey safely.
During this step, goals are decomposed to a level where assumptions about automation become apparent, such as “control vehicle” in contrast to a non-automated solution such as walking. At this stage, TSRs become apparent for achieving lower-level goals. For “control direction” and “speed”, task support is delivered by standardised controls of steering wheels, brake and accelerator pedals, although further decomposition and definition of TSR is possible; for instance, in cruise control for “control speed”. In the case of cruise control, the user interface implications are refined into status displays and controls to set/disengage cruise control mode.
- Step 3.
- STS modelling using i*.
The i* model of Figure 3 provides the link between the goals in Figure 2 and the soft goals (NFRs) that need to be satisfied by functional requirements for the system to be successful. The focus in this step is “Monitor environment” and “Respond to hazards” sub-goals (Figure 2). Monitor environment depends on the soft goals “Maintain safety” and “Maintain situation awareness” in Figure 3. The “Respond to hazards” goal also depends on the NFR “Maintain situation awareness” and is decomposed into the tactical, operational tasks of, halt, avoid, and warn (pedestrian risks and other road users). These tasks can be supported by technology/functionality (depending on desired level of automation explored in subsequent steps), which, in return, will satisfying the associated NFRs/soft goals “Maintain situation awareness” and “Maintain Safety”. For instance, in the case of system warning, the specification could be refined to provide only critical information of traffic conditions to the driver with an audio warning of imminent threats that are not visible.
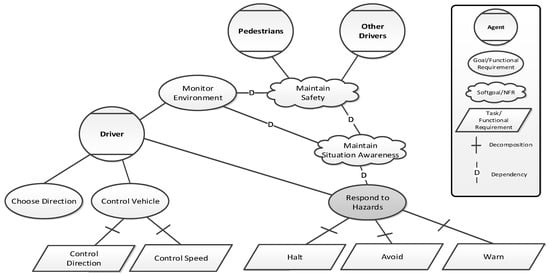
Figure 3.
The driver goals modelled in i* notation, showing agents, goals, and soft goals for NFR (e.g., safety) and human factors desiderata (situation awareness). The overlaid “D” symbol on links denotes dependence of the soft goal on another goal/soft goal/task for its realisation. In shading is the goal on which the analysis will focus.
- Step 4.
- Functional Allocation analysis for “automated warning” option and HCI modality analysis
In this case study, we illustrate the rationale for selecting the automated driver warning option through functional allocation (FA) analysis, the selection of the most appropriate HCI modality, and the refinement of this option into low-level tasks and TSRs (Table 1).
The FA approach we adopted is based on the combination of the Fitts model and the automation taxonomy framework of [83]. Parasuraman’s framework is mapped on to different stages of human information processing: (1) information acquisition, (2) information integration (comprehension), (3) decision making, and (4) response. Automation can operate at varying levels in all stages of information processing.
Figure 4 illustrates a high-level functional allocation analysis for the “respond to hazards” goal as a design rationale diagram where the goal corresponds to the question asked. The figure illustrates two functional allocation options: “manual” and “automated hazard recognition and response”, with the former being rejected as it provides no support for SA. The automated option is decomposed into three more detailed options: (1) complete automation for recognition and hazard avoidance, which would require considerable AI processing and is currently being developed in driverless vehicle technology; (2) automated halting, which relies on AI; and (3) automated warning of the driver with speech/audio or visual display, which does not depend on AI technology.
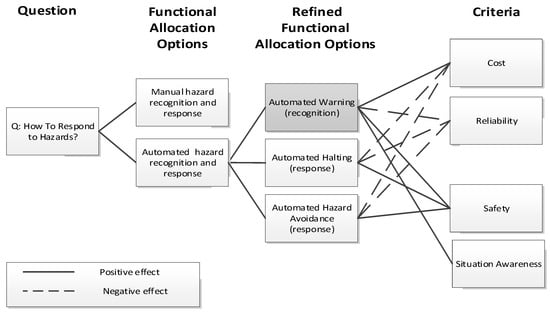
Figure 4.
High level FA analysis using QOC notation for the “respond to hazards” goal in the i* model. Solid lines indicate positive contribution to the criterion. In shading is the best FA option.
The AI option of automated halting and avoidance would be the most expensive; however, all options depend on some automated processing to detect dynamic hazards, i.e., other vehicles and pedestrians. If the automated halt/avoid technology works reliably, it would be the safest option, but reliability and security doubts [96] reduce this advantage [97]. Warning the driver of hazards contributes to safety and situation awareness with a lower cost and better reliability. This option is selected as it represented the best criteria (NFR) trade-off. The warning option is then decomposed further to investigate different HCI modalities and audio/speech/visual warnings options as depicted in Figure 5. The speech option may encounter reliability difficulties in giving precise instructions and the location of the hazard within the microsecond time scale. Furthermore, the driver may not have the necessary mental map of the situation to execute immediate response, so situation awareness is not supported. The same applies for audio messages such as beeping from different orientations within the vehicle. The option “Visual warning” does support situation awareness and should encourage the driver to maintain a mental map and awareness of the road situation and potential hazards. Therefore, a “Visual situation display” option that provides support for situation awareness is chosen as the best solution.

Figure 5.
HCI modality analysis of the “Automated warnings” task from Figure 4 for the identification of the best modality option (shaded).
- Step 5.
- Decomposition of the automated warning via “Visual situation display” into low level tasks that need to be performed to maintain adequate situation awareness.
The selected visual warning option is refined into low-level tasks showing key activities the driver needs to perform to maintain sufficient level of situation awareness (see Figure 6). This analysis depends on domain knowledge, in-vehicle systems design literature, and driver information needs [98]. The functional allocation decisions (Table 1) for each task need to specify which of these tasks should be supported by the visual situation display and what level of automation is appropriate for each task. Table 1 illustrates summary of the trade-off issues and the resulting high-level specification of TSRs.
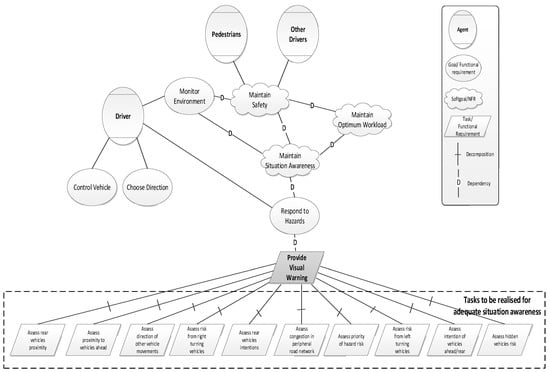
Figure 6.
i* goal hierarchy and decomposition of “Respond to hazards” goal into the sub-task “Provide visual warning” from the initial functional allocation step, and specification of the tasks that needs to be realised by the human or technology to satisfy the “Maintain Situation Awareness” NFR.
- Step 6.
- Functional allocation analysis for the sub-tasks of the “Provide visual warnings” task and specification of functional requirements to support these tasks.
Functional allocation analysis of tasks in Figure 6 is performed in tabular notation as shown in Table 1. This is used as an alternative to QOC diagrams when the number of options and criteria combinations is large. The evaluation of each activity in terms of reliability and automation capability is assessed on the scale of high, medium, low (H/M/L). High indicates that technology is judged to provide superior results to human operation, hence full automation of the activity is possible with current technologies. Low indicates that people are better at performing this activity than the available technology and this task should be allocated to the human.
Tasks that are suitable for human–machine collaboration are specified in terms of task support requirements (TSRs) for interactive user interfaces, while the human-only tasks become manual operating procedures. The TSRs specified in Table 1 (rightmost column) refer to the visual situation display option that is based on the automated warnings and visual HCI modality selected in previous steps. TSRs are further analysed in the following design rationale step (Step 6a), where the design specification of candidate options becomes more apparent (Step 6b). In a similar manner, the “maintain optimal workload” goal can be refined into its TSR and analysed for functional allocation options.
Steps 6a and 6b address TSRs specification using domain specific reasoning and trade-offs exploration. These describe the transition from the general method aimed at specification into the design phase where domain specific reasoning and trade-offs are explored. This detail is given in Appendix B, which reports further design rationale analysis that produces two preferred options (Radar/Arrows), which are then subject to validation studies using virtual prototyping in the final stage (steps 7 and 8, presented next).

Table 1.
Functional allocation analysis for the sub-tasks of the task “Provide visual warning” of Figure 6. The last column shows TSR specification of information that the new design needs to provide to the driver through the “Visual situation display”.
Table 1.
Functional allocation analysis for the sub-tasks of the task “Provide visual warning” of Figure 6. The last column shows TSR specification of information that the new design needs to provide to the driver through the “Visual situation display”.
| Driver Tasks for Adequate Situation Awareness | Capability of Automation to Implement Requirement (H/M/L) | Reliability of Automation in Realising the Requirement (H/M/L) | Functional Allocation (HUMAN/COMPUTER/HCI) | TSRs: Information Requirements Specification for Situation Awareness Support Using Automated Warnings (Visual Situation Display) |
|---|---|---|---|---|
| Assess proximity to vehicles ahead, in relation to host vehicle | H | H | HCI: visualise information for human to decide | Information on threat risks in different colours |
| Assess proximity to rear vehicles, in relation to host vehicle | H | H | HCI: visualise information for human to decide | Information on tailgating vehicle risk i |
| Assess direction of other vehicle movements | H | M | HCI: visualise information for human to decide | Information on risk level of peripheral vehicles |
| Assess risks from right-turning vehicles at unsignalled intersections (right-hand rule) | M | L | HCI: visualise information for human to decide | Information on right-turning vehicles risk |
| Assess risks from left-turning vehicles at unsignalled intersections (left-hand rule) | M | L | HCI: visualise information for human to decide | Information on left-turning vehicles risk |
| Assess following vehicles risk (blind spot, tailgating) | H | H | HCI: visualise information for human to decide | Information on blind-spot risk |
| Assess congestion information on peripheral roads | M | M | HCI: visualise information for human to decide | Information on peripheral road network traffic |
| Assess priority of hazards | M | M | HCI: visualise information for human to decide | Prioritise hazard risk information |
| Assess intention of other vehicles behind and ahead of host vehicle | L | L | Human task | None |
| Assess risks of hidden vehicles at intersections | H | M | HCI: visualise information for human to decide | Information on hidden vehicles risk information |
- Step 7.
- Implementation of virtual prototypes of the Radar and Arrows designs based on selected TSRs and specification of NFR metrics and VR scenarios.
Virtual prototyping is used to determine which of the two candidate designs will be optimal under a range of operational conditions. An experiment was conducted with participants using a VR driving simulator that incorporated the candidate designs of Arrows and Radar (see Figure A2—Appendix B). Designs are evaluated against situation awareness and workload NFRs.
The VR simulator is customised to create a replica of the environment and hazard scenarios that drivers are likely to experience, to simulate increased workload and stress their situation awareness. Three steps are followed during VR customisation: (1) development of the test traffic environment in terms of buildings, infrastructure, and traffic flow; (2) modelling the scenarios in terms of traffic flow and hazards; and (3) modelling the candidate designs through head-up display (HUD) technology. The HUD designs were specified from the requirements refinement process and the design rationale steps in Appendix B, producing the virtual prototypes (Figure A2).
Virtual prototyping may require input from HF experts; however, domain analysis should provide scenarios, and the design rationale trade off criteria become measures in the experiment. During the experiment, driving behaviours were monitored and logged into the simulator’s database. The logged observations from the simulation were analysed to represent performance data (i.e., driver errors, potential accidents, perception of hazard-critical information) to select the design that best satisfies the NFR criteria. If the minimum level of the NFR criteria is not satisfied, then the virtual prototype needs to be redesigned and the process repeated until the NFR is satisfied.
To be confident that the design supported situation awareness, the situation awareness score was set at ≥60%, indicating that the driver should be able to perceive six out of 10 separate critical information cues, which represents the minimum level of situation awareness required to maintain safe driving and is a quantitative estimate of the driver’s awareness of vehicle(s) in the blind spot; vehicle(s) ahead, behind, and to the side of the host vehicle; pedestrians on the road; obstacles; own speed limit; parked cars; congestion; position in the road lane; and distance from vehicle(s) ahead and behind. This threshold is based on Miller’s [99] seven plus/minus two model and the useful field of view test, indicating the minimum information an individual can extract from a dynamic environment [100] along with general driver visual information processing capacity [101,102,103]. Workload NFR satisfiability was measured through an optimal rage of electroencephalography (EEG) scores in the range of 45–70 out of 100, indicating the optimum level of workload under which the driver remains vigilant but not bored.
- Step 8.
- Simulation-based validation of TSR based on selected NFR evaluation metrics.
Seventeen participants from the local population, with a valid driver’s licence and 20/20 vision or corrective glasses or lenses, took part in the experiment. Subjects selected had at least seven years’ driving experience and were under 55 years old. Prior to the experiment, they were screened for colour blindness or susceptibility to simulator sickness. They were introduced to the various simulator controls, made adjustments to the seat, and were given a five-minute training session. In the before stage, subjects had to complete the Manchester Driving Style questionnaire [53] to identify their driving style along with their demographic information (the average age was 37.1 years and the gender distribution was 55% female and 45% male).
During the experiment, drivers were expected to drive along a pre-specified path in the virtual environment. The driving controls include a real steering wheel, brake and accelerator pedals, and a simulated automatic gearbox. Driver behaviour data were recorded and include the following: lane deviations, headway (distance or duration between vehicles), speed, acceleration, EEG, and deceleration. In total, 8460 datapoints were collected from each participant and each of the variables. The situation awareness assessment was conducted using the SAGAT technique (Situation Awareness Global Assessment Technique) [90], by freezing the simulator at different points during the experiment and asking the participants to answer a number of questions that referred to the driving situation. Questionnaire responses from this process were analysed and assessed on a 0–100 score by comparing the actual situation with what the participants reported in their results.
The results from the experiment (Table 2) showed that both designs were significantly better than the control condition (no use of visual situation display). The required levels of the NFR criteria for both designs were satisfied, with drivers’ situation awareness level being, on average, 60% in all road sections. The two-way ANOVA repeated measure analysis that was carried out on the aggregated SAGAT score and the other dependent variables (speed, EEG, and headway) for three data collection points that coincided with hazardous events, and three design conditions (radar, arrows, and control), identified a significant main effect for design on situation awareness (F(2,15) = 10.90, p < 0.01). The radar design (mean 74.3) was superior to arrows (71.72) and the control condition (51.15). Both the arrows and radar designs were significantly better than the control (post hoc tests, p < 0.001) which verifies that the designs as specified by TSR satisfy the NFR “Maintain situation awareness” and the “Respond to hazards” goal in i* model of Figure 6. Thus, the design process ends. This illustrates that the designs that emerged from the proposed method contribute positively to situation awareness and driving behaviour while minimising accident risks.
Table 2.
Quantitative data comparison of the candidate designs. Bold numbers denote designs that were superior to the control.
6. Empirical Evaluation of the Proposed Method
A summative, qualitative evaluation of the method was conducted, focusing on the first six steps of the proposed method and aimed to evaluate the usefulness and correctness of TSR specifications that emerge. During the experiment, participants designed a hypothetical STS. The evaluation focused on the first six steps of the method since the creation of VR prototypes for each design would require VR prototyping expertise. During the experiments, 19 participants were recruited, including nine experts from the domains of information systems, intelligent transportation systems, and computer science, who had been working as professional systems analysts/consultants for more than seven years, five postgraduate students that recently completed a postgraduate course in e-business systems design, and five novice participants with a computer science background. The average age was 35 years, and the gender distribution was 63.2% male.
The criteria utilised to evaluate the method are based on [7] and cover aspects pertaining to the method’s generalisability, learnability, effectiveness, usability, and support for human factors in the design.
A workshop was prepared in a domain that all participants were familiar with, minimising the risks from contagious diseases (e.g., the COVID-19 pandemic). Expert and novice subjects applied the method to design a new mobile application to assist travellers and minimise their risk of conceiving a contagious disease (COVID-19) while commuting in public spaces, by undertaking the activities in Table 3 and answering the questions in Appendix A. The evaluation was carried out in two phases; the first included a 3 h session with students and novice subjects, while the second phase involved 90 min individual sessions with experts. Subjects were initially trained on the methodology using the driver situation awareness example, and were then asked to apply it to the COVID-19 scenario. The goal was to specify the most appropriate functional allocation and specification of TSRs that could address one aspect of the COVID-19 problem, such as contact tracing/symptoms checking. Upon completing the exercise, expert participants were asked to complete an online questionnaire (see Appendix A) followed by interviews by the researchers. The interview was unstructured and started with open questions to elicit experts’ opinions about the method’s advantages and limitations. All interviews were recorded. Following the exercise, novice subjects were asked to complete an online questionnaire and asked to explain how they applied the method to come up with their design/TSR. Both experts and novices submit their completed questionnaires via Google forms and their designs via email. Participants’ designs/were evaluated in terms of how well they contributed to the problem (COVID-19).
Table 3.
Performance scores of experts and novice subjects during the practical part of the evaluation.
The evaluation of results showed that experts perceived the method as easy to learn, structured, helpful in framing their thinking, and efficient in addressing HF through the specification of TSRs. Figure 7 shows the percentage of subjects assessing each evaluation question with a score above 3 in a 5-point Likert scale. These results indicate that the method can contribute positively to designing STSs and address human factors issues effectively. The practical part of the evaluation was completed by experts, with >75% of participants scoring >65% in each assigned task as shown in Table 3. The 65% threshold was selected to focus on participants with above the minimum acceptable level of performance (50%). Higher thresholds (e.g., >75% or more) were not used since they minimised the number of passing cases and constrained the knowledge to be drawn from these cases. The evaluation of each task was performed by examining the correctness of the produced outcomes with reference to the requirements of Table 3. For instance, in the first task, two example correct answers were “Find the best route to my destination with the minimum infection risk” and “Being aware of the infection risk at a given public place”. Contrary to the experts, the students and novice participants found the method more challenging, possibly because of their limited knowledge in systems design. They primarily addressed functional allocation at the high level with limited attention to human factors. In contrast, the experts addressed the human factors in more detail and their designs had a strong link with the associated NFR criterion (contextual risk awareness).
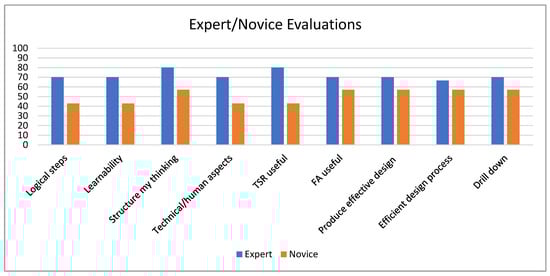
Figure 7.
Percentage of subjects with evaluation score > 3 in 5-point Likert scale questions.
Analysis of interviews with experts highlighted limitations and recommendations. Experts mentioned the need for tool support on functional allocation’s selection criteria (what criteria should be used to decide for functional allocation) and possible software support to guide the exploration of the vast space of possible solutions. Experts recommended possible improvements: the use of taxonomy or advice on potential human factors limitations in different domains, and tool support for design space exploration to assist in selecting the best UI options (i.e., modality, metaphor) from past similar systems using techniques such as analogical reasoning.
Overall, the evaluation of the method showed that it is useful in specifying requirements of STSs to support human activity and addressing human limitations.
7. Threats to Validity
With regards to internal and external validity, the research was conducted using different controls and issues with generalisability were considered. Regarding internal validity, training of novice and expert participants prior to human factors analysis provided the means to partially control for this threat. Similarly, the TSRs of the proposed designs were implemented as virtual prototypes and evaluated in controlled settings using a VR simulation environment. Hence, confounding variables have been eliminated and the true effects of the designed artifacts to situation awareness have been accurately measured.
External validity concerns the generalizability of the findings; it is dependent on the case study application and the number/variety of subjects used in the evaluation. Generalisation about the utility and usability of the method is limited by the evaluation case study and participant backgrounds. However, the method has a general applicability in STSs in which functional allocation is key. The need for human factors training, identified in the evaluation, poses some limitations on the applicability of the method, although we argue that the initial method’s steps and TSR concept has a more general application, independent of human factors knowledge. Validity limitations for the VR prototyping phase of the method were mitigated by the level of realism in the virtual environment and the immersion of participants along with increased familiarisation time with VR environment.
8. Lessons Learned
The application of the method in the IVIS case study and its evaluation by experts and novice subjects identified both strengths and weaknesses. The main weakness is the need for at least basic human factors knowledge by designers to adequately address all its steps. This is highlighted during the evaluation of the method, with novice subjects finding it difficult to specify the human factors relevant to the problem. Secondly, the method needs to provide tailored interpretations of non-functional properties that are relevant to different types of STS since, for instance, situation awareness in aviation differs from situation awareness in road transport and should, therefore, be interpreted differently. Other concerns with the method were the cost of developing the VR prototypes, the design and execution of experiments in the CAVE facility, and the analysis of the results. However, depending on the domain, the use of head-mounted VR equipment might be suitable for experimentation, while the use of rapid VR development tools such as Unity makes this process more affordable. Alternative approaches to prototyping that do not require VR technology could be used, such as paper-based (Wizard of Oz) or screen-based techniques, depending on the complexity of the domain. Overall, the method is complex and could be adapted as a combination of sub-sets of its steps and applied separately in different domains. Nevertheless, the method addresses a significant gap in the body of knowledge that relates to the importance of non-functional issues in STS design through the introduction of TSRs and their explicit specification. The method makes the connection between high-level goals that are relevant to stakeholders, with design options that embrace functional allocation and design rationale, to specify functional requirements (TSRs) that address important NFRs that relate to human factors.
9. Discussion
The FA technique employed in the method stems from the HF literature and provides guidelines for the best allocation of tasks between humans and technology according to their strengths and weaknesses (Men are better/Machines are better at—MABA/MABA) [56]. Work by [104] developed the task technology fit model to describe the optimum fit between managerial tasks and mobile IT capabilities under different environmental conditions, to improve overall task performance. Tasks are described in terms of routineness, structure, time criticality, and interdependencies; meanwhile, capabilities of mobile IT are seen in terms of functionality and user interface, and context in terms of distractions and obstacles. Their model, however, is specific to the mobile IT domain and requires further empirical research before application in other settings. Our TSR approach is based on general cognitive theories and can be used in different disciplines with minor adjustments according to the available automation capabilities.
Some FA theories argue that the a priori allocation of functions as illustrated in Fitts’ List is an oversimplification [34,105,106], claiming that capitalising on some strengths of computers does not replace a human weakness. Instead, it creates new human strengths and weaknesses that are often unanticipated [75]. Dekker and Woods [106] recommended that system developers abandon the traditional “who does what” approach of FA and move towards STSs. Despite this criticism, the Fitts model remains popular for its generalisability and descriptive adequacy [60]. Hence, in our method, we utilise the Fitts List in accordance with Parasuraman’s model for the specification of an initial functional allocation.
Several STS design methods have been developed over the past 40 years, including ETHICS, QUICKethics [40,42,107], Soft Systems Methodology [48], Cognitive Systems Engineering [34,35], and Human-Centred Design [50]. However, most of these are rarely used [20]; the main criticism is their limited capability in addressing prospective STS designs or providing evaluations, concentrating on problem analysis with existing systems rather than design solutions. An important issue in existing STS design methods is the different and sometimes conflicting value systems among stakeholders, such as improving job satisfaction and the work–life balance, while, at the same time, achieving the organisation’s economic objectives. Empathic design [108] and contextual design, e.g., [109], do consider the user’s environment as part of the development process, but their application has been limited. The STS method we proposed uses participatory techniques by involving users in the evaluation of the prospective system design. The experimental nature of the evaluation step encourages the involvement of stakeholders (drivers, in our example application).
Many STS methods have focussed on safety engineering involving diverse approaches such as, Activity Theory [110], cybernetics [34], Joint Cognitive System [34], Work Domain Analysis [111], the Functional Resonance Analysis Method [19,112], and the Framework for Slack Analysis [113]. These are either techniques to address specific problems or are descriptive in nature and focus on showing how work is currently performed. Baxter et al. [20] highlighted the inability of exiting STS methods to address prospective designs due to the difficulty of predicting the interaction among people, technology, and context in a system world that does not exist (new world problem). Our method offers a solution to this problem through the introduction of TSRs that bridge the disciplines of HF and technology design and integrates existing modelling languages from software engineering and other disciplines.
TSRs extends previous approaches to STS design [20] by providing a more detail-focused method that addresses the frontier between software design and higher-level heuristic design (human factors and goals) of STSs. Mumford’s ETHICS [107] contains general heuristics for analysing and shaping the components and human roles, within a framework of principles for human design of work practice, workplaces, and organisations; however, it does not address technology. A review [20] of STS approaches proposes a research agenda for a system engineering approach to STSs, oriented towards a high-level view of process and systems organisation. Similarly, Design X [16] provides another high-level view on STSs, emphasizing system complexity, the role of people therein, emergent properties, and the inherent complexity in STSs. In contrast, TSRs provide a lower level design focus where components of human–computer activity could be considered within a higher-level framework provided by ETHICS and related approaches [16]. Activity theory [114] can operate at a similar level of granularity as TSRs; however, it only provides a modelling framework of goals, objects, and activities, without any view on functional allocation or definition of requirements.
The closer relatives of TSRs and our method are human factors oriented methods, such as Ecological Interface Design (EiD), [36], CREAM [115], and FRAM [19], which focus on human safety engineering rather than functional allocation orientation of TSR. FRAM provides organising principles and an activity modelling approach for analysing systems functions and their interfaces; however, as Hollnagel notes, it is a framework for problem diagnosis, rather than giving more detailed advice on FA, human factors guidelines, and user interface design. Nevertheless, these methods could be used in conjunction with TSRs. For example, the graphical representation as realistic metaphors of the system and software world for control interfaces, which is proposed in EiD [36], could elaborate the user interface component of TSRs. TSR draw upon human error frameworks [53] and more general ergonomic advice [116] to inform design and specification.
Requirements engineering methods, e.g., [117], have not addressed the specification of software support for human decision making and system operation, which form the focus of TSRs. Modelling of human agents and activities is presented in requirements engineering models such as i* [118], which also support investigation of functional requirements (hard goals in i*) and NFRs (i* soft goals). However, i* modleling does not advise on design of user interface components or functional allocation. Modelling of requirements for adaptive systems [31] provides detailed agent–activity–goal models using a formal extension of i*, combined with a ‘monitor–diagnose–reconcile–compensate’ framework for considering modification of user support requirements; however, task allocation and human factors advice is not supported. FRAM and TSR could be complementary, with FRAM operating at the high system components level and TSR unpacking system components in terms of software requirements, human operational activities, and desired operational conditions. Investigation and validation activities using VR or simulation [119] are time consuming; nevertheless, the low level of granularity employed VR simulation enables the quantitative evaluation of prospective systems, filling the gap in the existing STS design methods identified by [20]. Guo et al. [120] report a VR-based system to assist product design in its early stages. Through interacting with virtual prototypes in an immersive environment, the designer can gain a more explicit understanding of the product before its realisation. Their application of VR, however, is not linked to a systematic process of product design. Secondly, the development of high-fidelity VR prototypes can be prohibitively expensive. An alternative could be head-mounted VR displays, although users may be even more prone to motion sickness than they are in fixed-base [73,121].
Although it is intended to be generic, the method was tested in a specific context, and, therefore, generalisations about its effectiveness need further investigation. Furthermore, there may be significant differences in the level of complexity in STS, which may relate to challenges not identified in this study.
10. Conclusions
A new STS design approach is proposed that extends functional allocation with a new type of requirements referred to as TSRs; it aims to support the design of systems through the identification of requirements that support human activities and satisfy a set of qualities that relate to human factors.
An example from the automotive domain demonstrated the application of the method for the design of an IVIS system by addressing the cognitive limitations of human agents in such systems. Workload and situation awareness were identified as critical success factors that needed support by technology. TSRs were specified for prospective systems to support these NFR, and virtual prototypes were developed. The simulated evaluation of the prototypes revealed the design that best satisfied the NFR.
An evaluation of the proposed method conducted with participants provided insights into the method’s advantages and limitations. The results demonstrated that the method can contribute positively to designing STS by addressing human factors issues effectively. However, to strengthen the empirical evaluation of the method, additional cases studies need to be performed, and this constitutes part of our future work. Moreover, to evaluate the generalisability of the method to different contexts, additional experiments, with participants using VR prototype designs specified using the method in different domains, need to be performed. Finally, future work will also include quantitative means, against which the level of automation (FA) can be specified, and tool support for design space exploration using analogical reasoning.
Author Contributions
Conceptualization, A.G. and A.S.; methodology, A.G. and A.S.; software, A.G.; validation, A.G.; formal analysis, A.G.; investigation, A.G.; resources, A.G.; writing—original draft preparation, A.G. and A.S.; writing—review and editing, A.G. and A.S.; visualization, A.G. All authors have read and agreed to the published version of the manuscript.
Funding
This research received no external funding.
Data Availability Statement
Data from the experiments can be available upon request.
Conflicts of Interest
The authors declare no conflict of interest.
Appendix A. Evaluation Criteria during Empirical Evaluation
| Evaluation Criteria | COVID19 -Method’s Evaluation Questions | Scale |
| Logical steps | How easy was the method to follow (logic and structure)? | [1 very hard–5 very easy] |
| Learnability | How easy was the method to learn? (learnability) | [1 very hard–5 very easy] |
| Structure my thinking | The method framed my thinking by providing me with a record of my previous design decisions | [1 absolutely disagree–5 absolutely agree] |
| Technical/human aspects | The method helped me to address both the technical and the human factors part of sociotechnical systems | [1 absolutely disagree–5 absolutely agree] |
| TSR useful | Task support requirements are useful for identifying human factors issues during sociotechnical systems design | [1 absolutely disagree–5 absolutely agree] |
| Functional Allocation useful | Functional allocation analysis helped me to identify the best level of automation for the new system based on selected system qualities | [1 absolutely disagree–5 absolutely agree] |
| Produce effective design | The method helped me to produce an effective system design that solves or contributes towards the solution of a specific aspect of the COVID-19 problem | [1 absolutely disagree–5 absolutely agree] |
| Efficient design process | The method helped me to produce a design of the system in an efficient manner (guided me towards a solution) | [1 absolutely disagree–5 absolutely agree] |
| Drill down | The method enabled me to view the problem at high level and then drill down into specific functional requirements of a new system that will address the problem | [1 absolutely disagree–5 absolutely agree] |
Appendix B. Design Exploration Phase of the Method in the Automotive Vehicles- Safety Domain
- Step 6a.
- User Interface design space exploration for the “Visual warning” option
This step identifies user interface design metaphors for the “Visual warning” option. Warnings can cause drivers to suffer from divided attention between the primary driving tasks and interpreting the hazard information [122], leading to overloading and reduced situation awareness (SA). This problem has increased the interest in head-up displays (HUDs), which might reduce the divided attention by overlaying hazard warnings on the driver’s view of the road and surrounding environment [123,124]. HUDs present information in line with the driver’s natural field of vision to improve driver SA. HUDs may also affect the driver’s detection sensitivity to unexpected events, due to their information-capturing attention [124,125,126]. The psychological advantages and disadvantages of HUD displays, such as split attention, SA, and cognitive overloading, have been known for some time [127,128,129], with factors such as display position [130] and text size in visual displays [131] indicating that HUDs are superior to head-down displays for SA, as they reduce workload. An overly cluttered HUD can negatively affect SA through ineffective scanning [132]. Designers must, therefore, specify only the most useful and unambiguous visual cues [125] in HUD, as shown in Table 1. Thus, the information requirements of the driver are used during the specification of TSRs of the visual situation display.
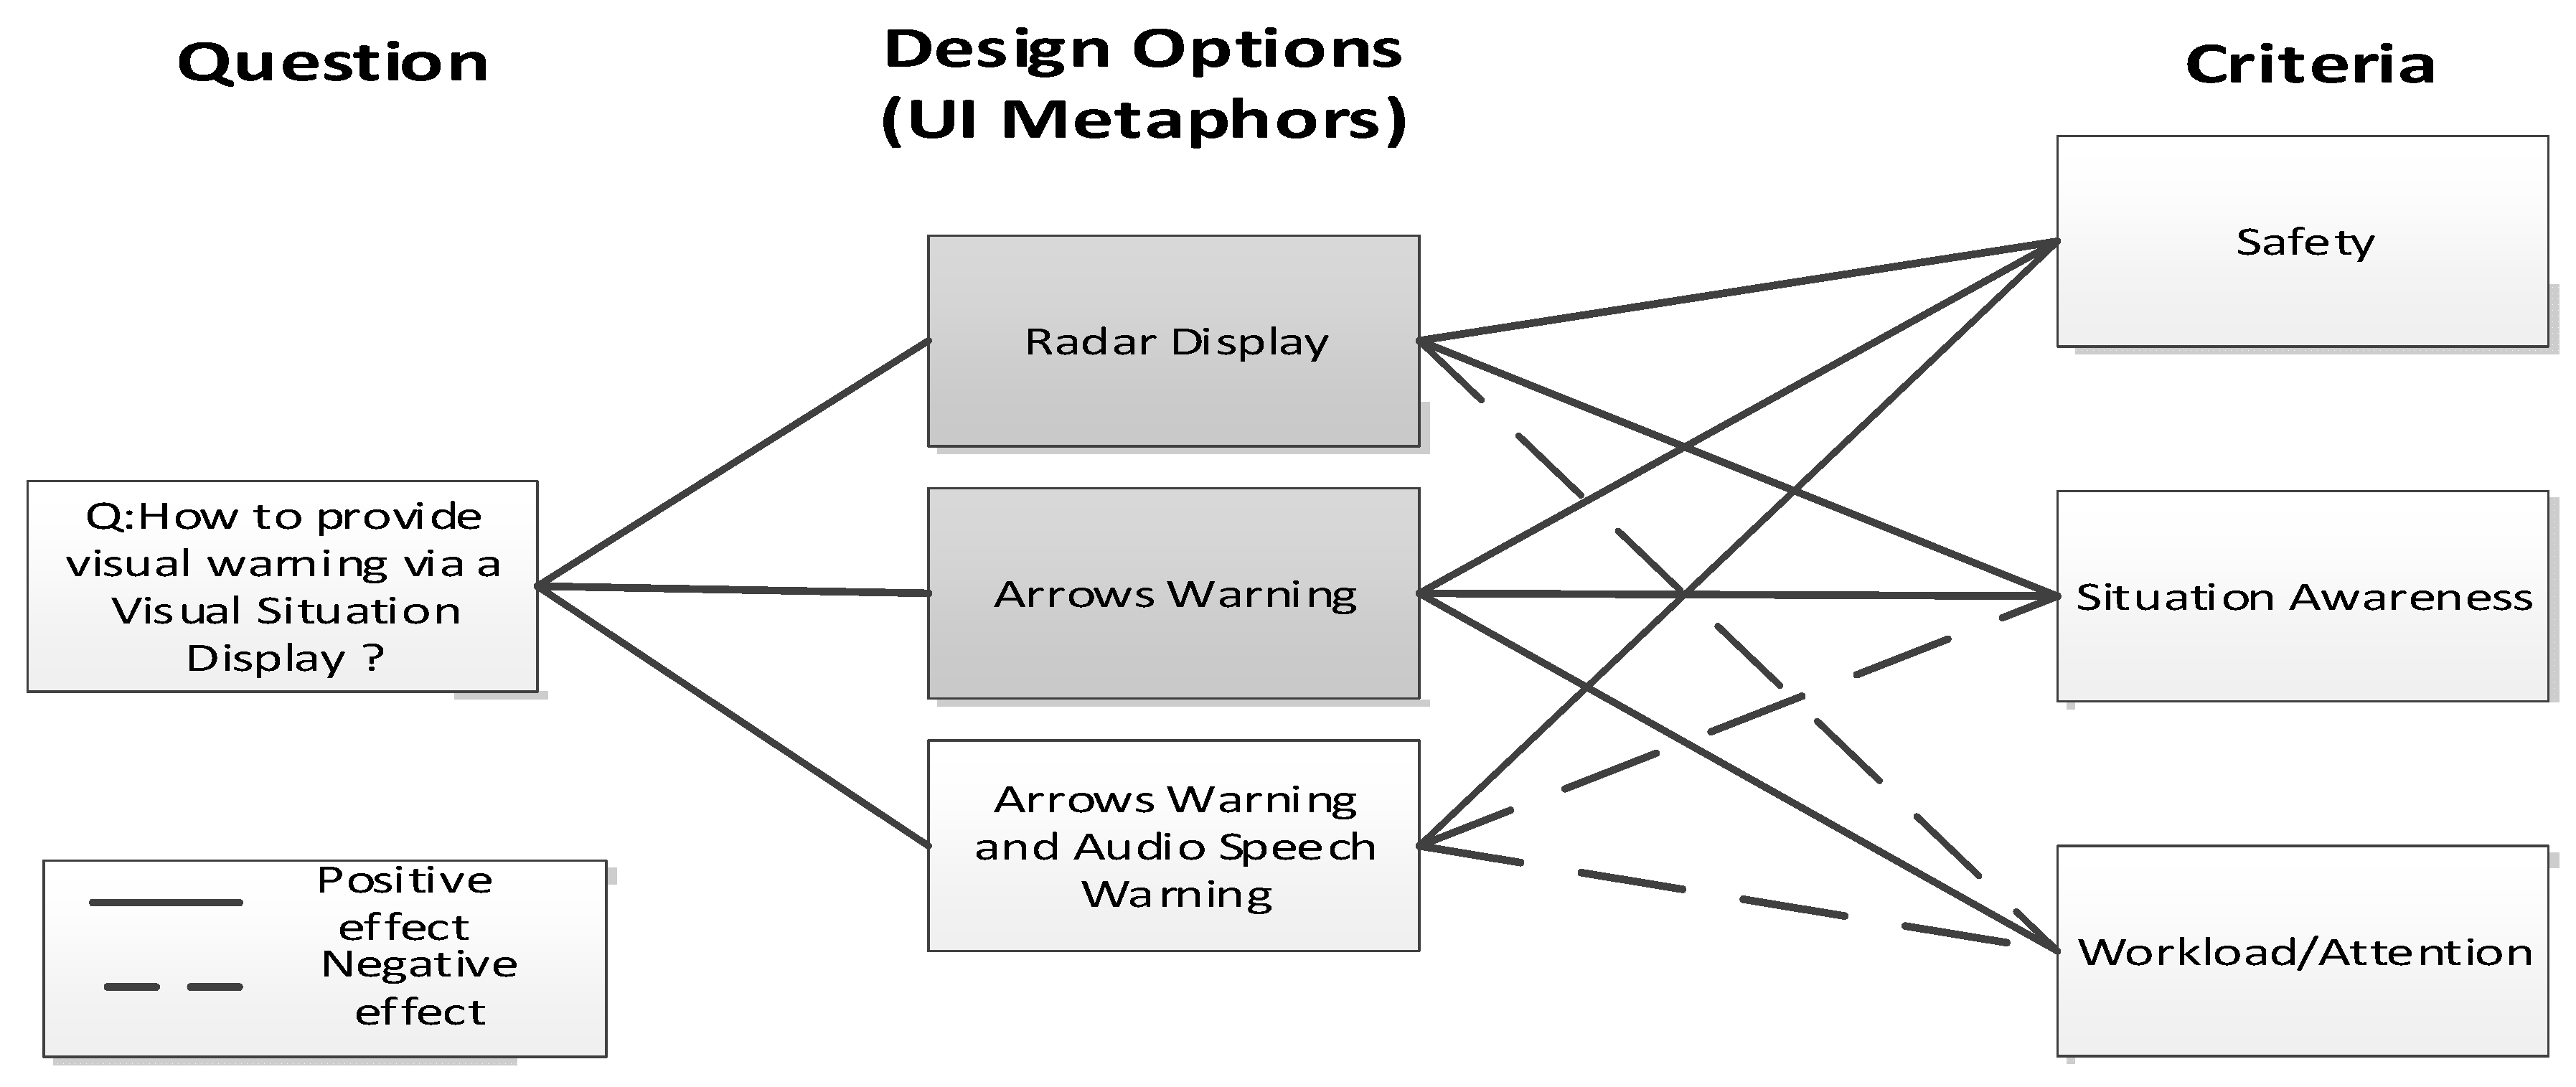
The QOC diagram in Figure A1 addresses the “Provide visual warnings” task from Figure 6, which has three user interface metaphor options: (1) radar-like display, (2) arrows display, and (3) combination of arrows and audio speech warning. In this step, the selected user interface metaphors (1 and 2) are refined into TSRs. The radar display option provides a street/road map of the current location overlaid with potential hazards. This contributes good SA and reasonable safety, but imposes a split attention penalty because the driver has to monitor the map as well as the external world. The arrows design is based on directional minimal alert [133], expressed visually in the form of arrows highlighting the hazard in driver’s field of view. This design has the advantage of less information interfering with the driver’s view, a reasonable safety contribution, and reducing the driver’s cognitive workload of having to attend to the map as well as the external road environment. The third option combines an audio speech warning with the arrows hazard display. This has the disadvantage of increasing the driver’s workload and has been the subject of several studies [101,124,134,135]. Therefore, arrows with audio design was deemed inferior, given the increased workload and annoyance [136], to the simultaneous audio warning and display of hazards, and no further refinement was performed.

Figure A1.
QOC Design rationale diagram for different HCI metaphors of the i* task “Provide visual warning” and its realisation through a “Visual situation display”, with best options shaded.
Figure A1.
QOC Design rationale diagram for different HCI metaphors of the i* task “Provide visual warning” and its realisation through a “Visual situation display”, with best options shaded.
For the selected designs (Arrows and Radar) from Figure A1, the TSRs in Table 1 are refined utilising accident causality knowledge [137,138] and visual attention principles of sensory and cognitive affordance [139], along with drivers’ information needs. Given that most traffic accidents are caused or influenced by low SA, such as inattention at intersections or during lane change [137,138], or drivers failing to recognise vehicles’ trajectories at intersections [98], failing to notice traffic behind when decelerating or changing lanes, or cutting across in front of another vehicle too soon after overtaking, the TSRs should alleviate these risks by addressing the information needs of drivers. To increase situation awareness, TSRs should specify how visual cues can signal peripheral risks (vehicles, obstacles, etc.) in a non-destructive manner [140,141]. Relevant situation awareness design knowledge from complex systems design [142] could also be utilised during TSR refinement.
Based on the above knowledge, the TSRs of the selected two designs are refined further. The cognitive affordance (Arrows) design aims to support driver’s situation awareness through the minimal alert paradigm, as illustrated in the virtual user interface prototype in Figure A2 (left side). It aims to warn drivers of vehicles that are expected to pull out from side roads but are not yet visible, or vehicles that are in the driver’s blind spot. This design is similar to DENSO’s intersection movement assist [133], the spatial attention mechanism [143], the Mercedes blind-spot assist system [144] and work in [145] that uses digital side-mirrors to enhance drivers’ situation awareness and reduce decision time and eyes-off-road time. However, the Arrows design uses minimum visual cues based on the direction of the imminent threat [77]; thus, at any given time only one arrow per threat is depicted on HUD, with a maximum of two concurrent arrows. When there are more than one threats at a given time, the size of the arrow indicates priority. Such designs assist drivers to process salient information faster and, thus, could reduce accidents attributed to lane changing and inattention.
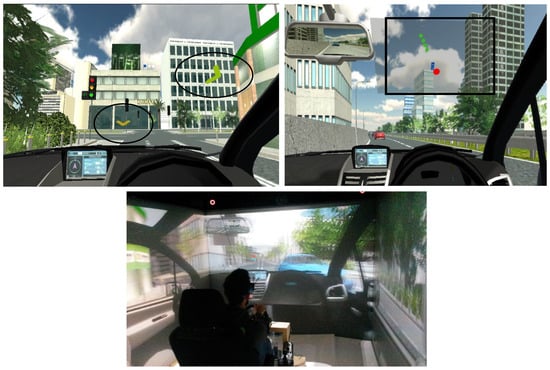
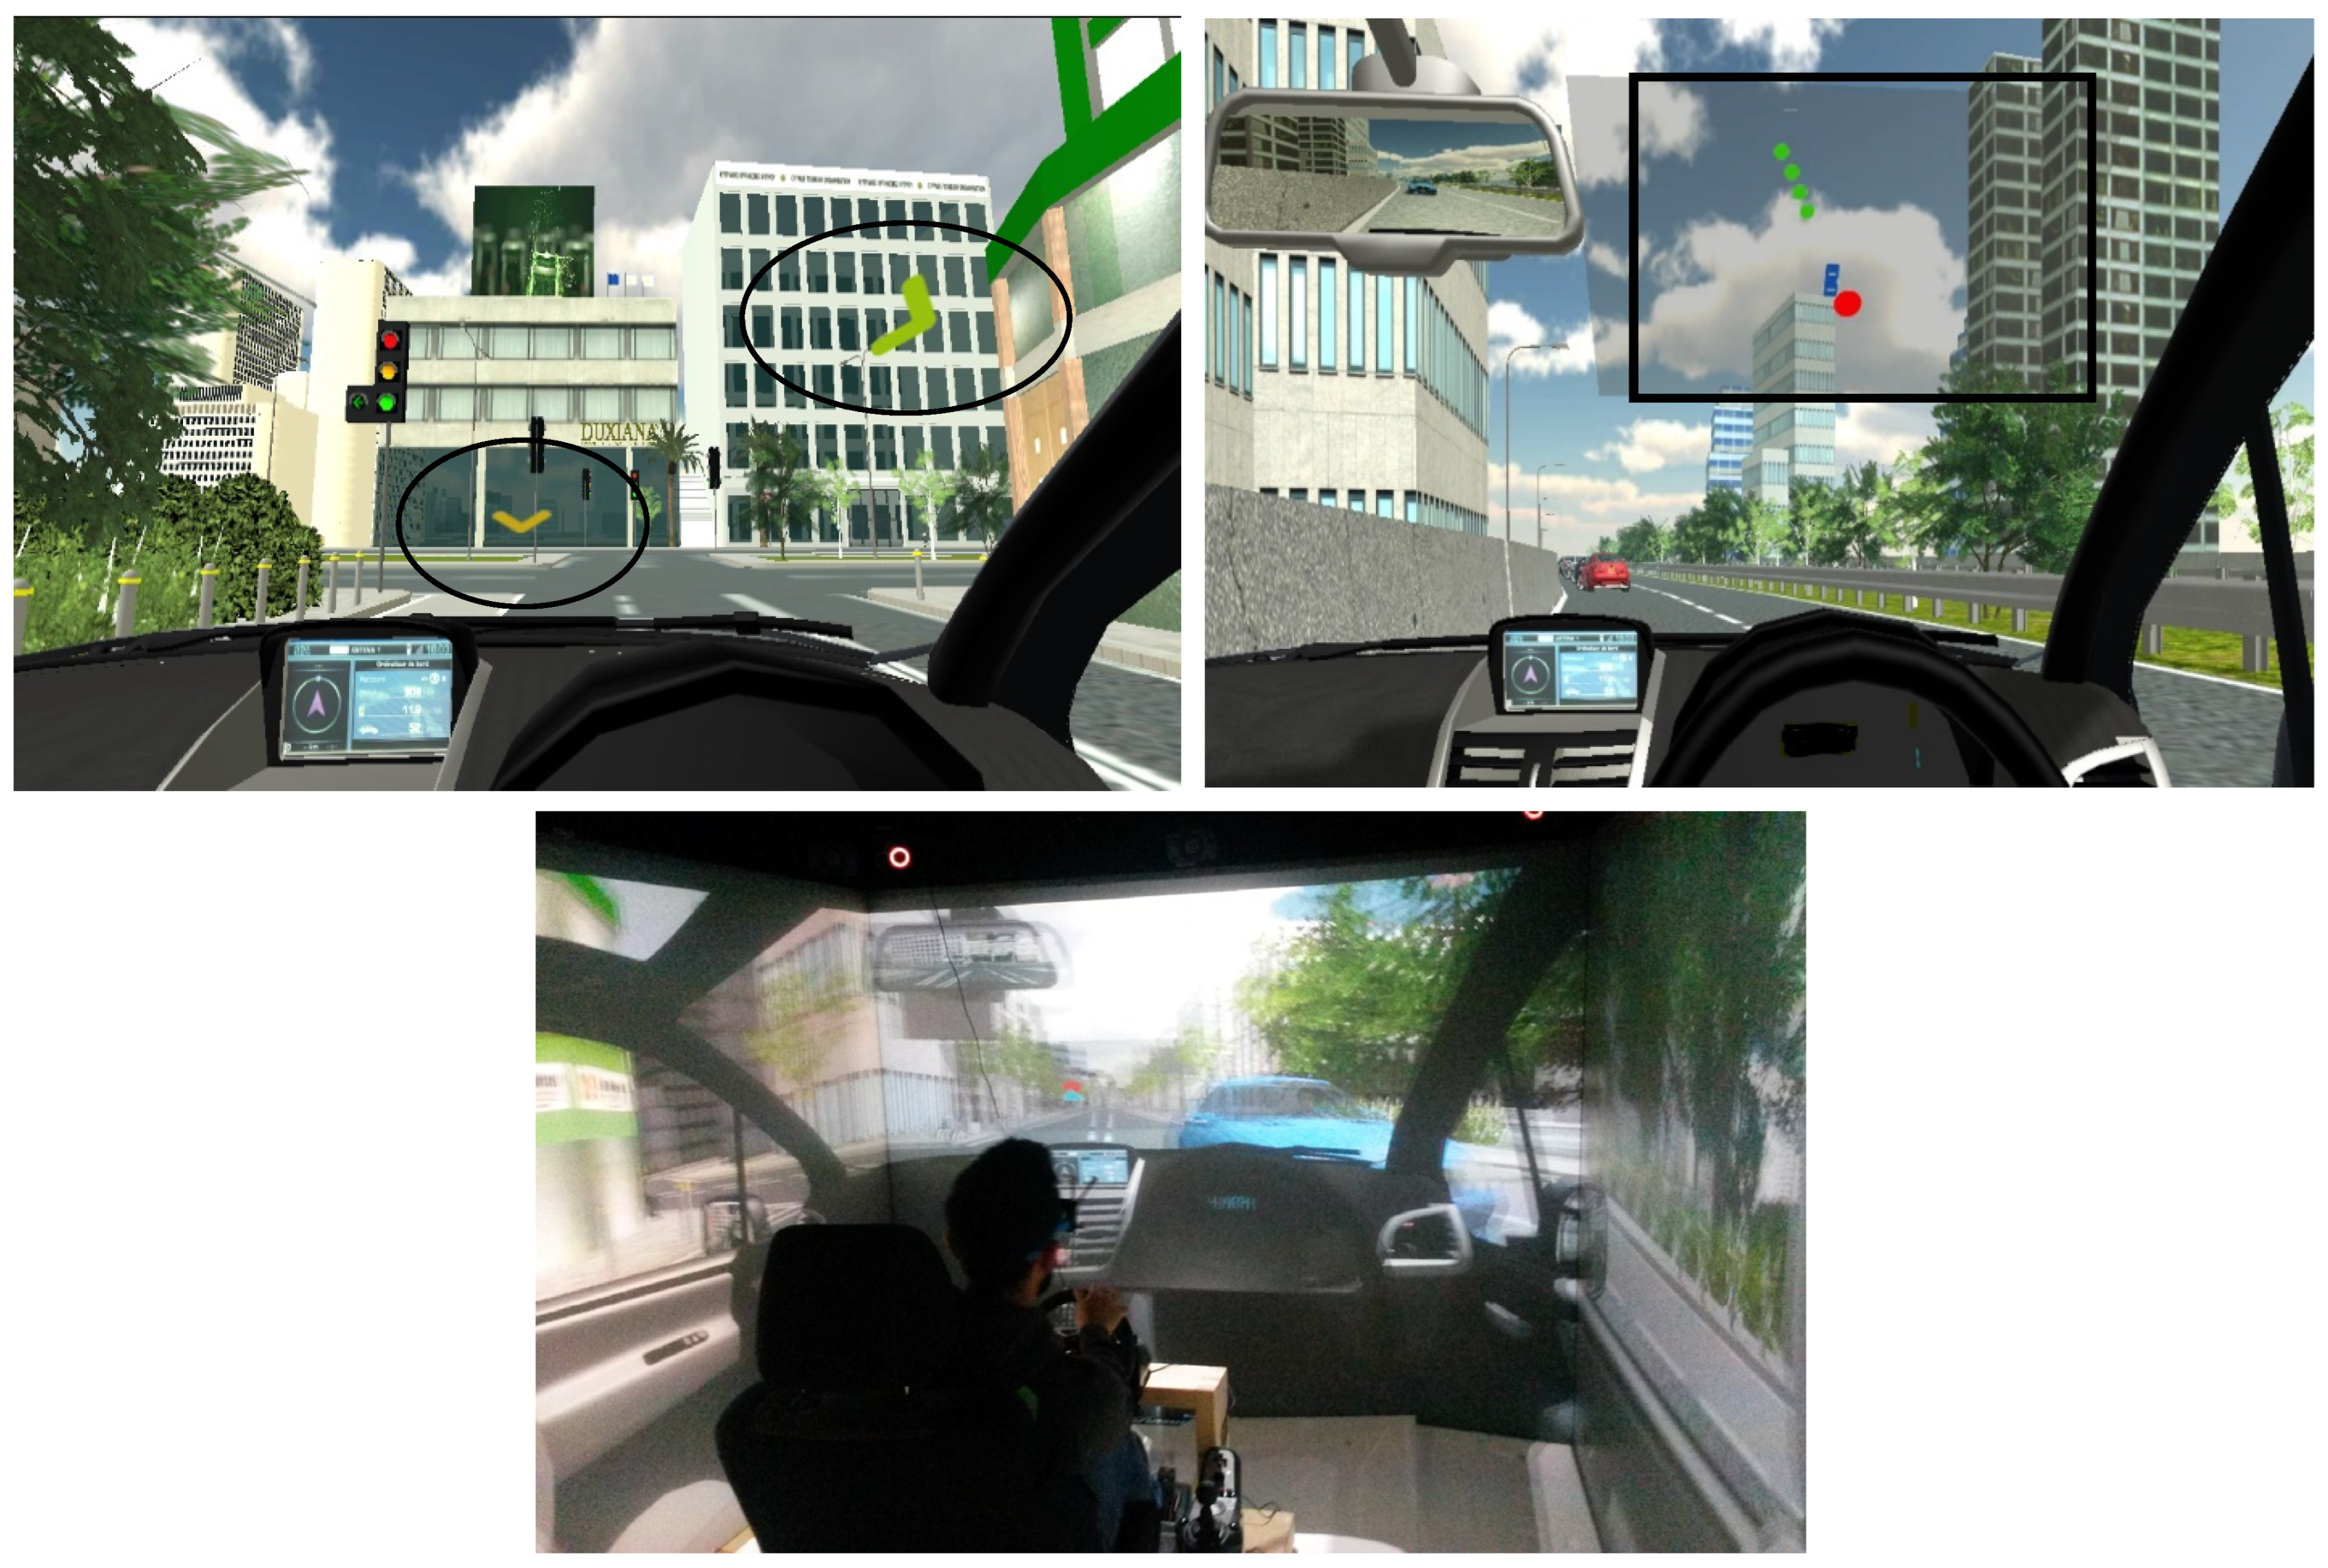
Figure A2.
Screenshot from the first-person view of the Arrows (top left) and Radar (top right) designs on the HUD. Superimposed icons on the HUD show visualisations of TSRs. Arrows show imminent vehicle threats about to emerge at intersection (right arrow) and a vehicle following closely (lower-centre arrow). Radar shows host vehicle as a blue car in the centre of radar and traffic hazards as red circles. Below a participant engaging a scenario during an experiment in VR cave simulator using the Radar design.
The Radar design uses an information-rich metaphor [77] as illustrated in Figure A2 (top-right side). It prioritise threats, while informing drivers of the traffic situation in surrounding roads, similar to the global view of surroundings [146]. It enables the user to distinguish different visual elements, such as threats at various priority levels, using the analogy of a radar. In this design, the host vehicle is shown as a blue overlaid car in HUD, surrounded by different colours and sizes of filled circles denoting other vehicles and their associated risk to the host vehicle. The design is based on the principle of “searchlight” in visual attention [139] and insights regarding the effects of size of visual cues on visual demand [145]. The latter enables the placing of multiple threats on the UI while avoiding the high-superimposition problem [147]. Another UI principle used by the radar design is that of pre-attentive processing, which explains how an “odd one out” object can be perceived in visual feature space, and this is realised by the different colour and size of threats (circles) on the HUD. Finally, the radar design uses also the principle of movement’s speed, which states that the detection rate is better for moving compared to static objects [148]; thus, objects in the radar move according to their risk level.
A prerequisite for the realisation of both designs in real vehicles is the availability of information regarding peripheral vehicles’ positions and speeds. These are assumed to be provided from on-board vehicle sensors and vehicle-to-vehicle communication protocols that utilise connected-vehicles technology [149].
- Step 6b.
- TSR refinement and TSR selection for the Radar and Arrows designs
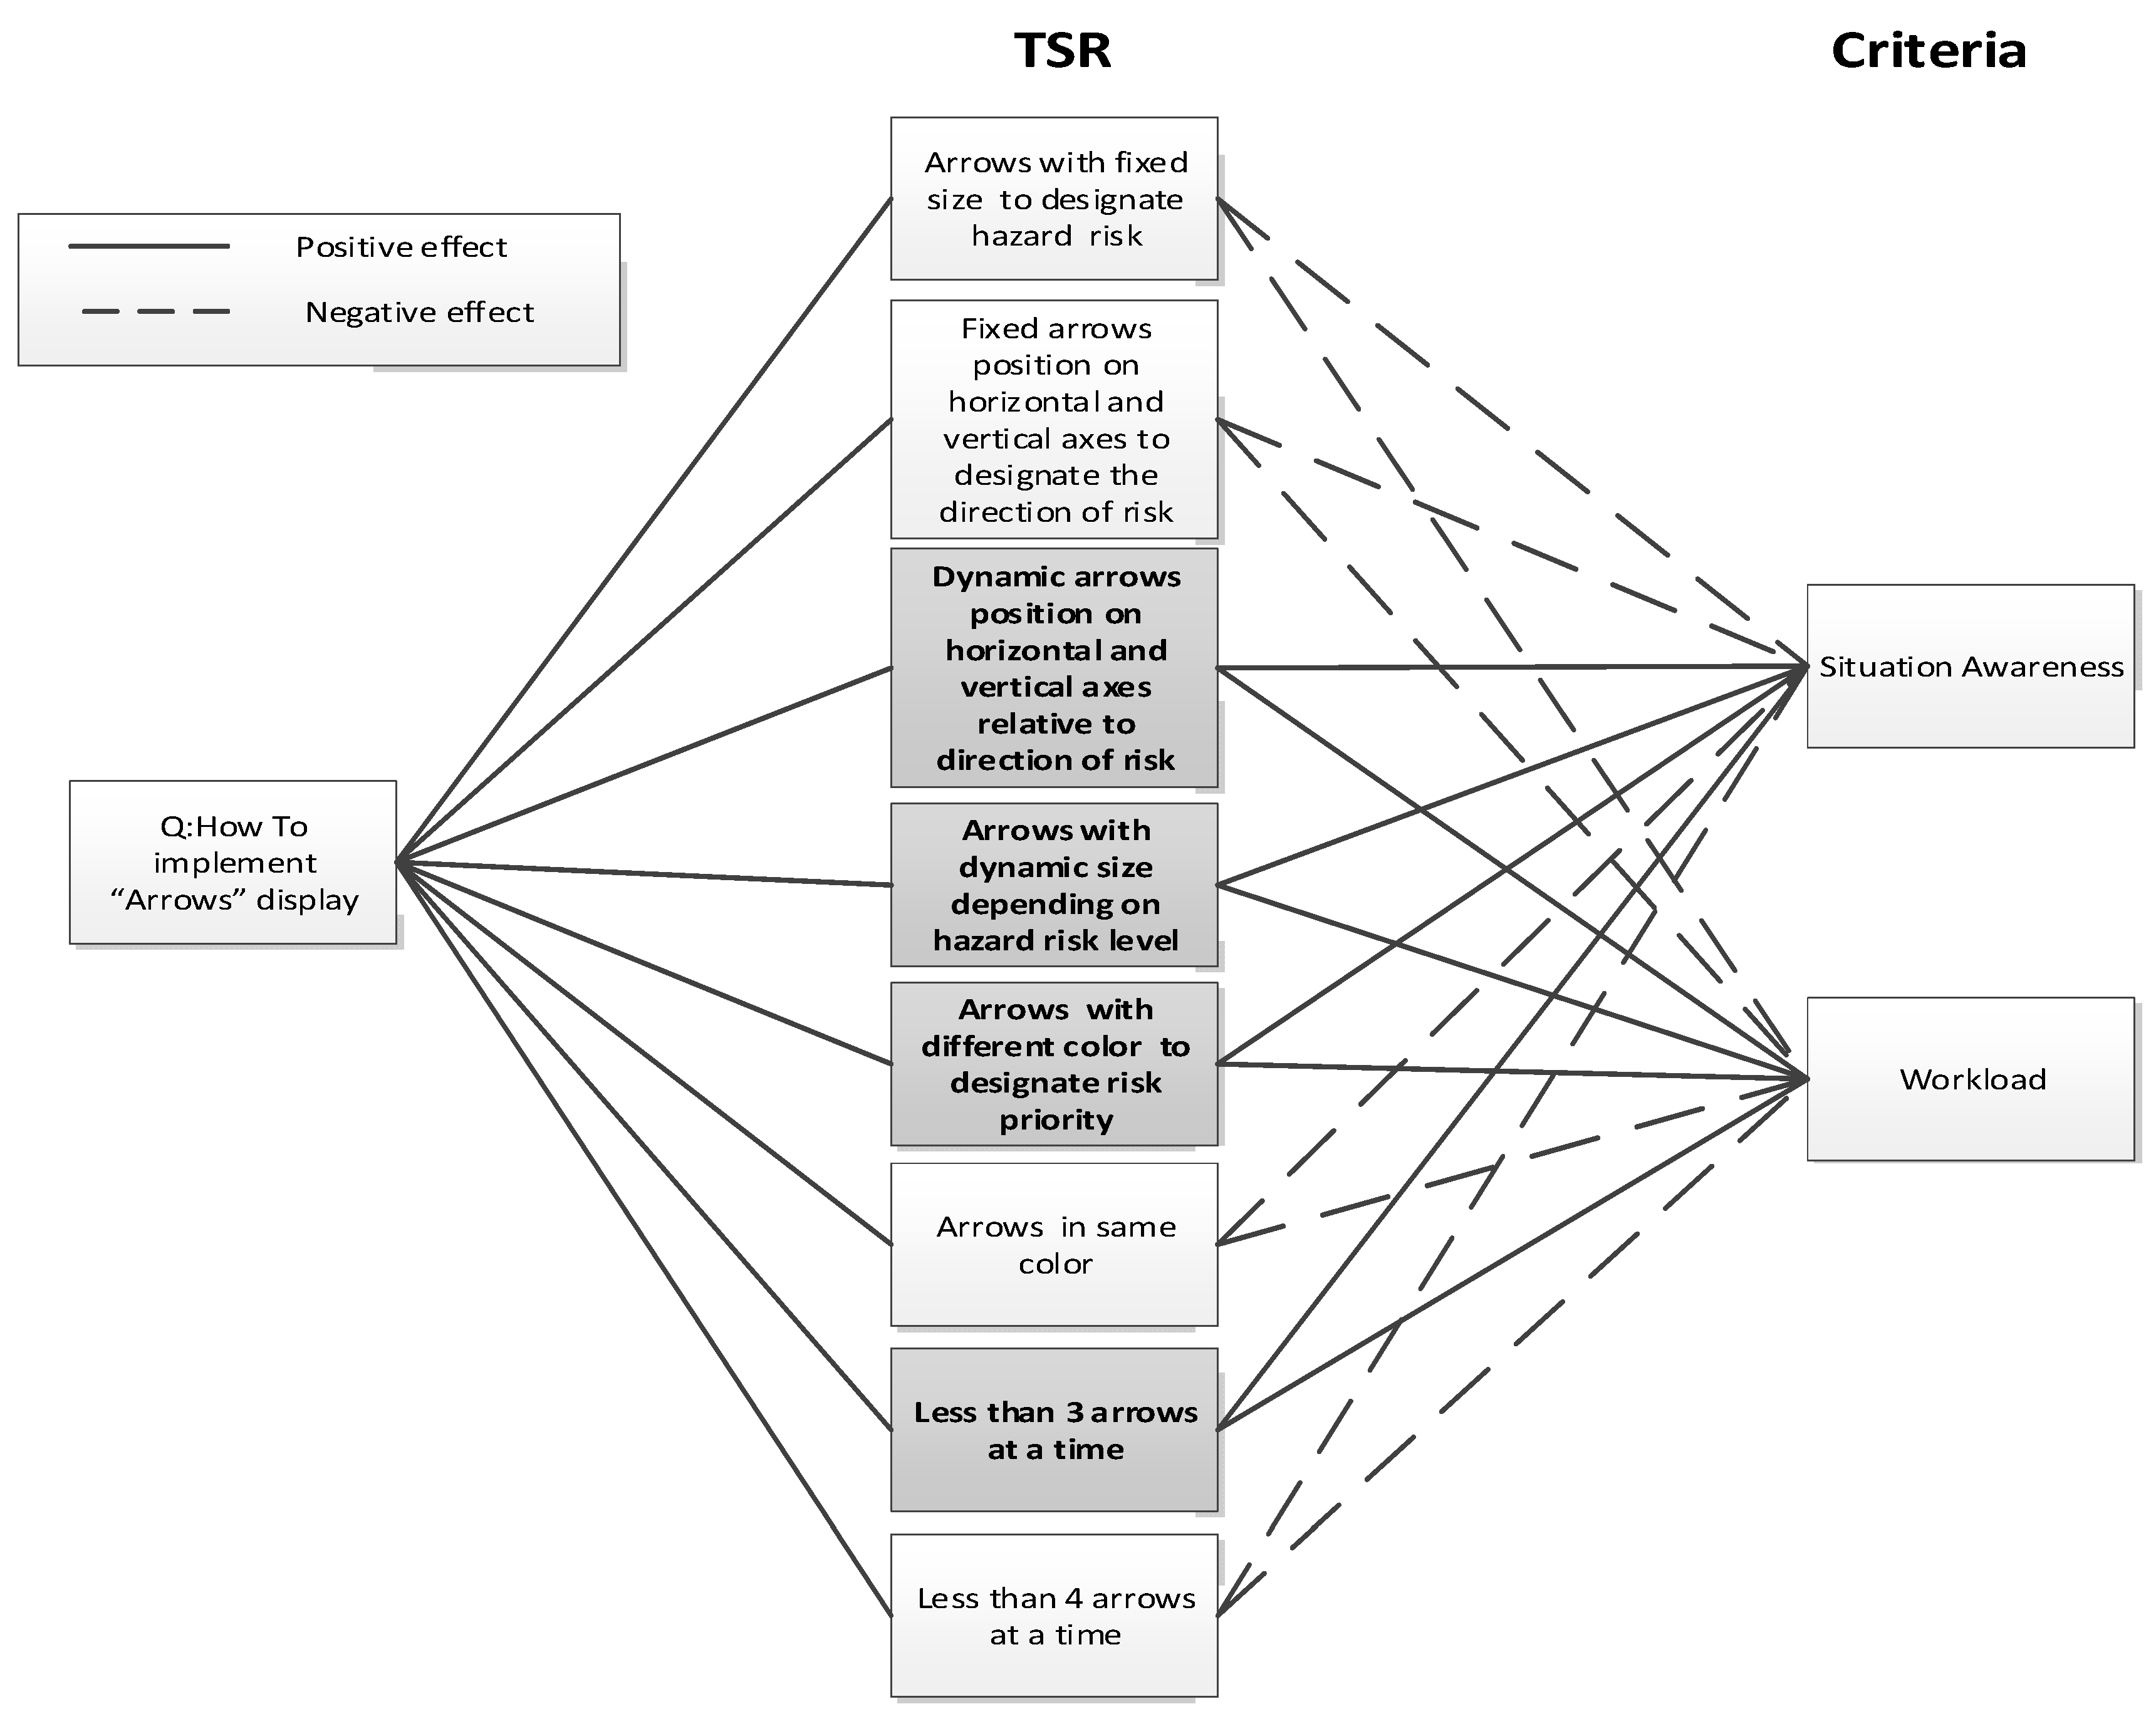
The design rationale diagrams in Figure A3 and Figure A4 elaborate on the Arrow and Radar designs by evaluating them against the criteria of workload and situation awareness. For the arrows design, the candidate TSRs, as illustrated in Figure A3, were specified based on (1) the size of arrows (variable or fixed) on the visual display, to indicate risk-level; (2) the use of static or dynamic positioning of arrows, to indicate relative location of threat; (3) the colour-coding (or not) of arrows, to indicate risk level; and (4) the maximum number of concurrent arrows on the visual display (<3 or <4). The variable size, position, and colour of arrows contribute positively to situation awareness by directing the driver’s attention to hazard-relevant information in an intuitive manner, improving decision-making performance time. In contrast, fixed-sized arrows with no colour coding, that are statically positioned on the visual display, contribute negatively to workload, since drivers have to decide which threat to evaluate first. Similarly, to minimise the negative effect on distraction and workload, the number of concurrent arrows on the HUD should be minimal. The design rationale in Figure A3 presents the eight TSRs; the four denoted in bold have been selected for implementation in the arrow VR prototype. These are (1) the dynamic positioning of the arrows on the screen according to the relative position of threats, (2) the dynamic arrows’ size by level of risk, (3) the colour coding of arrows by risk type, and (4) the maximum number of concurrent arrows less than three.
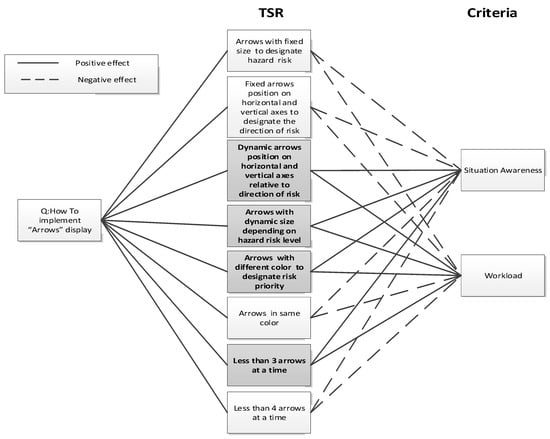
Figure A3.
Design rationale for the “arrows” design against two criteria. In shading, the selected TSR to be evaluated in the VR simulator.
Figure A3.
Design rationale for the “arrows” design against two criteria. In shading, the selected TSR to be evaluated in the VR simulator.
For the radar design, the TSRs, as illustrated in Figure A4, were specified based on (1) dynamic versus static size of icons on visual display (denoting other vehicles/hazards), to indicate assessed risk level; (2) dynamic versus static colour coding of icons, by risk level; and (3) limited or unlimited number of concurrent icons on display. Dynamic size and colour coding of icons, with no limit on the number of icons concurrently on display, contribute positively to SA by directing the driver’s attention to critical cues by prioritising threats, while, at the same time, providing contextual information regarding traffic congestion in the peripheral road network. The highlighted TSRs in Figure A4 were the ones selected for prototyping in VR.
From the above process, it is evident that consideration of TSRs and design options is complex and could be delegated to HF experts. However, these experts may not be available. This motivates step 7 of the method, to test TSR design options by virtual prototyping and evaluate their merit through experiments against pre-set NFR criteria.

Figure A4.
Design rationale for the radar design against two criteria. In shading is selected TSR to be evaluated in the VR simulator.
Figure A4.
Design rationale for the radar design against two criteria. In shading is selected TSR to be evaluated in the VR simulator.
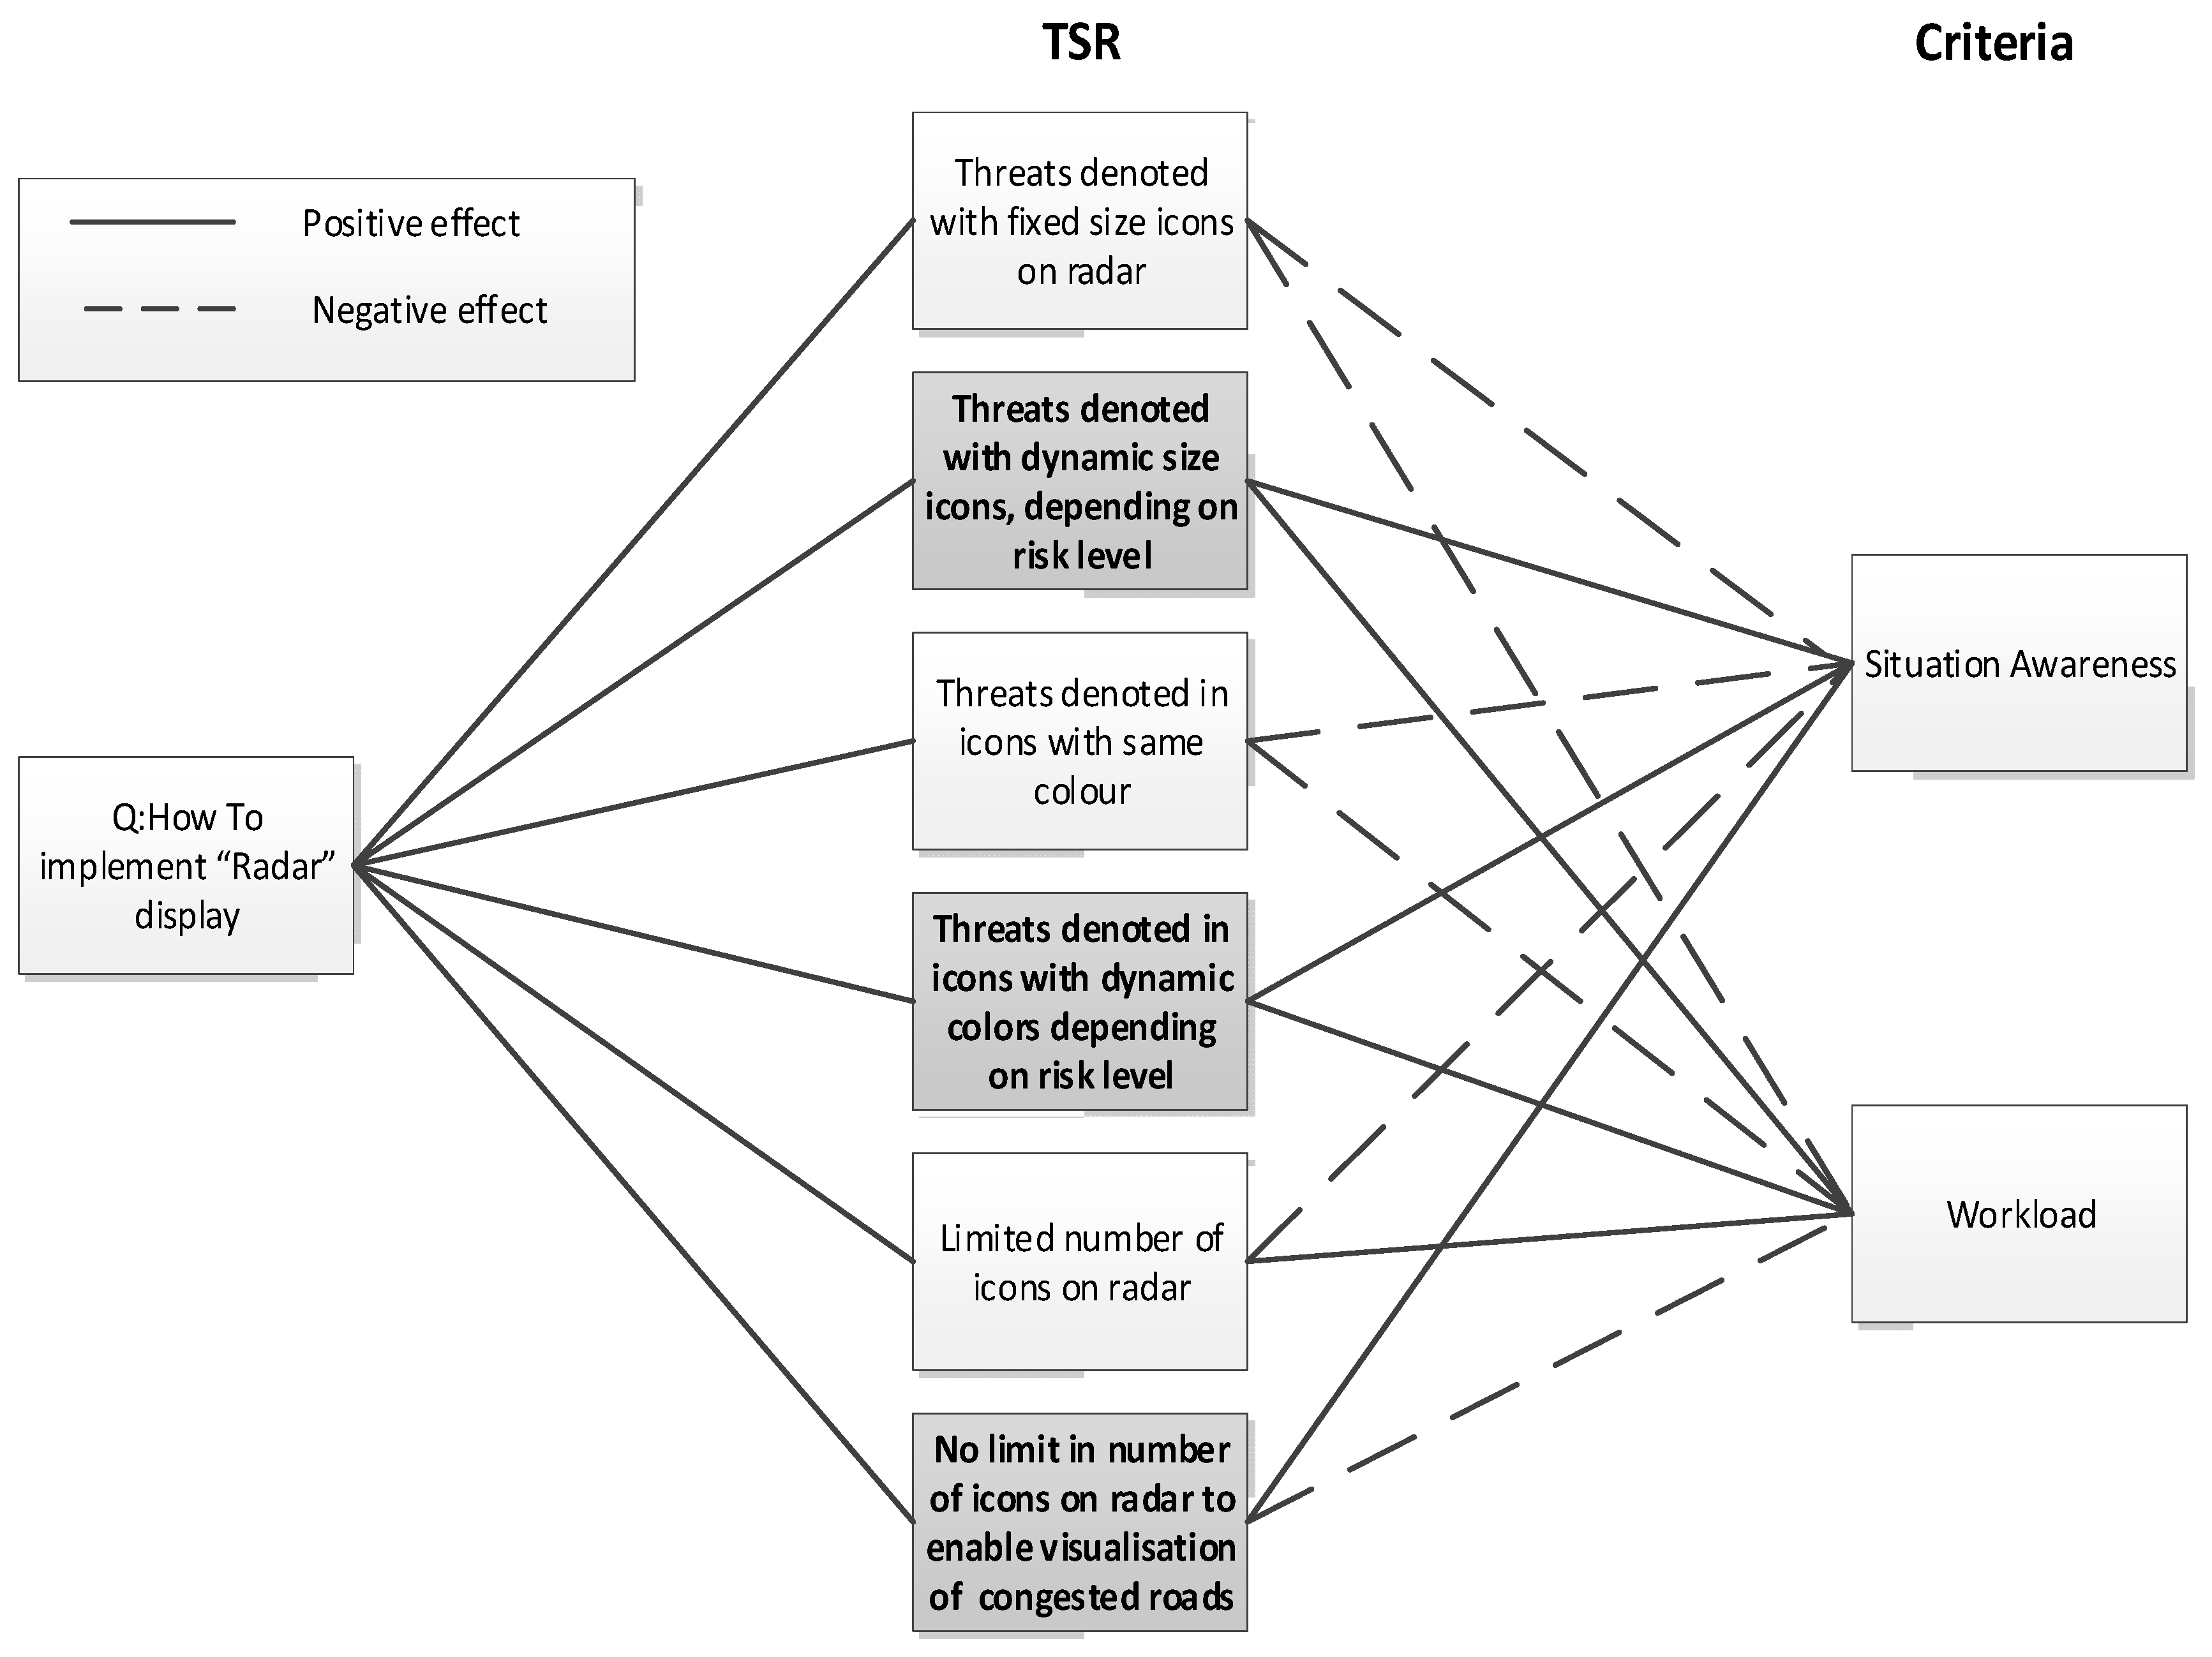
Appendix C. Designing and Evaluating the Driving Simulator
The VR environment and the simulator were developed using UNITY game engine in the following three phases. Initially, the buildings, road infrastructure and traffic flow for a selected road section were developed to replicate real conditions. Secondly, several driving-hazard scenarios were designed in the simulator, which referred to atypical events that would stress test the participants and test their situation awareness. Thirdly, the prototype designs (TSR specification) were implemented as functionality in the VR environment using UNITY scripting language. The modelling of the road network was achieved by extracting the section of the road network from OpenStreetMap and generating a 3D model of it in UNITY. The selection of virtual vehicle models was based on vehicle types and brands used in Cyprus. Traffic conditions were realised though autonomous agent-based vehicles that navigate independently in the modelled network using pre-set driving behaviours. The traffic conditions in the simulator mimicked the volume, speed, and vehicle-type distribution in the selected road section. Interactivity between the user and the simulator was achieved through a physical steering wheel and petals integrated with simulator. To validate the driving simulator, several evaluation sessions with professional drivers were conducted. During each session, experts evaluated the vehicle’s steering sensitivity, acceleration and deceleration, and realism of the virtual environment. The above process was repeated until the simulator was considered appropriate and realistic. The simulator was designed to record, in real-time, electro-encephalographic activity of participants (EEG), headway (vehicle separation), lateral deviations (deviated from centre of road), speed, acceleration, and deceleration. Figure A2 depicts a first-person view of the simulator and the physical controls used by participants during the experiments.
References
- Trist, E.L.; Bamforth, K.W. Some Social and Psychological Consequences of the Longwall Method of Coal-Getting: An Examination of the Psychological Situation and Defences of a Work Group in Relation to the Social Structure and Technological Content of the Work System. Hum. Relat. 1951, 4, 3–38. [Google Scholar] [CrossRef]
- Clegg, C.W. Sociotechnical principles for system design. Appl. Ergon. 2000, 31, 463–477. [Google Scholar] [CrossRef]
- Lee, A. Editor’s comments: MIS quarterly’s editorial policies and practices. MIS Q. 2001, 25, iii–vii. [Google Scholar]
- Hughes, H.P.N.; Clegg, C.W.; Bolton, L.E.; Machon, L.C. Systems scenarios: A tool for facilitating the socio-technical design of work systems. Ergonomics 2017, 60, 1319–1335. [Google Scholar] [CrossRef]
- Schneider, S.; Wollersheim, J.; Krcmar, H.; Sunyaev, A. Erratum to: How do requirements evolve over time? A case study investigating the role of context and experiences in the evolution of enterprise software requirements. J. Inf. Technol. 2018, 33, 171. [Google Scholar] [CrossRef]
- Mohd, H.N.N.; Shamsul, S. Critical success factors for software projects: A comparative study. Sci. Res. Essays 2011, 6, 2174–2186. [Google Scholar] [CrossRef]
- Read, G.J.M.; Salmon, P.M.; Lenné, M.G.; Stanton, N.A. Designing sociotechnical systems with cognitive work analysis: Putting theory back into practice. Ergonomics 2015, 58, 822–851. [Google Scholar] [CrossRef]
- Challenger, R.; Clegg, C.W.; Shepherd, C. Function allocation in complex systems: Reframing an old problem. Ergonomics 2013, 56, 1051–1069. [Google Scholar] [CrossRef]
- Hay, G.J.; Klonek, F.E.; Parker, S.K. Diagnosing rare diseases: A sociotechnical approach to the design of complex work systems. Appl. Ergon. 2020, 86, 103095. [Google Scholar] [CrossRef] [PubMed]
- Hamim, O.F.; Shamsul Hoque, M.; McIlroy, R.C.; Plant, K.L.; Stanton, N.A. A sociotechnical approach to accident analysis in a low-income setting: Using Accimaps to guide road safety recommendations in Bangladesh. Saf. Sci. 2020, 124, 104589. [Google Scholar] [CrossRef]
- de Vries, L.; Bligård, L.-O. Visualising safety: The potential for using sociotechnical systems models in prospective safety assessment and design. Saf. Sci. 2019, 111, 80–93. [Google Scholar] [CrossRef]
- Jenkins, D.P.; Stanton, N.A.; Salmon, P.M.; Walker, G.H.; Young, M.S. Using cognitive work analysis to explore activity allocation within military domains. Ergonomics 2008, 51, 798–815. [Google Scholar] [CrossRef]
- Patorniti, N.P.; Stevens, N.J.; Salmon, P.M. A systems approach to city design: Exploring the compatibility of sociotechnical systems. Habitat Int. 2017, 66, 42–48. [Google Scholar] [CrossRef]
- Carden, T.; Goode, N.; Read, G.J.M.; Salmon, P.M. Sociotechnical systems as a framework for regulatory system design and evaluation: Using Work Domain Analysis to examine a new regulatory system. Appl. Ergon. 2019, 80, 272–280. [Google Scholar] [CrossRef]
- Makarius, E.E.; Mukherjee, D.; Fox, J.D.; Fox, A.K. Rising with the machines: A sociotechnical framework for bringing artificial intelligence into the organization. J. Bus. Res. 2020, 120, 262–273. [Google Scholar] [CrossRef]
- Norman, D.A.; Stappers, P.J. DesignX: Complex Sociotechnical Systems. She Ji 2015, 1, 83–106. [Google Scholar] [CrossRef]
- Kafali, Ö.; Ajmeri, N.; Singh, M.P. Normative requirements in sociotechnical systems. In Proceedings of the 2016 IEEE 24th International Requirements Engineering Conference Workshops, REW 2016, Beijing, China, 12–16 September 2016. [Google Scholar]
- Dey, S.; Lee, S.W. REASSURE: Requirements elicitation for adaptive socio-technical systems using repertory grid. Inf. Softw. Technol. 2017, 87, 160–179. [Google Scholar] [CrossRef]
- Hollnagel, E. FRAM: The Functional Resonance Analysis Method; CRC Press: Boca Raton, FL, USA, 2017; ISBN 9781315255071. [Google Scholar]
- Baxter, G.; Sommerville, I. Interacting with Computers Socio-technical systems: From design methods to systems engineering. Interact. Comput. 2011, 23, 4–17. [Google Scholar] [CrossRef]
- Hettinger, L.J.; Kirlik, A.; Goh, Y.M.; Buckle, P. Modelling and simulation of complex sociotechnical systems: Envisioning and analysing work environments. Ergonomics 2015, 58, 600–614. [Google Scholar] [CrossRef] [PubMed]
- Read, G.J.M.; Salmon, P.M.; Goode, N.; Lenné, M.G. A sociotechnical design toolkit for bridging the gap between systems-based analyses and system design. Hum. Factors Ergon. Manuf. 2018, 28, 327–341. [Google Scholar] [CrossRef]
- Wache, H.; Dinter, B. The Digital Twin—Birth of an Integrated System in the Digital Age. In Proceedings of the 53rd Hawaii International Conference on System Sciences, Maui, HI, USA, 7–10 January 2020. [Google Scholar]
- Read, G.J.M.; Salmon, P.M.; Lenné, M.G. When paradigms collide at the road rail interface: Evaluation of a sociotechnical systems theory design toolkit for cognitive work analysis. Ergonomics 2016, 59, 1135–1157. [Google Scholar] [CrossRef] [PubMed]
- Sutcliffe, A.; Gault, B.; Maiden, N. ISRE: Immersive scenario-based requirements engineering with virtual prototypes. Requir. Eng. 2005, 10, 95–111. [Google Scholar] [CrossRef]
- Gregoriades, A.; Sutcliffe, A. A socio-technical approach to business process simulation. Decis. Support Syst. 2008, 45, 1017–1030. [Google Scholar] [CrossRef]
- Gregoriades, A.; Sutcliffe, A. Scenario-based assessment of nonfunctional requirements. IEEE Trans. Softw. Eng. 2005, 31, 392–409. [Google Scholar] [CrossRef]
- Sutcliffe, A.; Chang, W.C.; Neville, R. Evolutionary requirements analysis. In Proceedings of the IEEE International Conference on Requirements Engineering, Monterey Bay, CA, USA, 12 September 2003. [Google Scholar]
- Wolfartsberger, J. Analyzing the potential of Virtual Reality for engineering design review. Autom. Constr. 2019, 104, 27–37. [Google Scholar] [CrossRef]
- Radha, R.K. Flexible smart home design: Case study to design future smart home prototypes. Ain Shams Eng. J. 2021, 13, 101513. [Google Scholar] [CrossRef]
- Dalpiaz, F.; Giorgini, P.; Mylopoulos, J. Adaptive socio-technical systems: A requirements-based approach. Requir. Eng. 2013, 18, 1–24. [Google Scholar] [CrossRef]
- Yu, E.S.K.; Mylopoulos, J. From E-R to “a-R”—Modelling Strategic Actor Relationships for Business Process Reengineering. Int. J. Coop. Inf. Syst. 1995, 04, 125–144. [Google Scholar] [CrossRef]
- Liaskos, S.; Khan, S.M.; Soutchanski, M.; Mylopoulos, J. Modeling and reasoning with decision-theoretic goals. In Conceptual Modeling (ER 2013); Lecture Notes in Computer Science (including subseries Lecture Notes in Artificial Intelligence and Lecture Notes in Bioinformatics); Springer: Berlin/Heidelberg, Germany, 2013. [Google Scholar]
- Hollnagel, E.; Woods, D.D. Joint Cognitive Systems: Foundations of Cognitive Systems Engineering; Taylor & Francis: Abingdon, UK, 2005; ISBN 9780849328213. [Google Scholar]
- Woods, D.; Hollnagel, E. Joint Cognitive Systems: Patterns in Cognitive Systems Engineering; CRC/Taylor & Francis: Boca Raton, FL, USA, 2006. [Google Scholar]
- Vicente, K.J. Cognitive Work Analysis: Toward Safe, Productive, and Healthy Computer-Based Work; CRC Press: Boca Raton, FL, USA, 1999; ISBN 9781410603036. [Google Scholar]
- Schulze-Meeßen, L.; Hamborg, K.-C. Impact of graphical versus textual sociotechnical prototypes on the generation of mental models in work design. Appl. Ergon. 2023, 110, 104012. [Google Scholar] [CrossRef]
- William Pasmore Stu Winby, S.A.M.; Vanasse, R. Reflections: Sociotechnical Systems Design and Organization Change. J. Chang. Manag. 2019, 19, 67–85. [Google Scholar] [CrossRef]
- Govers, M.; van Amelsvoort, P. A theoretical essay on socio-technical systems design thinking in the era of digital transformation. Grup. Interaktion. Organ. Zeitschrift für Angew. Organ. 2023, 54, 27–40. [Google Scholar] [CrossRef]
- Mumford, E. Designing Human Systems for New Technology: The ETHICS Method; Manchester Business School: Manchester, UK, 1983. [Google Scholar]
- Mumford, E. The story of socio-technical design: Reflections on its successes, failures and potential. Inf. Syst. J. 2006, 16, 317–342. [Google Scholar] [CrossRef]
- Mumford, E. Requirements analysis and QUICKethics. In Effective Systems Design and Requirements Analysis: The ETHICS Approach; Macmillan Education: London, UK, 1995; pp. 93–99. [Google Scholar]
- Aveson, D.; Fitzgerald, G. Methodologies for Developing Information Systems: A Historical Perspective. In The Past and Future of Information Systems: 1976–2006 and Beyond; Avison, D., Elliot, S., Krogstie, J., Pries-Heje, J., Eds.; Springer: Boston, MA, USA, 2006; pp. 27–38. [Google Scholar]
- Adman, P.; Warren, L. Participatory sociotechnical design of organizations and information systems—An adaptation of ETHICS methodology. J. Inf. Technol. 2000, 15, 39–51. [Google Scholar] [CrossRef]
- Hickey, S.; Matthies, H.; Mumford, E. Designing Human Systems: An Agile Approach to ETHICS; Lulu: Morrisville, NC, USA, 2006; ISBN 9781411638174. [Google Scholar]
- Abrahamsson, P.; Salo, O.; Ronkainen, J.; Warsta, J. Agile Software Development Methods: Rewiew and Analysis; VTT Technical Reaserch Centre of Finland: Oulou, Finland, 2002. [Google Scholar]
- Checkland, P. Systems Thinking, Systems Practice; John Wiley and Sons: Chichester, UK, 1981. [Google Scholar]
- Checkland, P.; Scholes, J. Soft Systems Methodology in Action; Wiley: Hoboken, NJ, USA, 1991. [Google Scholar]
- Rasmussen, J.; Pejtersen, A.M.; Goodstein, L.P. Cognitive Systems Engineering, 1st ed.; Wiley-Interscience: New York, NY, USA, 1994; ISBN 9780471011989. [Google Scholar]
- ISO 9241-210:2010; Ergonomics of Human-System Interaction—Part 210: Human-Centered Design for Interective Systems. International Standard Organisation: Geneva, Switzerland, 2010.
- Norman, D.A. Human-centered design considered harmful. Interactions 2005, 12, 14. [Google Scholar] [CrossRef]
- Hollnagel, E. Human Reliability Analysis: Context and Control; Academic Press: London, UK, 1993; ISBN 0-12-352658-2. [Google Scholar]
- Reason, J. Human Error; Cambridge University Press: Cambridge, UK, 1990; ISBN 9780521314190. [Google Scholar]
- Hollnagel, E.; Bye, A. Principles for modelling function allocation. Int. J. Hum. Comput. Stud. 2000, 52, 253–265. [Google Scholar] [CrossRef]
- Sharit, J. Allocation of functions. In Handbook of Human Factors and Ergonomics; Salvendy, G., Ed.; Wiley: New York, NY, USA, 1998. [Google Scholar]
- Fitts, P.M. (Ed.) Human Engineering for an Effective Air Navigation and Traffic Control System; National Research Council: Washington, DC, USA, 1951. [Google Scholar]
- Clegg, C. Appropriate technology for humans and organizations. J. Inf. Technol. 1988, 3, 133–146. [Google Scholar] [CrossRef]
- Vagia, M.; Transeth, A.A.; Fjerdingen, S.A. A literature review on the levels of automation during the years. What are the different taxonomies that have been proposed? Appl. Ergon. 2016, 53, 190–202. [Google Scholar] [CrossRef] [PubMed]
- Lee, J.D.; Seppelt, B.D. Human Factors and Ergonomics in Automation Design. In Handbook of Human Factors and Ergonomics: Fourth Edition; John Wiley & Sons: Hoboken, NJ, USA, 2012. [Google Scholar]
- de Winter, J.C.F.; Dodou, D. Why the Fitts list has persisted throughout the history of function allocation. Cogn. Technol. Work 2014, 16, 1–11. [Google Scholar] [CrossRef]
- Saeed, A.; de Lemos, R.; Anderson, T. On the safety analysis of requirements specifications for safety-critical software. ISA Trans. 1995, 34, 283–295. [Google Scholar] [CrossRef]
- Simpson, A.; Stoker, J. Will it be Safe?—An Approach to Engineering Safety Requirements. In Components of System Safety; Redmill, F., Anderson, T., Eds.; Springer: London, UK, 2002; pp. 140–164. [Google Scholar]
- Ratan, V.; Partridge, K.; Reese, J.; Leveson, N. Safety analysis tools for requirements specifications. In Proceedings of the 11th Annual Conference on Computer Assurance. COMPASS ’96, Gaithersburg, MD, USA, 17–21 June 1996; pp. 149–160. [Google Scholar] [CrossRef]
- Sutcliffe, A.G.; Maiden, N.A.M. Bridging the requirements gap: Policies, goals and domains. In Proceedings of the 1993 IEEE 7th International Workshop on Software Specification and Design, Redondo Beach, CA, USA, 6–7 December 1993; pp. 52–55. [Google Scholar]
- Lauesen, S.; Kuhail, M.A. Task descriptions versus use cases. Requir. Eng. 2012, 17, 3–18. [Google Scholar] [CrossRef]
- Lauesen, S. Task Descriptions as Functional Requirements. IEEE Softw. 2003, 20, 58–65. [Google Scholar] [CrossRef]
- Lauesen, S. Problem-Oriented Requirements in Practice—A Case Study. In Requirements Engineering: Foundation for Software Quality; Kamsties, E., Horkoff, J., Dalpiaz, F., Eds.; Springer International Publishing: Cham, Switzerland, 2018; pp. 3–19. [Google Scholar]
- Beckers, K.; Faßbender, S.; Heisel, M.; Paci, F. Combining Goal-Oriented and Problem-Oriented Requirements Engineering Methods. In Availability, Reliability, and Security in Information Systems and HCI; Cuzzocrea, A., Kittl, C., Simos, D.E., Weippl, E., Xu, L., Eds.; Springer: Berlin/Heidelberg, Germany, 2013; pp. 178–194. [Google Scholar]
- Chung, L.; Nixon, B.A.; Yu, E.; Mylopoulos, J. Non-Functional Requirements in Software Engineering; Springer: Boston, MA, USA, 2000; ISBN 978-1-4613-7403-9. [Google Scholar]
- Marew, T.; Lee, J.-S.; Bae, D.-H. Tactics based approach for integrating non-functional requirements in object-oriented analysis and design. J. Syst. Softw. 2009, 82, 1642–1656. [Google Scholar] [CrossRef]
- De Winter, J.; Van Leeuwen, P.; Happee, R. Advantages and disadvantages of driving simulators: A discussion. In Measuring Behavior; Spink, A.J., Grieco, F., Krips, O.E., Loijens, L.W.S., Noldus, L.P.J.J., Zimmerman, P.H., Eds.; Noldus: Utrecht, The Netherlands, 2012; pp. 47–50. [Google Scholar]
- Stone, R. Virtual reality for interactive training: An industrial practitioner’s viewpoint. Int. J. Hum. Comput. Stud. 2001, 55, 699–711. [Google Scholar] [CrossRef]
- Weidner, F.; Hoesch, A.; Poeschl, S.; Broll, W. Comparing VR and non-VR driving simulations: An experimental user study. In Proceedings of the IEEE Virtual Reality (VR), Los Angeles, CA, USA, 18–22 March 2017; pp. 281–282. [Google Scholar] [CrossRef]
- Barn, B.S. The Sociotechnical Digital Twin: On the Gap between Social and Technical Feasibility. In Proceedings of the 2022 IEEE 24th Conference on Business Informatics (CBI), Amsterdam, The Netherlands, 15–17 June 2022; Volume 01, pp. 11–20. [Google Scholar]
- Dekker, S.W.A. Ten Questions about Human Error: A New View of Human Factors and System Safety; Lawrence Erlbaum: Mahwah, NJ, USA, 2005. [Google Scholar]
- Maclean, A.; Young, R.M.; Bellotti, V.M.E.; Moran, T.P. Questions, Options and Criteria: Elements of Design Space Analysis. Hum.-Comput. Interact. 1991, 6, 208. [Google Scholar]
- Gregoriades, A.; Sutcliffe, A. Simulation-based evaluation of an in-vehicle smart situation awareness enhancement system. Ergonomics 2018, 61, 947–965. [Google Scholar] [CrossRef]
- Looije, R.; Neerincx, M.A.; Hindriks, K.V. Specifying and testing the design rationale of social robots for behavior change in children. Cogn. Syst. Res. 2017, 43, 250–265. [Google Scholar] [CrossRef]
- Bindewald, J.M.; Miller, M.E.; Peterson, G.L. A function-to-task process model for adaptive automation system. J. Hum. Comput. Stud. 2014, 72, 822–834. [Google Scholar] [CrossRef]
- Milgram, P.; Rastogi, A.; Grodski, J.J. Telerobotic control using augmented reality. In Proceedings of the 4th IEEE International Workshop on Robot and Human Communication, Tokyo, Japan, 5–7 July 1995; pp. 21–29. [Google Scholar]
- Endsley, M.; Kaber, D. Level of automation effects on performance, situation awareness and workload in a dynamic control task. Ergonomics 1999, 42, 462–492. [Google Scholar] [CrossRef]
- Endsley, M.; Kiris, E.O. The out-of-the-loop performance problem and level of control in automation. Hum. Factors 1995, 37, 381–394. [Google Scholar] [CrossRef]
- Parasuraman, R.; Sheridan, T.B.; Wickens, C.D. A model for types and levels of human interaction with automation. IEEE Trans. Syst. Man Cybern. Part A Syst. Hum. 2000, 30, 286–297. [Google Scholar] [CrossRef]
- Riley, V. A general model of mixed-initiative human-machine systems. In Proceedings of the 33rd Annual Human Factors Society Conference, Santa Monica, CA, USA, 16–20 October 1989; pp. 124–128. [Google Scholar]
- Sheridan, T.B. Function allocation: Algorithm, alchemy or apostasy? Int. J. Hum. Comput. Stud. 2000, 52, 203–216. [Google Scholar] [CrossRef]
- Dutoit, A.H.; McCall, R.; Mistrík, I.; Paech, B. Rationale management in software engineering: Concepts and techniques. In Rationale Management in Software Engineering; Springer: Berlin/Heidelberg, Germany, 2006; ISBN 3540309977. [Google Scholar]
- Vrkljan, B.H.; Miller-Polgar, J. Advancements in vehicular technology: Potential implications for the older driver. Int. J. Veh. Inf. Commun. Syst. 2005, 1, 88–105. [Google Scholar] [CrossRef]
- Reagan, I.J.; Cicchino, J.B.; Kerfoot, L.B.; Weast, R.A. Crash avoidance and driver assistance technologies—Are they used? Transp. Res. Part F Traffic Psychol. Behav. 2018, 52, 176–190. [Google Scholar] [CrossRef]
- Green, P. Driver Interface Safety and Usability Standards: An Overview. In Driver Distraction: Theory, Effects, and Mitigation; CRC Press: Boca Raton, FL, USA, 2009. [Google Scholar]
- Mica, R. Endsley Situation Awareness. In Handbook of Human Factors and Ergonomics: Fourth Edition; Salvendy, G., Ed.; John Wiley & Sons, Inc.: Hoboken, NJ, USA, 2012; pp. 553–568. ISBN 9780470528389. [Google Scholar]
- Michon, J.A. A critical review of driver models: What do we know, what should we do? In Human Behavior and Traffic Safety; Springer: Boston, MA, USA, 1985. [Google Scholar]
- Matthews, M.L.; Bryant, D.J.; Webb, R.D.G.; Harbluk, J.L. Model for Situation Awareness and Driving: Application to Analysis and Research for Intelligent Transportation Systems. Transp. Res. Rec. J. Transp. Res. Board 2001, 1779, 26–32. [Google Scholar] [CrossRef]
- Ward, N.J. Automation of task processes: An example of intelligent transportation systems. Hum. Factors Ergon. Manuf. 2000, 10, 395–408. [Google Scholar] [CrossRef]
- Iqbal, S.T.; Horvitz, E. Notifications and awareness. In Proceedings of the ACM Conference on Computer Supported Cooperative Work—CSCW ’10, Savannah, GA, USA, 6–10 February 2010; p. 27. [Google Scholar]
- Gould, S.J.J.; Brumby, D.P.; Cox, A.L.; González, V.M.; Salvucci, D.D.; Taatgen, N.A. Multitasking and interruptions: A SIG on bridging the gap between research on the micro and macro worlds. In Proceedings of the CHI’12: CHI Conference on Human Factors in Computing Systems, Austin, TX, USA, 5–10 May 2012. [Google Scholar] [CrossRef]
- Sheehan, B.; Murphy, F.; Mullins, M.; Ryan, C. Connected and autonomous vehicles: A cyber-risk classification framework. Transp. Res. Part A Policy Pract. 2019, 124, 523–536. [Google Scholar] [CrossRef]
- Papadoulis, A.; Quddus, M.; Imprialou, M. Evaluating the safety impact of connected and autonomous vehicles on motorways. Accid. Anal. Prev. 2019, 124, 12–22. [Google Scholar] [CrossRef] [PubMed]
- Xing, H.; Qin, H.; Niu, J.W. Driver’s Information Needs in Automated Driving. In Proceedings of the International Conference on Cross-Cultural Design, Vancouver, BC, Canada, 9–14 July 2017. [Google Scholar]
- Miller, J.G. Living systems: Basic concepts. Behav. Sci. 1965, 10, 193–237. [Google Scholar] [CrossRef]
- Owsley, C.; Ball, K.; Sloane, M.E.; Roenker, D.L.; Bruni, J.R. Visual/cognitive correlates of vehicle accidents in older drivers. Psychol. Aging 1991, 6, 403–415. [Google Scholar] [CrossRef]
- Schwarz, F.; Fastenmeier, W. Augmented reality warnings in vehicles: Effects of modality and specificity on effectiveness. Accid. Anal. Prev. 2017, 101, 55–66. [Google Scholar] [CrossRef]
- Alvarez, G.A.; Cavanagh, P. The Capacity of Visual Short-Term Memory Is Set Both by Visual Information Load and by Number of Objects. Psychol. Sci. 2004, 15, 106–111. [Google Scholar] [CrossRef]
- Pammer, K.; Raineri, A.; Beanland, V.; Bell, J.; Borzycki, M. Expert drivers are better than non-expert drivers at rejecting unimportant information in static driving scenes. Transp. Res. Part F Traffic Psychol. Behav. 2018, 59, 389–400. [Google Scholar] [CrossRef]
- Gebauer, J.; Shaw, M.; Gribbins, M. Task-technology fit for mobile information systems. JIT 2010, 25, 259–272. [Google Scholar] [CrossRef]
- Dekker, S.W.A.; Hollnagel, E. Human factors and folk models. Cogn. Technol. Work 2004, 6, 79–86. [Google Scholar] [CrossRef]
- Dekker, S.W.A.; Woods, D.D. MABA-MABA or Abracadabra? Progress on Human-Automation Co-ordination. Cogn. Technol. Work 2002, 4, 240–244. [Google Scholar] [CrossRef]
- Mumford, E. The ETHICS Approach. Commun. ACM 1993, 36, 82–83. [Google Scholar] [CrossRef]
- Leonard, D.A.; Rayport, J.F. Managing Knowledge Assets, Creativity and Innovation. Harv. Bus. Rev. 1997, 75, 102–113. [Google Scholar] [CrossRef] [PubMed]
- Beyer, H.; Holtzblatt, K. Contextual Design. Interactions 1999, 6, 32–42. [Google Scholar] [CrossRef]
- Bodker, S.; Klokmose, C.N. The human-artifact model: An activity theoretical approach to artifact ecologies. Hum.-Comput. Interact. 2011, 26, 315–371. [Google Scholar] [CrossRef]
- Naikar, N.; Hopcroft, R.; Moylan, A. Work Domain Analysis: Theoretical Concepts and Methodology; Australian Government Air Operations Division, Defence Science and Technology Organisation: Melbourne, VIC, Australia, 2005. [Google Scholar]
- Praetorius, G.; Hollnagel, E.; Dahlman, J. Modelling Vessel Traffic Service to understand resilience in everyday operations. Reliab. Eng. Syst. Saf. 2015, 141, 10–21. [Google Scholar] [CrossRef]
- Saurin, T.A.; Werle, N.J.B. A framework for the analysis of slack in socio-technical systems. Reliab. Eng. Syst. Saf. 2017, 167, 439–451. [Google Scholar] [CrossRef]
- Bertelsen, O.; Bødker, S. Activity Theory. In HCI Models, Theories, and Frameworks: Toward a Multidisciplinary Science; Morgan Kaufmann Publishers: Burlington, MA, USA, 2003; pp. 291–324. [Google Scholar]
- Hollnagel, E. Cognitive Reliability and Error Analysis Method (CREAM); Elsevier: Amsterdam, The Netherlands, 1998; ISBN 9780080428482. [Google Scholar]
- Bailey, R. Human Performance Engineering: Designing High Quality Professional User Interfaces for Computer Products, Applications and Systems, 3rd ed.; Prentice Hall: Hoboken, NJ, USA, 1996. [Google Scholar]
- Robertson, S.; Robertson, J. Mastering the Requirements Process Getting Requirements Right; Pearson Education: London, UK, 2013. [Google Scholar]
- Yu, E.S.K. Modeling organizations for information systems requirements engineering. In Proceedings of the IEEE International Symposium on Requirements Engineering, San Diego, CA, USA, 6 January 1993; pp. 34–41. [Google Scholar]
- Sutcliffe, A.G.; Gregoriades, A. Automating Scenario Analysis of Human and System Reliability. IEEE Trans. Syst. Man Cybern.-Part A Syst. Hum. 2007, 37, 249–261. [Google Scholar] [CrossRef]
- Guo, Z.; Zhou, D.; Chen, J.; Geng, J.; Lv, C.; Zeng, S. Using virtual reality to support the product’s maintainability design: Immersive maintainability verification and evaluation system. Comput. Ind. 2018, 101, 41–50. [Google Scholar] [CrossRef]
- Aykent, B.; Yang, Z.; Merienne, F.; Kemeny, A. Simulation sickness comparison between a limited field of view virtual reality head mounted display (Oculus) and a medium range field of view static ecological driving simulator (Eco2). In Proceedings of the Driving Simulation Conference Europem, Paris, French, 4–5 September 2014. [Google Scholar]
- Wickens, C.D. Multiple resources and performance prediction. Theor. Issues Ergon. Sci. 2002, 3, 159–177. [Google Scholar] [CrossRef]
- Kim, S.; Dey, A.K. Simulated augmented reality windshield display as a cognitive mapping aid for elder driver navigation. In Proceedings of the 27th International Conference on Human Factors in Computing Systems—CHI 09, Boston, MA, USA, 4–9 April 2009; pp. 133–142. [Google Scholar]
- Jakus, G.; Dicke, C.; Sodnik, J. A user study of auditory, head-up and multi-modal displays in vehicles. Appl. Ergon. 2015, 46, 184–192. [Google Scholar] [CrossRef]
- Fadden, S.; Ververs, P.M.; Wickens, C.D. Costs and Benefits of Head-Up Display Use: A Meta-Analytic Approach. Proc. Hum. Factors Ergon. Soc. Annu. Meet. 1998, 42, 16–20. [Google Scholar] [CrossRef]
- Thomas, L.C.; Wickens, C.D. Eye-tracking and Individual Differences in off-Normal Event Detection when Flying with a Synthetic Vision System Display. Proc. Hum. Factors Ergon. Soc. Annu. Meet. 2004, 48, 223–227. [Google Scholar] [CrossRef]
- Prinzel, L.; Risser, M. Head-Up Displays and Attention Capture; NASA: Washington, DC, USA, 2004. [Google Scholar]
- Wickens, C.D.; Alexander, A.L. Attentional Tunneling and Task Management in Synthetic Vision Displays. Int. J. Aviat. Psychol. 2009, 19, 182–199. [Google Scholar] [CrossRef]
- Ververs, P.M.; Wickens, C.D. Head-up displays: Effects of clutter, display intensity, and display location on pilot performance. Int. J. Aviat. Psychol. 1998, 8, 377–403. [Google Scholar] [CrossRef]
- J Horrey, W.; Alexander, A.; Wickens, C. The Effects of Head-Up Display Clutter and In-Vehicle Display Separation on Concurrent Driving Performance. In Proceedings of the Human Factors and Ergonomics Society 47th Annual Meeting, Denver, CO, USA, 13–17 October 2003; pp. 1880–1884. [Google Scholar]
- Crundall, E.; Large, D.R.; Burnett, G. A driving simulator study to explore the effects of text size on the visual demand of in-vehicle displays. Displays 2016, 43, 23–29. [Google Scholar] [CrossRef]
- Yeh, M.; Merlo, J.L.; Wickens, C.D.; Brandenburg, D.L. Head Up versus Head Down: The Costs of Imprecision, Unreliability, and Visual Clutter on Cue Effectiveness for Display Signaling. Hum. Factors 2003, 45, 390–407. [Google Scholar] [CrossRef]
- DENSO. Technology to Keep People Safe Wherever They Drive; DENSO: Kariya, Japan, 2016. [Google Scholar]
- Fagerlönn, J. Urgent alarms in trucks: Effects on annoyance and subsequent driving performance. IET Intell. Transp. Syst. 2011, 5, 252–258. [Google Scholar] [CrossRef]
- Zhang, Y.; Yan, X.; Yang, Z. Discrimination of Effects between Directional and Nondirectional Information of Auditory Warning on Driving Behavior. Discret. Dyn. Nat. Soc. 2015, 2015, 1–8. [Google Scholar] [CrossRef]
- Stanley, L.M. Haptic and Auditory Interfaces as a Collision Avoidance Technique during Roadway Departures and Driver Perception of These Modalities. Ph.D. Thesis, Montana State University, Bozeman, MT, USA, 2006. [Google Scholar]
- NHTSA. Analysis of Lane Change Crashes; U.S. Department of Transportation, National Highway Traffic Safety Administration: Washington, DC, USA, 2003.
- Klauer, S.G.; Dingus, T.A.; Neale, V.; Sudweeks, J.D.; Ramsey, D.J. The Impact of Driver Inattention on Near Crash/Crash Risk: An Analysis Using the 100-Car Naturalistic Driving Study Data; U.S. Department of Transportation, National Highway Traffic Safety Administration: Washington, DC, USA, 2006.
- Ware, C. Information Visualization: Perception for Design; Elsevier Science: Amsterdam, The Netherlands, 2013; ISBN 9780123814647. [Google Scholar]
- Beggiato, M.; Pereira, M.; Petzoldt, T.; Krems, J. Learning and development of trust, acceptance and the mental model of ACC. A longitudinal on-road study. Transp. Res. Part F Psychol. Behav. 2015, 35, 75–84. [Google Scholar] [CrossRef]
- May, A.J.; Ross, T.; Bayer, S.H. Driver’s information requirements when navigating in an urban environment. J. Navig. 2003, 56, 89–100. [Google Scholar] [CrossRef]
- Endsley, M.R.; Jones, D.G. Designing for Situation Awareness: An Approach to Human-Centered Design, 2nd ed.; CRC Press: Boca Raton, FL, USA, 2012; ISBN 9781420063554. [Google Scholar]
- Biocca, F.; Owen, C.; Tang, A.; Bohil, C. Attention Issues in Spatial Information Systems: Directing Mobile Users’ Visual Attention Using Augmented Reality. J. Manag. Inf. Syst. 2007, 23, 163–184. [Google Scholar] [CrossRef]
- Mercedes-Benz. Active Blind Spot Assist; Mercedes-Benz: Stuttgart, Germany, 2016. [Google Scholar]
- Large, D.R.; Crundall, E.; Burnett, G.; Harvey, C.; Konstantopoulos, P. Driving without wings: The effect of different digital mirror locations on the visual behaviour, performance and opinions of drivers. Appl. Ergon. 2016, 55, 138–148. [Google Scholar] [CrossRef]
- Cheng, H.; Liu, Z.; Zheng, N.; Yang, J. Enhancing a Driver’s Situation Awareness using a Global View Map. In Proceedings of the 2007 IEEE International Conference on Multimedia and Expo, Beijing, China, 2–5 July 2007. [Google Scholar]
- Oh, H.J.; Ko, S.M.; Ji, Y.G. Effects of Superimposition of a Head-Up Display on Driving Performance and Glance Behavior in the Elderly. Int. J. Hum. Comput. Interact. 2016, 32, 143–154. [Google Scholar] [CrossRef]
- Petersen, H.E.; Dugas, D.J. The Relative Importance of Contrast and Motion in Visual Detection. Hum. Factors 1972, 14, 207–216. [Google Scholar] [CrossRef]
- Miucic, R. Connected Vehicles: Intelligent Transportation Systems; Springer: Cham, Switzerland, 2019. [Google Scholar]
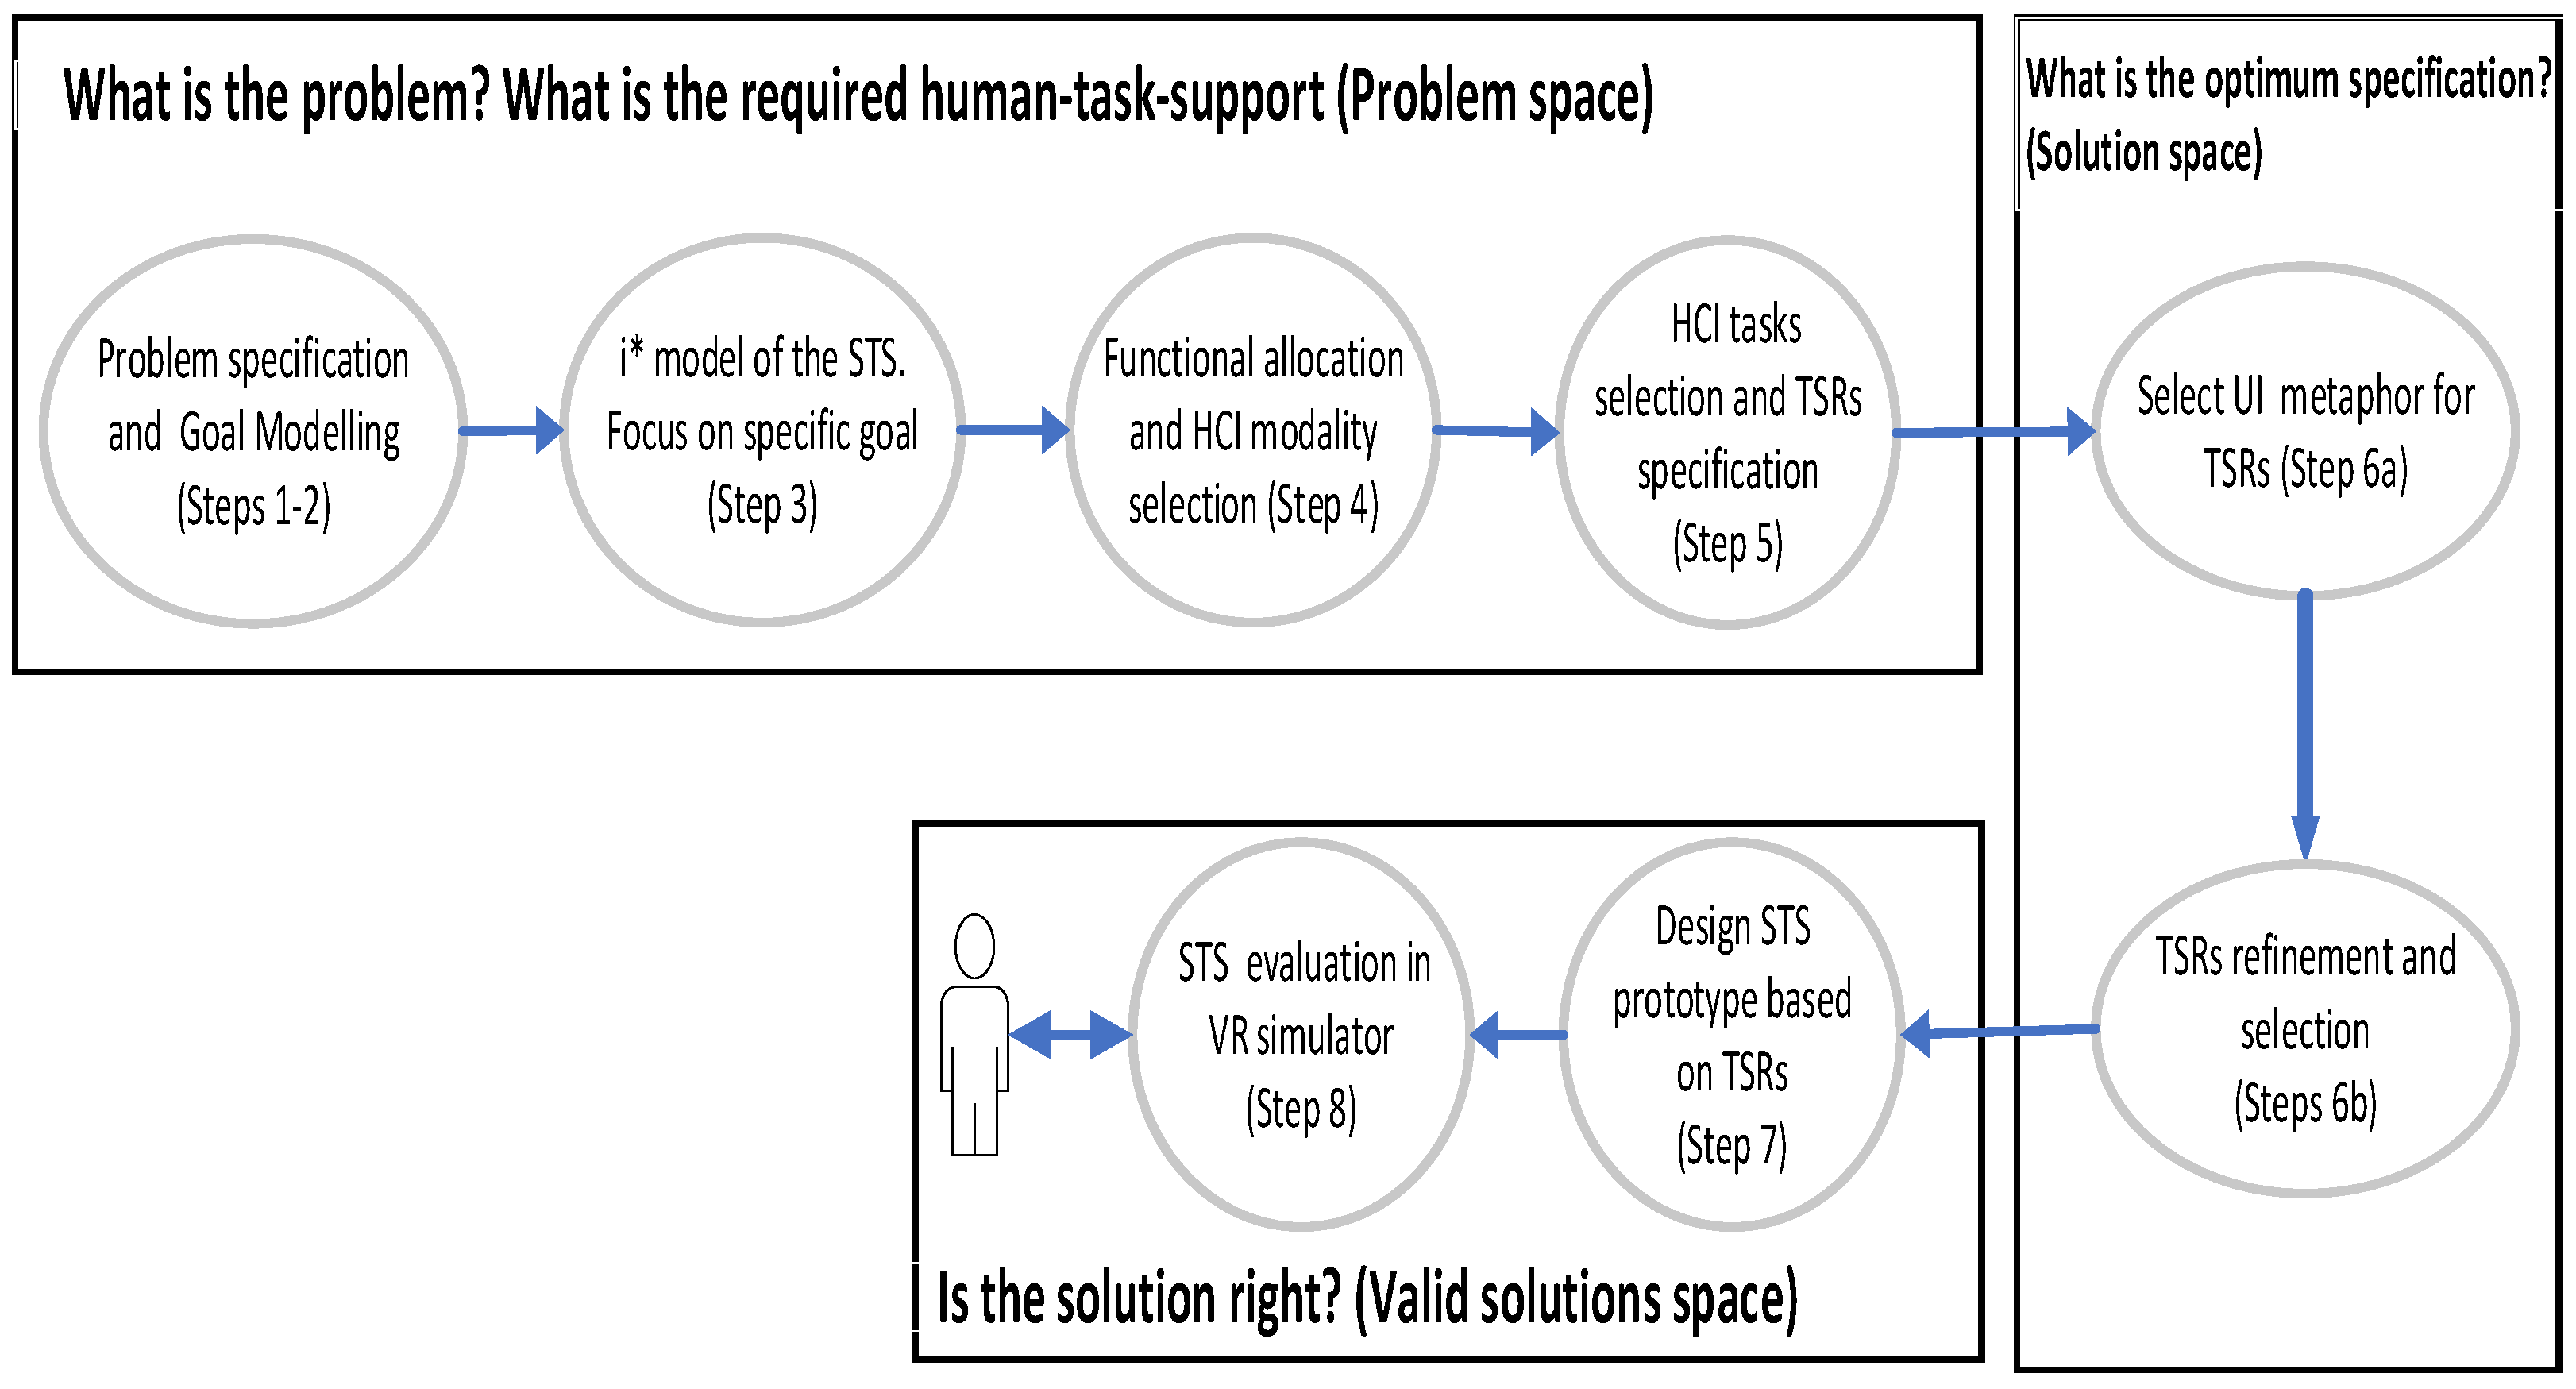
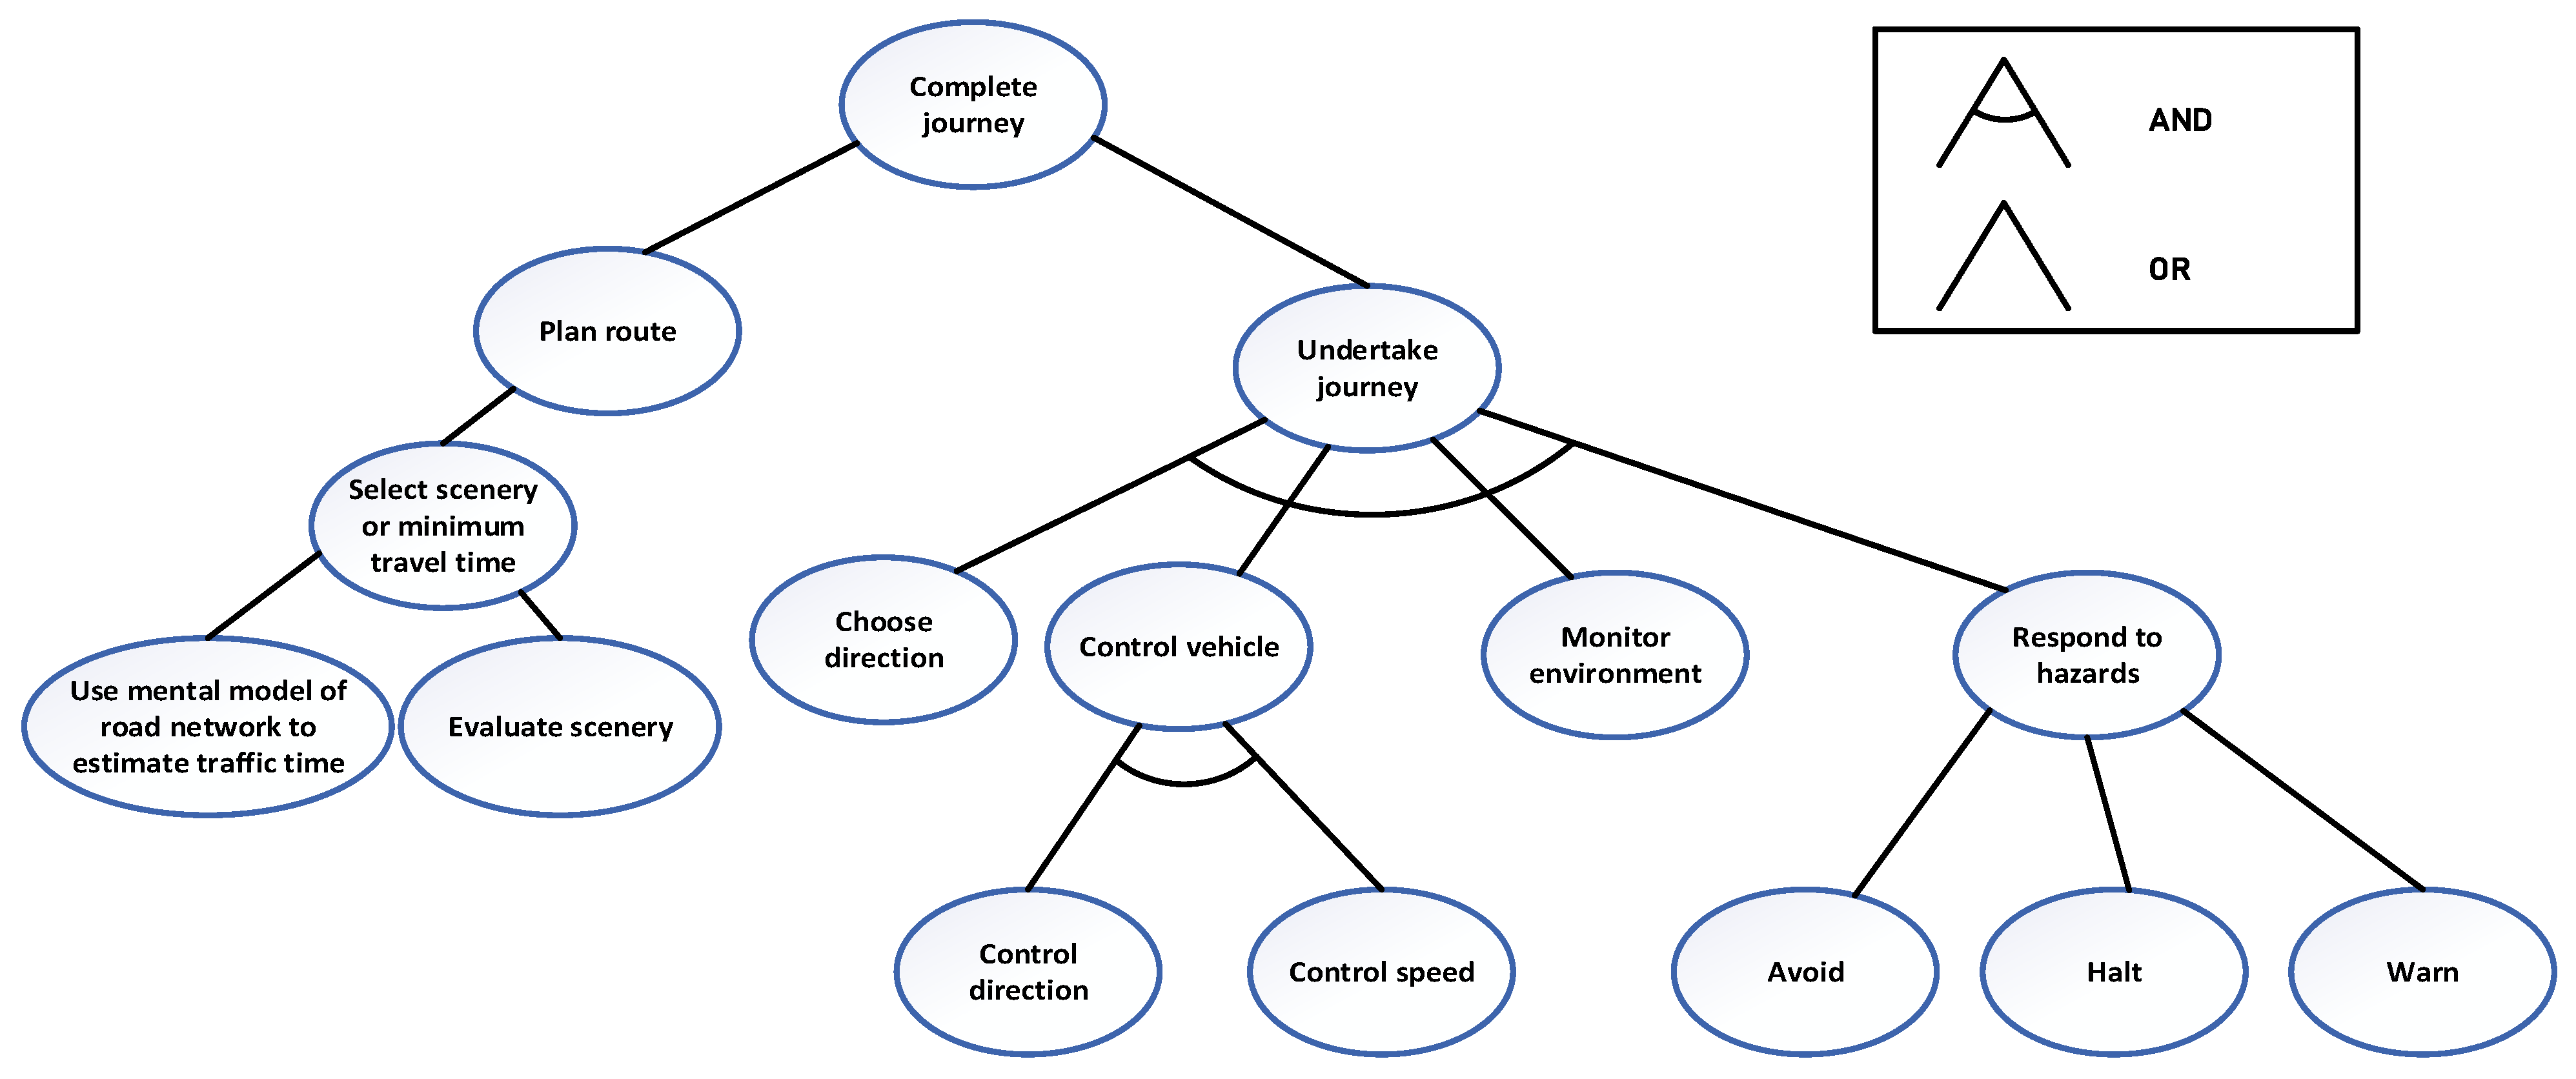
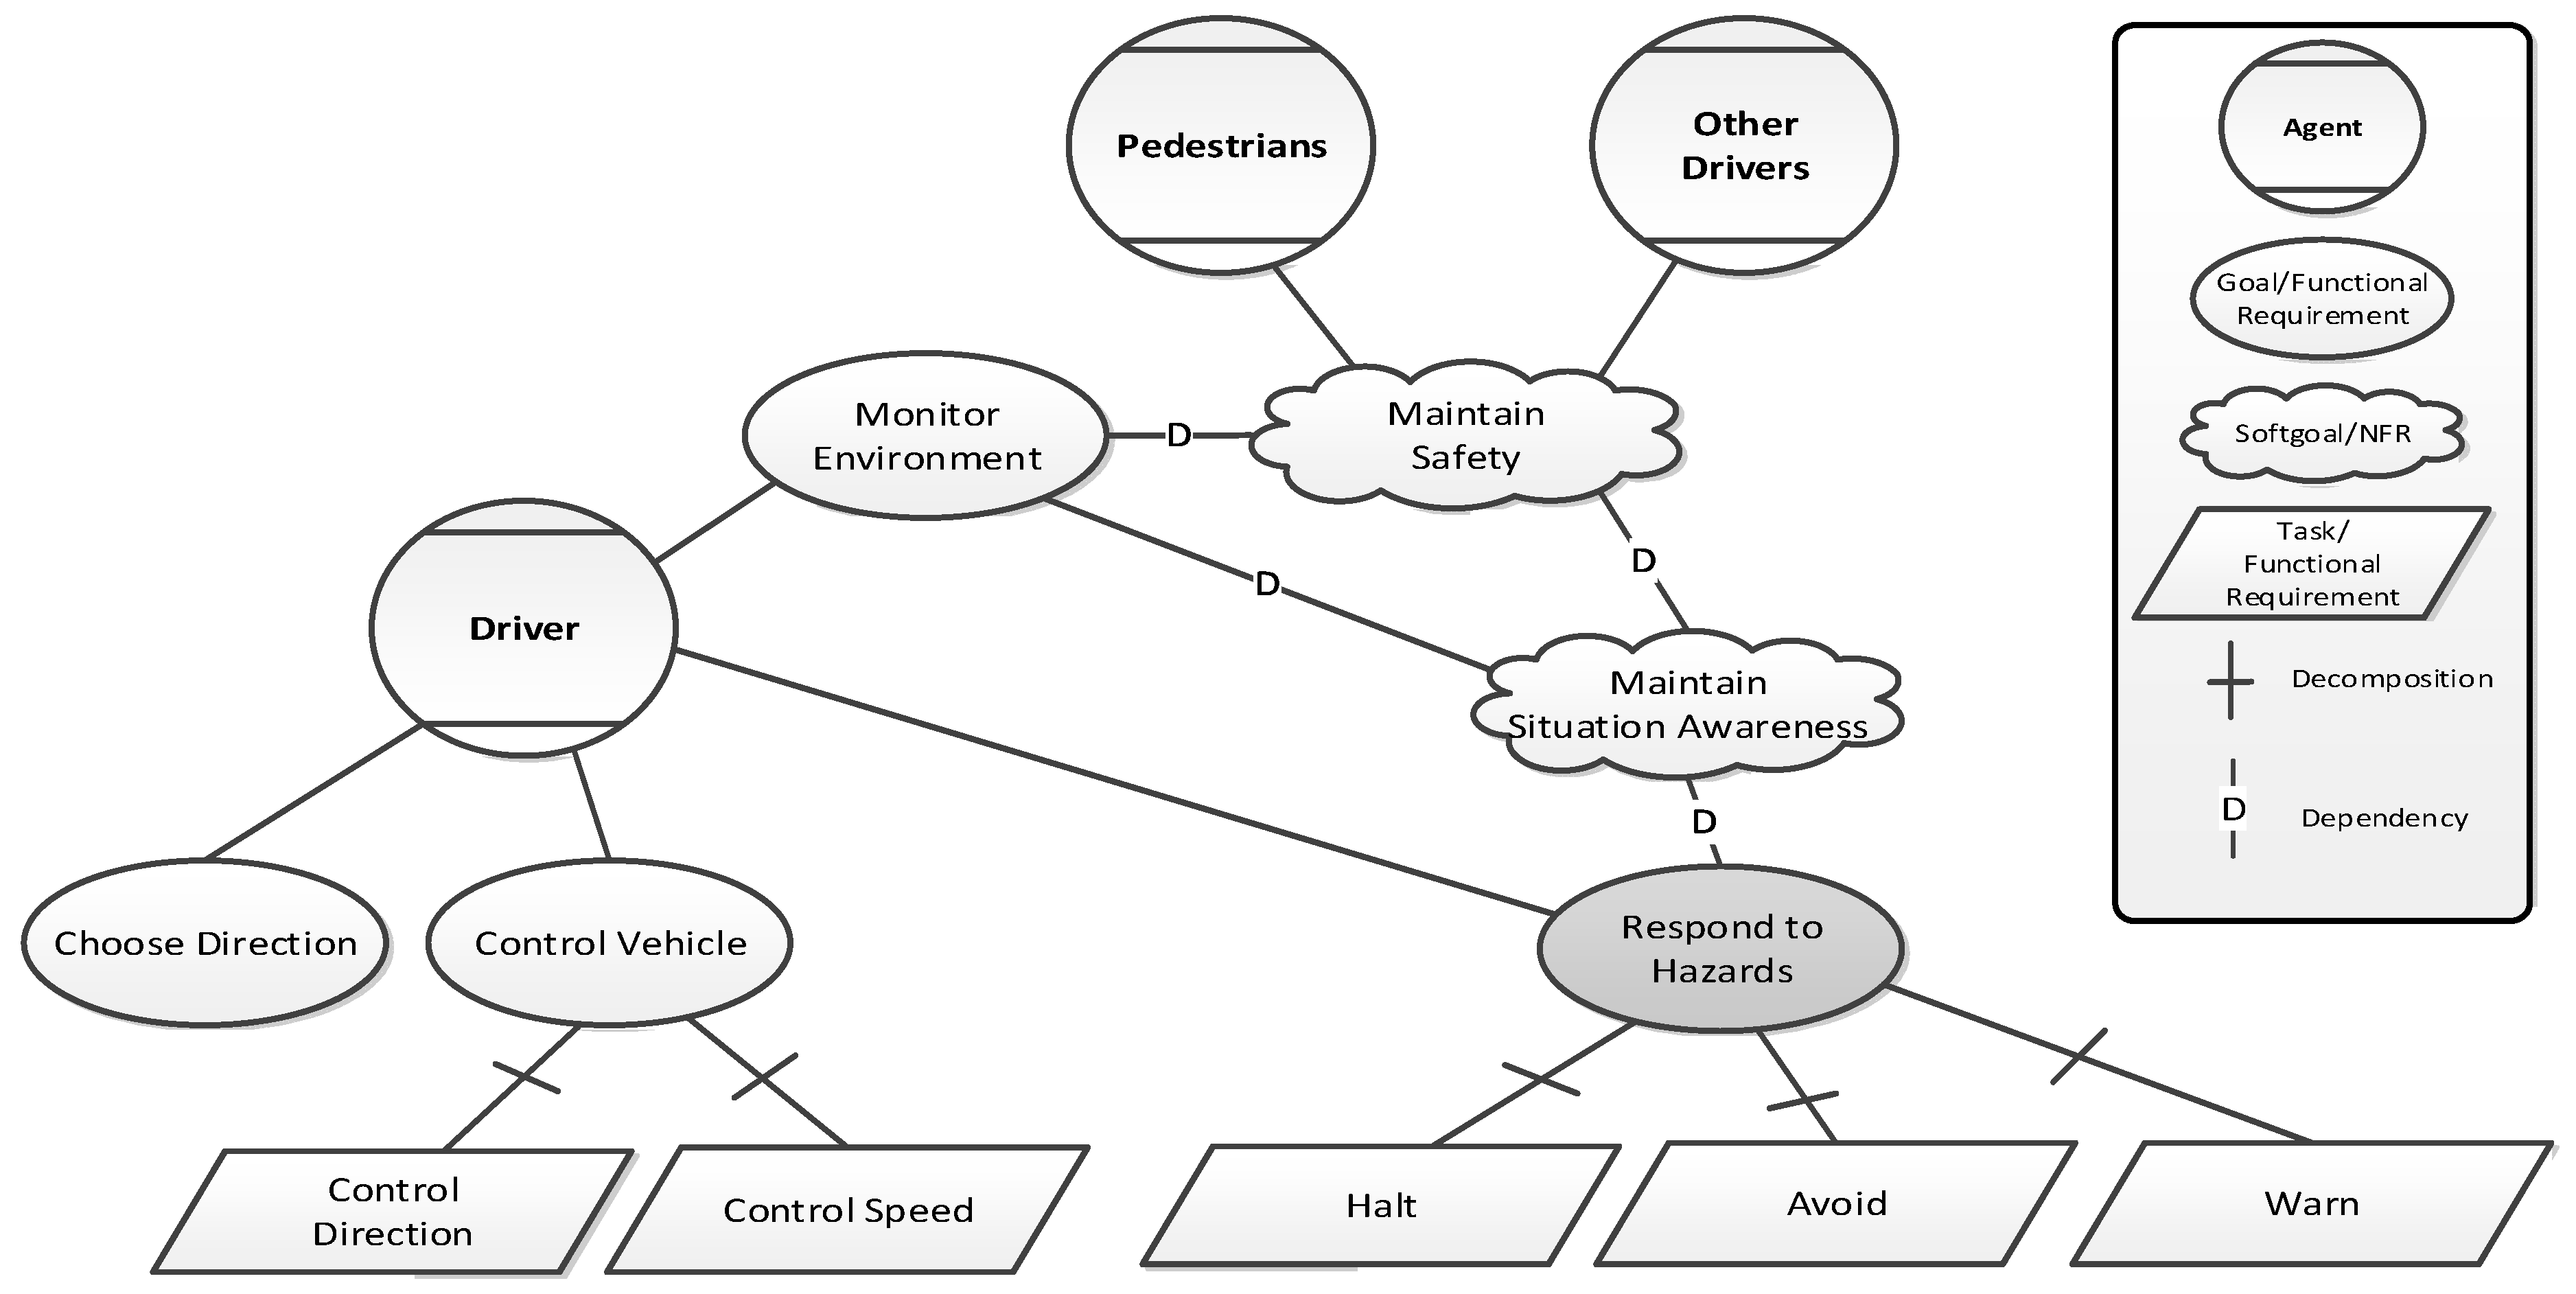
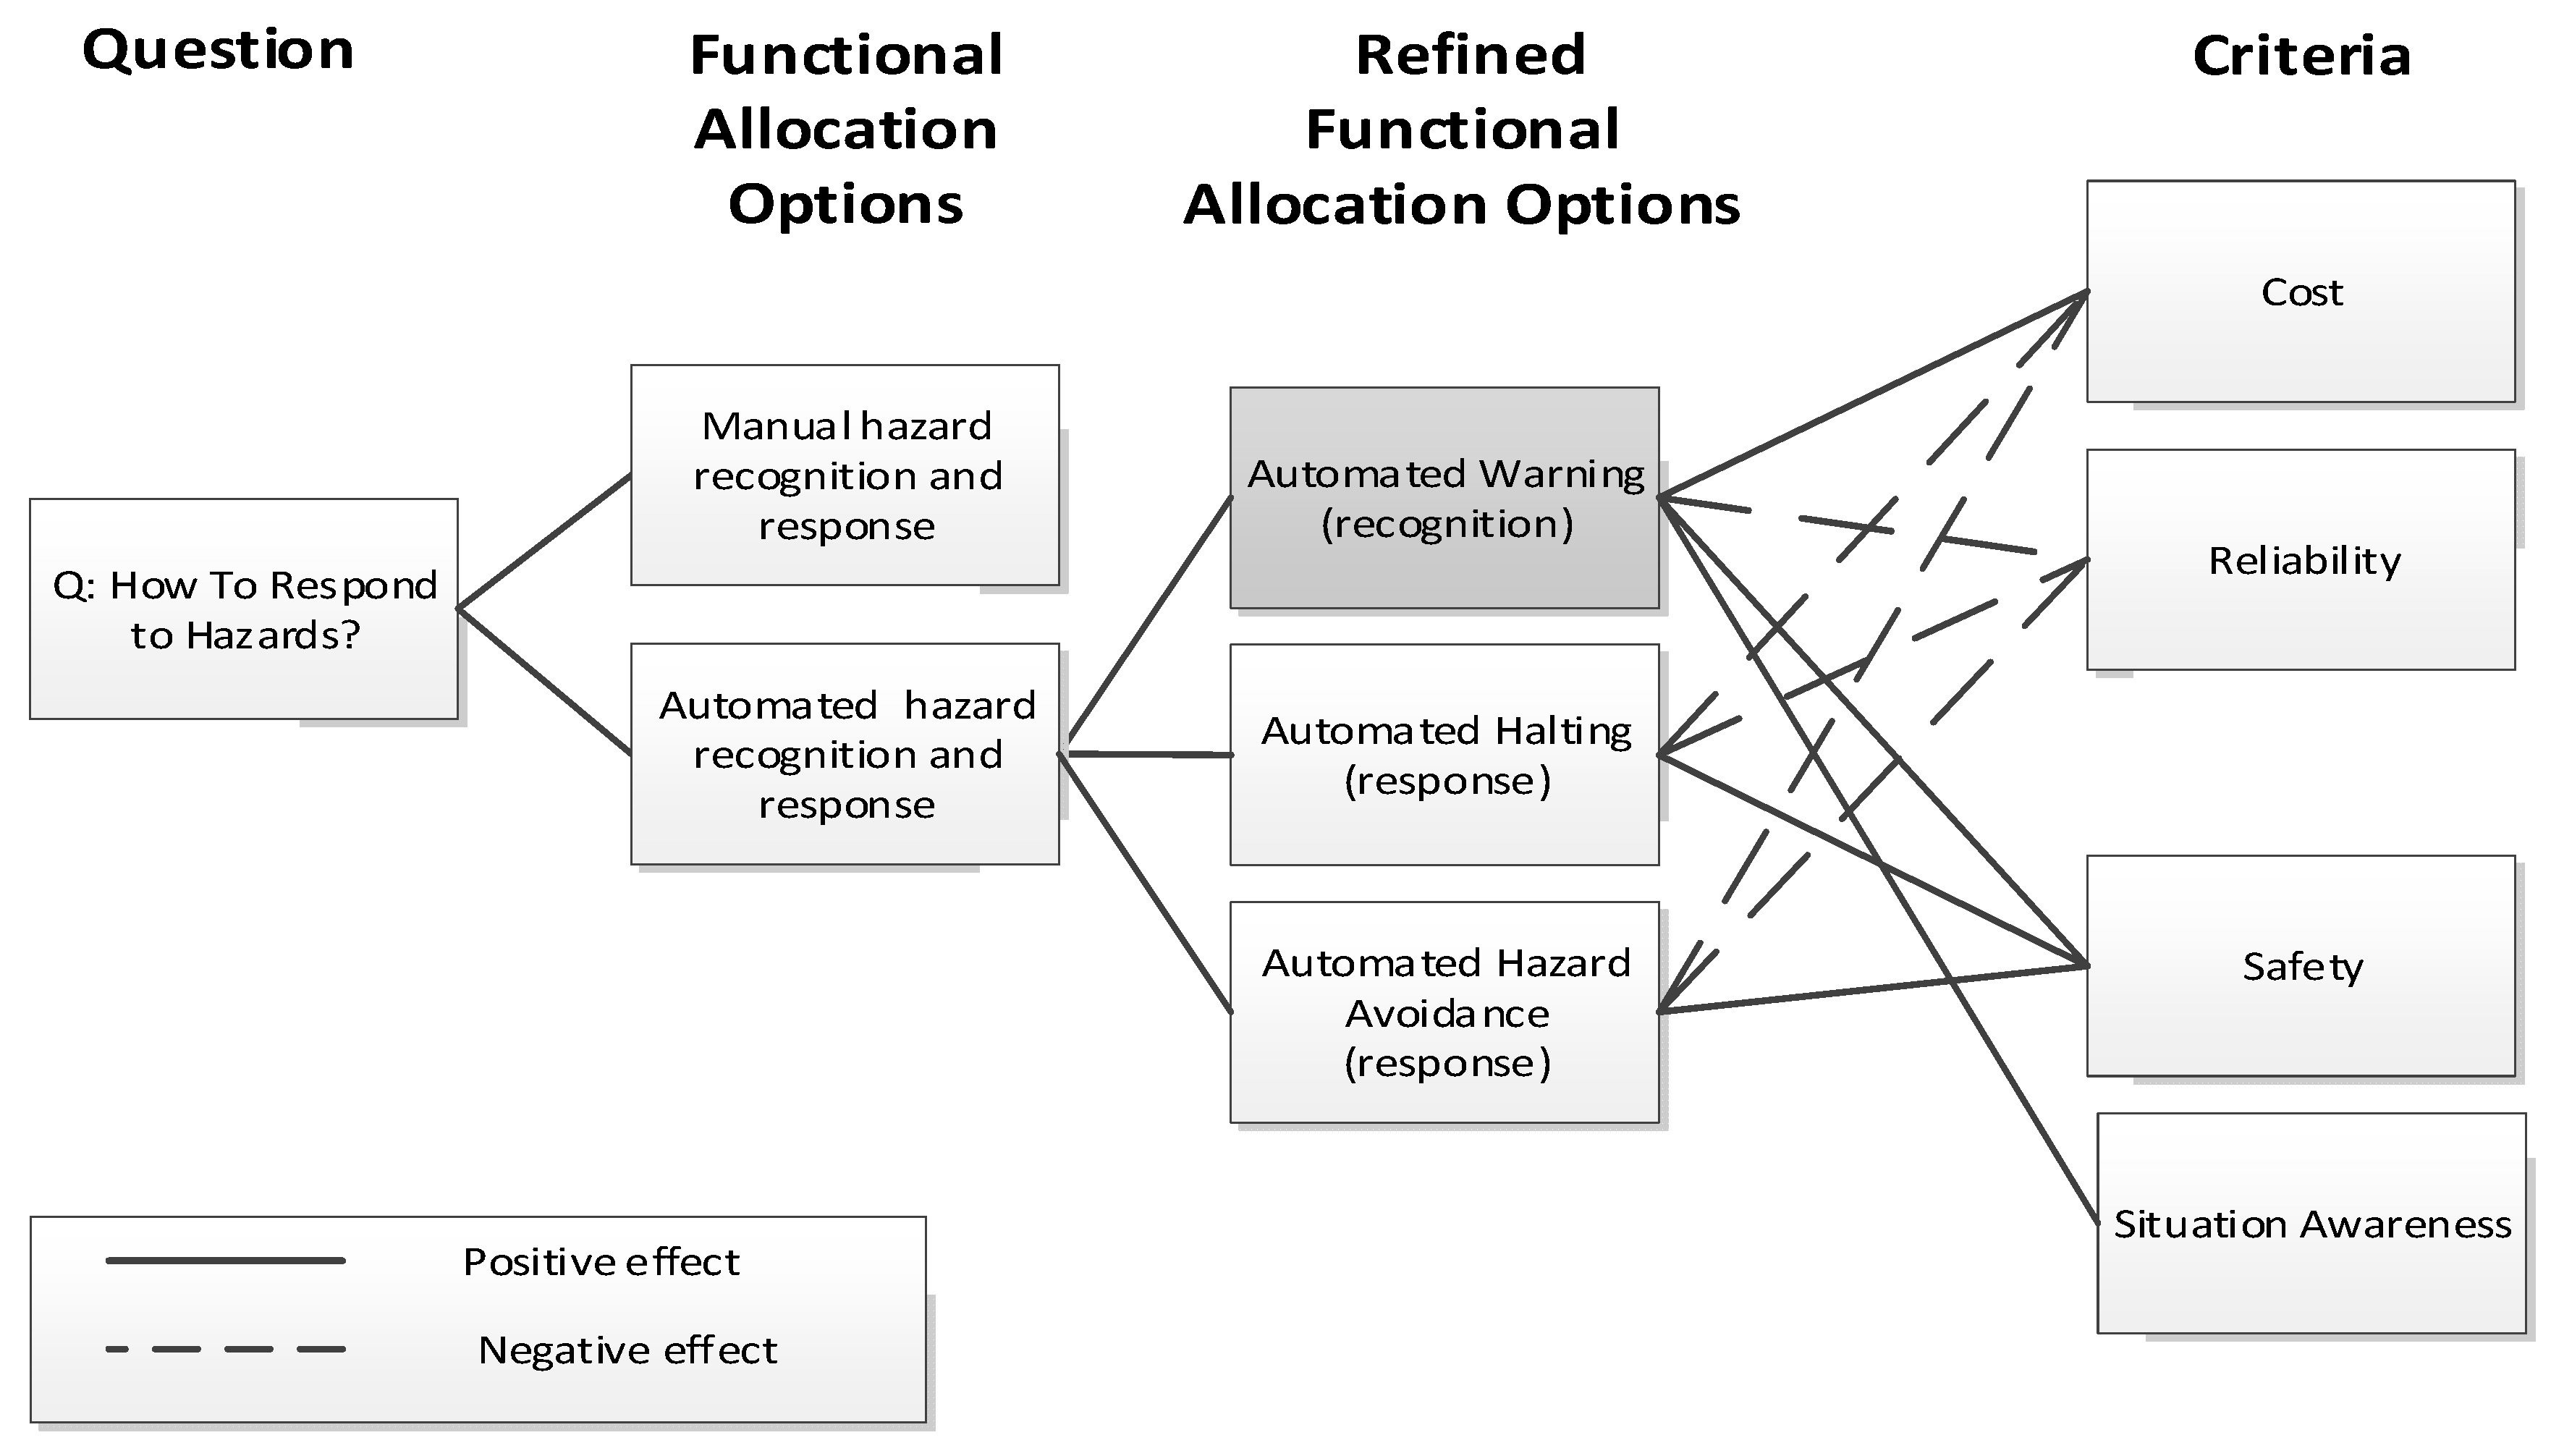
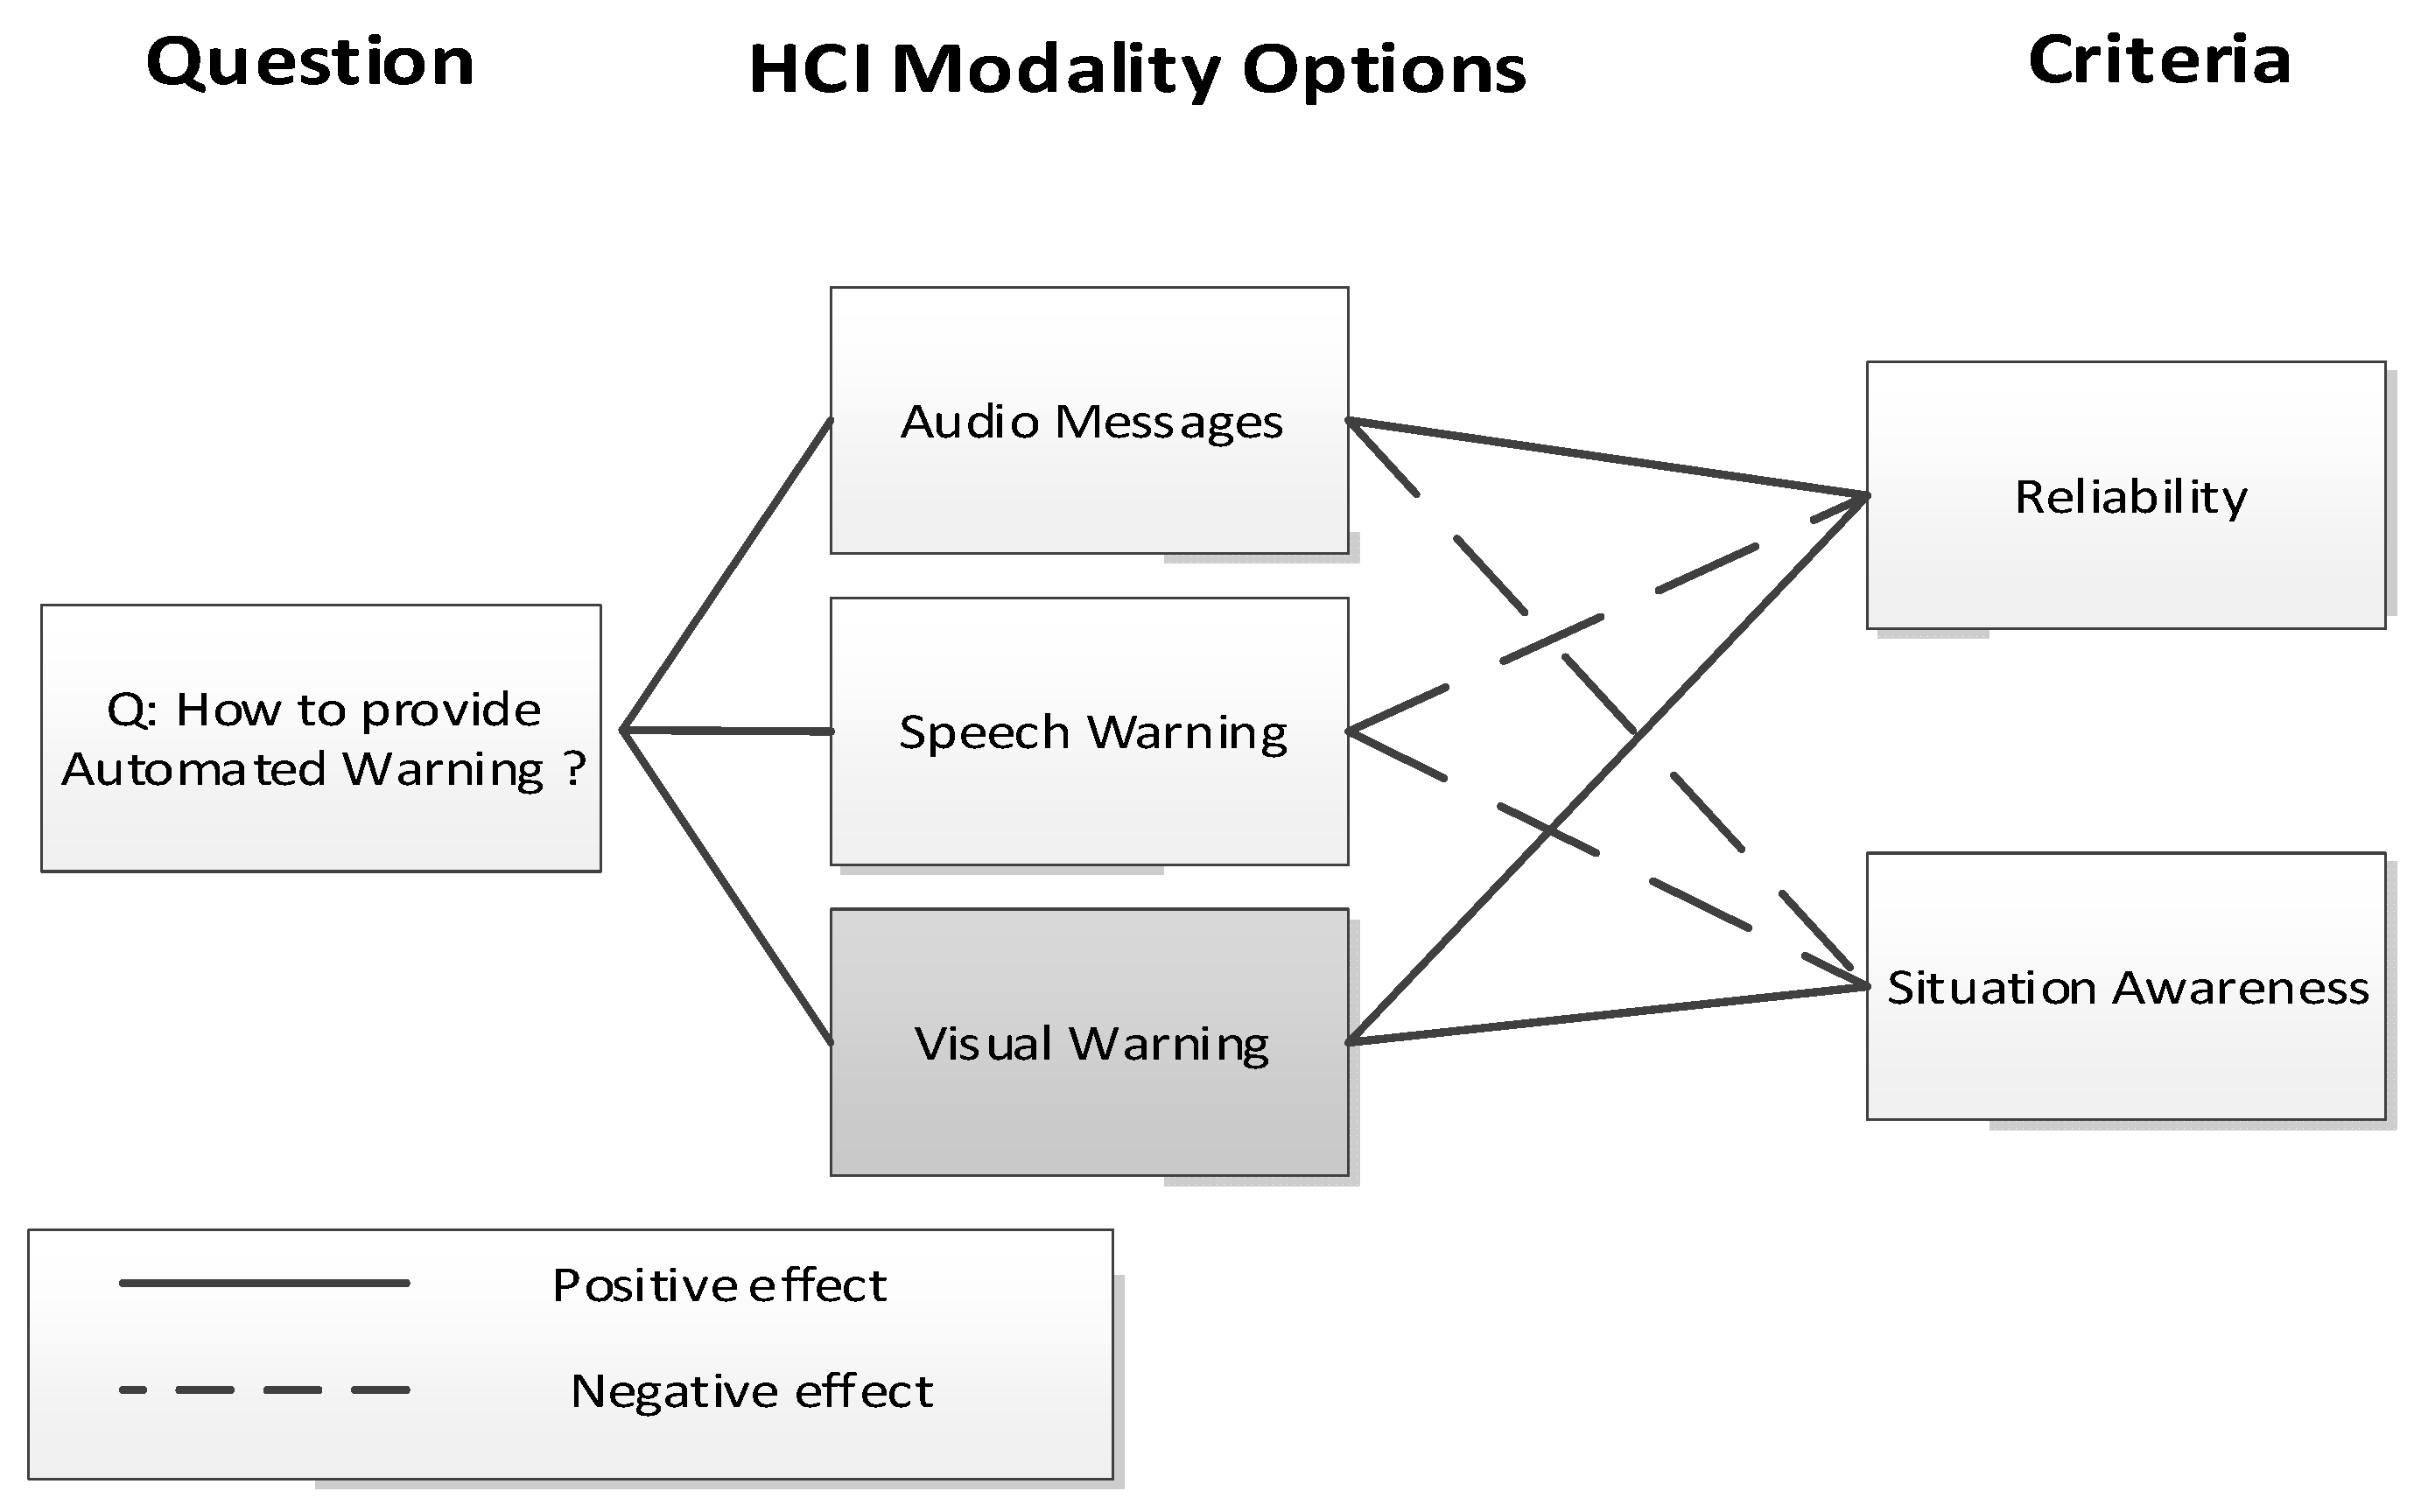
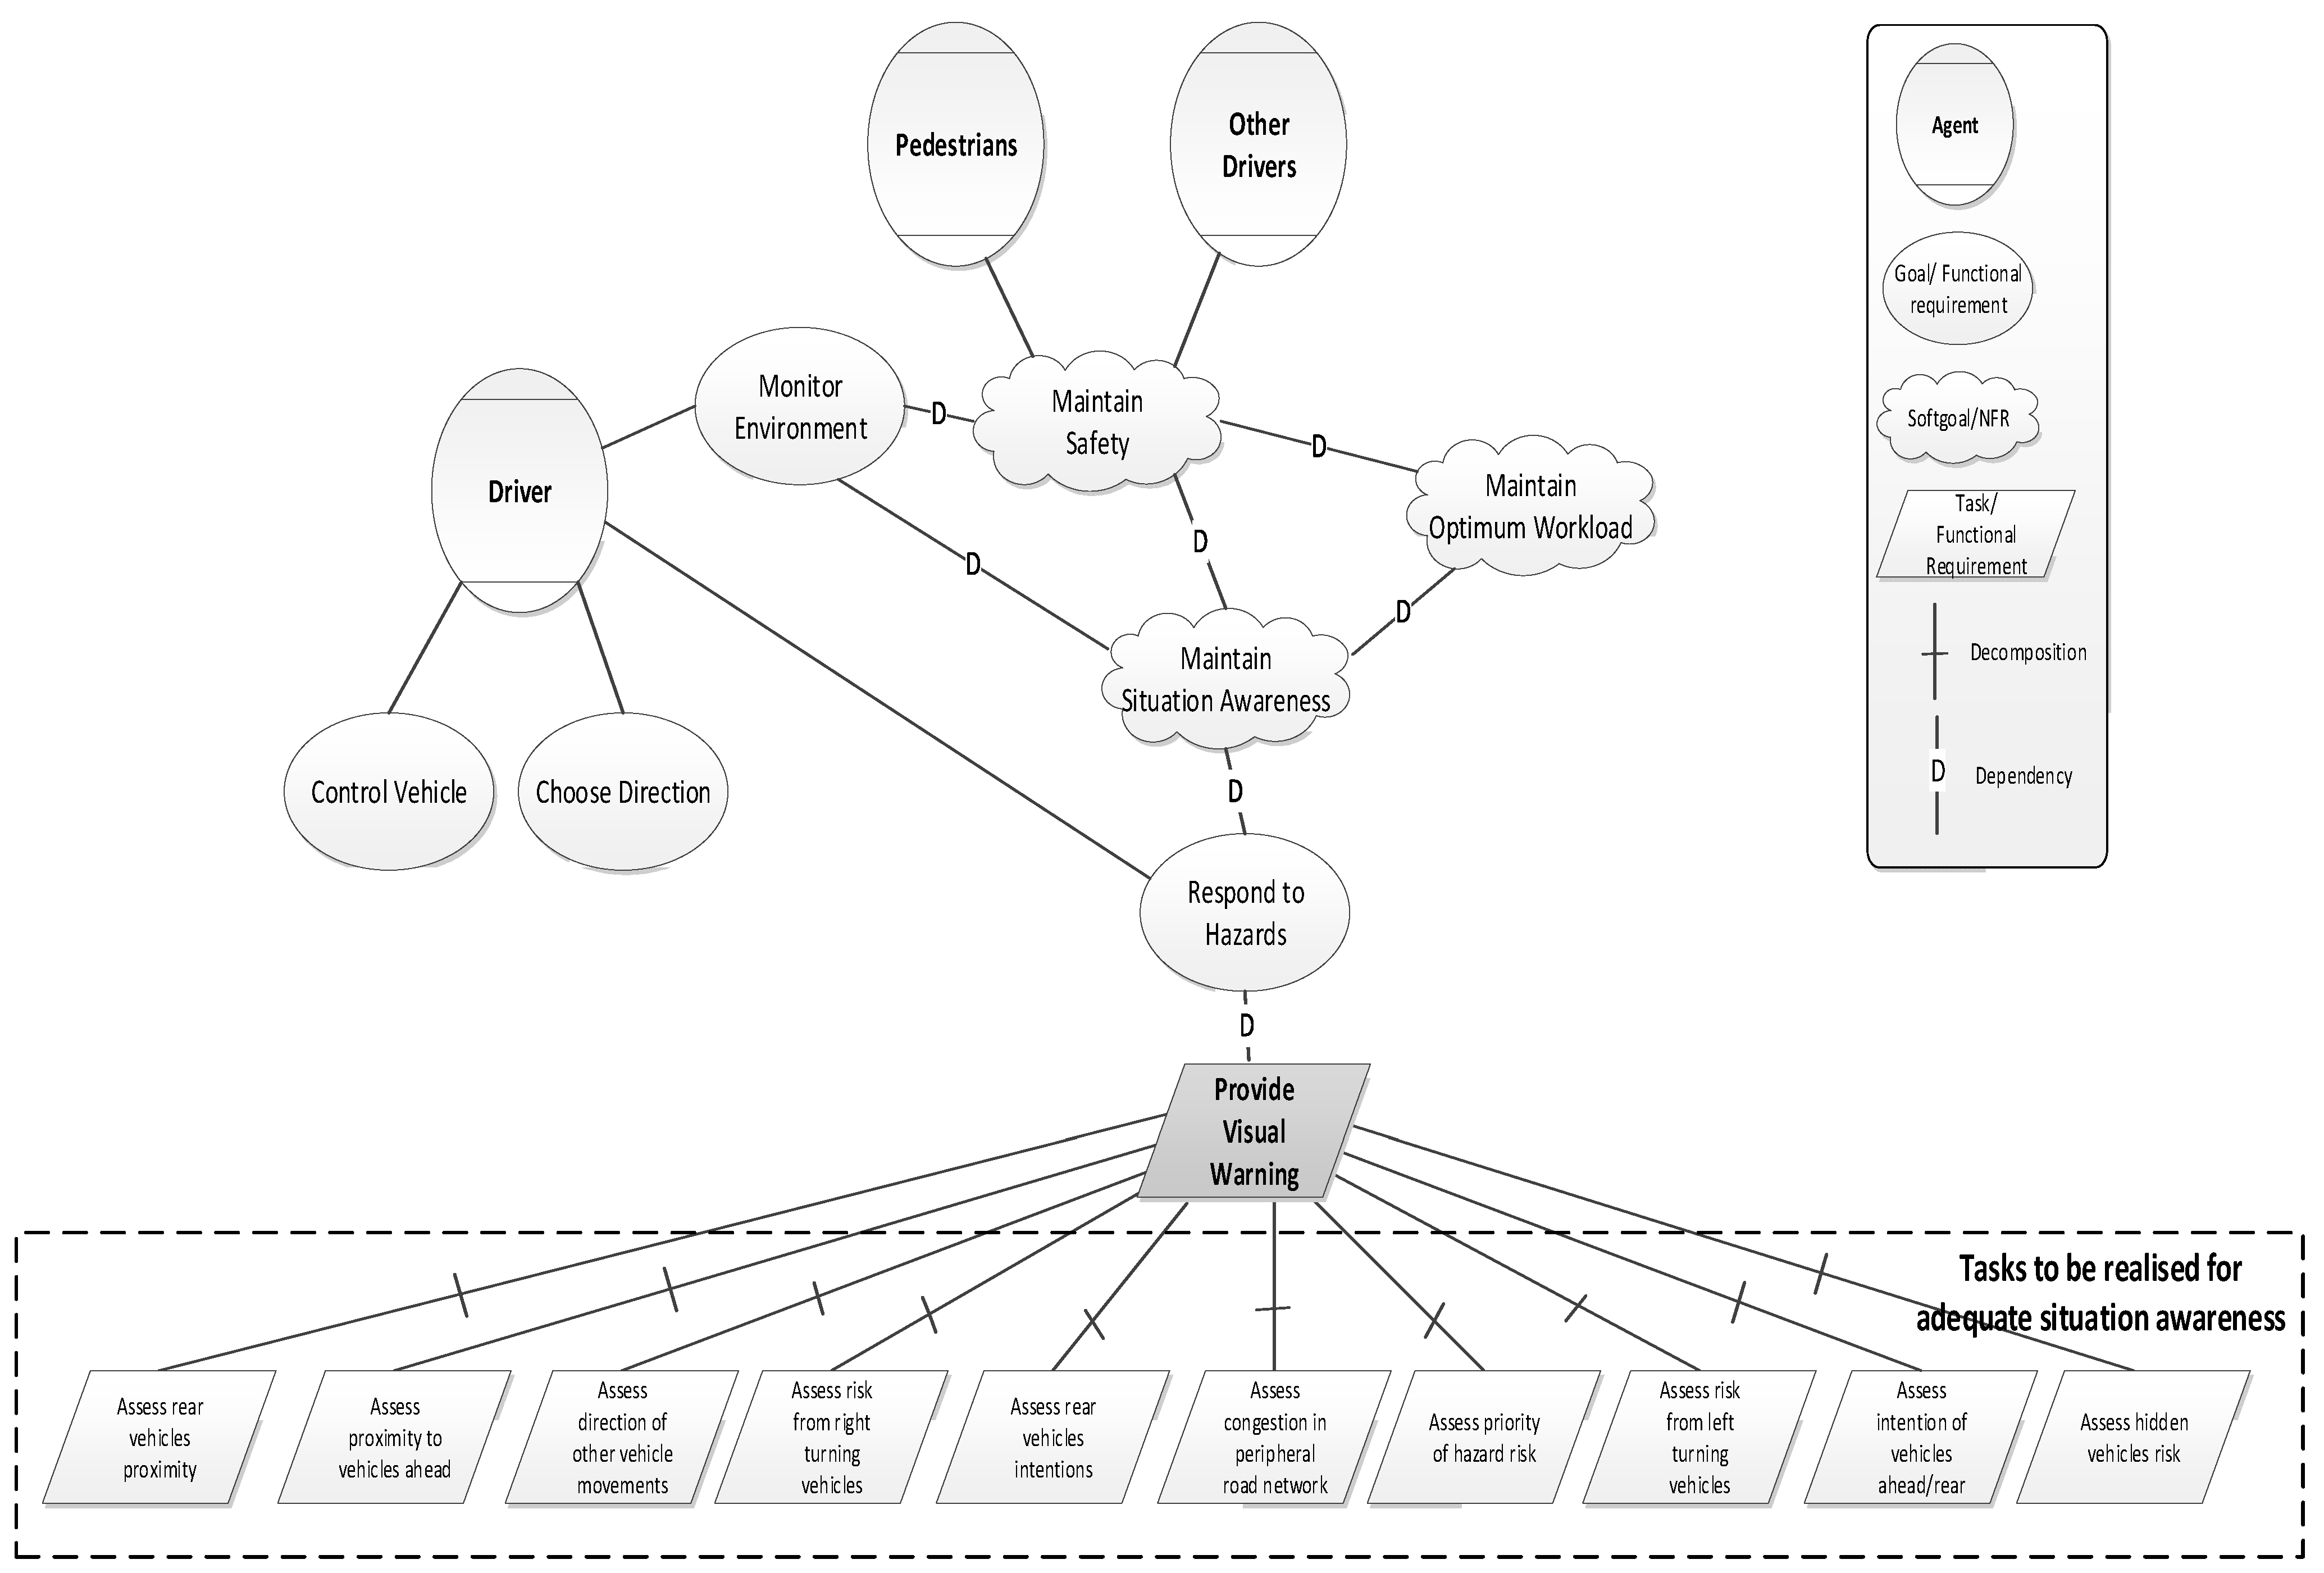
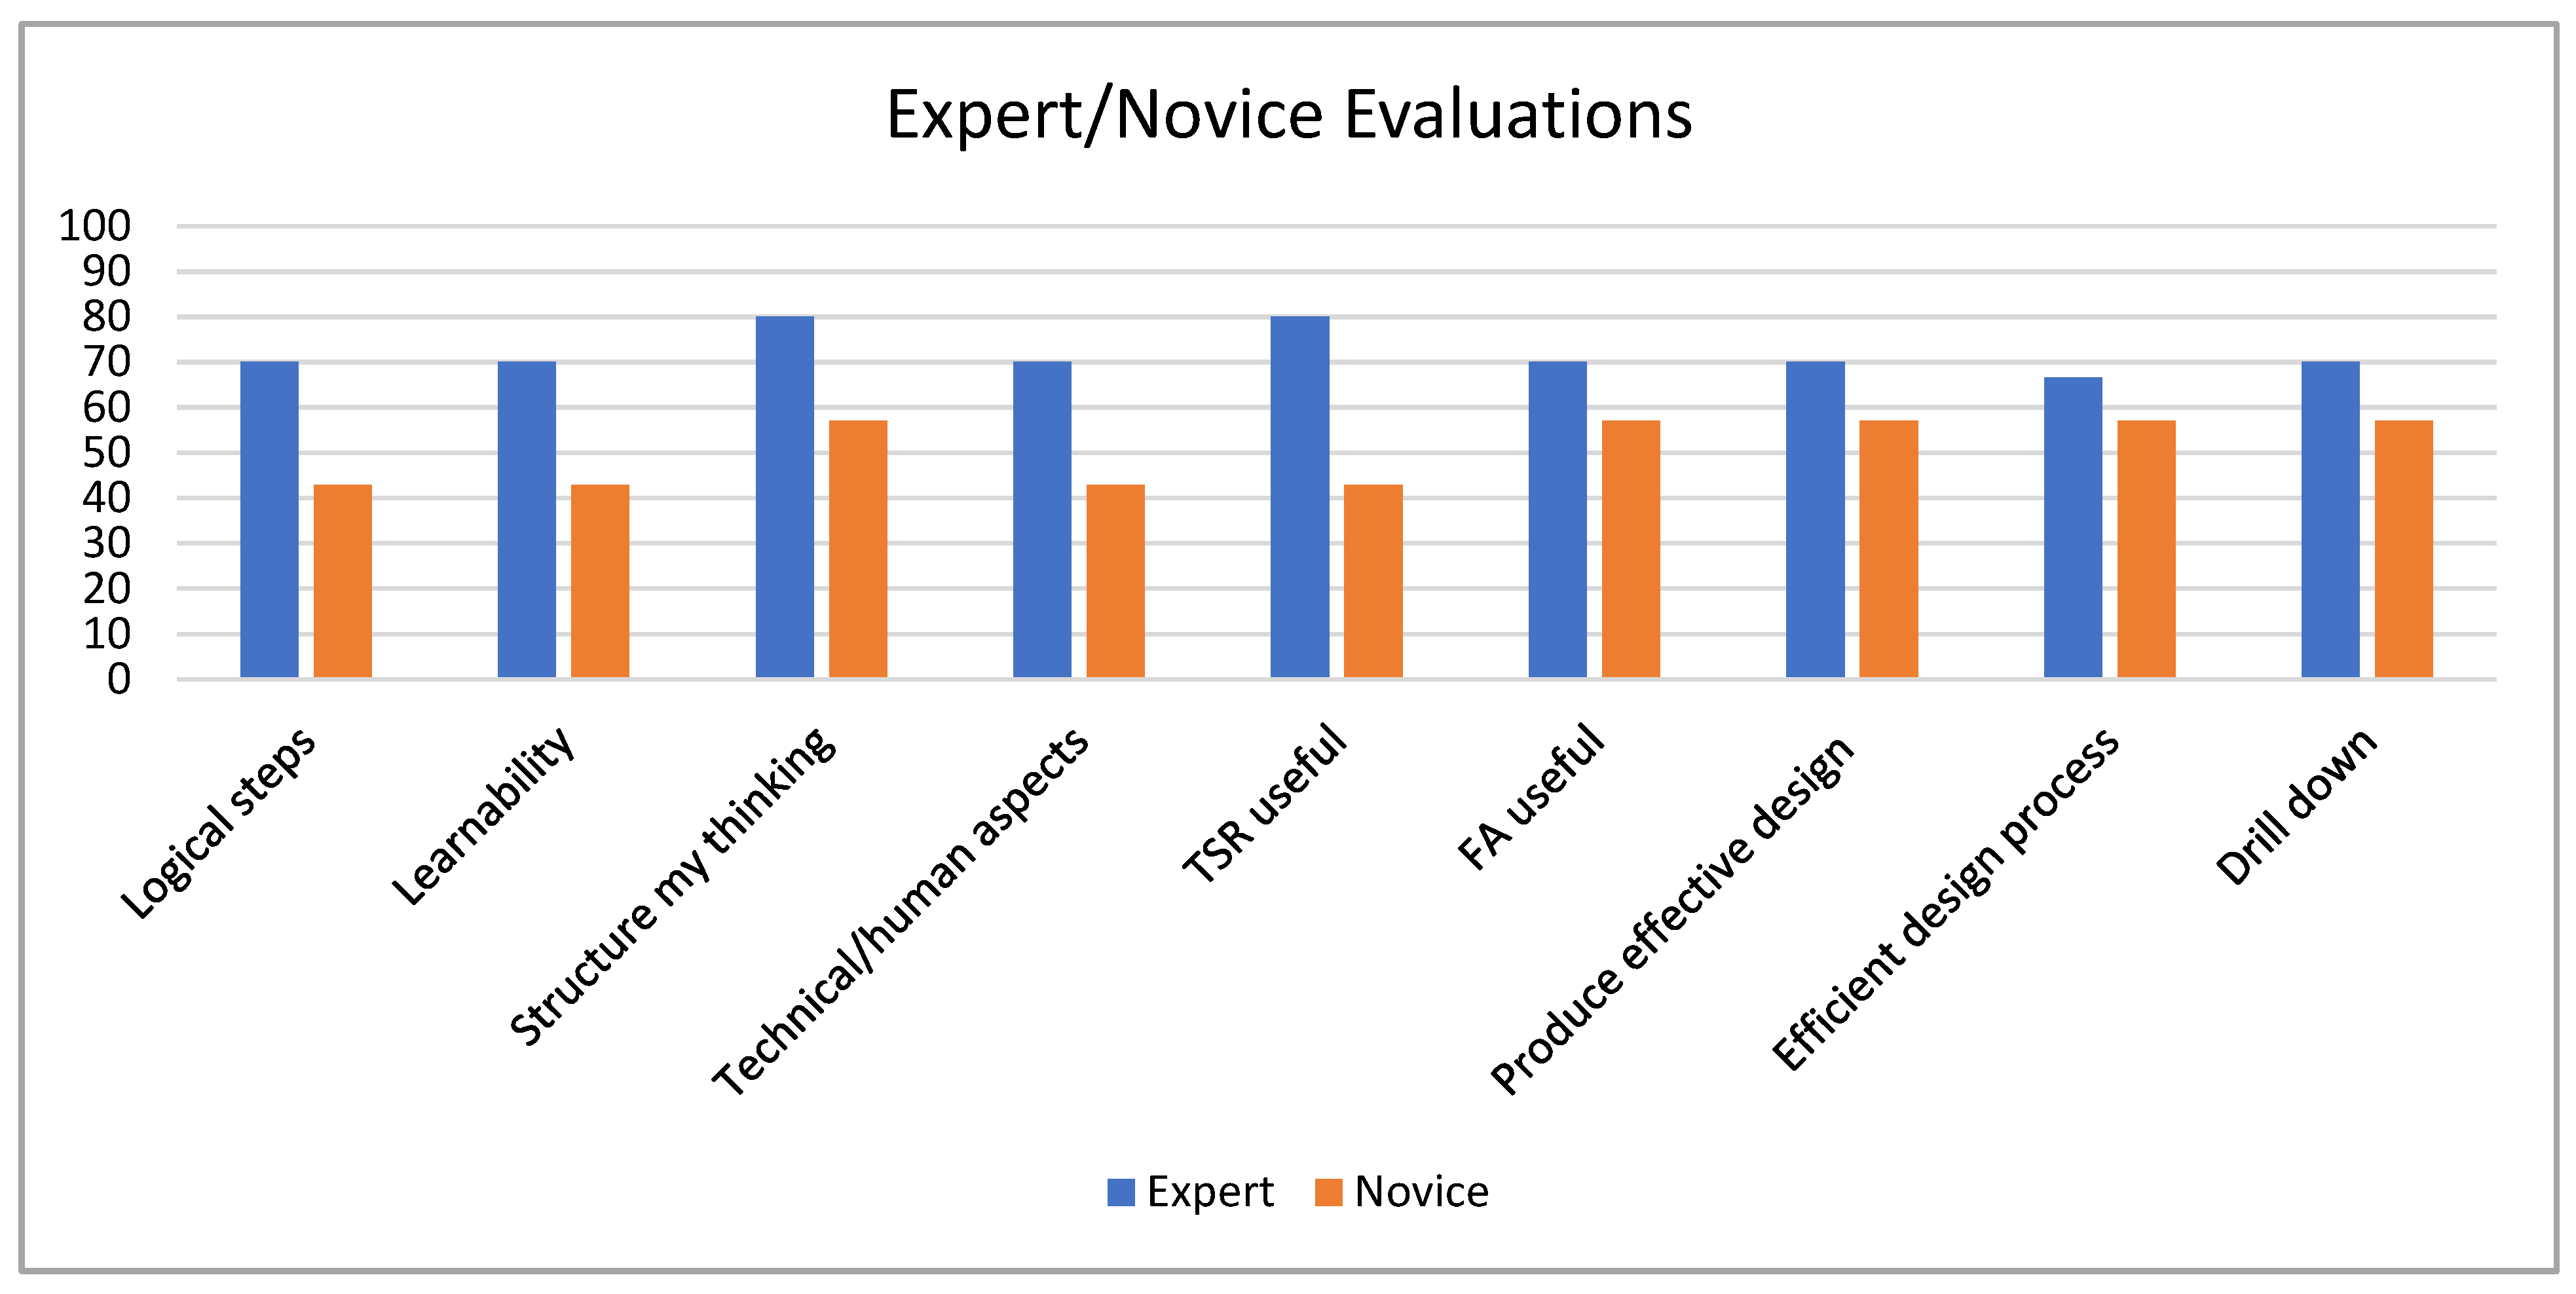
Disclaimer/Publisher’s Note: The statements, opinions and data contained in all publications are solely those of the individual author(s) and contributor(s) and not of MDPI and/or the editor(s). MDPI and/or the editor(s) disclaim responsibility for any injury to people or property resulting from any ideas, methods, instructions or products referred to in the content. |
© 2024 by the authors. Licensee MDPI, Basel, Switzerland. This article is an open access article distributed under the terms and conditions of the Creative Commons Attribution (CC BY) license (https://creativecommons.org/licenses/by/4.0/).