Abstract
The quality control of remanufactured products in a closed-loop supply chain (CLSC) can significantly influence consumers’ decision-making, and the contract coordination of CLSC has also become a research hotspot. This paper explores the quality control problem in a three-level remanufacturing CLSC consisting of a remanufacturer, a retailer, and a recycler by constructing a system dynamics (SD) model, which contains two contract schemes: quality control contract and quality control–revenue-sharing contract. Subsequently, the proposed SD model is analyzed using various schemes. The findings suggest that without mandatory contracts, CLSC members are frequently unable to fulfill their quality improvement commitments. Among them, recyclers are less likely to improve quality and more prone to breaking promises. The quality control problem in CLSC can be addressed through contract coordination, and the quality control contract scheme can avoid non-compliance with quality improvement commitments. The application of the quality control–revenue-sharing combination contract scheme not only resolves the quality control issue but also promotes profit improvement in the CLSC.
1. Introduction
The rapid depletion of global resources and increasing environmental pollution have thrust recycling and remanufacturing into the spotlight [1]. Currently, the recycling and remanufacturing of waste products is considered an indispensable strategy for achieving high-quality economic development [2]. Among different approaches, the closed-loop supply chain (CLSC) is an essential means to achieve sustainable production and consumption, thereby enhancing the circular capacity of the economy through optimized supply chain design and management [3]. The CLSC is a management approach that plans, controls, and coordinates the entire life cycle of a product with the primary objectives of value recovery or responsible disposal [4,5]. By coordinating the CLSC in terms of the product life cycle, the challenges of economic development can be better addressed, ultimately realizing the sustainable development of production and consumption [6]. Waste products in the CLSC can be reprocessed to achieve the same quality and performance as new products [7], thereby fulfilling the dual purpose of resource conservation and environmental protection [8].
From the perspective of governments, efforts are being made to mitigate environmental pollution and resource scarcity by advocating that manufacturing enterprises be responsible for the entire life cycle of their products and implement closed-loop management [9]. In 2022, the National Development and Reform Commission of China and other Chinese departments issued the Guiding Opinions on Accelerating the Construction of the Recycling System for Waste Materials. This document requires further improvement in the policy framework for waste material recycling by 2025 and an enhancement of resource recovery. In the United States, more than 60 million remanufactured automotive products are purchased by citizens annually, and the government actively promotes the use of remanufactured products in its vehicle fleet [10]. The proactive approach of manufacturing enterprises in the United Kingdom towards recycling and remanufacturing has resulted in an annual reduction of approximately 10 million tons of carbon dioxide emissions [11]. Furthermore, the EU’s Circular Economy Action Plan has set a target of a 70% total recycling rate for all packaging materials by 2030. By 2017, the added value generated from recycling activities such as maintenance, reuse, and recycling in the EU had reached nearly 155 billion euros. Employment associated with the circular economy also increased by 6%, significantly contributing to the overall economic development [12].
The previous studies also demonstrated that implementing the CLSC can reduce energy consumption and create more jobs [13]. Since 2010, Gree has invested over 2 billion CNY in constructing a green supply chain. By 2022, Gree had recycled over 46.7 million waste household appliances and recovered approximately 700,000 tons of recycled copper, iron, and plastics from them. These recycled materials equate to approximately 1.8 million tons of reduced crude oil, mineral, and other resource mining and approximately 2.3 million tons of reduced carbon emissions, providing significant resource and environmental benefits [14]. In 2020, Huawei collaborated with JD and the AIHUISHOU platform to initiate long-term trade-in activities [15]. BMW, Land Rover, Jaguar, and other companies have authorized ZF Sales Service (China) for transmission remanufacturing [16]. Additionally, the remanufacturing of mechanical parts and automotive engines for the Chinese market is undertaken by Caterpillar’s dealer, Lei Shing Hong Machinery (Shanghai) [17].
Nonetheless, the quality of remanufactured products still poses a great challenge. Quality control is becoming more important in the management of industrial enterprises globally. Toyota, a Japanese manufacturing company, has taken the lead in applying the concept of quality control management in Japan. This concept has facilitated the efficiency of enterprise management and improved production efficiency, laying a foundation for the scientific management of enterprises. The US Federal Aviation Administration issued a statement on 28 February 2024, mandating Boeing to formulate a comprehensive action plan within 90 days to address its systemic quality control issues and ensure strict control and supervision standards are implemented for its suppliers. It also requires establishing a systematic, quantifiable shift in quality control for production. The previous studies have indicated the presence of quality uncertainty in the remanufacturing process of CLSC [18], which undermines the stability and sustainability of CLSC [19]. The failure to prioritize quality control of remanufactured products may influence the pricing decisions of CLSC [20] and diminish consumers’ willingness to purchase these products [21], thereby affecting the overall profitability of the CLSC. Moreover, the quality uncertainty within CLSC operations exacerbates the difficulty of formulating regulatory policies [22], hindering the daily management of CLSC. In recent years, research on quality control has focused on new product manufacturing [23] and information quality [24], with most studies emphasizing a single member of the CLSC [25]. Consequently, limited investigations have been conducted regarding the quality control for all participating members within CLSC. Therefore, this study aims to examine all-member and whole-process quality control in the context of CLSC.
Contract coordination within the CLSC is essential to promote the healthy development of supply chains [26]. Effective contract coordination can resolve conflicts among supply chain members, prevent the risk of supply chain disruption, and foster the stable and sustainable growth of CLSC. To date, the previous studies have explored various contracts, such as revenue-sharing and cost-sharing, in the context of CLSC [27,28], while limited attention has been paid to the research perspective of combining contract coordination and quality control.
This study mainly addresses the following questions:
- In the absence of a compulsory contract in a CLSC, will members voluntarily undertake verbally committed quality improvement actions?
- Which members of the CLSC are more likely to violate quality improvement commitments?
- Can contract coordination effectively address the quality control issues in a CLSC?
- What types of contracts can be employed for CLSC coordination to promote profit growth while ensuring quality control?
Since a CLSC is a complex system, it is difficult to fully reflect its actual operation state using traditional mathematical methods such as game theory. Therefore, this study fully considers the system complexity of the CLSC, combines the evolutionary game with the system dynamics methods, and uses the simulation software Vensim DSS to closely track the daily operation mode of the supply chain. On this basis, an SD model for the remanufacturing CLSC is established to explore the quality control problems in the CLSC.
The scientific contributions of this study are manifested in the following aspects:
- A contract coordination strategy for remanufacturing CLSC is proposed by integrating contract coordination with quality control.
- The quality control scheme for CLSC from an all-member and whole-process perspective is investigated.
- The use of contracts to promote the rational allocation of profits among members and the profit growth of CLSC while implementing quality control are discussed.
This study is conducted based on the aforementioned contributions. Section 2 reviews the relevant theoretical literature. Section 3 introduces the research methods, prerequisites, and SD model modeling process. Section 4 presents the simulation results of the SD model and compares different contract schemes. Section 5 outlines the conclusions, managerial implications, and future research directions.
2. Literature Review
2.1. Quality Control
With the rapid social and economic development and the significant improvement in people’s living standards, the shopping concepts and preferences of consumers are changing profoundly. Customer attitudes have shifted from pursuing low prices of products to emphasizing product quality, safety, environmental protection, and the social responsibility behind brands. This shift not only reflects the awakening and maturity of consumer consciousness but also raises standards and requirements for the production and operation modes of enterprises. An in-depth study conducted by Fu et al. revealed this trend, indicating that consumers are no longer limited to price alone but prefer those that can provide excellent quality and favorable usage experience [29].
In this context, if enterprises intend to distinguish themselves in a competitive marketplace and win the trust and loyalty of consumers, they must elevate quality control to the strategic level. It implies strict adherence to quality standards throughout the production process, ensuring that every aspect of the product meets or even exceeds the expectations of consumers. It also emphasizes the integration of deep concerns for the environment, society, and consumer welfare into the entire operation system of the enterprise [30].
To more effectively achieve quality control and optimize supply chain management, both academia and industry are constantly exploring new theories and methods. Based on game theory, Chen et al. provided insights into the formulation of optimal quality control strategies in different models to maximize the profits of supply chain members [31]. This study offered theoretical support for enterprises to make scientific decisions in complex market environments and paved the way for enhancing the efficiency and competitiveness of the entire supply chain. Accorsi et al. further confirmed that consumers prefer high-quality products through empirical analysis [32]. The results showed that in an information asymmetric market environment, consumers tend to evaluate product quality based on indirect information such as brand reputation and user reviews, which, in turn, influence their purchase decisions. This finding provides important implications for enterprises to strengthen their brand building and enhance the transparency of product quality. In addition, Pareek et al. focused on the field of rework quality control and proposed that quality control can be strengthened through technology license sharing among supply chain participants [1]. This innovative concept can facilitate the market acceptance of reworked products and contribute wisdom to achieving the goal of resource circular utilization and sustainable development. Zhang et al. explored how to maximize supply chain profits while considering food quality factors in food supply chains using integer linear programming models [33]. The research findings provided practical optimization strategies for the food industry and offered beneficial references for other industries to balance quality control and profit management. Ng et al. focused on the novel fuzzy association rule mining (FARM) technology for solving quality problems and closed-loop process control [34]. They explored the efficacy of an integrated platform in identifying and solving quality problems in the supply chain, thereby enabling continuous optimization and closed-loop management of quality control processes. The results demonstrated the huge potential of information technology in supply chain management and provided new insights and tools for enterprises to strengthen quality control in their digital transformation process.
Despite the resourceful achievements in the previous studies, limited research has explored the quality control of all members and the entire process in the CLSC. Therefore, this study investigates the quality control for all members throughout the CLSC operation.
2.2. Contract Coordination
In the operation management of CLSC, contract coordination is critical in promoting cooperation among supply chain members, optimizing resource allocation, and enhancing the benefits of remanufacturing. Tang pointed out that through a reasonable contract arrangement, remanufacturing activities in CLSC can achieve more significant economic benefits, contributing to both the reduction of resource wastage and the promotion of sustainable development [35].
Currently, extensive and in-depth studies on CLSC contract coordination have been conducted, covering various types of contracts and their application scenarios. Among them, revenue-sharing contracts are a common coordination mechanism that enhances the willingness of CLSC members to cooperate by allowing them to share sales revenue, thereby optimizing overall performance [36]. Kuchesfehani et al. studied the effectiveness of revenue-sharing contracts in promoting CLSC coordination, highlighting their distinctive advantages in improving CLSC flexibility and response speed [37].
As an important coordination tool, cost-sharing contracts can reasonably allocate CLSC operating costs, reducing the risk faced by individual members and promoting the stable operation of the CLSC [38]. Guan et al. found that cost-sharing coordination mechanisms excelled in improving cascading recycling, improving resource utilization efficiency and offering long-term economic and environmental benefits to the CLSC [39]. Quantity discount contracts incentivize CLSC members to increase their purchases by offering price discounts to meet certain standards, thus optimizing the overall inventory level and production efficiency of the CLSC. With the advancement of research, some scholars have started integrating quantity discount contracts with other factors. For example, Chaharmahali et al. successfully combined quantity discount contracts with transportation cost optimization to create a more efficient CLSC network [40].
To further enhance the flexibility and effectiveness of CLSC coordination, some scholars have attempted to combine multiple contracts in their research. Zhao et al. demonstrated the significant effects of the “revenue sharing + cost sharing” composite contract in coordinating the CLSC, which adjusts the ratio of revenue distribution and cost allocation to maximize the benefits of CLSC members [19]. Meanwhile, Fan et al. designed an innovative “forward franchising + reverse cost sharing” contract that combines brand licensing in the forward channel and cost sharing in the reverse channel to provide a more flexible and effective solution for the profit allocation in CLSC [41].
The above review indicates that few studies of CLSC contract coordination have incorporated quality control, and the exploration of combination contracts is flourishing. On this basis, this study integrates quality control contracts into the CLSC operation and combines them with revenue-sharing contracts to investigate the coordination role of combined contracts.
2.3. System Dynamics
System dynamics is an interdisciplinary method extensively employed in the study of complex systems [42]. Its core concept is based on management content and transforming the complexity of real-world problems into a manageable research framework through a series of feedback mechanisms [43]. By establishing an SD model, researchers can intuitively understand the dynamic trends of a system, rapidly identify the structural causes of system transformations, and help develop effective solutions for dynamic complex problems [44].
The nature of a CLSC is also complex, and there is a scientific basis for applying SD in CLSC. Several scholars have employed SD methods in CLSC research [45]. For instance, Duan et al. developed a CLSC model using the SD method to explore the impact of COVID-19 on the coupling of material and financial flows within CLSC [46]. Delavar et al. developed an SD model to conduct a sensitivity analysis on the bullwhip effects in CLSC for electronics manufacturing [47]. Gao et al. established an SD model for CLSC using Vensim software and analyzed the influence of relevant factors on CLSC [48].
The above studies demonstrated the applicability of the SD method in the study of CLSC. However, few scholars have utilized the SD method to investigate the contract coordination problem within CLSC. Based on the success of the SD method in CLSC research, the SD method and contract coordination theory are combined in this study to examine CLSC quality control.
The above literature review proves the essential role of quality control in CLSC management. An attempt can be made to realize quality control in CLSC through contractual coordination theory. However, there are irrationalities in using traditional mathematical methods to realize the role of contract coordination theory in CLSC. Therefore, it is scientific to use the system dynamics method through the SD model to construct contract schemes.
3. Methods
3.1. Methods and Prerequisites
System dynamics is a method of studying the information feedback system that can solve social, economic and other problems. It is usually studied by computer, and the system can be simulated many times so as to make a prediction of the real world and help to understand the development law of things. In the establishment of an SD model, the causality diagram and system flow diagram are two important structural description tools. The causality diagram shows the relationship between different variables, while the system flow diagram can assign certain values to these relationships so that the quantitative relationship between variables can be revealed. When using SD for research, the SD model is simulated according to the requirements of the research, and the relevant data sets are analyzed. By changing the values of some variables or parameters and observing the differences in the simulation results of the system in different situations, the characteristics of the system can be summarized.
The relevant literature suggests that quality control is crucial in the operation of CLSC [29], and revenue-sharing contracts are extensively employed in CLSC contract coordination [37]. The application of combination contracts is also increasing [19]. Therefore, this study proposes two contract models in the design of contract schemes: the quality control contract scheme and the quality control–revenue-sharing combination contract scheme.
The specific contract coordination design scheme is described as follows:
Firstly, an SD model of a remanufacturing CLSC is developed using Vensim DSS software. The basic SD model is constructed based on a real three-stage remanufacturing CLSC. The simulation scenario constructed in this part involves the following: to attract more consumers, increase sales, expand the market, and improve revenue, members of a three-level remanufacturing CLSC collectively commit to enhancing quality. This scenario involves the remanufacturer improving processes and production quality, the retailer actively promoting sales to enhance the quality of sales, and the recycler striving to recycle and increase the quality of recycling. However, implementing quality improvement as a mandatory contract is challenging because quality improvement is difficult to measure. Additionally, CLSC members cannot perceive each other’s efforts in quality improvement behaviors. Therefore, the commitment to quality improvement solely depends on the consciousness of each CLSC member. The objective of developing the basic SD model is to verify whether a CLSC member can comply with its commitment to quality improvement without the constraints of a mandatory contract.
Secondly, the quality control contract scheme. This scheme incorporates a quality control contract into the basic SD model. It rewards behaviors that contribute to product quality improvement in the daily operations of the CLSC and penalizes those detrimental behaviors. In this way, all members can be encouraged to consciously uphold their commitment to quality improvement. By imposing mandatory rewards and penalties based on members’ behavior, the quality control contract functions as a compulsory contract, significantly enhancing its constraint abilities. The aim of constructing this SD model is to investigate the role of contract coordination in the quality control of CLSC.
Finally, the quality control–revenue-sharing contract scheme is proposed. The existing studies have demonstrated that revenue-sharing contracts can facilitate profit sharing in the CLSC [36]. On this basis, the proposed contract scheme incorporates both quality control and revenue-sharing components. The specific design of the revenue-sharing contract involves the collaboration between upstream and downstream manufacturers. The upstream remanufacturer offers a price discount to the downstream manufacturer, who, in turn, shares the revenue with the upstream remanufacturer according to a pre-determined proportion. Therefore, the primary objective of this study is to investigate the further optimization of profit sharing in the CLSC by implementing a quality control–revenue-sharing contract scheme.
In order to facilitate operations in modeling and align the model more closely to real-world CLSC operations, the following prerequisites need to be considered during model construction:
- In the CLSC, both remanufactured and new products are homogeneous, and consumers have comparable levels of enthusiasm toward their purchase.
- Given the preference for reproductions, remanufacturers prioritize the production of remanufactured products over new products.
- In the model, the key players are remanufacturers, retailers, and recyclers within the CLSC. All three parties engage in strategic interactions under limited rationality.
3.2. Evolutionary Game Model
3.2.1. Relevant Explanations
In order to ensure a reasonable and accurate simulation of the strategic interaction behavior of member enterprises in the CLSC, this study further elucidates the game participant, behavior strategy, and related parameters.
- Game participant: The game participants are the relevant enterprises in the CLSC of waste electrical and electronic products, including remanufacturers, retailers, and recyclers.
- Behavior strategy of the remanufacturer: The remanufacturer has two strategy choices in the game. ① High-quality production. In addition to using recycled parts, the remanufacturer optimizes the production process during remanufacturing (investing in energy-saving research or purchasing new equipment to reduce energy consumption, emissions, and wastewater discharge). ② Low-quality production. The remanufacturer only uses recycled parts in production without making additional investments to optimize production processes. The probability of the remanufacturer choosing high-quality production and low-quality production are α and (1-α), respectively.
- Behavior strategy of the retailer: The retailer has two strategy choices in the game. ① High-quality sales. High-quality sales mainly involve increased investment in promoting sales of remanufactured products. ② Low-quality sales. The retailer does not exert much effort on product sales and does not actively promote them. The probability that retailers choose high-quality and low-quality sales is β and (1-β), respectively.
- Behavior strategy of the recycler: The recycler has two strategy choices in the game. ① High-quality recycling. Recyclers increase their investments to improve machinery quality and disassembly processes, thereby providing high-quality recycled parts to remanufacturers. ② Low-quality recycling. Instead of providing high-quality recycled parts, recyclers are less likely to make additional efforts to improve their quality. The probability that recyclers choose to provide high-quality and low-quality recycled recycling is γ and (1-γ), respectively.
A series of parameter symbols are involved in the established evolutionary game model, and the explanation of these parameters is shown in Table 1.

Table 1.
Comparison table of parameters.
3.2.2. Matrix of Payments
According to different strategy choices, the payoff matrix under eight strategy combinations is obtained, as shown in Table 2 and Table 3.
Table 2.
The tripartite payoff matrix when the remanufacturer (M) adopts the high-quality production strategy (α).
Table 3.
The three-party payoff matrix when the remanufacturer (M) adopts the low-quality production strategy (1 − α).
3.2.3. Replication Dynamic Equation
According to the tripartite payoff matrix, the expected payoff of the remanufacturer for conducting high-quality production and for conducting low-quality production can be obtained, which is denoted by and , respectively, and the average expected payoff of the remanufacturer is denoted by .
By referring to the equations of the remanufacturer in the four different strategy sets in Table 2, can be calculated as Equation (1), and by referring to the four different strategy equations of the remanufacturer in Table 3, can be calculated as Equation (2). The symbols and meanings of specific parameters in the formula can be found in Table 1.
The replication dynamics equation for the remanufacturer is constructed based on Equations (1) and (3), as expressed by Equation (4).
Similarly, the replication dynamic equations of retailers and recyclers are obtained as Equations (5) and (6), respectively. Where represents the retailer’s expected revenue from high-quality sales, represents the retailer’s average expected revenue, represents the recycler’s expected revenue from high-quality recycling, and represents the recycler’s average expected revenue.
According to the replication dynamic Equations (4)–(6) of the remanufacturer, retailer, and recycler, the replication dynamic Equation group (7) is obtained.
3.3. Models and Solutions
3.3.1. Basic SD Model of Remanufacturing CLSC
The study constructs a comprehensive SD model of CLSC, comprising a remanufacturer (M), a retailer (R), and a recycler (T). The remanufacturer manufactures and reproduces new products while the retailer sells the finished products. The recycler recovers and delivers old products to the remanufacturer for remanufacturing. Qualified reproductions are reintegrated into the CLSC system.
While developing the basic SD model of CLSC, this study employs the Vensim DSS 6.0 simulation software. The model comprises two main components: the inventory and capital system and the evolutionary game system, which determines each member’s quality improvement decision. During modeling, certain parameters of the inventory and capital system model are established based on the research of Duan W. et al. [46], while other parameters of the evolutionary game system model concerning quality improvement decisions are derived from the work of Duan W. et al. [49]. The parameters related to quality control and contract coordination are defined in this study. These model parameters are set according to the real CLSC operation data, and the validity and reliability of these parameters are proven by model tests and practice tests.
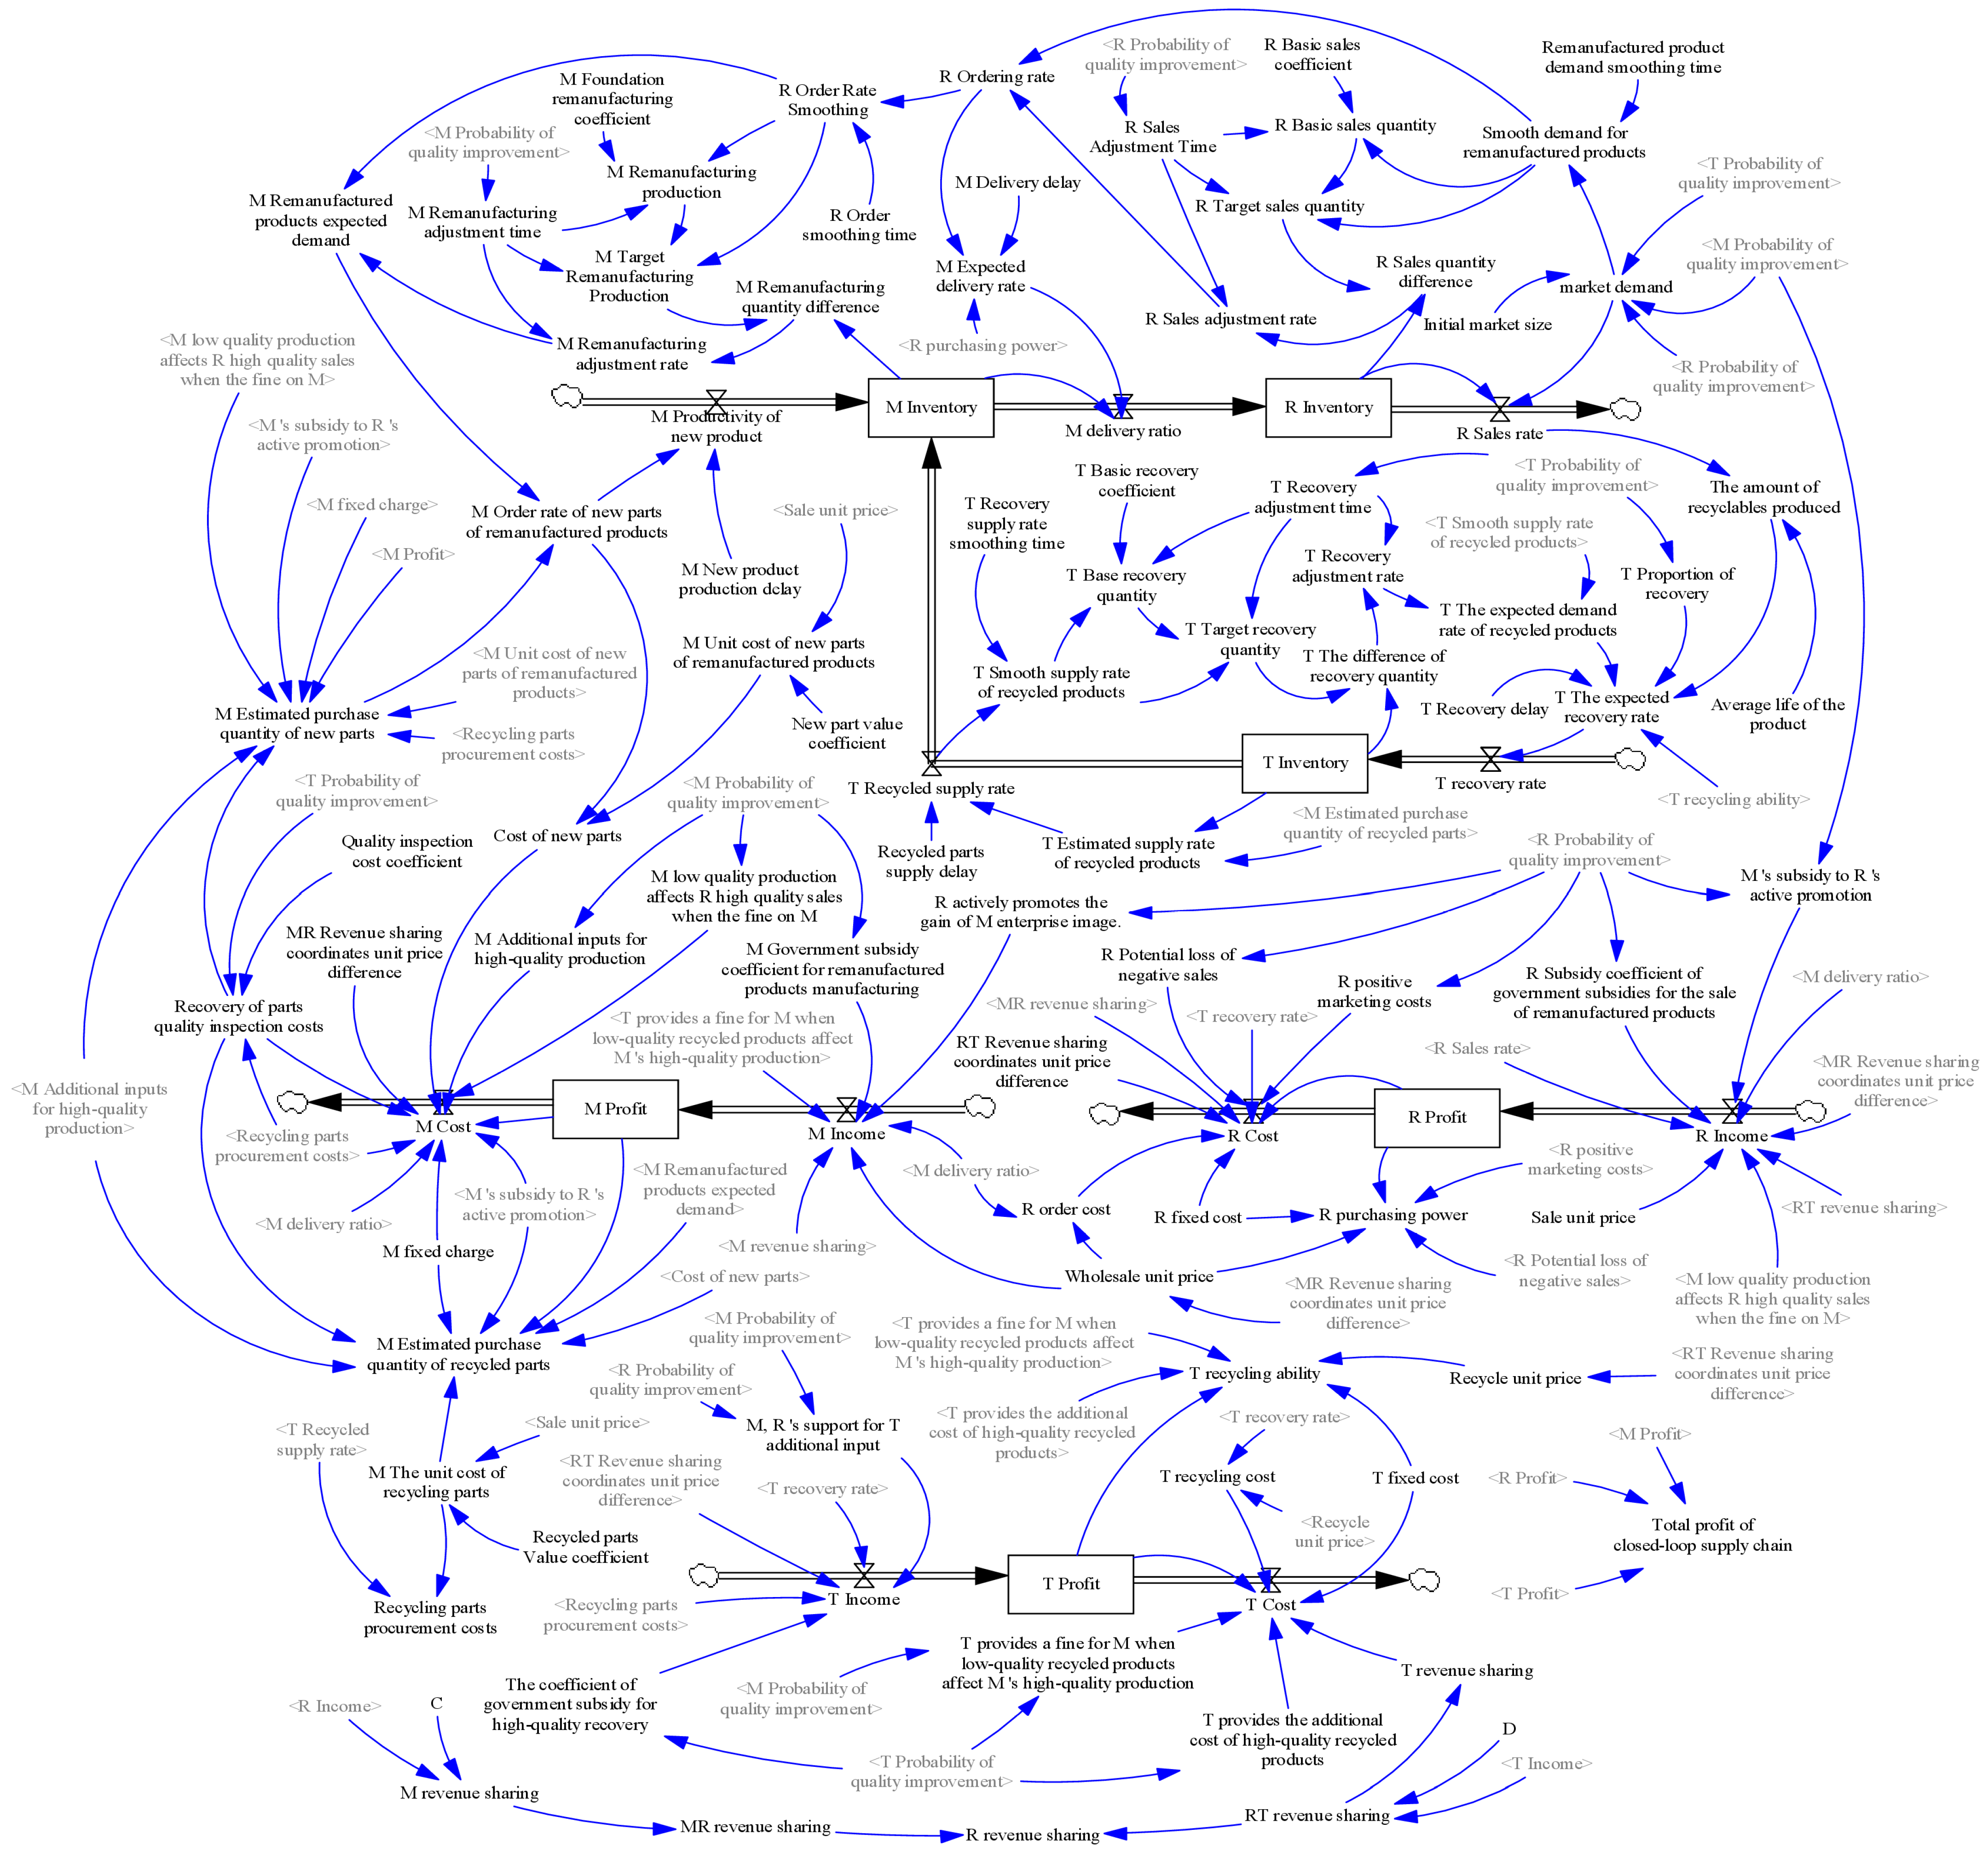
The SD model of the inventory and capital system is shown in Figure 1.

Figure 1.
SD model of the inventory and capital system.
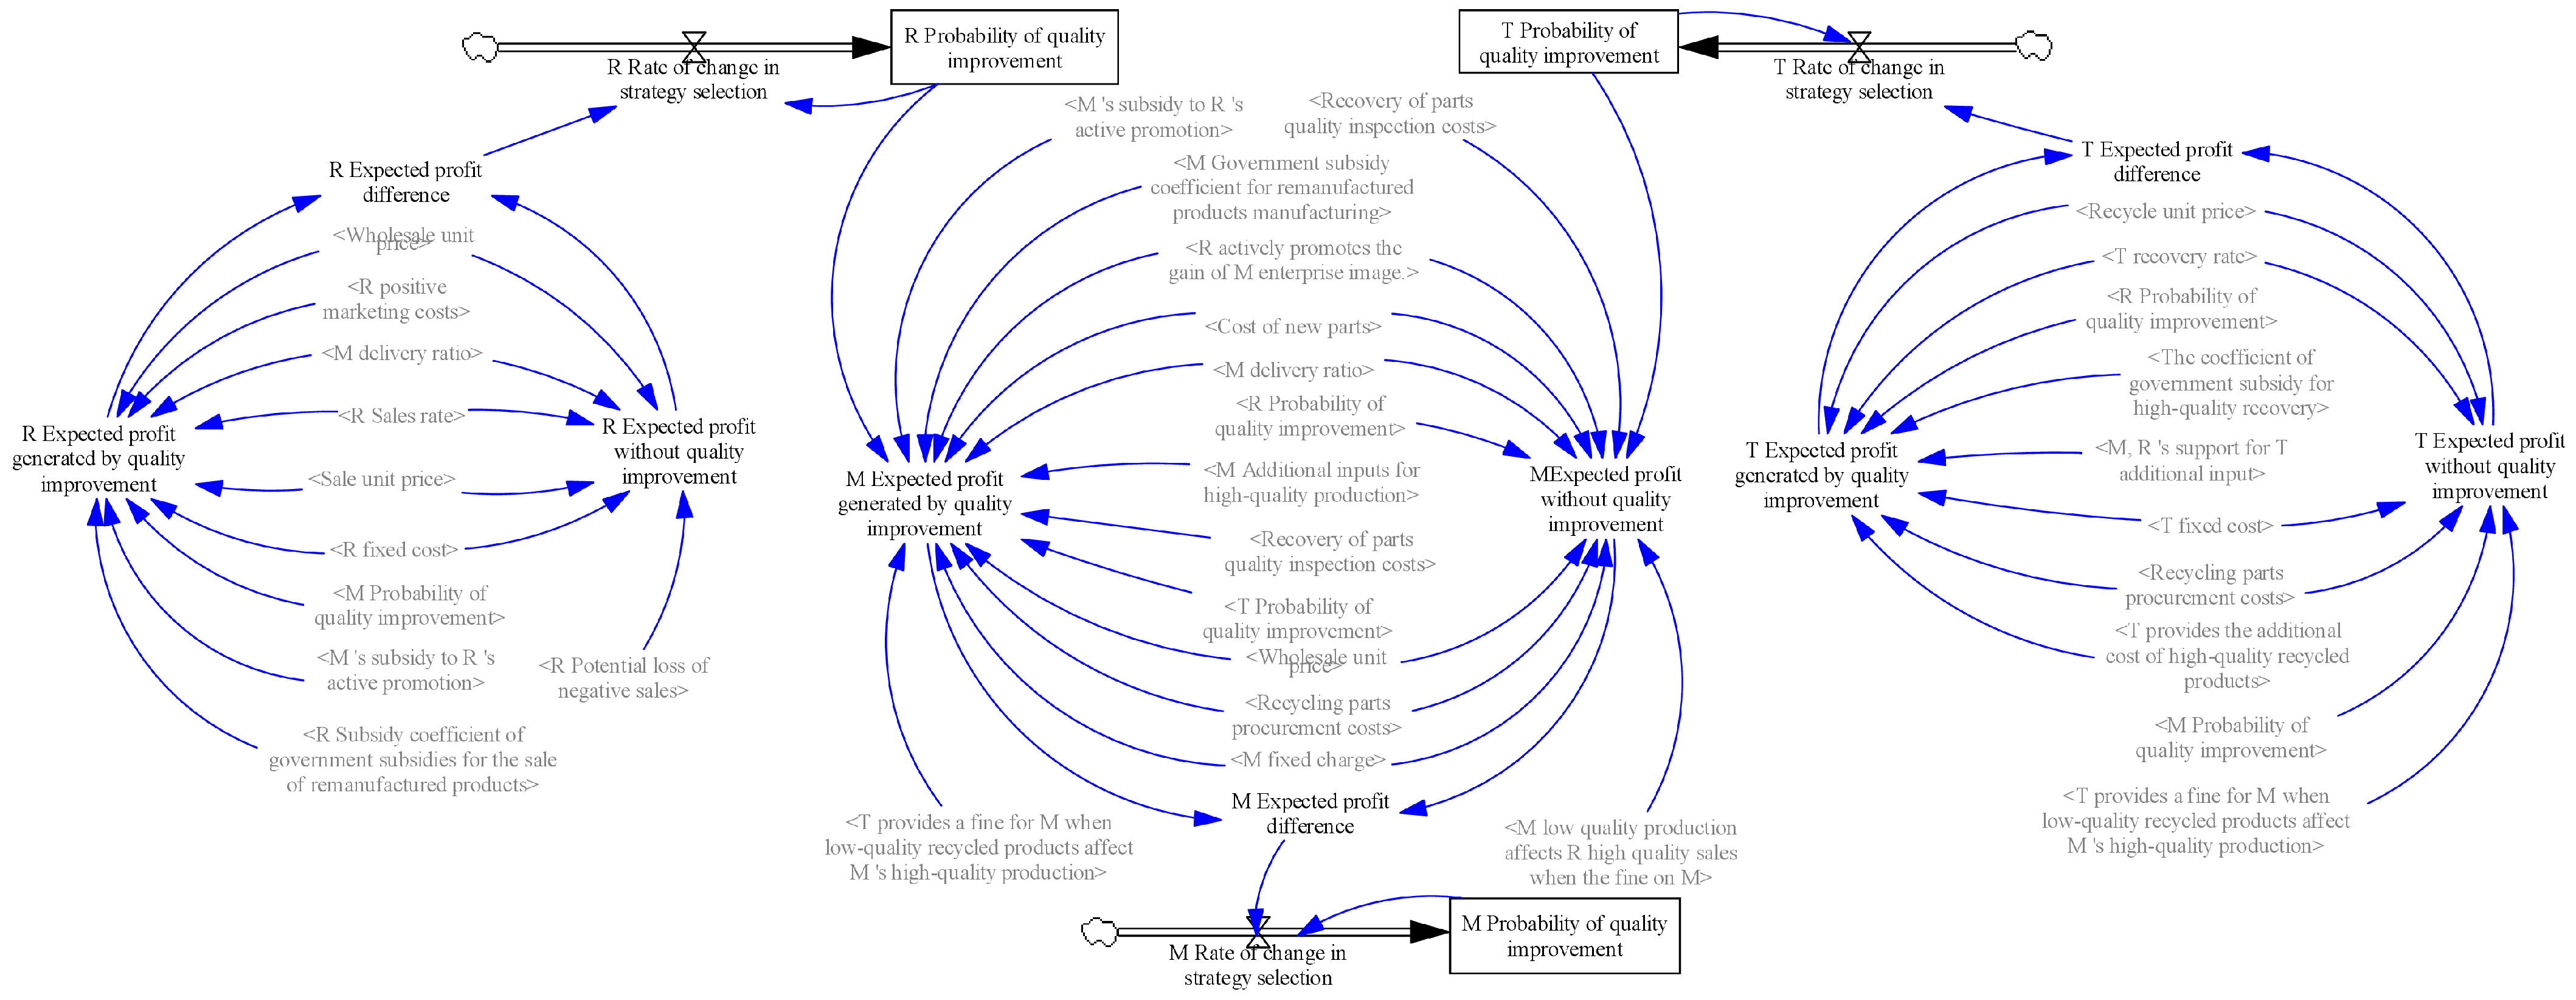
The SD model of the evolutionary game system for each member’s quality improvement decision is shown in Figure 2.
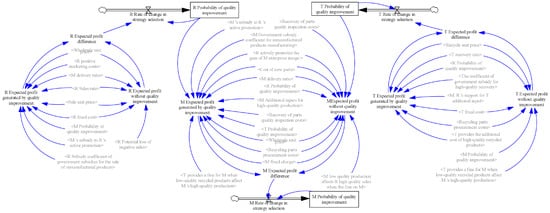
Figure 2.
SD model of the evolutionary game system for each member’s quality improvement decision.
The system flow diagram is refined according to the causal relationship, which can clearly reflect the relationship between state variables, rate variables, auxiliary variables, and constants so as to describe the system structure and simulate the system behavior. As shown in Figure 1, the SD model of the inventory and capital system includes the inventory subsystem of the remanufacturer, the inventory subsystem of the retailer, the inventory subsystem of the recycler and the capital subsystem of the remanufacturer, the capital subsystem of the retailer, and the capital subsystem of the recycler. By connecting these six subsystems, a three-level CLSC system flow diagram reflecting material flow and capital flow can be formed.
The SD model of each member’s quality improvement decision evolutionary game system is composed of the remanufacturer evolutionary game subsystem, the retailer evolutionary game subsystem and the recycler evolutionary game subsystem.
The main parameters of the basic SD model are listed in Table 4.
Table 4.
Main parameters of the basic SD model.
Since the basic SD model does not include quality control or revenue distribution, the corresponding parameters related to quality control and revenue sharing are 0.
Main equations of basic SD model:
M Probability of quality improvement = IF THEN ELSE((M Probability of quality improvement + M Rate of change in strategy selection) > 1, 1-M Probability of quality improvement, IF THEN ELSE((M Probability of quality improvement + M Rate of change in strategy selection) < 0, -M Probability of quality improvement, M Rate of change in strategy selection)); initial value = 0.4.
R Probability of quality improvement = IF THEN ELSE((R Probability of quality improvement + R Rate of change in strategy selection) > 1, 1-R Probability of quality improvement, IF THEN ELSE((R Probability of quality improvement + R Rate of change in strategy selection) < 0,-R Probability of quality improvement, R Rate of change in strategy selection)); initial value = 0.5.
T Probability of quality improvement = IF THEN ELSE((T Probability of quality improvement + T Rate of change in strategy selection) > 1, 1-T Probability of quality improvement, IF THEN ELSE((T Probability of quality improvement + T Rate of change in strategy selection) < 0,-T Probability of quality improvement, T Rate of change in strategy selection)); initial value = 0.4.
M Cost = MIN(M low quality production affects R high quality sales when the fine on M+M fixed charge+ M’s subsidy to R’s active promotion+ “M Additional inputs for high-quality production”+ Recovery of parts quality inspection costs+ Recycling parts procurement costs + Cost of new parts + M delivery ratio*MR Revenue sharing coordinates unit price difference, M Profit).
R Cost = MIN(MR revenue sharing+ R fixed cost+ R Potential loss of negative sales+ R positive marketing costs+ R order cost+ T recovery rate*RT Revenue sharing coordinates unit price difference, R Profit).
T Cost = MIN(T recycling cost+ T fixed cost+ “T provides a fine for M when low-quality recycled products affect M’s high-quality production”+ “T provides the additional cost of high-quality recycled products” + T revenue sharing, T Profit).
M Income = Wholesale unit price * (1 + M Government subsidy coefficient for remanufactured products manufacturing) * M delivery ratio+ “R actively promotes the gain of M enterprise image.”+ “T provides a fine for M when low-quality recycled products affect M’s high-quality production"+ M revenue sharing.
R Income = Sale unit price * (1 + R Subsidy coefficient of government subsidies for the sale of remanufactured products) * R Sales rate+ M’s subsidy to R’s active promotion+ M low quality production affects R high quality sales when the fine on M+ RT revenue sharing+ MR Revenue sharing coordinates unit price difference*M delivery ratio.
T Income = Recycling parts procurement costs * (1 + “The coefficient of government subsidy for high-quality recovery”) + ”M, R’s support for T additional input”+ T recovery rate * RT Revenue sharing coordinates unit price difference.
3.3.2. SD Model of the Quality Control Contract Scheme
The quality control contract scheme compared with the basic SD model adds the following variables: M’s subsidy to R’s active promotion; M’s low-quality production affects R’s high-quality sales when the fine is on M; M, R’s support for T’s additional input, T provides a fine for M when low-quality recycled products affect M’s high-quality production.
When R retailers actively fulfill the quality improvement commitment, M subsidizes R’s active marketing behavior. Meanwhile, if the M remanufacturer breaches the quality improvement contract and the product quality affects the R retailers’ high-quality sales, the M remanufacturer will be fined a certain amount. As for the T recycler, if T actively performs high-quality recycling, M and R will support the additional investment of T; if T does not actively perform the quality improvement contract to provide low-quality recycling, M remanufacturer will fine T.
Main equations of the SD model of quality control contract scheme:
M’s subsidy to R’s active promotions = IF THEN ELSE(M Probability of quality improvement > 0, (9500 * (R Probability of quality improvement + M Probability of quality improvement))/2, 0).
M low-quality production affects R high-quality sales when the fine on M = (1-M Probability of quality improvement) * 8000.
M, R’s support for T’s additional input = ((M Probability of quality improvement + R Probability of quality improvement)/2) * 10,000.
T provides a fine for M when low-quality recycled products affect M’s high-quality production = M Probability of quality improvement * (1-T Probability of quality improvement) * 1000.
The main parameters of the SD model of the quality control contract scheme are set as consistent with the basic SD model and are not presented here. In addition, this part of the model does not involve revenue sharing, and the relevant parameters are set to 0.
3.3.3. SD Model of the Quality Control-Revenue-Sharing Contract Scheme
The SD model of the quality control–revenue-sharing contract scheme adopts the combination contract form and adds the revenue-sharing contract on the basis of the quality control contract scheme to coordinate the benefits of each member and explore more scientific benefit distributions among the CLSC members after quality control.
Unlike the quality control contract scheme, this scheme increases the revenue sharing between upstream and downstream manufacturers. The M remanufacturer takes the initiative to reduce the wholesale price of the product and sells it to the R retailer at a lower price. Meanwhile, the R retailer shares the revenue with the M remanufacturer in proportion (C). The R retailer subsidizes the recycling of the T recycler to reduce the recycling unit price of the T recycler, and the T recycler shares the revenue with the R retailer in proportion (D).
Main equations of the SD model of the quality control–revenue-sharing contract scheme:
M revenue sharing = MR revenue sharing = R Income * C
T revenue sharing = RT revenue sharing = T Income * D
Wholesale unit price = 100-MR Revenue sharing coordinates unit price difference
Recycle unit price = 13-RT Revenue sharing coordinates unit price difference
The main parameters of the SD model of the quality control–revenue-sharing contract scheme are listed in Table 5.
Table 5.
Main parameters of the SD model of the quality control–revenue-sharing contract scheme.
When determining the revenue-sharing ratios C and D for the tuning test, the Vensim DSS software is utilized. The assigned ranges for C and D are 0 to 1. The tuning test is conducted in the following sequence:
First, with C set to 0, the profits of the M remanufacturer, R retailer, T recycler, and CLSC are tested and recorded consecutively, with D increasing from 0 to 1 in a 0.1 step.
Second, C is increased from 0 to 1 in a 0.1 step, and the profits of the CLSC members and the total profit are recorded under different C and D values.
Subsequently, the results are compared and screened, and the smallest profit difference among all parties occurs when C = 0.2 and D = 0.5. Furthermore, all parties’ profits exceed those of the basic SD model.
Next, a more precise valuation of C and D is conducted by repeating steps 1 and 2 with an interval of 0.05. Specifically, C ranges from 0.15 to 0.25, and D ranges from 0.45 to 0.55. The profits are recorded accordingly.
Finally, the results are again compared and screened, leading to the selection of C = 0.15 and D = 0.45 with a value accuracy of 0.01.
4. Results and Discussion
4.1. Results
4.1.1. Basic SD Model Simulation Results
After the modeling is completed, 25 simulation cycles are carried out with the simulation step size of 0.25, in which the time unit of the simulation cycle is “month”, and the unit of profit is “CNY”. After the simulation, the following results are obtained:
In the SD model of CLSC, the evolution game of each member’s quality improvement decision is shown in Figure 3, and the profit of each member is shown in Figure 4.
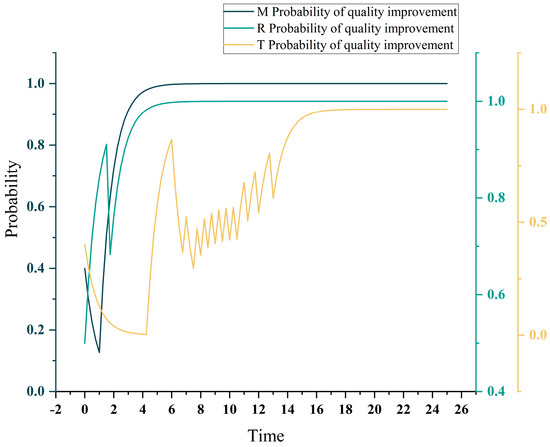
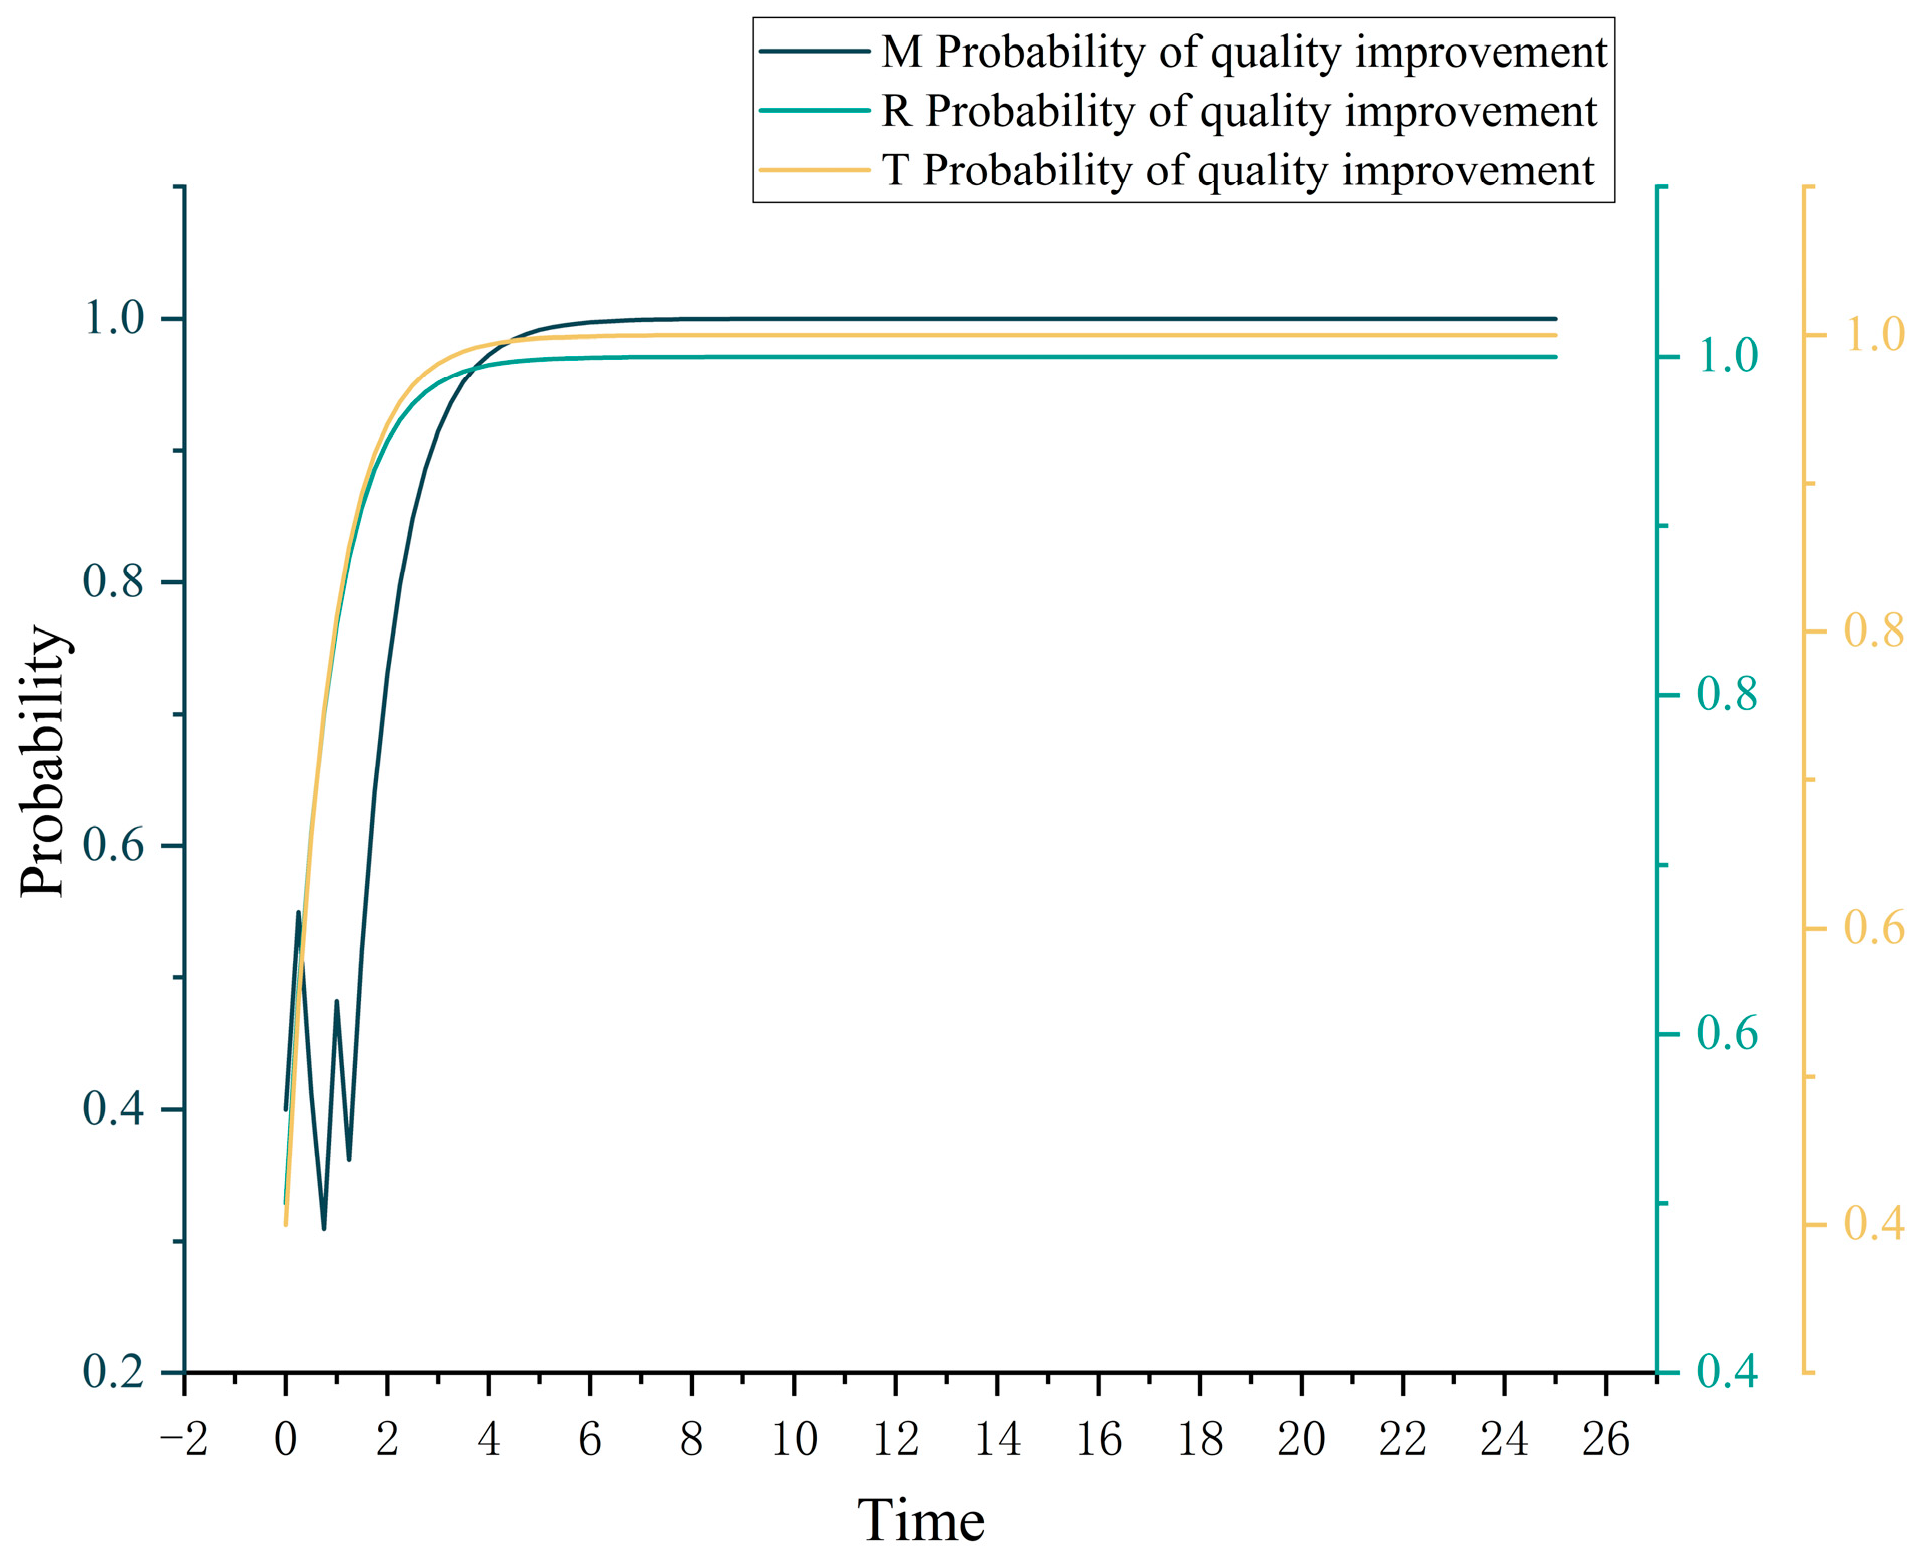
Figure 3.
The evolution game of each member’s quality improvement decision (basic SD model).
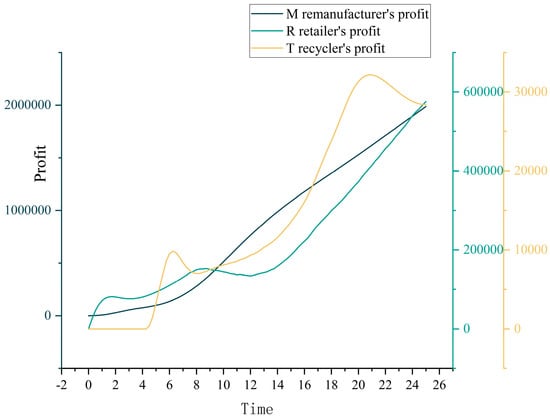
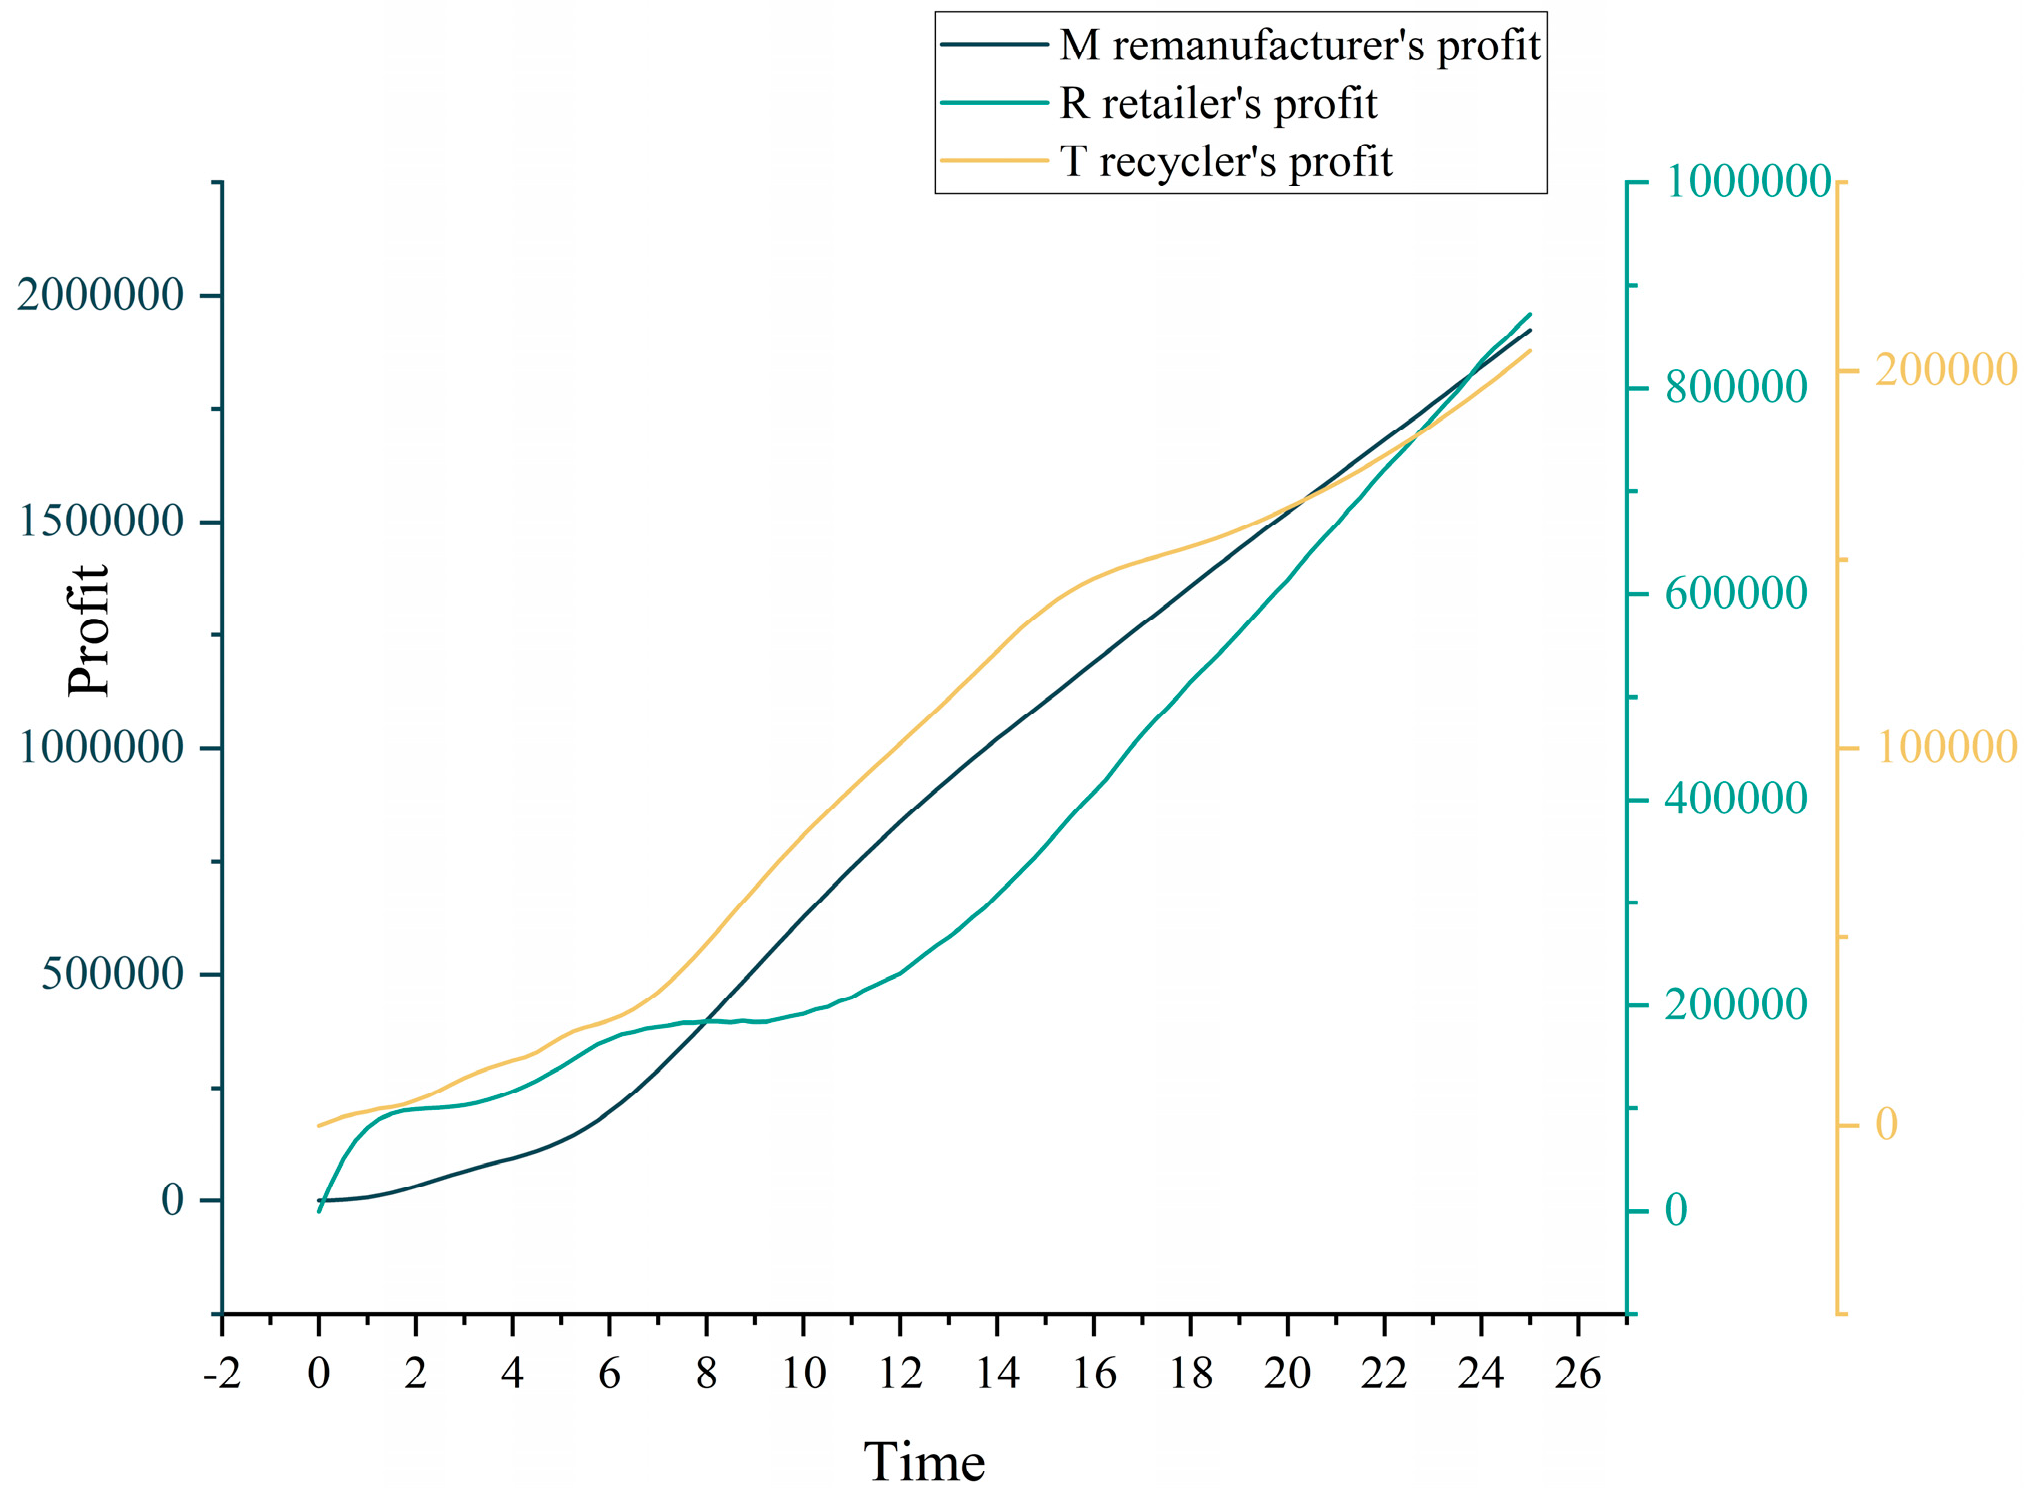
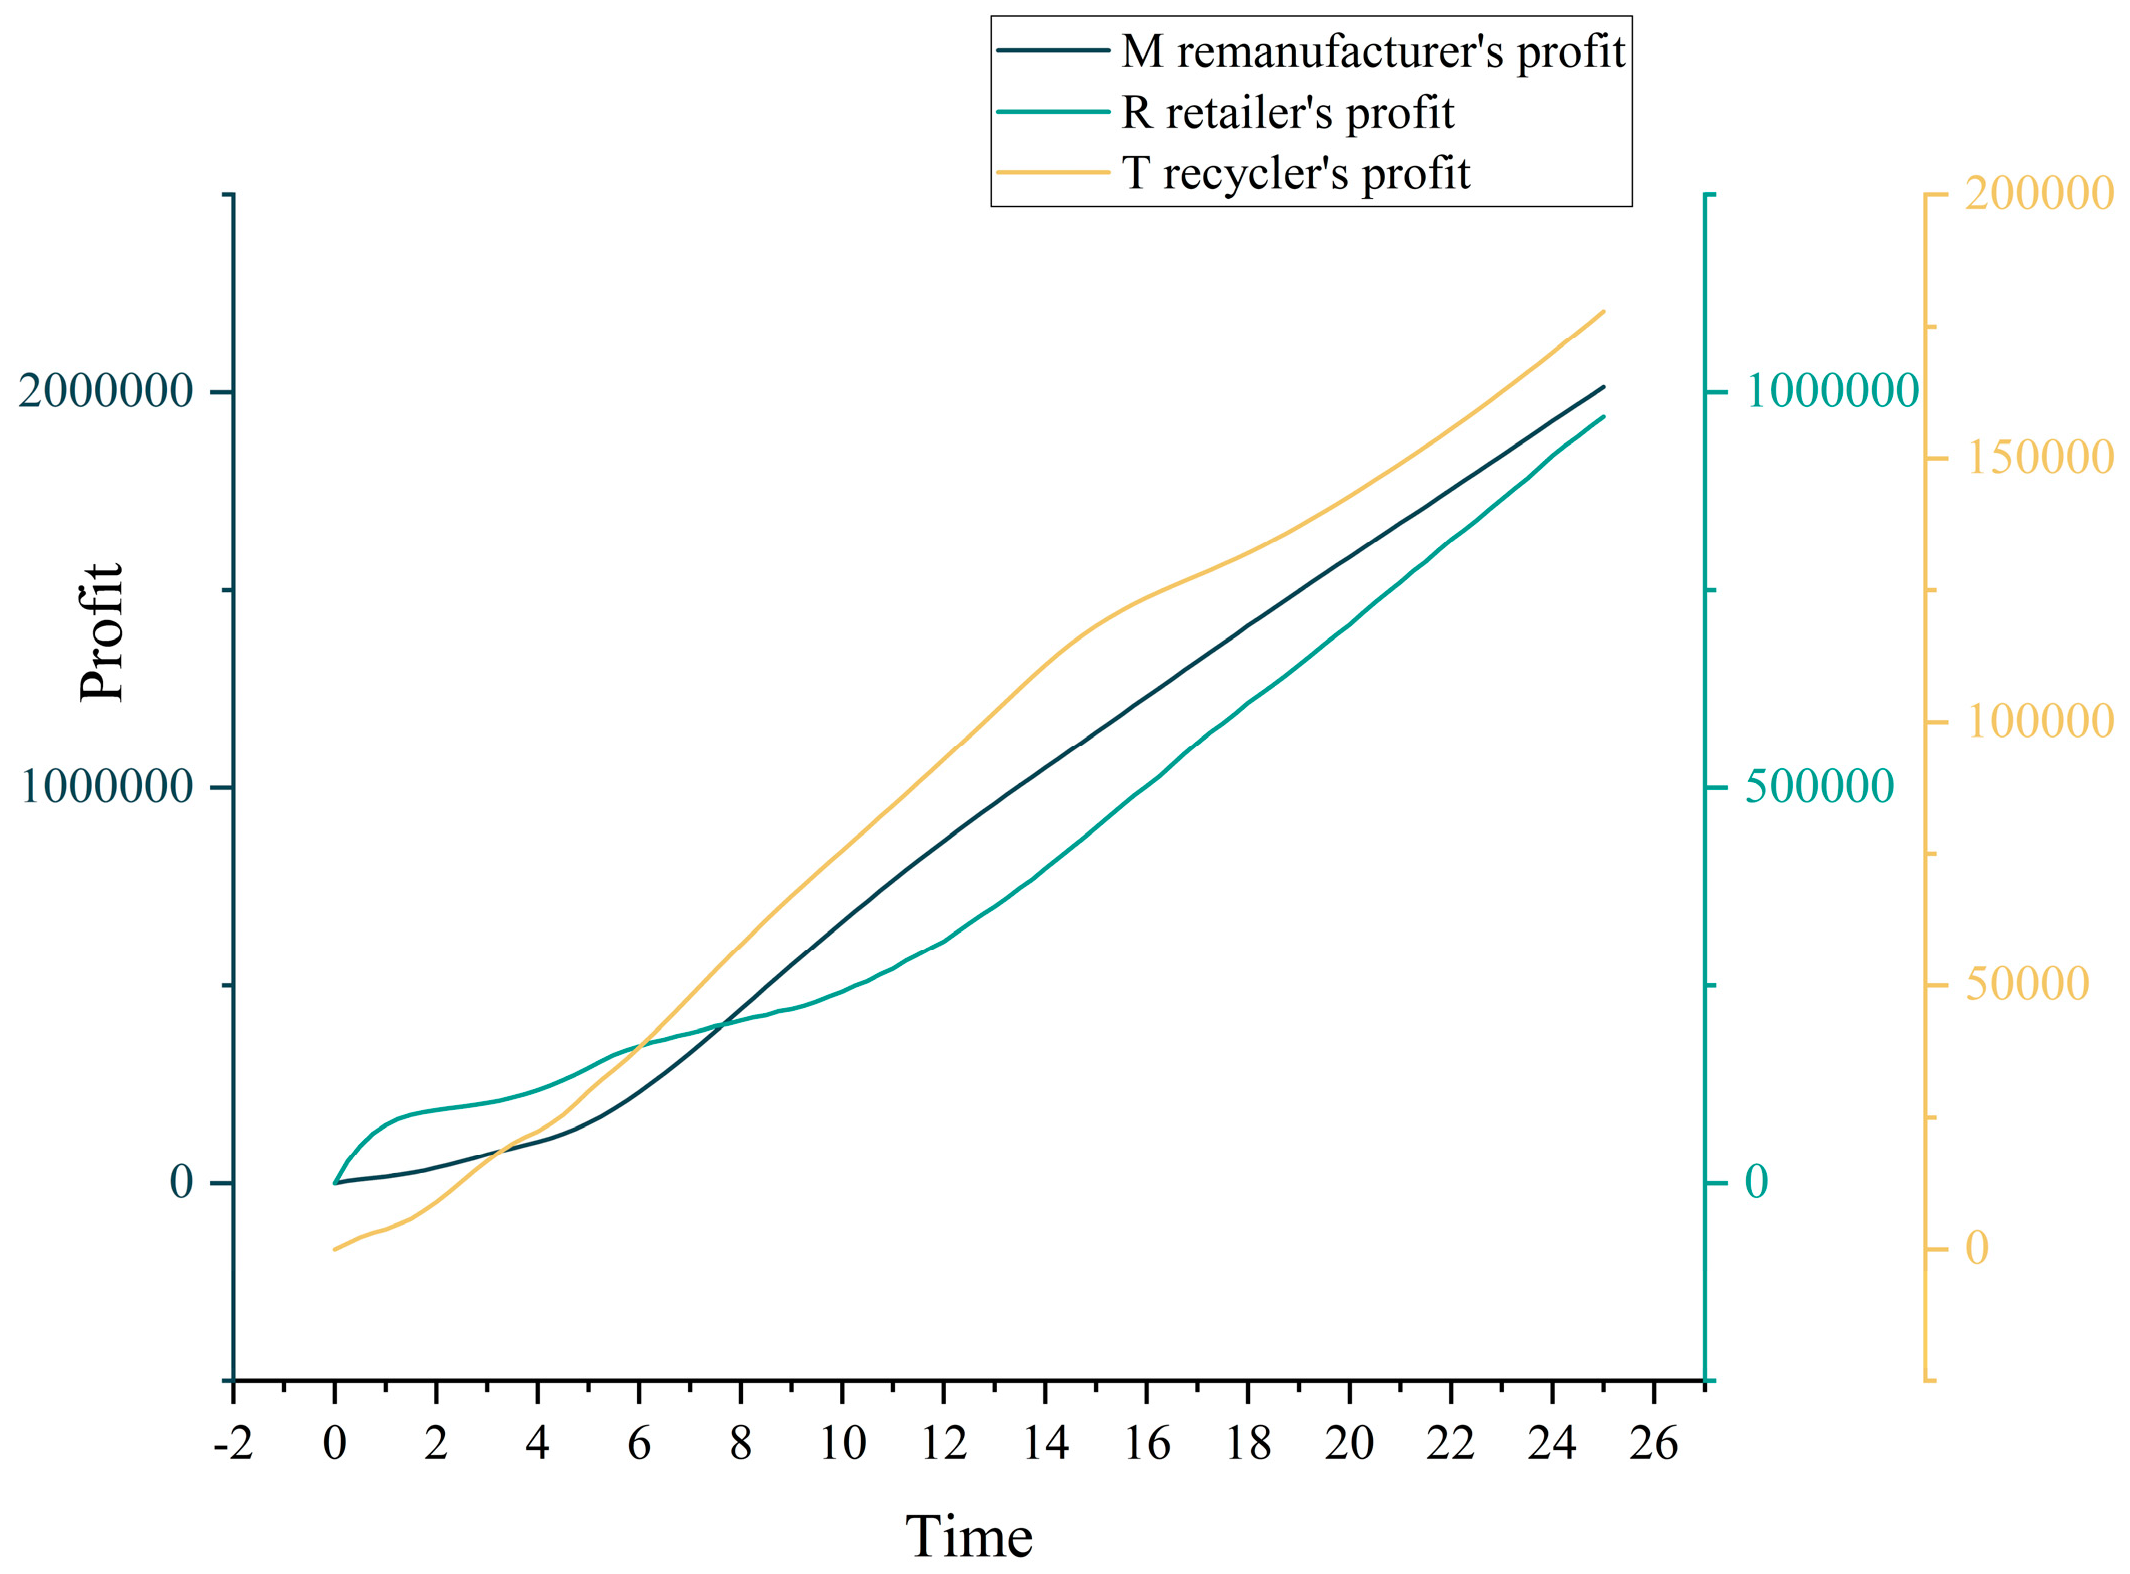
Figure 4.
The profit of each member (basic SD model).
Figure 3 illustrates the fluctuation in the probabilities of the M remanufacturer and R retailer opting for quality improvement in the initial five cycles. Post the five cycles, the M remanufacturer and R retailer consistently adhere to their quality enhancement commitments, maintaining high-quality production and service. By the 4th cycle, the probability of T recycler’s quality improvement drops to 0, signifying their abandonment of quality improvement and control. Although the probability rebounds, it remains unstable for the first 15 cycles, consistently below 0.8 most of the time. Thus, the T recycler may continue to struggle with quality improvement at this stage.
According to Figure 4, the profits of the M remanufacturer and R retailer consistently increase throughout the 25 cycles. However, the profits of the T recycler show significant fluctuations during the first 20 cycles, showing an overall upward trend with fluctuations, followed by a decline after peaking at the end of cycle 20.
Upon closer examination of the relationship between the T recycler’s decision not to improve quality and its profits, a sharp drop becomes apparent in the probability of quality improvement in the 6th cycle. Consequently, their profits start to decline, indicating the negative effect of disregarding quality improvement commitment on profit growth. The SD model of the remanufacturing CLSC validates that all participants consistently upholding the quality improvement commitments agreed upon verbally within the remanufacturing CLSC is challenging, with the T recycler being the most likely defier.
4.1.2. Quality Control Contract Scheme Simulation Results
In the SD model of the quality control contract scheme, the evolution game of each member’s quality improvement decision is shown in Figure 5, and the profit of each member is shown in Figure 6.
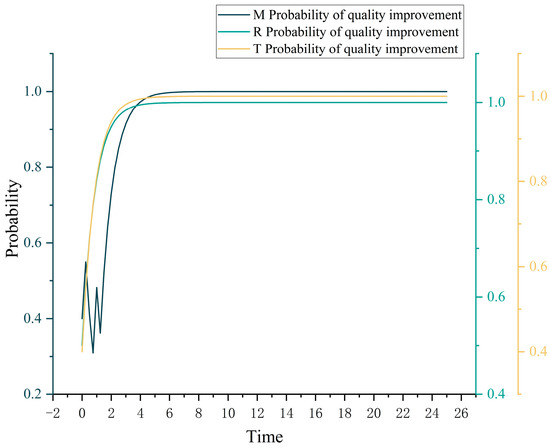
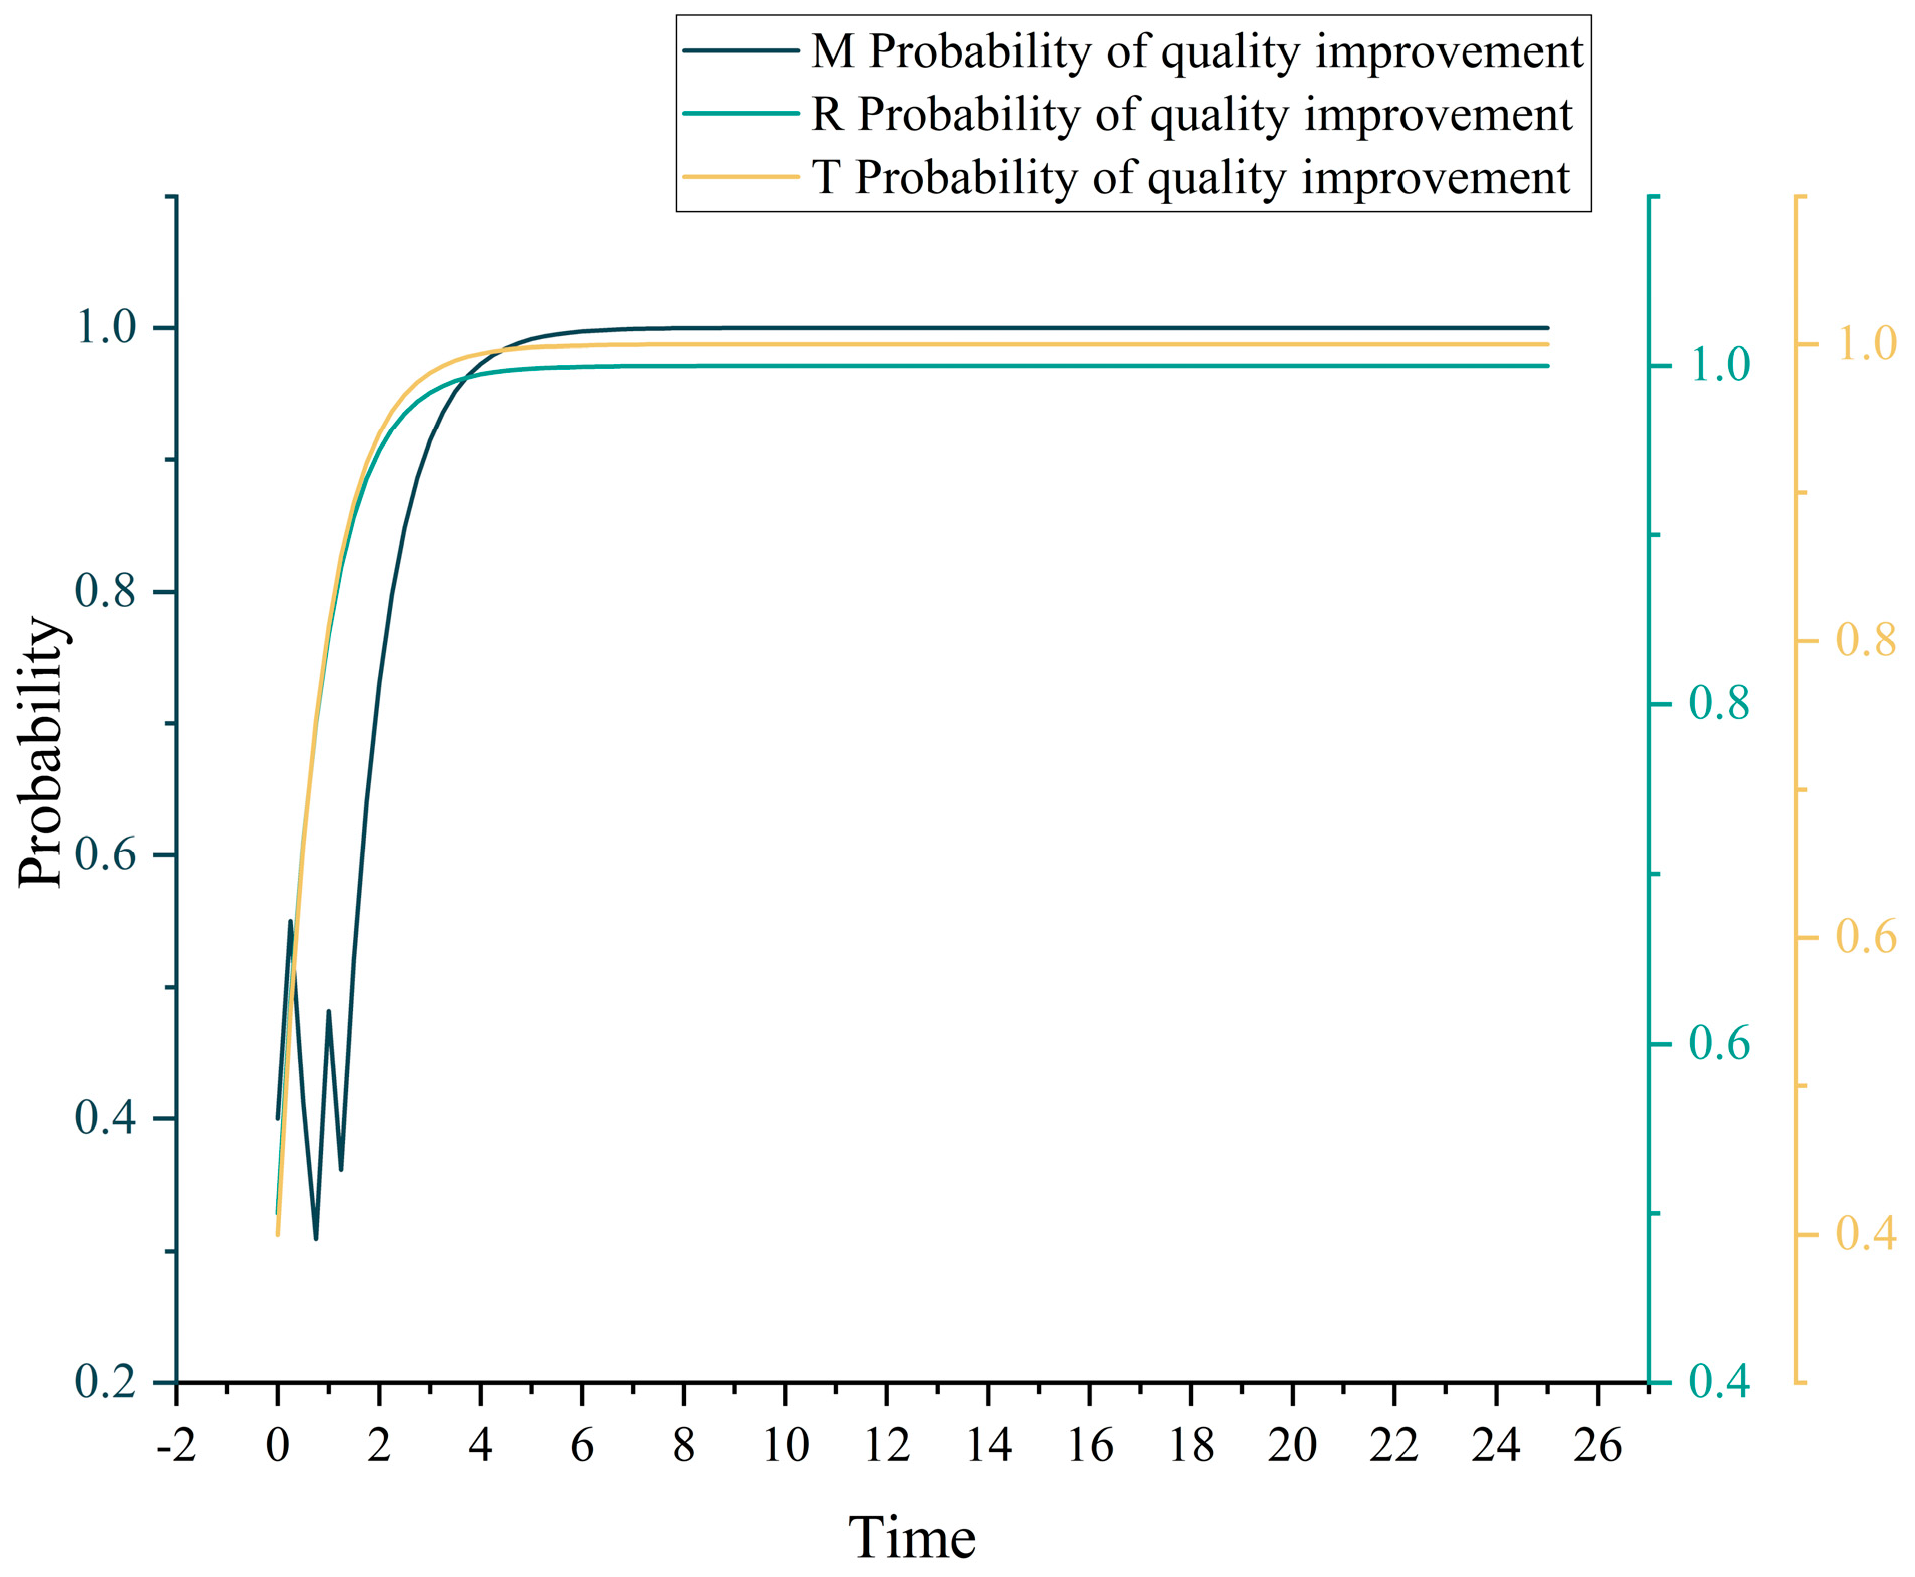
Figure 5.
The evolution game of each member’s quality improvement decision (quality control contract.
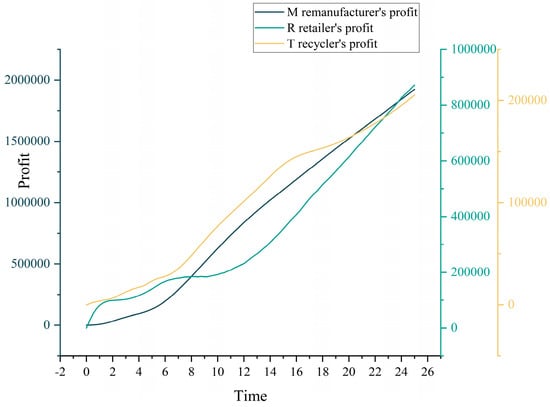
Figure 6.
The profit of each member (quality control contract scheme).
Figure 5 indicates that with the quality control contract scheme implemented, the likelihood of quality improvement for each CLSC member demonstrates a gradual increase subsequent to initial fluctuations within the first five cycles. Post the fifth cycle, the probability of quality enhancement for each member stabilizes to 1 and remains constant, signifying the effective coordination of the quality control contract. At this point, each member has adhered to quality control obligations imposed by the contract and fulfilled the quality enhancement commitment.
As depicted in Figure 6, the profits of all participants in the quality control contract scheme demonstrate a consistent upward trajectory. Notably, the profits of the M remanufacturer experience a rapid surge from the 5th cycle onward, while the profits of the R retailer and T recycler exhibit an overall steady ascent. Upon completing the 25-cycle simulation, the M remanufacturer emerges as the most profitable, followed by the R retailer and T recycler. Compared to the basic SD model, the profits of the R retailer and T recycler at this juncture surpass that of the M remanufacturer.
By analyzing Figure 5 and Figure 6, it is evident that the probability of M remanufacturer’s quality enhancement fluctuates before the fifth cycle (Figure 5), while the profit growth of the M remanufacturer remains sluggish (Figure 6). After the fifth cycle, the probability of M remanufacturer’s quality improvement stabilizes to 1, coinciding with a rapid surge in profit. This result further reinforces the accuracy of the conclusion from the basic SD model, suggesting that the violation of quality enhancement commitments potentially impacts profit growth.
4.1.3. Quality Control–Revenue-Sharing Contract Scheme Simulation Results
In the SD model of the quality control–revenue-sharing contract scheme, the evolution game of each member’s quality improvement decision is shown in Figure 7, and the profit of each member is shown in Figure 8.
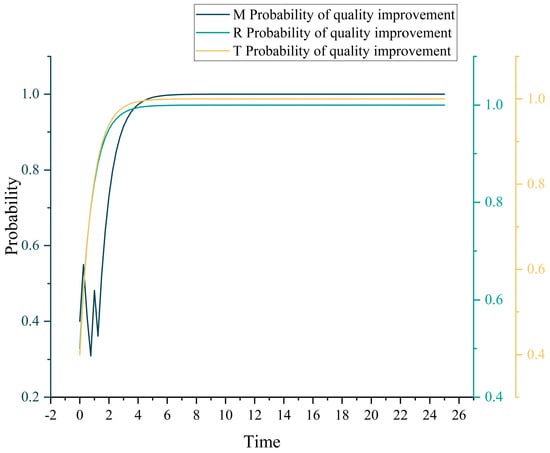
Figure 7.
The evolution game of each member’s quality improvement decision (quality control–revenue-sharing contract scheme).
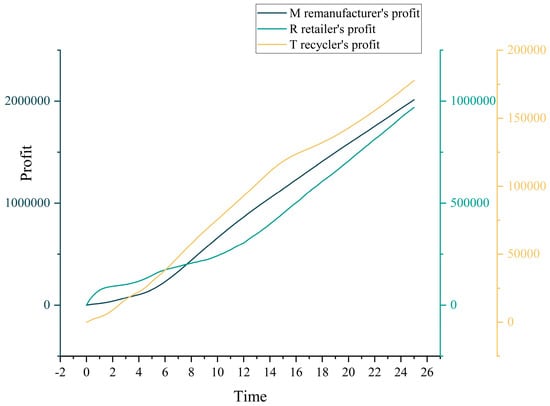
Figure 8.
The profit of each member (quality control–revenue-sharing contract scheme).
After 25 cycles, the evolution of the quality improvement decision game for each CLSC member under the quality control–revenue-sharing contract scheme resembles that under the quality control contract scheme. Approximately five cycles in, all members have a probability of meeting the quality improvement commitment of 1, indicating the successful prevention of quality improvement commitment violation by the quality control contract.
Figure 8 illustrates the profit of each member in the quality control–revenue-sharing combination contract scheme. Compared to the basic SD model, the profit of each member under this combined contract scheme increases significantly, with reduced profit gaps between members, thus contributing to a fairer benefit distribution within the CLSC.
4.2. Discussions
Based on the simulation results, different schemes are compared and analyzed to find out the influence of each scheme on CLSC quality control.
4.2.1. Comparison of Each Member’s Quality Improvement Decisions under Different Schemes
After examining the quality improvement decisions of each member in different scenarios, it becomes evident that the M remanufacturer and R retailer consistently exhibit trustworthy behavior and adhere to their quality improvement commitments, be it in the basic SD model or the two contract coordination schemes. On the other hand, the T recycler is prone to violating quality improvement commitments. Specifically, the basic SD model exhibits a time point where the probability of the T recycler improving quality is 0, indicating that non-compliance is bound to occur without mandatory contract constraints. Nevertheless, the quality control contract effectively prevents dishonest behavior from the T recycler, whether in the form of a single quality control contract or a quality control–revenue-sharing combination contract. Thus, the quality control contract effectively incentivizes members to fulfill their quality improvement commitments.
The analysis of the profitability of CLSC members and the evolution of quality improvement decisions in each model indicates that the profit and the quality improvement decision evolutionary game show a similar trend. The possible reason is that CLSC members encountering operational difficulties tend to make short-sighted decisions that compromise their quality improvement commitments in order to mitigate potential profit declines. As a result, they resort to cost-cutting measures to boost profits at the expense of quality improvement efforts.
Upon comparing the quality improvement decisions of each member in the basic SD model and the two contract coordination schemes (Figure 3, Figure 5 and Figure 7), it is apparent that non-compliance with quality improvement commitments was prevalent in the basic SD model within approximately 1 to 15 cycles. However, this issue was effectively addressed under the two contract coordination schemes, indicating the positive impact of the quality control contract on promoting quality control measures among the members.
4.2.2. Comparison of the Profit of Each Member under Different Schemes
As shown in Table 6, the overall supply chain profit under the combined contract scheme > the overall supply chain profit under the quality control contract scheme > the overall supply chain profit under the basic SD model in most periods of the 25 cycles.
Table 6.
Comparison of total supply chain profit under different schemes.
By comparing and analyzing the profitability of each member after 25 simulation cycles under different schemes (Table 7), it is evident that when considering individual profits, the quality control contract scheme results in lower profits for the M remanufacturer than the basic SD model. Consequently, from the individual profit perspective, the M remanufacturer faces profit losses and is unlikely to accept the single quality control contract scheme. Conversely, the quality control–revenue-sharing combination contract scheme enables each CLSC member to experience higher profits than the basic SD model, making accepting the quality control contract more probable. Moreover, this combined contract scheme also decreases the profit gaps between CLSC members, thereby enhancing its acceptance among member enterprises in terms of fairness.
Table 7.
Comparison of the profit of each member under different schemes.
An analysis of each CLSC member’s compliance with quality improvement commitments and the profitability under different schemes suggests that when each member actively and consciously performs the commitment, the profit rises. Once the probability of each member not complying with the quality improvement commitment increases, the profit shows a downward trend. Until the quality improvement promise was renewed, the profits began to recover. Accordingly, compliance with the quality improvement commitment is closely related to the profit, and failure to carry out quality improvement according to the commitment will negatively impact the profit of each member.
4.2.3. Managerial Implications
From the perspective of social production reality, this study considers the quality control problem in CLSC. The SD model is built strictly according to the real CLSC operating situation, and two contract coordination schemes are studied to prevent CLSC members from violating quality improvement commitments. A series of reliable conclusions are drawn, and the following management implications are derived:
1. CLSC member enterprises should have a long-term vision based on long-term interests, with production sustainability as the goal of business decision making, to avoid abandoning the initial quality improvement decision due to temporary business difficulties. Although the extra benefit of quality improvement will increase enterprise operating costs in the short term, the improved quality allows products to win the favor of consumers in the long run, and the expanded consumer market increases enterprise income.
2. Among the CLSC members, i.e., the remanufacturer, retailer, and recycler, the recycler is most likely to break the quality improvement promise. In addition to the short-sighted decisions, the recycler finds it difficult to make profits, and its income gap is larger than that of the other two. Recyclers have small profit margins as the processing cost of recycled products is high, and substandard recycled products have to be eliminated. Therefore, the government and other CLSC participants can consider appropriately subsidizing the recyclers to actively carry out recycling and improve recycling quality.
3. Non-mandatory verbal commitments between CLSC enterprises risk violation at any time, necessitating mandatory contracts. Enterprises can jointly discuss and formulate contract plans according to their conditions and the overall CLSC situation. According to the simulation results in this paper, the quality control contract strongly constrains the business behavior of member enterprises, and the revenue-sharing contract positively affects the reasonable profit distribution, which provides a reference for enterprises to select contract schemes.
5. Conclusions
5.1. Concluding Remarks
In order to address quality control problems in the three-level remanufacturing CLSC composed of the remanufacturer, retailer, and recycler, this study employs contract coordination in an attempt to perform all-member and whole-process CLSC quality control. The SD model of the evolutionary game for the remanufacturing CLSC under the quality control contract scheme and the quality control–revenue-sharing combination contract scheme is constructed. By comparing the evolutionary game situation of the quality improvement decisions and the profit situation of each member under different schemes, the following conclusions are drawn:
- Without mandatory contractual constraints, non-compliance with quality improvement commitments occurs in the CLSC, which is strongly linked to profits. Over time, commitment breaches stemming from members’ myopic tendencies fail to enhance the members’ profits and jeopardize the enterprise’s sustainable development while further undermining its profitability.
- Compared with M remanufacturer and R retailer, T recycler is more likely to break quality improvement promises. The M remanufacturer and R retailer always maintain a high degree of consciousness in fulfilling their quality improvement commitments, while the T recycler is bound to violate their quality improvement commitments without mandatory contract program constraints.
- Contract coordination can effectively address quality control issues in CLSC. The quality control contract scheme effectively regulates the conduct of each CLSC member. Whether implemented through a single contract or a combined contract, it prevents non-compliance with quality improvement commitments, thereby promoting the sustainable production of CLSC enterprises.
- The quality control–revenue-sharing combination contract solution can solve the quality control problem and promote the CLSC profit improvement. Under the coordinated contract scheme, the overall CLSC profit is effectively improved, and the sustainability of enterprise production is greatly enhanced. From the profit perspective, the profit coordination function of the combined contract scheme is better.
5.2. Limitations and Future Research Directions
Actual social production often features information asymmetry among members of CLSC, and online supply chain channels are also on the rise. Therefore, the future research could consider the information asymmetry among members and increase the online supply chain channels so that the SD model can better reflect the actual CLSC operation state and draw more valuable conclusions for daily CLSC management.
Author Contributions
Conceptualization, W.D. and D.X.; methodology, W.D. and M.L.; software, M.L.; validation, W.D., M.L. and L.H.; formal analysis, D.X.; investigation, W.D. and M.L.; resources, W.D. and L.H.; data curation, M.L.; writing—original draft preparation, W.D. and M.L.; writing—review and editing, D.X. and L.H.; visualization, M.L.; supervision, D.X.; project administration, W.D.; funding acquisition, W.D., D.X. and L.H. All authors have read and agreed to the published version of the manuscript.
Funding
This research was funded by the National Natural Science Foundation of China, Grant number 72264029; the Inner Mongolia Natural Science Foundation, Grant numbers 2022MS07012 and 2024MS07015; the Basic Scientific Research Funds of Colleges and Universities Directly Under the Autonomous Region, Grant numbers JY20220055; Key Research Institute of Humanities and Social Sciences at Universities of Inner Mongolia Autonomous Region, Grant number KFSM-GDSK0102.
Data Availability Statement
The original contributions presented in the study are included in the article; further inquiries can be directed to the corresponding author.
Conflicts of Interest
The authors declare no conflicts of interest.
References
- Alamdar, S.F.; Rabbani, M.; Pricing, J.H. Collection, and Effort Decisions with Coordination Contracts in a Fuzzy, Three-level Closed-loop Supply Chain. Expert Syst. Appl. 2018, 104, 261–276. [Google Scholar] [CrossRef]
- Wang, Y.; Su, M.; Shen, L.; Tang, R. Decision-making of Closed-loop Supply Chain under Corporate Social Responsibility and Fairness Concerns. J. Clean. Prod. 2021, 284, 125373. [Google Scholar] [CrossRef]
- Centobelli, P.; Cerchione, R.; Esposito, E.; Passaro, R.; Shashi. Determinants of the transition towards circular economy in SMEs: A sustainable supply chain management perspective. Int. J. Prod. Econ. 2021, 242, 108297. [Google Scholar] [CrossRef]
- Liu, L.; Huang, C.Z.; Huang, G.; Baetz, B.; Pittendrigh, S.M. How a Carbon Tax Will Affect an Emission-intensive Economy: A Case Study of the Province of Saskatchewan, Canada. Energy 2018, 159, 817–826. [Google Scholar] [CrossRef]
- Hong, X.; Govindan, K.; Xu, L.; Du, P. Quantity and Collection Decisions in a Closed-loop Supply Chain with Technology Licensing. Eur. J. Oper. Res. 2017, 256, 820–829. [Google Scholar] [CrossRef]
- Asl-Najafi, J.; Yaghoubi, S. A novel perspective on closed-loop supply chain coordination: Product life-cycle approach. J. Clean. Prod. 2021, 289, 125697. [Google Scholar] [CrossRef]
- Yang, L.; Hu, Y.; Huang, L. Collecting Mode Selection in a Remanufacturing Supply Chain under Cap-and-trade Regulation. Eur. J. Oper. Res. 2020, 287, 480–496. [Google Scholar] [CrossRef]
- Wang, W.; Ding, J.; Hao Sun, H. Reward-penalty Mechanism for a Two-period Closed-loop Supply Chain. J. Clean. Prod. 2018, 203, 898–917. [Google Scholar] [CrossRef]
- Ma, C.-m. Impacts of Demand Disruption and Government Subsidy on Closed-loop Supply Chain Management: A Model Based Approach. Environ. Technol. Innov. 2022, 27, 102425. [Google Scholar] [CrossRef]
- Jensen, J.P.; Prendeville, S.M.; Bocken, N.M.P.; Peck, D. Creating Sustainable Value Through Remanufacturing: Three Industry Cases. J. Clean. Prod. 2019, 218, 304–314. [Google Scholar] [CrossRef]
- Hong, Z.; Zhang, Y.; Yu, Y.; Chu, C. Dynamic Pricing for Remanufacturing within Socially Environmental Incentives. Int. J. Prod. Res. 2019, 58, 3976–3997. [Google Scholar] [CrossRef]
- A New Circular Economy Action Plan for a Cleaner and More Competitive Europe, COM/2020/98. Available online: https://eur-lex.europa.eu/legal-content/EN/TXT/?uri=COM:2020:98:FIN (accessed on 3 August 2024).
- Soleimani, H.; Chhetri, P.; Fathollahi-Fard, A.M.; Mirzapour Al-e-Hashem, S.M.J.; Shahparvari, S. Sustainable Closed-loop Supply Chain with Energy Efficiency: Lagrangian Relaxation, Reformulations and Heuristics. Ann. Oper. Res. 2022, 318, 531–556. [Google Scholar] [CrossRef]
- Chu, T.; Zhong, Y.; Sun, H.; Jia, W. Research on the “carbon neutrality” path of the household appliance industry considering consumer carbon responsibility. Syst. Eng. Theory Pract. 2024, 44, 1018–1037. [Google Scholar]
- Wang, J.; Kaijie, L. The Impact of Retailers’ CSR Behavior on the Cooperation Strategies of Manufacturers in closed-loop supply chain. Logist. Sci. Technol. 2023, 46, 104–108+117. [Google Scholar]
- Liu, S.; Yao, F.; Chen, D. Csr Investment Decision and Coordination Strategy for Closed-loop Supply Chain with Two Competing Retailers. J. Clean. Prod. 2021, 310, 127378. [Google Scholar] [CrossRef]
- Zheng, B.; Jin, L. Relicensing Scheme Selection in Closed-loop Supply Chains with Differentiated New and Remanufactured Products. Comput. Ind. Eng. 2022, 171, 108443. [Google Scholar] [CrossRef]
- Zeballos, L.J.; Gomes, M.I.; Barbosa-Povoa, A.P.; Novais, A.Q. Addressing the Uncertain Quality and Quantity of Returns in Closed-loop Supply Chains. Comput. Chem. Eng. 2012, 47, 237–247. [Google Scholar] [CrossRef]
- Zhao, C.; Wang, D.; Younas, A. Coordination of Closed-loop Supply Chain considering loss-aversion and remanufactured products quality control. Ann. Oper. Res. 2024, 332, 1189. [Google Scholar] [CrossRef]
- Liu, W.; Qin, D.; Shen, N.; Zhang, J.; Jin, M.; Xie, N.; Chang, X. Optimal pricing for a multiechelon closed loop supply chain with different power structures and product dual differences. J. Clean. Prod. 2020, 257, 120–151. [Google Scholar] [CrossRef]
- Pal, B.; Guin, S.; Chaudhuri, K. Pricing and Quality Competition between Two Substitute Products in a Closed-loop Supply Chain. Int. J. Syst. Sci. Oper. Logist. 2023, 10, 2259294. [Google Scholar] [CrossRef]
- Tan, Y.; Chunxiang Guo, C. Research on Two-way Logistics Operation with Uncertain Recycling Quality in Government Multi-policy Environment. Sustainability 2019, 11, 882. [Google Scholar] [CrossRef]
- Ehsan, I.; Khalid, M.I.; Ricci, L.; Iqbal, J.; Alabrah, A.; Ullah, S.S.; Alfakih, T.M. A Conceptual Model for Blockchain-Based Agriculture Food Supply Chain System. Sci. Program. 2022, 2022, 7358354. [Google Scholar] [CrossRef]
- Shi, Y.; Ying, J.; Shi, D.; Yan, J. Service-Oriented Modeling for Blockchain-Enabled Supply Chain Quality Information Systems. Secur. Commun. Netw. 2022, 2022, 1987933. [Google Scholar] [CrossRef]
- Xu, F.; Lu, X.; Zhao, X. The Implications of Socially Responsible Retailing Platform on Channel Structure Choice and Product Quality Decisions. Sustainability 2022, 14, 5691. [Google Scholar] [CrossRef]
- Bis49was, I.; Gupta, R.; Tiwari, S.; Talluri, S. Multi-echelon supply chain coordination: Contract sequence and cut-off policies. Int. J. Prod. Econ. 2023, 259, 108823. [Google Scholar] [CrossRef]
- Wang, Y.; Yu, Z.; Shen, L.; Dong, W. Impacts of Altruistic Preference and Reward-penalty Mechanism on Decisions of E-commerce Closed-loop Supply Chain. J. Clean. Prod. 2021, 315, 128132. [Google Scholar] [CrossRef]
- Huang, Z. Stochastic Differential Game in the Closed-loop Supply Chain with Fairness Concern Retailer. Sustainability 2020, 12, 3289. [Google Scholar] [CrossRef]
- Fu, X.; Liu, S.; Han, G. Supply chain partners’ decisions with heterogeneous marketing efforts considering consumer’s perception of quality. RAIRO Oper. Res. 2021, 55, 3227–3243. [Google Scholar] [CrossRef]
- Bulmus, S.; Zhu, S.; Teunter, R. Competition for cores in remanufacturing. Eur. J. Oper. Res. 2014, 233, 105–113. [Google Scholar] [CrossRef]
- Chen, L.; Gao, M. Optimizing Strategies for E-waste Supply Chains under Four Operation Scenarios. Waste Manag. 2021, 124, 325–338. [Google Scholar] [CrossRef]
- Accorsi, R.; Bortolini, M.; Gamberi, M.; Guidani, B.; Manzini, R.; Ronzoni, M. Simulating Product-packaging Conditions under Environmental Stresses in a Food Supply Chain Cyber-physical Twin. J. Food Eng. 2022, 320, 110930. [Google Scholar] [CrossRef]
- Zhang, Y.; Chu, F.; Che, A. Closed-loop Inventory Routing Problem for Perishable Food with Multi-type Returnable Transport Items. Ifac-Pap. 2022, 55, 2828–2833. [Google Scholar] [CrossRef]
- Ng, S.C.H.; Ho, G.T.S.; Wu, C.H. Blockchain-iiot-big Data Aided Process Control and Quality Analytics. Int. J. Prod. Econ. 2023, 261, 108871. [Google Scholar] [CrossRef]
- Tang, S.; Wang, W.; Zhou, G. Remanufacturing in a Competitive Market: A Closed-loop Supply Chain in a Stackelberg Game Framework. Expert Syst. Appl. 2020, 161, 113655. [Google Scholar] [CrossRef]
- Panda, S.; Modak, N.M.; Cárdenas-Barrón, L.E. Coordinating a Socially Responsible Closed-loop Supply Chain with Product Recycling. Int. J. Prod. Econ. 2017, 188, 11–21. [Google Scholar] [CrossRef]
- Kuchesfehani, E.K.; Parilina, E.M.; Zaccour, G. Revenue and Cost Sharing Contract in a Dynamic Closed-loop Supply Chain with Uncertain Parameters. Ann. Oper. Res. 2022, 322, 851–877. [Google Scholar] [CrossRef]
- Li, J.; Gong, S. Coordination of Closed-loop Supply Chain with Dual-source Supply and Low-carbon Concern. Complexity 2020, 2020, 7506791. [Google Scholar] [CrossRef]
- Guan, Y.; Hou, Q. Dynamic Strategy of Power Battery Closed-Loop Supply Chain Considering Cascade Utilization. IEEE Access 2022, 10, 21486–21496. [Google Scholar] [CrossRef]
- Chaharmahali, G.; Ghandalipour, D.; Jasemi, M.; Molla-Alizadeh-Zavardehi, S. Modified Metaheuristic Algorithms to Design a Closed-loop Supply Chain Network Considering Quantity Discount and Fixed-charge Transportation. Expert Syst. Appl. 2022, 202, 117364. [Google Scholar] [CrossRef]
- Fan, D.X.; Li, C.L.; Bin, H. Research on coordination of forward sales and reverse recovery contracts in dual channel closed loop supply chain. Econ. Manag. 2021, 35, 85–92. [Google Scholar]
- Schwaninger, M.; Hamann, T.K. Theory-Building with SDs: Principles and Practices. In Computer Aided Systems Theory—EUROCAST 2005. Lecture Notes in Computer Science; Moreno Díaz, R., Pichler, F., Quesada Arencibia, A., Eds.; Springer: Berlin/Heidelberg, Germany, 2005; Volume 3643. [Google Scholar] [CrossRef]
- Pillay, N.S.; Brent, A.C.; Musango, J.K.; van Geems, F. Using a System Dynamics Modelling Process to Determine the Impact of Ecar, Ebus and Etruck Market Penetration on Carbon Emissions in South Africa. Energies 2020, 13, 575. [Google Scholar] [CrossRef]
- Zapata, S.; Castaneda, M.; Franco, C.J.; Dyner, I. Clean and Secure Power Supply: A System Dynamics Based Appraisal. Energy Policy 2019, 131, 9–21. [Google Scholar] [CrossRef]
- Rebs, T.; Brandenburg, M.; Seuring, S. System Dynamics Modeling for Sustainable Supply Chain Management: A Literature Review and Systems Thinking Approach. J. Clean. Prod. 2019, 208, 1265–1280. [Google Scholar] [CrossRef]
- Duan, W.; Ma, H.; Xu, D.S. Analysis of the impact of COVID-19 on the coupling of the material flow and capital flow in a Closed-loop Supply Chain. Adv. Prod. Eng. Manag. 2021, 2021, 5–22. [Google Scholar] [CrossRef]
- Delavar, H.; Gilani, H.; Sahebi, H. A system dynamics approach to measure the effect of information sharing on manufacturing/remanufacturing systems’ performance. Int. J. Comput. Integr. Manuf. 2022, 35, 859–872. [Google Scholar] [CrossRef]
- Gao, N.; Qu, L.-C.; Jiang, Y.-T. A System Dynamic Model of Closed-loop Supply Chain considering Recovery Strengthening and Product Differentiation. Math. Probl. Eng. 2022, 2022, 3778597. [Google Scholar] [CrossRef]
- Duan, W.; Cao, H.L.; Xu, D.S. Research on the Impact of New Parts Price Increase on the Stability of closed-loop supply chain. Sustainability 2023, 15, 12587. [Google Scholar] [CrossRef]


Disclaimer/Publisher’s Note: The statements, opinions and data contained in all publications are solely those of the individual author(s) and contributor(s) and not of MDPI and/or the editor(s). MDPI and/or the editor(s) disclaim responsibility for any injury to people or property resulting from any ideas, methods, instructions or products referred to in the content. |
© 2024 by the authors. Licensee MDPI, Basel, Switzerland. This article is an open access article distributed under the terms and conditions of the Creative Commons Attribution (CC BY) license (https://creativecommons.org/licenses/by/4.0/).