Review

Resilience Metrics for Socio-Ecological and Socio-Technical Systems: A Scoping Review

by
Patrick Steinmann
1,2,*,
Hilde Tobi
2 and
George A. K. van Voorn
2
1
Faculty of Technology, Policy, and Management, Delft University of Technology, Jaffalaan 5, 2628 BX Delft, The Netherlands
2
Biometris, Wageningen University & Research, 6700 HB Wageningen, The Netherlands
*
Author to whom correspondence should be addressed.
Systems 2024, 12(9), 357; https://doi.org/10.3390/systems12090357
Submission received: 1 July 2024 / Revised: 12 August 2024 / Accepted: 3 September 2024 / Published: 10 September 2024
(This article belongs to the Special Issue Data-Driven Decision Making for Complex Systems)

Abstract

:
An increased interest in the resilience of complex socio-ecological and socio-technical systems has led to a variety of metrics being proposed. An overview of these metrics and their underlying concepts would support identifying useful metrics for applications in science and engineering. This study undertakes a scoping review of resilience metrics for systems straddling the societal, ecological, and technical domains to determine how resilience has been measured, the conceptual differences between the proposed approaches, and how they align with the domains of their case studies. We find that a wide variety of resilience metrics have been proposed in the literature. Conceptually, ten different quantification approaches were identified. Four different disturbance types were observed, including sudden, continuous, multiple, and abruptly ending disturbances. Surprisingly, there is no strong pattern regarding socio-ecological systems being studied using the “ecological resilience” concept and socio-technical systems being studied using the “engineering resilience” concept. As a result, we recommend that researchers use multiple resilience metrics in the same study, ideally following different conceptual approaches, and compare the resulting insights. Furthermore, the used metrics should be mathematically defined, the included variables explained and their units provided, and the chosen functional form justified.

1. Introduction

1.1. Background

Humanity is dependent on a variety of socio-ecological and socio-technical systems (SESs and STSs, respectively) to supply critical resources. SES, or systems whose behavior is driven by the feedback effects between the environment and society, include agricultural food-production systems, global climate, and river deltas [1]. STSs are systems characterized by the interaction of engineered technology and society, such as energy infrastructure or transportation networks [2]. Both of these system types are becoming more interconnected and interdependent [3], rendering them more susceptible to disruptions, as failures in systems can affect nominally separate systems [4] or cascade across organizational levels to affect much smaller or larger parts [5].
To ensure the continued functioning of SESs and STSs in the face of disturbances such as droughts, pandemics, or climate change, resilience has been identified as a desirable property [6,7,8,9]. While the term has been interpreted in a variety of ways across time and disciplines [10,11], the shared underlying concept is that a system, after experiencing a disturbance, should be able to recover to some acceptable performance level or configuration within a time frame that is acceptable to stakeholders. The recovery may be achieved through a variety of mechanisms, including redundancy, buffers, evolution, or learning [12,13].
Broadly speaking, there are two possible options for a system’s recovery after a disturbance: either the system reaches the performance level it was functioning at prior to the disturbance or it reaches some other performance level. Mathematically, we can describe these two options as a system having either a single or multiple basins of attraction. In the latter case, the system is pushed from one basin to another by the disturbance. These basins may also be referred to as attractors, steady states, or alternative stable states [14]. Ref. [15] describes the two alternatives as “engineering resilience” and “ecological resilience”, respectively, and these terms are widely used in the resilience literature to describe the two possible dynamics. Figure 1, originally by [16], illustrates the engineering and ecological resilience concepts.
A key issue in the study of systems resilience is the translation of the concept of resilience into a measurable system property [17]. For example, ref. [15] proposed measuring return speed to equilibrium for “engineering resilience” and absorption capacity before shifting performance levels for “ecological resilience”. A wide variety of other resilience metrics have been proposed in the literature, such as flow magnitudes [18] or differences between pre- and post-disturbance spatial patterns [19]. The diversity of approaches has challenged our ability to effectively measure resilience [20]. For existing overviews of various resilience measurement and assessment approaches, we refer to [21,22,23].
However, there has been little work on classifying resilience metrics to gain a more systematic understanding of different conceptual measurement approaches. Addressing this first knowledge gap would be useful for the governance of modern SESs and STSs, as both scientists and policymakers are increasingly recognizing that these systems serve a variety of parties with diverse and potentially opposing needs [24,25]. In such situations, having a clear understanding of what different parties might see as the “appropriate” way to quantify their desired objective may facilitate successful governance by revealing aligned and opposing perspectives, asymmetries, and compromise potential [26]. One important aspect that parties may disagree on is the need for resilience of the system in response to different disturbances. Disturbances may differ in origin, timing, and frequency, length, intensity, and more. For instance, ref. [27] summarizes the possible disturbances into two categories: long-term sustained disturbances and short-term pulse disturbances, both of which may occur once or multiple times within a given time frame. The resilience against these different disturbances need not be the same, as resilience mechanisms differ. Increasing resilience against flooding likely entails building (higher) dikes, while this is not helpful against an increasing frequency of droughts. Depending on the resilience objective, actors may have different ideas about what to focus on and hence what to measure.
A second gap in the literature is the correspondence between socio-ecological systems and “ecological resilience” and vice versa, socio-technical systems and “engineering resilience”. As described earlier, the former are types of systems, the latter behavior patterns of such systems. While a close correspondence is suggested by their naming, it is unclear whether the pairings are observable in the published literature—that is, whether the resilience of socio-ecological systems is studied in the “ecological” sense of multiple basins of attraction and the resilience of socio-technical systems in the “engineering” sense of a single basin of attraction.
In this article, we conduct a systematic scoping review of resilience metrics described in the peer-reviewed literature on socio-ecological and -technical systems, in order to address the two knowledge gaps identified above. In the Section 1, we introduce the topic and rationale and outline our goals. In the Section 2, we protocol our search process, inclusion and exclusion criteria, data extraction, and synthesis methods. In the Section 3, we describe and synthesize our results. In the Section 5, we discuss our findings and their implications for future practice and research.

1.2. Objectives

The presented research is a systematic scoping review aimed at answering the following research questions:
  • Which metrics have been proposed to quantify the resilience of socio-ecological and -technical systems?
  • How do these metrics differ conceptually?
  • What types of disturbances have been used to study the resilience of socio-ecological and -technical systems?
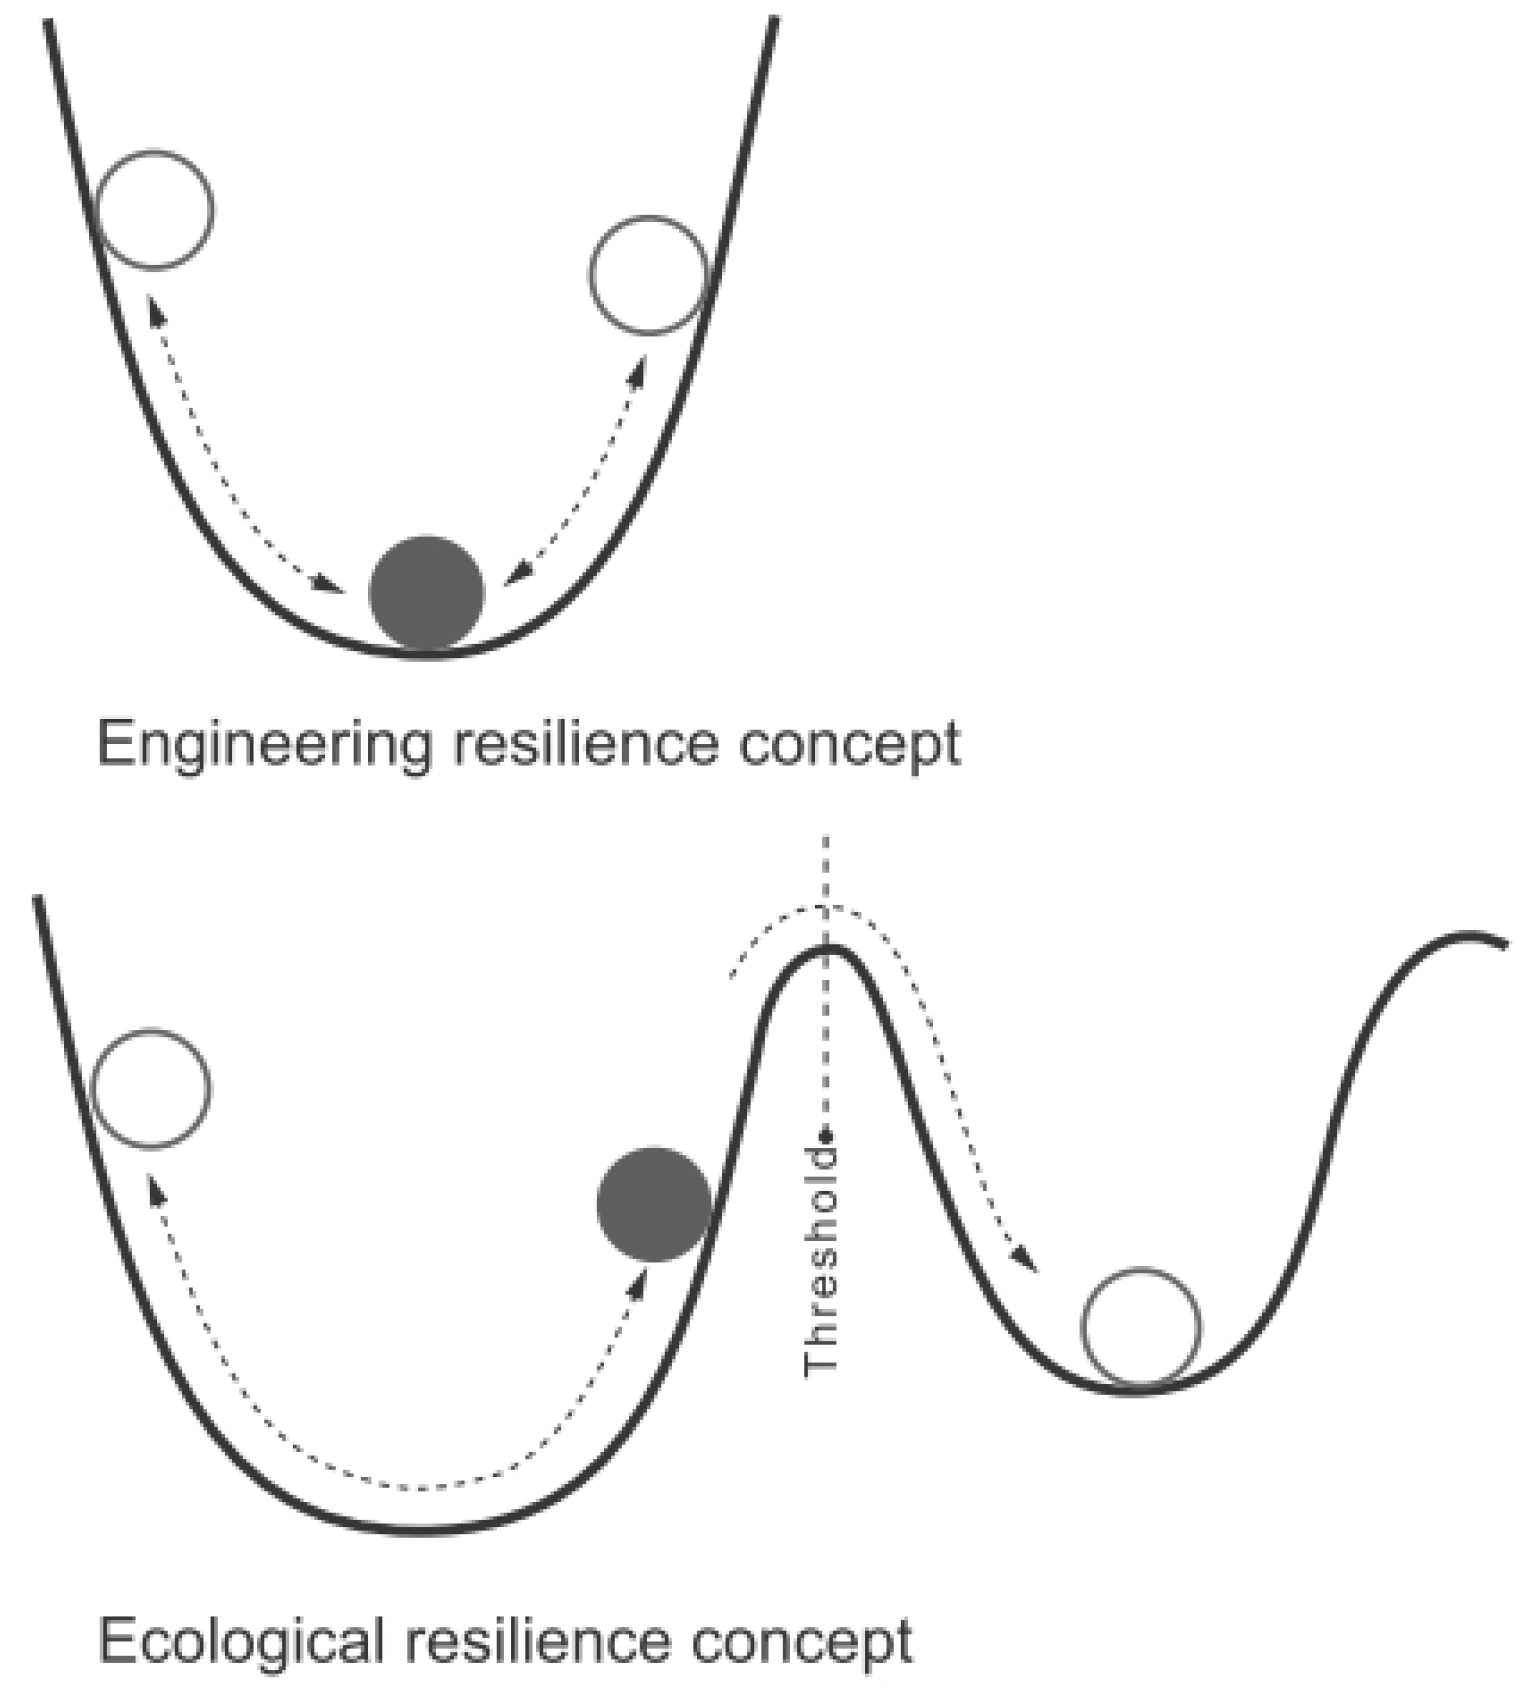
  • How strictly are the concepts of engineering and ecological resilience applied to socio-ecological and socio-technical systems, respectively?
In answering the stated research questions, we make the following contributions to the methodological resilience literature:
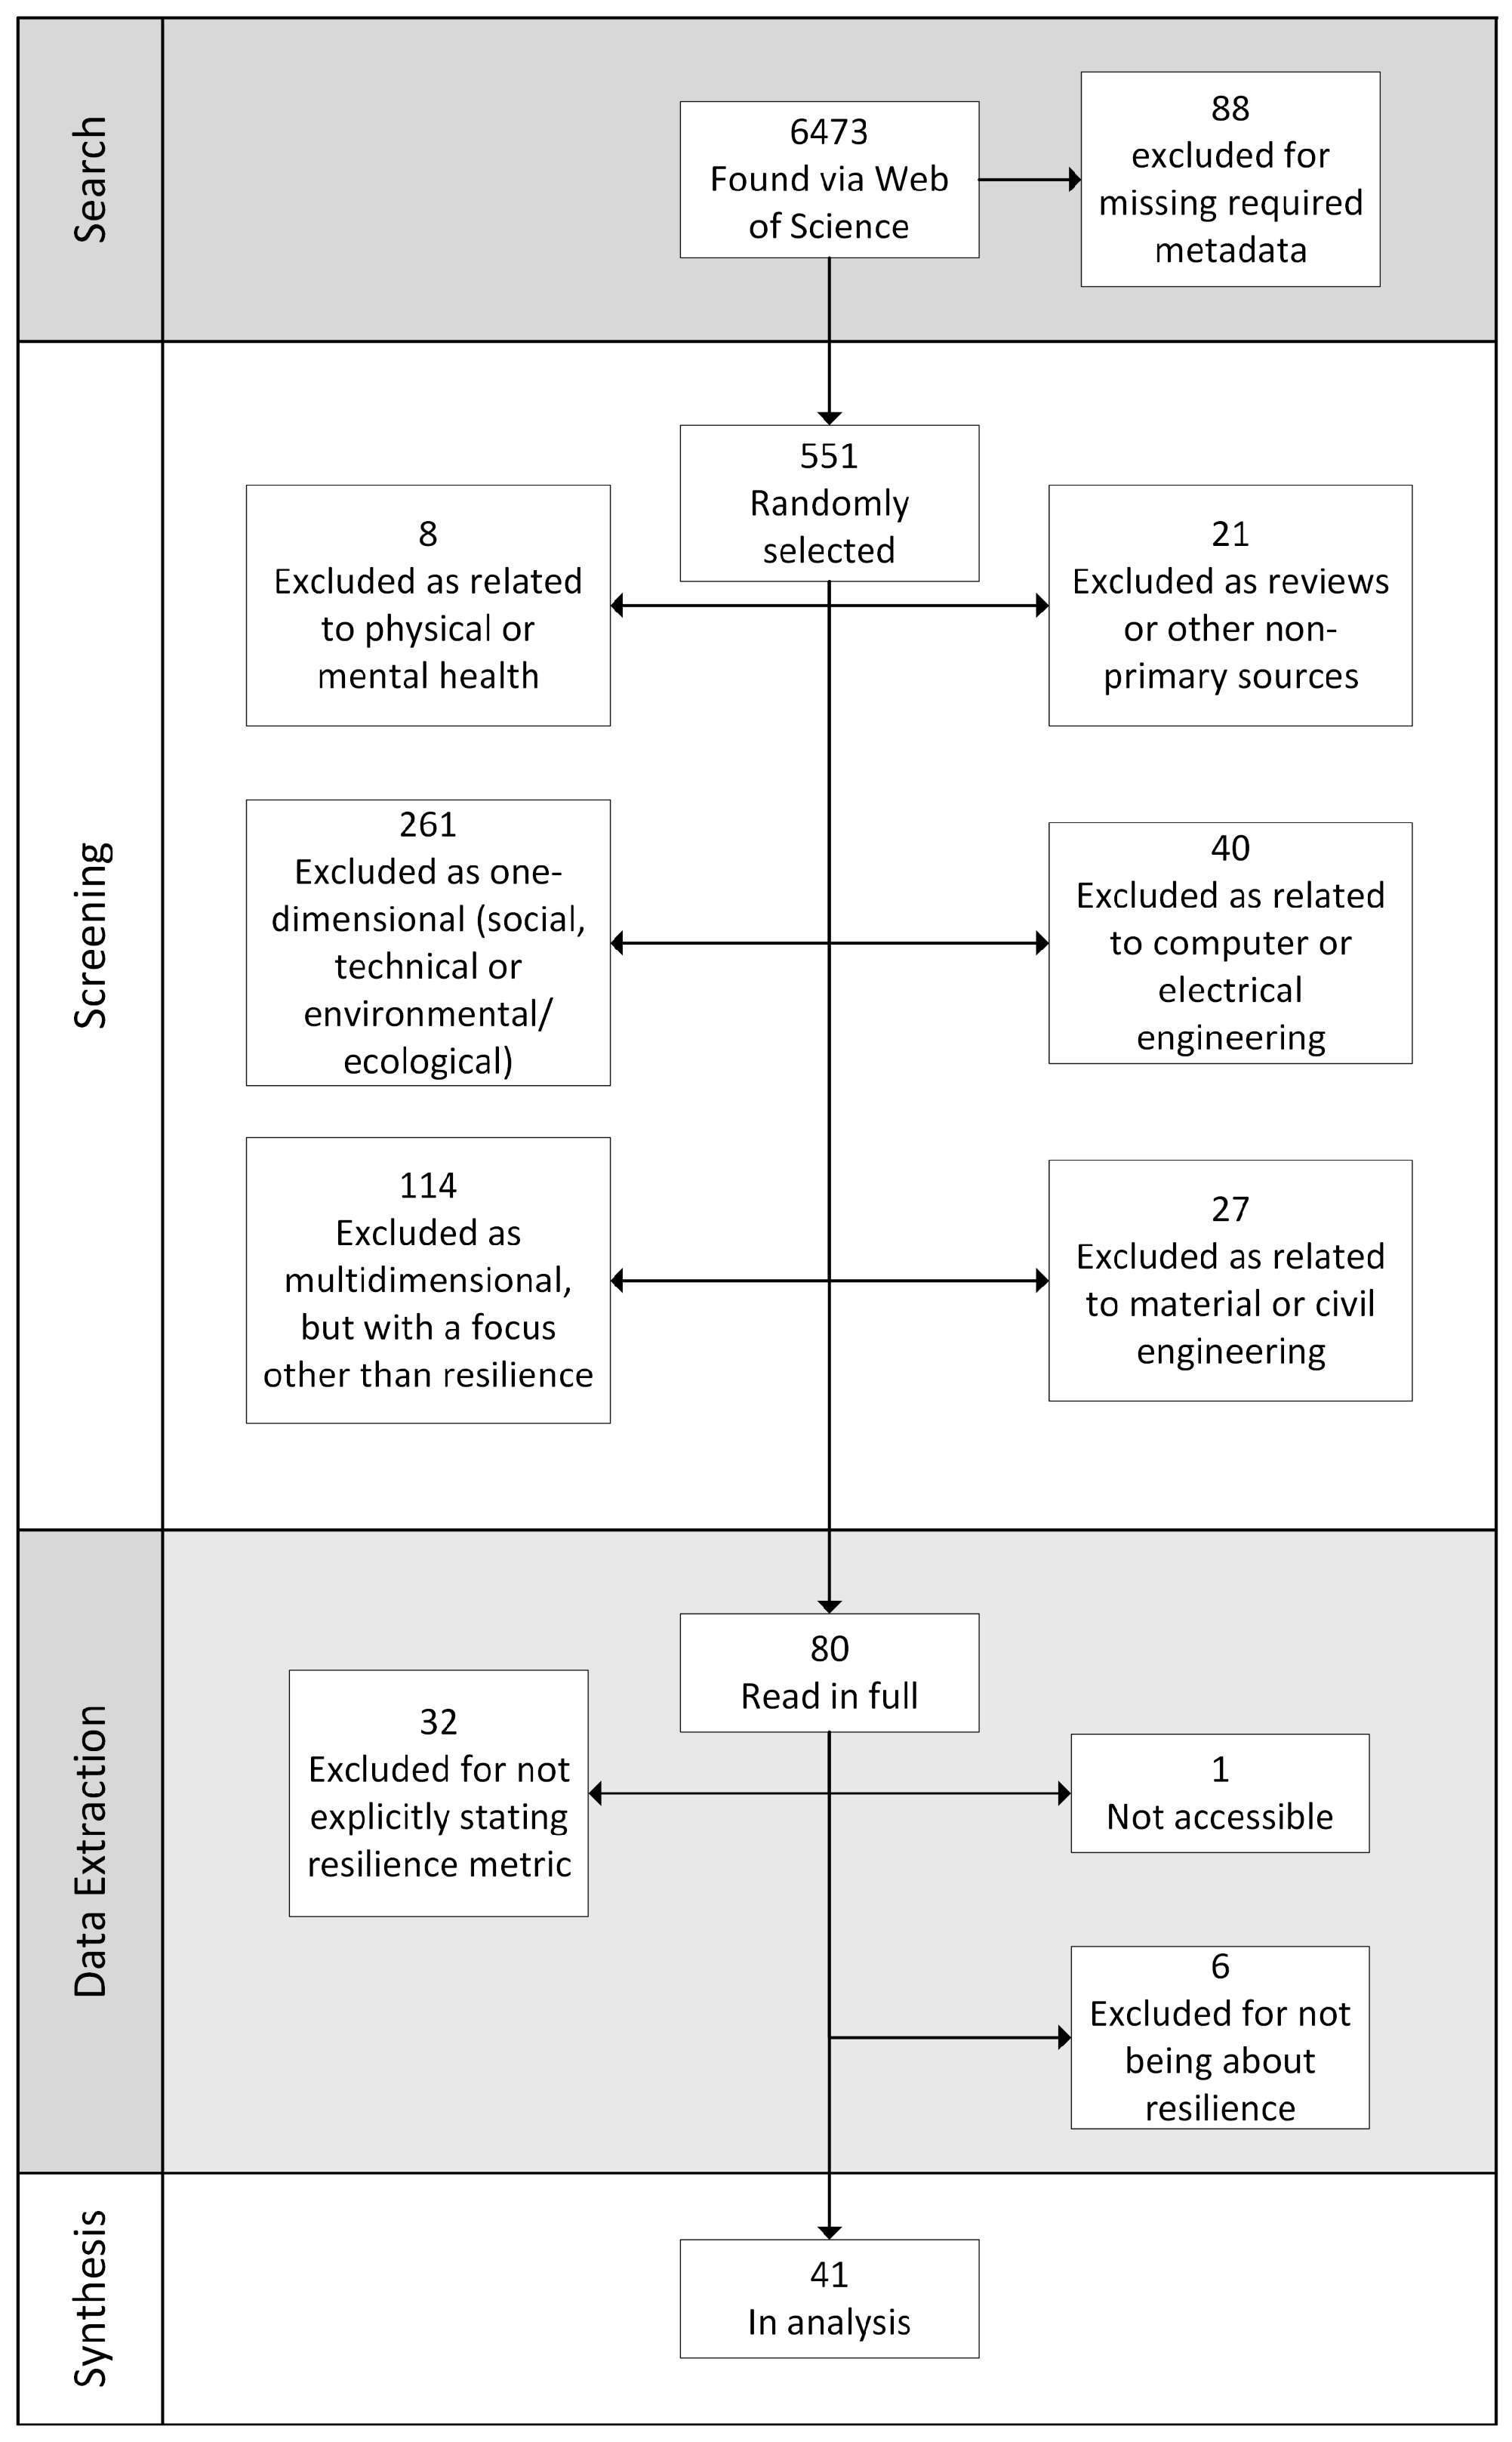
  • We conduct a systematic and reproducible scoping review of resilience metrics for socio-ecological and socio-technical systems.
  • We summarize a number of conceptual approaches to quantifying resilience and highlight which approaches were not represented, indicating potential research gaps.
  • We describe two classes of system disturbances that are documented in case studies, but do not readily fit into known classifications of disturbances.
  • We show how commonly socio-ecological systems are studied from an ecological resilience perspective and, correspondingly, how commonly socio-technical systems are studied from an engineering resilience perspective.

2. Methods

2.1. Protocol and Registration

This scoping review follows the guidelines for Preferred Reporting Items for Systematic Reviews and Meta-Analyses for Scoping Reviews (PRISMA-ScR) [28,29], which is based on the PRISMA scheme [30] for systematic reviews. This is a sophisticated, predetermined protocol for conducting systematic scoping reviews. Over a series of well-defined steps, the review is performed and documented following a checklist. All intermediate steps such as search query, inclusion criteria, or data extraction items are reported. Following a systematic scoping review protocol ensures a transparent and reproducible approach to the review process, which minimizes bias and increases the reliability and reproducibility of the findings. The protocol was not registered publicly prior to data extraction.

2.2. Eligibility Criteria

To be included in the study, papers needed to study the resilience of a system from the socio-ecological or -technical domains and include some method for quantifying this resilience using a dynamic resilience curve [31]. This method could consider multiple characteristics of the studied system, but had to ultimately collapse these characteristics into a single number. Papers were included if they were peer-reviewed, published in English, and mentioned resilience and either socio-ecological or socio-technical systems in their title, abstract, or keywords. Papers were excluded if they discussed individual-level resilience in a psychological, clinical, or psychiatric context, or if they related to alternative interpretations of the term “resilience” common in materials science (elasticity of materials), electrical engineering (sensitivity to electromagnetic interference), or computer science (ditto). We also excluded non-primary sources, such as reviews.

2.3. Information Sources

We identified potentially relevant sources through a search on Web of Science, performed on 21 July 2020, across four major databases (Science Citation Index, Social Science Citation Index, Arts and Humanities Citation Index, and Emerging Sources Citation Index).

2.4. Search

The final search query for Web of Science is presented in Table 1 as corresponding elements of the primary research question and query.

2.5. Selection of Sources of Evidence

Sources of evidence were selected through a two-phase approach. First, we screened the abstracts of the potentially relevant works (N = 551) and applied inclusion and exclusion criteria. To develop and refine the criteria in this phase, random subsets (first round: N = 15, second round: N = 15, third round: N = 30) from the cleaned query results were independently screened by all three authors. We discussed disagreements on selection and exclusion and iteratively revised and clarified the criteria where necessary. For the third and final round, we reached consensus on 28 out of 30 (93%) abstracts regarding inclusion/exclusion. The inclusion criteria were twofold—the manuscript had to consider at least two of the three following dimensions: social, technical, and ecological. This criterion was chosen to ensure that included works would consider SESs or STSs, respectively. Furthermore, the abstract had to indicate that some form of quantification or measurement of resilience was performed. The exclusion criteria were similarly twofold. The first exclusion criterion concerned a number of empirically identified irrelevant scientific domains, namely psychology/health, materials science, and computer science. In all of these domains, resilience is a common term, but not in the sense common for SESs and STSs. The second exclusion criterion related to reviews and other non-primary sources, which we wished to exclude from our review.
In the second phase of selection, we read the full texts of all works which had passed the screening phase (N = 80), again applying exclusion criteria where necessary. Works were excluded if they did not present any form of resilience metric, were not actually about resilience, or were not accessible. All articles passing this second selection step were then selected for the final analysis.

2.6. Data Extraction

We jointly developed a data extraction form, iteratively refining it by independently applying it to selected articles and comparing the results. The final data extraction was performed by the lead author. Where data items were unclear, conclusions were drawn based on the metric used, as we considered this the focal point of our review.

2.7. Data Items

For each article in our review, we extracted the following data items:
  • System type: is the system socio-ecological or socio-technical?
  • Disturbance: what disturbance does the system experience?
  • Basins of attraction: does the system have one or multiple basins of attraction?
  • Resilience metric: what metric for resilience is used?

2.8. Synthesis of Results

For our first and second research questions, we identified the underlying conceptual system properties and the different metrics considered and used these to classify the metrics. For our third research question, we identified and classified the disturbance(s) considered in each paper. For our fourth research question, we established for each paper whether it was related to an ecological or technical domain and compared this domain with the number of basins of attraction the studied system could reach. The last two questions required some interpretation of both the metric and case study. Where necessary, this interpretation was discussed and agreed upon by all authors.

3. Results

3.1. Sources of Evidence

In total, 6473 abstracts were retrieved from Web of Science. Of these, 88 were excluded for missing metadata. From the remaining 6385 articles, a randomly chosen subset was created for abstract-based screening. This reduces the chance for publication and citation biases [32,33] in the outcomes of the review. As the articles were not uniformly distributed across time—many fewer articles on resilience metrics were published in the early 1990s than in recent years—we first stratified the query results into six 5-year strata, and then selected an equal number of papers from each stratum. As we intended to include 10% of the query results in our screening phase, we selected 107 papers per stratum. However, it transpired that the the first two strata (1990–1994, 1995–1999) included less than 107 papers total, so all retrieved papers from this decade were considered in the screening phase. Furthermore, the final stratum (2020–2024) only included a single year (2020) at time of retrieval, therefore, we selected 21 papers (20% of 107) from this stratum. In the end, 551 papers were considered in the screening phase.
Of the screened abstracts, 471 were excluded for either being about resilience in a different context (healthcare, materials science, or electrical engineering), due to being a non-primary source (e.g., a review), for not being about some form of socio-ecological or -technical system (e.g., a purely ecological study of fish populations in alpine lakes), or for not focusing on resilience (e.g., a paper motivating why persistence is distinct from resilience).
Of the remaining 80 articles, one was not accessible to the authors. The remaining 79 were read in full. Of those, 32 were excluded for not explicitly stating a resilience metric, and 6 were excluded for not focusing on resilience. The remaining 41 articles were included in the presented analysis. This entire workflow is visualized in Figure 2.

3.2. Characteristics of Sources of Evidence

In Table 2, we give a demographic overview of the sources considered in our scoping review. Please note that many papers are interdisciplinary and therefore fit multiple research areas (based on Web of Science’s categorization).
In Figure 3, we visualize how many metrics we identified per five-year interval. This figure shows how academic interest in quantifying resilience, at least according to our query keywords, has changed over time.

3.3. Results of Individual Sources of Evidence

The individual sources of evidence included in this systematic scoping review are listed in the Supplementary Table S1. The results of the data extraction performed upon those individual sources of evidence are provided in Supplementary Table S2.

3.4. Synthesis of Results

3.4.1. Resilience Metrics

We identified 46 resilience metrics in the 41 reviewed papers. Of these, 34 were defined as mathematical functions and 12 described verbally. In the following, we refer to these metrics by their ID numbers given in the leftmost column of Supplementary Table S2. Among the mathematically defined metrics, we observed a number of functional forms, including fractions, limits, sums, piecewise definitions, and probabilities. Additionally, in one verbally described metric, a trigonometric function is mentioned. Various degrees of mathematical complexity are apparent, from fractions with two variables to piecewise definitions with a dozen variables. A variety of “corrective” elements, used to transform the output of a function to some desired range or direction, can be observed. Examples include subtraction (e.g., metric #20A), inversion (e.g., metric #4), and piecewise definition (e.g., metric #16). Despite these transformations, we observe both minimization and maximization criteria among the metrics, i.e., some metrics represent “higher resilience” as values closer to 0 (e.g., metric #17), but others as values as large as possible, potentially with an upper bound (e.g., metric #6). The reasoning behind the specific functional forms is rarely explained.
There is no commonality in the notation of the metrics. In other words, for every metric, care must be taken to identify every variable’s exact meaning and unit in the context of that given paper. A number of letters and symbols, such as R, P, and γ appear in multiple metrics but have different meanings. For example, the letter R is used, in upper- or lowercase, to describe the time elapsed from the beginning to the end of a disturbance (metric #9), the resilience of an entire system (e.g., metric #25), and as a coefficient of determination (metric #31A), among others.

3.4.2. Conceptual Approaches to Quantifying Resilience

When moving beyond the mathematical implementations towards the conceptual approaches used to capture the system’s resilience, we observe that some concepts appear in multiple metrics. Examples include the return time of the system to a previous performance level after a disturbance (e.g., metrics #2, #3, and #5), the total performance loss incurred due to the disturbance(s) over time (e.g., metrics #13, #25, and #29), and the largest momentary performance loss due to the disturbance(s) (e.g., metrics #9, #18, and #15). This implies that there are some common ideas about which attributes of a system and its behavior describe its resilience. In this section, we attempt to summarize these conceptual approaches.
Out of a total of 46 metrics, we identified 37 metrics with a single basin of attraction, and 9 metrics which considered multiple basins of attraction. Furthermore, we identified 27 metrics that we consider generic in that they could easily be applied to other systems and disturbances (much like Holling’s return speed and absorption capacity described earlier). As a counter-example, consider metric #10, which uses the fecundity and mortality probabilities of different species in a trophic network to quantify the long-run resilience of the entire network—applying such a metric to an urban water supply network would be difficult to justify. Generic metrics are especially interesting because they facilitate cross-comparison, making resilience analyses more informative [21]. We therefore limit the following analysis to generally applicable metrics for systems with a single basin of attraction, although we do distinguish between single- and multi-disturbance metrics, as we feel they represent distinct schools of thought on quantifying resilience.
Among the generic single-disturbance single-basin metrics, we identified six conceptual approaches that could easily be generalized, visualized in Figure 4. These are:
  • Return time to previous performance level (three metrics: #2, #3, #30A)
  • Total performance loss (six metrics: #13, #25, #29, #36, #38, #39)
  • Combination of maximum performance loss and recovery time (two metrics: #18, #30B)
  • Combination of relative performance loss and return time (one metric: #9)
  • Combination of return time to previous performance level with oscillations, and amplitude of performance (one metric: #15)
  • Return time to previous performance level with oscillations (one metric: #17)
Among the multi-disturbance single-basin metrics, we identified four conceptual approaches, visualized in Figure 5. These are:
7.
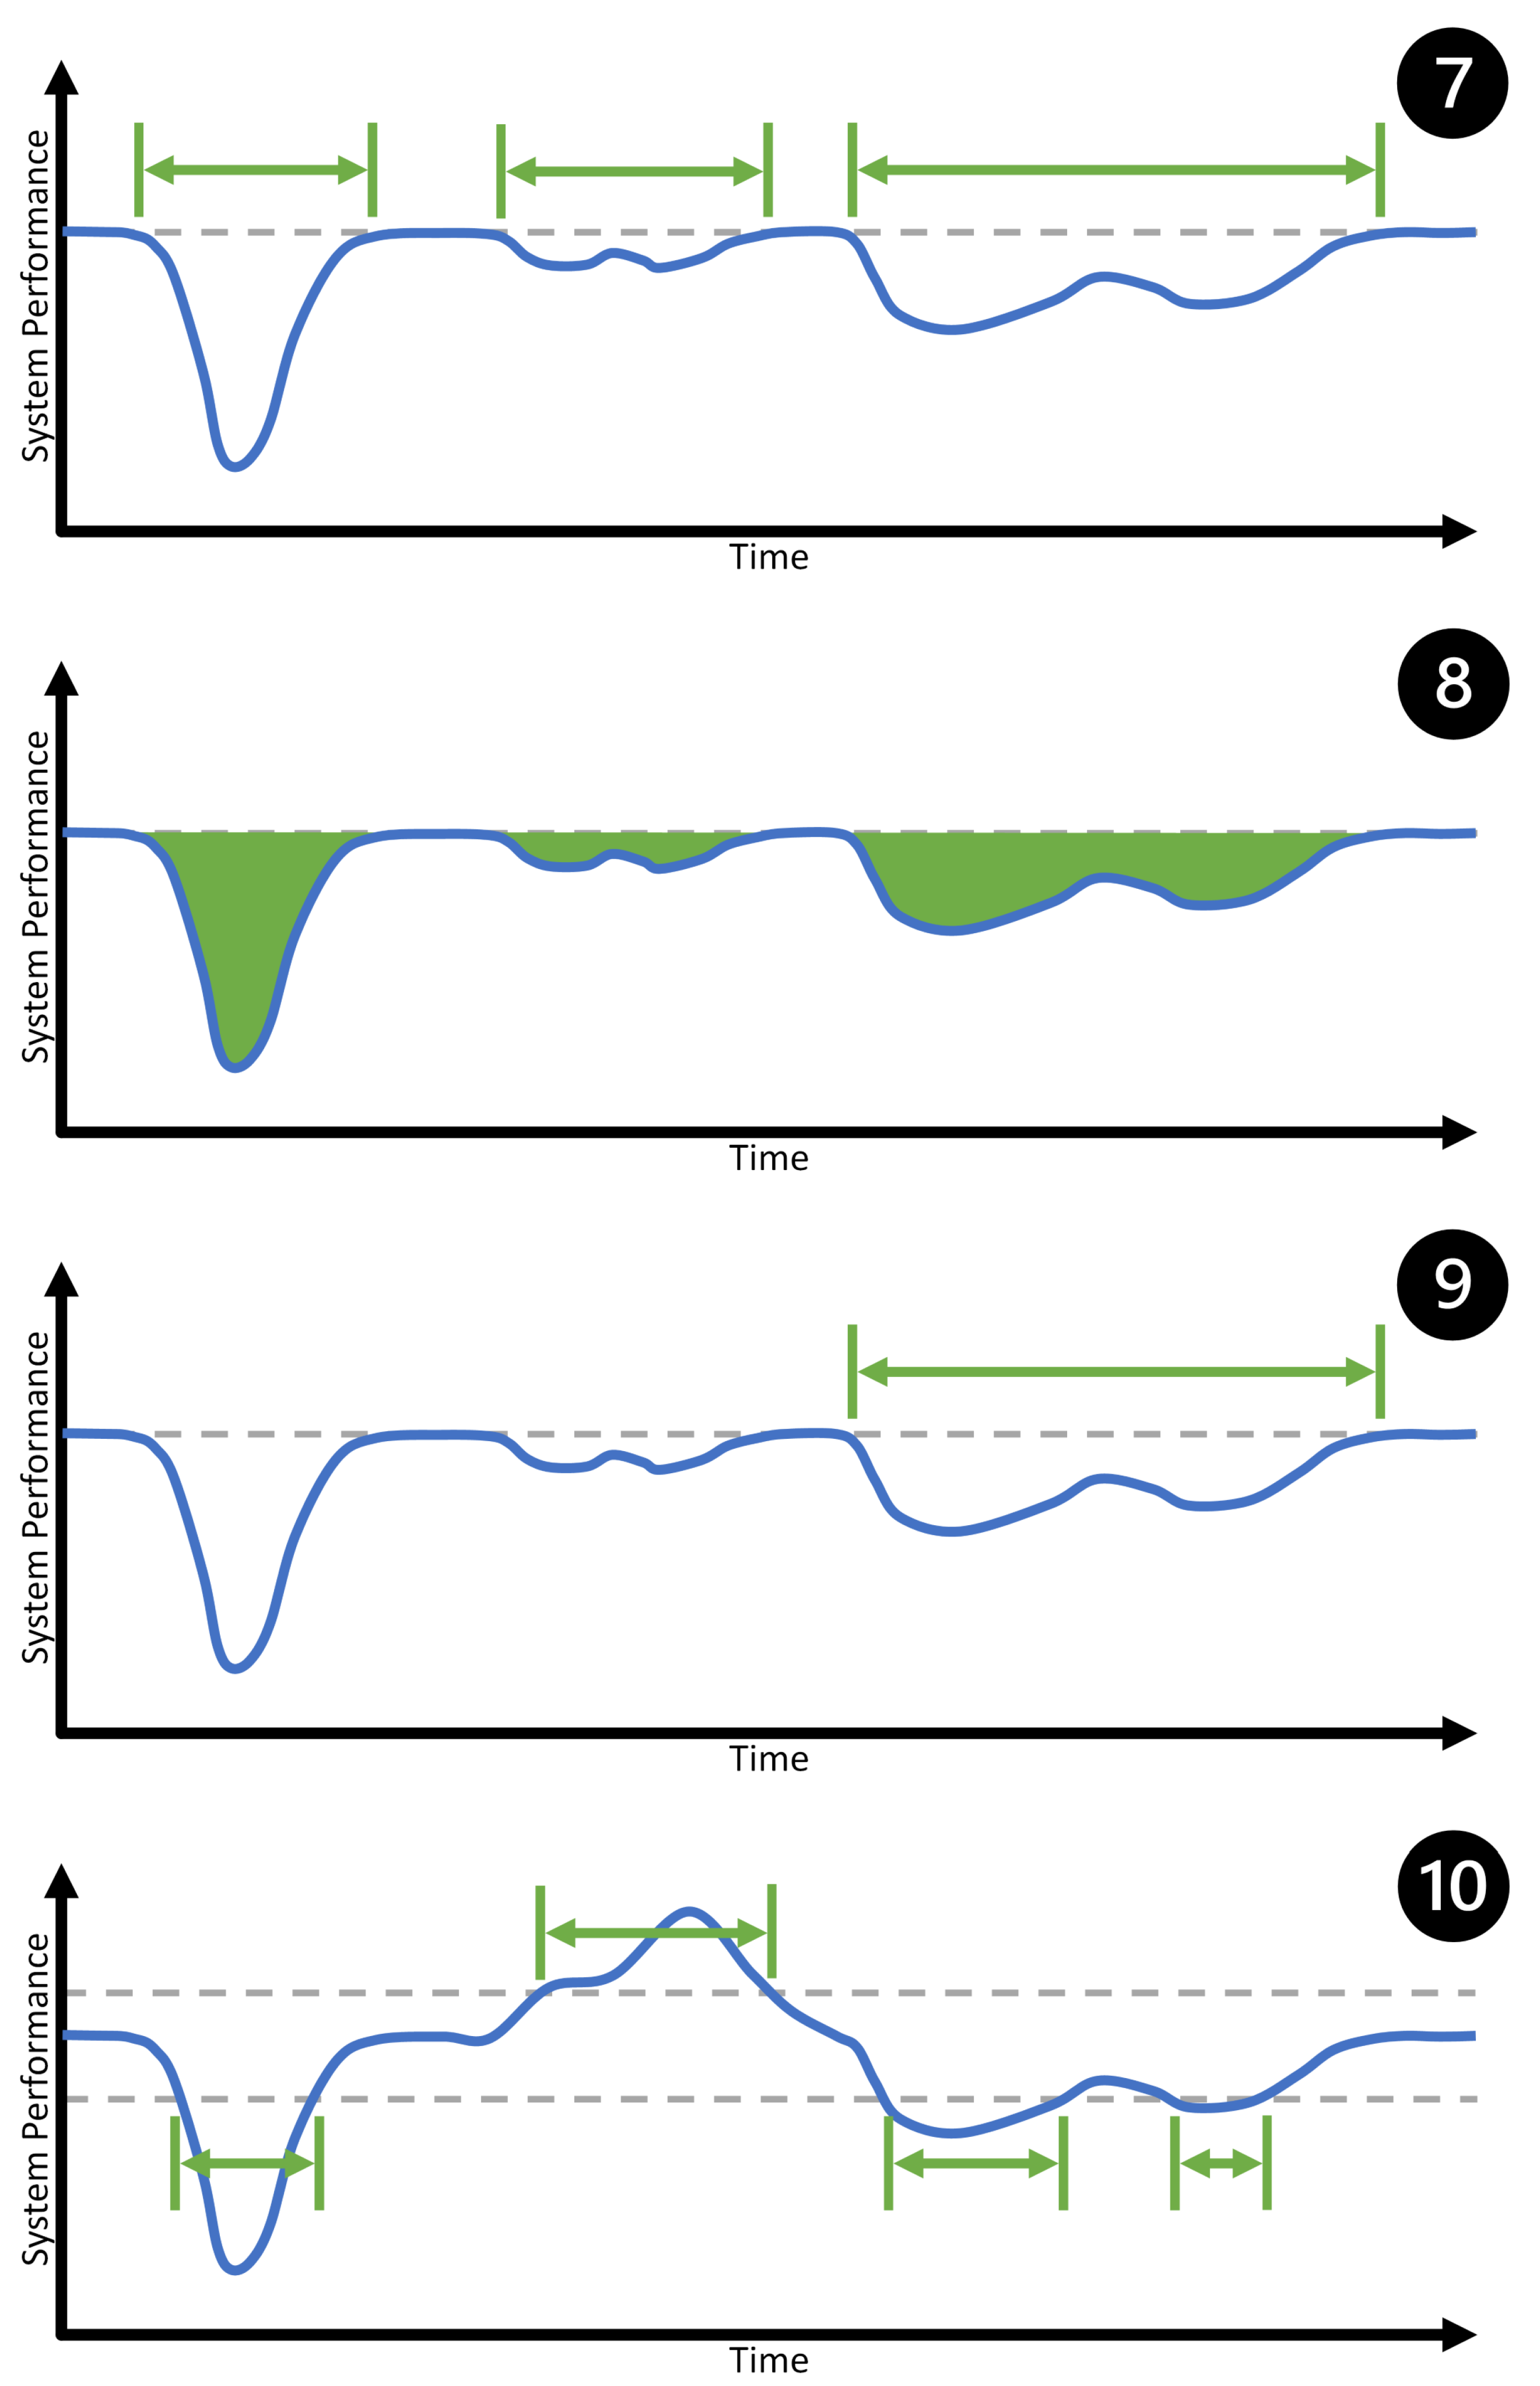
Total time of insufficient performance (8 metrics: #5, #7, #11, #16, #22, #23A, #28, #35)
8.
Total performance loss (one metric: #34)
9.
Longest period of insufficient performance (three metrics: #1, #19, #23B)
10.
Total time spent outside performance range (one metric: #6)

3.4.3. System Disturbances

In the 41 papers, we identified four distinct types of disturbances. These include 15 cases (17 metrics) of a sudden disturbance, such as an earthquake, 7 cases (8 metrics) of a continuous disturbance, such as drought, 15 cases (17 metrics) where multiple disturbances were observed, such as a multi-year period of repeated flooding, two cases (two metrics) where a continuous disturbance abruptly ends, such as a ban on fishing after a period of intense fishery activity, and two cases (two metrics) where the disturbance was not specified. Please note that all papers including multiple metrics used those metrics in conjunction with a single disturbance.

3.4.4. Alignment between SESs and Ecological Resilience, and STSs and Engineering Resilience

Among the 46 metrics included in this review, we identified 37 as having a single basin of attraction, thus subscribing to the “engineering resilience” concept described by [15]. A further eight metrics accommodated multiple basins of attraction, in line with what Holling called “ecological resilience”. The case studies these metrics belonged to comprised 15 studies of socio-ecological systems, such as fisheries or managed forests, and 31 studies of socio-technical systems, such as water reservoirs or logistics networks.
When cross-tabulating the number of basins of attraction of each metric with the nature of the case study the metric was applied to (see Table 3), we note that there is no obvious pairing of socio-ecological systems with “ecological resilience”, and socio-technical systems with “engineering resilience”. In fact, both socio-ecological and -technical systems are studied using single and multiple basins of attraction. Socio-ecological systems do have a higher likelihood of being modeled with multiple basins of attraction (5/15 (33%) versus 4/31 (13%)). Considering that there are many more socio-technical case studies, the metrics with multiple basins of attraction are quite evenly split between socio-ecological and -technical systems (5/9 (55%) versus 4/9 (45%)).

4. Discussion

4.1. Summary of Evidence

Through this scoping review, we focused on 41 articles containing 46 resilience metrics for socio-ecological or -technical systems. These sources, identified through an iteratively refined and rigorous search process, span three decades of research and a wide variety of research areas.
While we used a stratified sampling approach to sample more evenly across publication years, Figure 3 reveals that, at least according to our query keywords, the late 1990s and early 2000s seem to have been the most productive era regarding the development of resilience metrics for socio-ecological and -technical systems. This may be due to the publication of a number of influential works on resilience in the early 2000s, including the work of [1,9,34,35], which introduced a number of now well-established resilience-related concepts such as panarchy, socio-ecological resilience, and the adaptive cycle. However, we cannot rigorously establish this connection, and the causality may indeed be reversed—perhaps the wide range of published metrics around the millenium change sparked the conceptual progress in the field of resilience at that time.
The works that included resilience metrics suitable for our purposes came from all research areas, excluding the arts and humanities. This demonstrates how resilience is a concept which has pervaded science across nearly all domains, from physical sciences over engineering to the social and life sciences. Unsurprisingly, Table 2 shows that the two research areas which may be considered the most applied, technology and life sciences and biomedicine, were the most relevant for our query, although it should be noted that many papers fell under multiple research areas.
While all identified metrics purport to quantify the same conceptual idea—the response of a system to disturbance—they do this in a variety of ways. While most papers include a mathematical definition of the employed metric(s), some papers rely exclusively on a verbal definition. This is problematic as a number of different errors can be introduced when translating text into algebra [36]. By not providing their resilience metrics in algebraic form, authors are potentially inducing errors in other scientists’ research, as those scientists attempt to implement the proposed resilience metrics from a verbal description alone. However, as [37] showed, having inaccessible material underlying your work is not necessarily an impediment to scholarly impact (measured through citations). Thus, there may not be enough scholarly incentive for researchers to share the exact details of their resilience metrics, even though it would be good practice to do so [38].
Among the mathematically defined metrics, a diverse range of elements, including piecewise definitions, trigonometry, inversions, and limits can be observed. Some of these are used to constrain the metric to a particular numerical range or direction. However, these transformations are often non-linear, potentially biasing the resulting analysis without stakeholders realizing it [39]. Furthermore, we note that the metrics are used as both maximization and minimization criteria. This implies that care must be taken when substituting one resilience metric for another, especially in an optimization context, as the results may be unexpected.
Authors rarely discuss why a particular functional form was chosen for a metric and whether alternatives were explored. However, documenting and explaining methodological choices (such as the design of a metric) is considered good research practice [40,41] because it helps readers judge the validity of the results. We note that a small number of papers do include multiple resilience metrics applied to the same case study, which could be considered a type of robustness check of the used metrics—if two different metrics correlate regarding their evaluation of a system’s resilience, we may assign a higher degree of validity to those results. However, the need for documentation and explanation also applies here.
Finally, we observed that notation is inconsistent across the reviewed articles, with common letters such as P or R being used to represent a variety of different system characteristics. This inconsistency might be traced back to the wide range of domains in which resilience is applied, many of which have increasingly specific conventions, notations, and jargon [42]. While these may be perfectly sensible within their own domains, the interdisciplinary nature and scope of resilience studies makes this a challenge to the successful dissemination of potentially critical knowledge [43] and can inhibit the effective evaluation and comparison of competing resilience metrics [21]. We note here that we explicitly chose not to harmonize the notation across the included metrics, as we wanted to represent the metrics in the form truest to their original authors’ intentions.
When looking past the mathematical implementation at the underlying conceptual ideas, we observe 10 distinct concepts, including six concepts for systems with a single basin of attraction experiencing a single disturbance and four concepts for systems with a single basin of attraction experiencing multiple disturbances. For the single-disturbance metrics (see Figure 4), a variety of conceptual approaches are evident, considering various characteristics of the underlying system’s behavior including the return time, the maximum temporary loss of performance, the amplitude of the system’s performance, and others. For an overview of these different aspects using a generic resilience performance curve, we point the reader to the work of [31]. Overall, this indicates that researchers consider multiple aspects of a system’s behavior as relevant or indicative for its resilience, and that some common ideas are present regarding which aspects best represent resilience. Interestingly, all the identified metrics relied on quite “direct” properties of the system behavior over time. Approaches such as spectral entropy [44], which decompose a system’s behavior over time into statistical properties and then use those to quantify resilience, did not appear in our results.
For systems experiencing multiple disturbances (see Figure 5), less diversity is apparent, with all identified metrics considering either some form of recovery time (to be precise: time spent at a performance level below requirements and/or desires), or the system’s total performance loss. It is not clear why there is less exploration of other system characteristics here—conceptually, all the single-disturbance concepts from Figure 4 could be applied to multiple disturbances as well. It is noteworthy that the total performance loss was the most commonly applied metric for single-disturbance systems, being used six times, but was only applied to a single multiple-disturbance system. We also observed that none of the measurement approaches compared the individual disturbances within a system’s period of observation with one another, as is done for example in recurrence analysis [45], another potential method for resilience quantification.
We did not study the underlying concepts behind metrics for systems with multiple basins of attraction, as the metrics were too few and too diverse to categorize. This is surprising because the existence of multiple basins of attraction is a well-known and typical characteristic of socio-ecological systems [46,47]. However, it aligns with the work of others on creating taxonomies or overview of resilience metrics—for example, both [22,48] focused exclusively on resilience metrics with a single basin of attraction. Ref. [49] showed that, for simpler (low-dimensional) ecological systems, treating the system as if it had a single basin of attraction may be sufficient—that is, there is a high correlation between the outcomes of “engineering resilience” and “ecological resilience” metrics when applied in the same setting. This may explain why multiple articles included in our review applied resilience metrics for a single basin of attraction to ecological systems with multiple such basins.
The 41 papers included in this review use four distinct types of disturbances in their case studies. These include sudden disturbances, continuous disturbances, repeated or multiple disturbances, and suddenly ending disturbances. For two papers, the disturbance type could not be identified, meaning a key component of resilience [50] could not be specified. We observe that two of the identified types, the repeated/multiple disturbances and the suddenly ending disturbances, do not fit into the categorizations published by [51], which distinguish short-term pulses, long-term constant presses, and long-term increasing ramps, or [27], which distinguish sustained press and short-term pulse disturbances. Understanding the nature of a disturbance, described by its cause, frequency, magnitude, anticipation potential, and time scale, is a key component of assessing a system’s resilience to that disturbance [52]. Having an overview of different disturbance patterns, as we documented them in this review, can contribute to this understanding. This is especially true in the context of ecological resilience, where non-linear shifts in the system’s state can occur due to such shocks [53].

4.2. Limitations

There is a tremendous body of literature on resilience. It is therefore almost certain that we have missed some approaches to quantifying resilience. We limited ourselves to peer-reviewed literature, excluding a wide array of grey literature. While this increases the credibility of our source material, it also increases the likelihood that we missed some unique approach to quantifying resilience. We also only included literature that explicitly uses the word “resilience”, although [54] highlights that a diverse range of terminology is used in studies of ecological stability. Furthermore, we conducted our search using a single scientific database, which is, like every other database, known to be incomplete.
Finally, this scoping review was an enormous undertaking, and our results are thus only up to date as of July 2020. We nevertheless believe our results are informative.

4.3. Recommendations

Based on the analysis and discussion presented above, we make the following two recommendations for researchers working with resilience metrics.
Firstly, as there is such a conceptual and mathematical diversity of methods for quantifying resilience, we recommend that researchers use multiple conceptually distinct metrics to quantify resilience and compare the resulting insights. Doing so will improve the robustness of the analysis by reducing the risk of blind spots introduced by a metric with a narrow focus. For example, a metric using only the return time to a previous performance standard will be oblivious to how the system recovers its performance, while a metric measuring just the total performance loss will not capture how long it took to regain the original performance level. Using these metrics in concert could thus lead to a more holistic understanding of the system’s resilience. Additionally, using multiple metrics in an analysis also offers an exciting opportunity to engage with stakeholders about their perception(s) of resilience and which metric(s) are best able to capture their desired outcomes. In doing so, it may well transpire that a stakeholder’s goals are not captured by commonly used resilience metrics such as return time or performance loss. By engaging in a structured dialogue about desired outcomes and related system characteristics, it may be possible to identify more alternative, more suitable resilience metrics. The outcomes of this dialogue may thus improve the fitness for purpose of the resulting analysis and build trust between analysts and stakeholders [55].
Secondly, we recommend that researchers be explicit about which resilience metric(s) they use, both conceptually and mathematically. The mathematical definition of the metric should be given as a formula, the composition of which should be justified. In addition, the variables should be explained, including units and ranges, which should be given. This information will greatly increase the reproducibility and reusability of the conducted research, both being serious concerns in modern scientific research [56].

4.4. Future Research

Based on our scoping review, we identify three promising directions of future research. Firstly, it may be useful to expand the search query, taking into account the most recent published literature and potential (near) synonyms of resilience, such as fragility [10] or danger [57]. This expansion may identify further conceptual approaches to quantifying resilience beyond what we have presented here. A substantial gap in this regard is the lack of resilience metrics for systems with multiple basins of attraction. Time series analysis may be a useful starting point to address this gap [58].
Alternatively, it may be worthwhile to directly create resilience metrics filling in the gaps between the concepts identified here. For example, for systems with a single basin of attraction and multiple disturbances, we observed metrics that measured the total time at an insufficient performance level (concept #7 in Figure 4), the longest time at an insufficient performance level (concept #9), and the total loss of performance (concept #8). It stands to reason that the largest single loss of performance could therefore also be a potentially insightful approach to quantifying resilience. In this vein, novel resilience metrics could be created and evaluated against existing ones. Over time, this approach might lead to a compositional taxonomy of resilience metrics, comparable to work done for robustness metrics [59].
Finally, the differences between alternative metrics could be studied by applying multiple metrics to a single case study, as was already done in a small number of papers included in this review. By testing conceptually different metrics on one system, we might be able to identify under which conditions certain metrics are preferable, or at least more conservative/optimistic. Furthermore, an exploratory approach to quantifying resilience—applying many metrics and making a holistic assessment across all the resulting data—could be a useful approach for overcoming the challenge of selecting a single metric for complex concepts such as resilience.

5. Conclusions

We conducted a systematic scoping review on how the resilience of socio-ecological and socio-technical systems is quantified in the relevant literature. We identify four main conclusions from this work. Firstly, a variety of resilience metrics is used. These metrics often draw on similar system properties, such as return time to equilibrium or magnitude of disturbance, but these properties are often weighed against each other using different functional forms, which are rarely justified. Secondly, there are some common conceptual ideas behind the different metrics, especially for systems with a single basin of attraction. Thirdly, a small number of different types of disturbances can be identified across the various case studies. However, two of these types do not fit into previously published categorizations of disturbances. Finally, we observed that the concepts of “ecological resilience” (multiple basins of attraction) and “engineering resilience” (single basin of attraction) do not seem to affect how resilience metrics are chosen for specific case studies, despite being deeply entrenched in the resilience literature. Many resilience studies of socio-ecological systems use single-basin-of-attraction metrics, while some socio-technical systems were assessed using multiple-basin-of-attraction metrics.
Our conclusions suggest the following two main consequences. Firstly, we recommend that researchers studying the resilience of socio-technical or -ecological systems use multiple resilience metrics and compare the resulting insights. The different conceptual categories presented in our work provide an starting point for choosing these metrics. While this approach may create additional work for researchers, it will also make the results more analytically robust and provides an opportunity to engage in a dialogue with stakeholders about their perception(s) of resilience. Secondly, we recommend that researchers, having compared multiple resilience metrics, explicitly justify why they chose a specific (type of) metric and what the consequences of this choice are. By documenting this choice and the details of the used metric, both the reproducibility and reusability of the research may be improved.

Supplementary Materials

The following supporting information can be downloaded at https://www.mdpi.com/article/10.3390/systems12090357/s1. Table S1: Papers included in scoping review; Table S2: Resilience metrics identified through scoping review.

Author Contributions

Conceptualization, P.S., H.T. and G.A.K.v.V.; methodology, P.S., H.T. and G.A.K.v.V.; validation, P.S., H.T. and G.A.K.v.V.; investigation, P.S., H.T. and G.A.K.v.V.; data curation, P.S.; writing—original draft preparation, P.S.; writing—review and editing, P.S., H.T. and G.A.K.v.V.; visualization, P.S.; supervision, H.T. and G.A.K.v.V. All authors have read and agreed to the published version of the manuscript.

Funding

This research received no external funding.

Data Availability Statement

Research data is available on request from the corresponding author.

Conflicts of Interest

The authors declare no conflicts of interest.

References

  1. Berkes, F.; Folke, C.; Colding, J. Linking Social and Ecological Systems: Management Practices and Social Mechanisms for Building Resilience; Cambridge University Press: Cambridge, UK, 2000. [Google Scholar]
  2. De Bruijn, H.; Herder, P.M. System and actor perspectives on sociotechnical systems. IEEE Trans. Syst. Man Cybern.-Part A Syst. Hum. 2009, 39, 981–992. [Google Scholar] [CrossRef]
  3. Helbing, D. Globally networked risks and how to respond. Nature 2013, 497, 51–59. [Google Scholar] [CrossRef] [PubMed]
  4. Filatova, T.; Polhill, J.G.; van Ewijk, S. Regime shifts in coupled socio-environmental systems: Review of modelling challenges and approaches. Environ. Model. Softw. 2016, 75, 333–347. [Google Scholar] [CrossRef]
  5. Iwanaga, T.; Steinmann, P.; Sadoddin, A.; Robinson, D.; Snow, V.; Grimm, V.; Wang, H.H. Perspectives on confronting issues of scale in systems modeling. Socio-Environ. Syst. Model. 2022, 4, 18156. [Google Scholar] [CrossRef]
  6. Rapport, D.J. What Constitutes Ecosystem Health? Perspect. Biol. Med. 1989, 33, 120–132. [Google Scholar] [CrossRef]
  7. Arrow, K.; Bolin, B.; Costanza, R.; Dasgupta, P.; Folke, C.; Holling, C.; Jansson, B.O.; Levin, S.; Mäler, K.G.; Perrings, C.; et al. Economic growth, carrying capacity, and the environment. Ecol. Econ. 1995, 15, 91–95. [Google Scholar] [CrossRef]
  8. Walker, B.; Holling, C.S.; Carpenter, S.R.; Kinzig, A.P. Resilience, Adaptability and Transformability in Social-ecological Systems. Ecol. Soc. 2004, 9, art5. [Google Scholar] [CrossRef]
  9. Folke, C.; Carpenter, S.; Walker, B.; Scheffer, M.; Elmqvist, T.; Gunderson, L.; Holling, C. Regime Shifts, Resilience, and Biodiversity in Ecosystem Management. Annu. Rev. Ecol. Evol. Syst. 2004, 35, 557–581. [Google Scholar] [CrossRef]
  10. Nilsson, C.; Grelsson, G. The Fragility of Ecosystems: A Review. J. Appl. Ecol. 1995, 32, 677. [Google Scholar] [CrossRef]
  11. Brand, F.S.; Jax, K. Focusing the Meaning(s) of Resilience: Resilience as a Descriptive Concept and a Boundary Object. Ecol. Soc. 2007, 12, art23. [Google Scholar] [CrossRef]
  12. Biggs, R.; Schlüter, M.; Biggs, D.; Bohensky, E.L.; BurnSilver, S.; Cundill, G.; Dakos, V.; Daw, T.M.; Evans, L.S.; Kotschy, K.; et al. Toward Principles for Enhancing the Resilience of Ecosystem Services. Annu. Rev. Environ. Resour. 2012, 37, 421–448. [Google Scholar] [CrossRef]
  13. Desjardins, E.; Barker, G.; Lindo, Z.; Dieleman, C.; Dussault, A.C. Promoting Resilience. Q. Rev. Biol. 2015, 90, 147–165. [Google Scholar] [CrossRef] [PubMed]
  14. May, R.M. Thresholds and breakpoints in ecosystems with a multiplicity of stable states. Nature 1977, 269, 471–477. [Google Scholar] [CrossRef]
  15. Holling, C.S. Engineering resilience versus ecological resilience. Eng. Ecol. Constraints 1996, 31, 32. [Google Scholar]
  16. Liao, K.H. A Theory on Urban Resilience to Floods–A Basis for Alternative Planning Practices. Ecol. Soc. 2012, 17, art48. [Google Scholar] [CrossRef]
  17. Egli, L.; Weise, H.; Radchuk, V.; Seppelt, R.; Grimm, V. Exploring resilience with agent-based models: State of the art, knowledge gaps and recommendations for coping with multidimensionality. Ecol. Complex. 2019, 40, 100718. [Google Scholar] [CrossRef]
  18. Ulanowicz, R.E.; Goerner, S.J.; Lietaer, B.; Gomez, R. Quantifying sustainability: Resilience, efficiency and the return of information theory. Ecol. Complex. 2009, 6, 27–36. [Google Scholar] [CrossRef]
  19. Cika, A.; Cohen, E.; Kruszewski, G.; Seet, L.; Steinmann, P.; Yin, W. Resilient Life: An Exploration of Perturbed Autopoietic Patterns in Conway’s Game of Life. In Proceedings of the 2020 Conference on Artificial Life, Online, 13–18 July 2020; pp. 656–664. [Google Scholar] [CrossRef]
  20. Klein, R.J.T.; Nicholls, R.J.; Thomalla, F. Resilience to natural hazards: How useful is this concept? Glob. Environ. Chang. Part B Environ. Hazards 2003, 5, 35–45. [Google Scholar] [CrossRef]
  21. Quinlan, A.E.; Berbés-Blázquez, M.; Haider, L.J.; Peterson, G.D. Measuring and assessing resilience: Broadening understanding through multiple disciplinary perspectives. J. Appl. Ecol. 2016, 53, 677–687. [Google Scholar] [CrossRef]
  22. Hosseini, S.; Barker, K.; Ramirez-Marquez, J.E. A review of definitions and measures of system resilience. Reliab. Eng. Syst. Saf. 2016, 145, 47–61. [Google Scholar] [CrossRef]
  23. Sun, W.; Bocchini, P.; Davison, B.D. Resilience metrics and measurement methods for transportation infrastructure: The state of the art. Sustain. Resilient Infrastruct. 2020, 5, 168–199. [Google Scholar] [CrossRef]
  24. Lempert, R.J.; Popper, S.W.; Bankes, S.C. Shaping the Next One Hundred Years: New Methods for Quantitative, Long-Term Policy Analysis; RAND: Santa Monica, CA, USA, 2003. [Google Scholar]
  25. Gotts, N.M.; van Voorn, G.A.; Polhill, J.G.; Jong, E.d.; Edmonds, B.; Hofstede, G.J.; Meyer, R. Agent-based modelling of socio-ecological systems: Models, projects and ontologies. Ecol. Complex. 2019, 40, 100728. [Google Scholar] [CrossRef]
  26. Gold, D.F.; Reed, P.M.; Trindade, B.C.; Characklis, G.W. Identifying Actionable Compromises: Navigating Multi-City Robustness Conflicts to Discover Cooperative Safe Operating Spaces for Regional Water Supply Portfolios. Water Resour. Res. 2019, 55, 9024–9050. [Google Scholar] [CrossRef]
  27. Collins, S.L.; Carpenter, S.R.; Swinton, S.M.; Orenstein, D.E.; Childers, D.L.; Gragson, T.L.; Grimm, N.B.; Grove, J.M.; Harlan, S.L.; Kaye, J.P.; et al. An integrated conceptual framework for long-term social–ecological research. Front. Ecol. Environ. 2011, 9, 351–357. [Google Scholar] [CrossRef]
  28. Tricco, A.C.; Lillie, E.; Zarin, W.; O’Brien, K.K.; Colquhoun, H.; Levac, D.; Moher, D.; Peters, M.D.; Horsley, T.; Weeks, L.; et al. PRISMA Extension for Scoping Reviews (PRISMA-ScR): Checklist and Explanation. Ann. Intern. Med. 2018, 169, 467–473. [Google Scholar] [CrossRef]
  29. Peters, M.D.; Marnie, C.; Tricco, A.C.; Pollock, D.; Munn, Z.; Alexander, L.; McInerney, P.; Godfrey, C.M.; Khalil, H. Updated methodological guidance for the conduct of scoping reviews. JBI Evid. Synth. 2020, 18, 2119–2126. [Google Scholar] [CrossRef]
  30. Liberati, A.; Altman, D.G.; Tetzlaff, J.; Mulrow, C.; Gøtzsche, P.C.; Ioannidis, J.P.; Clarke, M.; Devereaux, P.J.; Kleijnen, J.; Moher, D. The PRISMA Statement for Reporting Systematic Reviews and Meta-Analyses of Studies That Evaluate Health Care Interventions: Explanation and Elaboration. Ann. Intern. Med. 2009, 151, W-65. [Google Scholar] [CrossRef] [PubMed]
  31. Poulin, C.; Kane, M.B. Infrastructure resilience curves: Performance measures and summary metrics. Reliab. Eng. Syst. Saf. 2021, 216, 107926. [Google Scholar] [CrossRef]
  32. Duyx, B.; Urlings, M.J.; Swaen, G.M.; Bouter, L.M.; Zeegers, M.P. Scientific citations favor positive results: A systematic review and meta-analysis. J. Clin. Epidemiol. 2017, 88, 92–101. [Google Scholar] [CrossRef]
  33. Christensen-Szalanski, J.J.; Beach, L.R. The citation bias: Fad and fashion in the judgment and decision literature. Am. Psychol. 1984, 39, 75. [Google Scholar] [CrossRef]
  34. Holling, C.S.; Gunderson, L.H. Resilience and Adaptive Cycles; Island Press: Washington, DC, USA, 2002. [Google Scholar]
  35. Scheffer, M.; Carpenter, S.; Foley, J.A.; Folke, C.; Walker, B. Catastrophic shifts in ecosystems. Nature 2001, 413, 591–596. [Google Scholar] [CrossRef] [PubMed]
  36. Adu-Gyamfi, K.; Bossé, M.J.; Chandler, K. Situating Student Errors: Linguistic-to-Algebra Translation Errors. Int. J. Math. Teach. Learn. 2015, 16. [Google Scholar]
  37. Gaule, P.; Maystre, N. Getting cited: Does open access help? Res. Policy 2011, 40, 1332–1338. [Google Scholar] [CrossRef]
  38. Sandve, G.K.; Nekrutenko, A.; Taylor, J.; Hovig, E. Ten simple rules for reproducible computational research. PLoS Comput. Biol. 2013, 9, e1003285. [Google Scholar] [CrossRef]
  39. Jain, S.K. Statistical performance indices for a hydropower reservoir. Hydrol. Res. 2009, 40, 454–464. [Google Scholar] [CrossRef]
  40. Azevedo, L.; Canário-Almeida, F.; Fonseca, J.A.; Costa-Pereira, A.; Winck, J.; Hespanhol, V. How to write a scientific paper—writing the methods section. Rev. Port. Pneumol. 2011, 17, 232–238. [Google Scholar] [CrossRef] [PubMed]
  41. Kotz, D.; Cals, J.W. Effective writing and publishing scientific papers, part IV: Methods. J. Clin. Epidemiol. 2013, 66, 817. [Google Scholar] [CrossRef]
  42. Plavén-Sigray, P.; Matheson, G.J.; Schiffler, B.C.; Thompson, W.H. The readability of scientific texts is decreasing over time. eLife 2017, 6, e27725. [Google Scholar] [CrossRef]
  43. Hirst, R. Scientific jargon, good and bad. J. Tech. Writ. Commun. 2003, 33, 201–229. [Google Scholar] [CrossRef]
  44. Zaccarelli, N.; Li, B.L.; Petrosillo, I.; Zurlini, G. Order and disorder in ecological time-series: Introducing normalized spectral entropy. Ecol. Indic. 2013, 28, 22–30. [Google Scholar] [CrossRef]
  45. Petrosillo, I.; Valente, D.; Mulder, C.; Li, B.L.; Jones, K.B.; Zurlini, G. The resilient recurrent behavior of mediterranean semi-arid complex adaptive landscapes. Land 2021, 10, 296. [Google Scholar] [CrossRef]
  46. Ludwig, D.; Jones, D.D.; Holling, C.S. Qualitative Analysis of Insect Outbreak Systems: The Spruce Budworm and Forest. J. Anim. Ecol. 1978, 47, 315–332. [Google Scholar] [CrossRef]
  47. Gunderson, L. Ecological and Human Community Resilience in Response to Natural Disasters. Ecol. Soc. 2010, 15, 18. [Google Scholar] [CrossRef]
  48. Ingrisch, J.; Bahn, M. Towards a Comparable Quantification of Resilience. Trends Ecol. Evol. 2018, 33, 251–259. [Google Scholar] [CrossRef]
  49. Dakos, V.; Kéfi, S. Ecological resilience: What to measure and how. Environ. Res. Lett. 2022, 17, 043003. [Google Scholar] [CrossRef]
  50. Zurlini, G.; Zaccarelli, N.; Petrosillo, I. Indicating retrospective resilience of multi-scale patterns of real habitats in a landscape. Ecol. Indic. 2006, 6, 184–204. [Google Scholar] [CrossRef]
  51. Lake, P.S. Disturbance, patchiness, and diversity in streams. J. N. Am. Benthol. Soc. 2000, 19, 573–592. [Google Scholar] [CrossRef]
  52. Maruyama, H. Taxonomy and general strategies for resilience. In Urban Resilience: A Transformative Approach; Springer: Cham, Switzerland, 2016; pp. 3–21. [Google Scholar]
  53. Walker, B.H.; Carpenter, S.R.; Rockstrom, J.; Crépin, A.S.; Peterson, G.D. Drivers, “slow” variables, “fast” variables, shocks, and resilience. Ecol. Soc. 2012, 17, 30. [Google Scholar] [CrossRef]
  54. Grimm, V.; Wissel, C. Babel, or the ecological stability discussions: An inventory and analysis of terminology and a guide for avoiding confusion. Oecologia 1997, 109, 323–334. [Google Scholar] [CrossRef]
  55. Ivory, V.C.; Stevenson, J.R. From contesting to conversing about resilience: Kickstarting measurement in complex research environments. Nat. Hazards 2019, 97, 935–947. [Google Scholar] [CrossRef]
  56. Baker, M. 1,500 scientists lift the lid on reproducibility. Nature 2016, 533, 452–454. [Google Scholar] [CrossRef] [PubMed]
  57. Bergström, J.; van Winsen, R.; Henriqson, E. On the rationale of resilience in the domain of safety: A literature review. Reliab. Eng. Syst. Saf. 2015, 141, 131–141. [Google Scholar] [CrossRef]
  58. Zurlini, G.; Li, B.L.; Zaccarelli, N.; Petrosillo, I. Spectral entropy, ecological resilience, and adaptive capacity for understanding, evaluating, and managing ecosystem stability and change. Glob. Chang. Biol. 2015, 21, 1377–1378. [Google Scholar] [CrossRef] [PubMed]
  59. McPhail, C.; Maier, H.R.; Kwakkel, J.H.; Giuliani, M.; Castelletti, A.; Westra, S. Robustness Metrics: How Are They Calculated, When Should They Be Used and Why Do They Give Different Results? Earth’s Future 2018, 6, 169–191. [Google Scholar] [CrossRef]
Figure 1. Engineering and ecological resilience concepts illustrated as cup-and-ball systems. For engineering resilience, a single basin of attraction is present, and the system’s state (represented by the ball sitting in a cup) will always return back to its initial state after a disturbance (a “push” represented by the dashed arrows). For ecological resilience, a sufficiently strong disturbance could push the system into an adjacent cup, putting the system in a completely different state from where it started. Original figure by Liao [16].
Systems 12 00357 g001
Figure 2. PRISMA-ScR workflow, showing how the large number of initially identified possibly relevant articles was reduced down to the comparatively small number eventually included in the analysis of our review.
Systems 12 00357 g002
Figure 3. Histogram of identified resilience metrics per time block. Note that the last time interval spans a much shorter length of time.
Systems 12 00357 g003
Figure 4. Conceptual approaches to quantifying resilience for single-basin-of-attraction, single-disturbance systems. The blue line is the system’s behavior over time (sometimes called its resilience curve), and the green elements represent which aspect(s) of the system’s behavior are considered conceptually relevant for quantifying its resilience and are therefore included in the metric(s). The individual approaches are explained in the main text.
Systems 12 00357 g004
Figure 5. Conceptual approaches to quantifying resilience for single-basin-of-attraction, multiple-disturbance systems. The blue line is the system’s behavior over time (sometimes called its resilience curve), the green elements represent which aspect(s) of the system’s behavior are considered conceptually relevant for quantifying its resilience and are therefore included in the metric(s). The individual approaches are explained in the main text.
Systems 12 00357 g005
Table 1. Web of Science search query elements, mapped to the elements of our main research question. Each element of the research question is translated into a component of the Web of Science search engine query. The asterisks are wildcard operators, representing a placeholder for any word or group of words. It allows the search for variations of a phrase or word in the query.
Element of Research QuestionElement of Query
ResilienceTS = (resilien*)
MetricAND TS = (metric* OR quantif* OR indicator* OR measure*)
Socio-ecological or socio-technicalAND WC = (Agricultural Economics & Policy OR Agricultural Engineering OR Agriculture, Multidisciplinary OR Agronomy OR Engineering, Civil OR Management OR Engineering, Environmental OR Engineering, Industrial OR Area Studies OR Engineering, Multidisciplinary OR Materials Science, Textiles OR Mathematical & Computational Biology OR Environmental Sciences OR Environmental Studies OR Mathematics, Applied OR Mathematics, Interdisciplinary Applications OR Biodiversity Conservation OR Public Administration OR Public, Environmental & Occupational Health OR Fisheries OR Regional & Urban Planning OR Forestry OR Multidisciplinary Sciences OR Geosciences, Multidisciplinary OR Social Sciences, Mathematical Methods OR Green & Sustainable Science & Technology OR Health Policy & Services OR Statistics & Probability OR Computer Science, Interdisciplinary Applications OR History & Philosophy of Science OR Computer Science, Software Engineering OR Computer Science, Theory & Methods OR Operations Research & Management Science OR Transportation OR Transportation Science & Technology OR Demography OR Urban Studies OR Development Studies OR Ecology OR Water Resources OR Economics OR Limnology
SystemAND TS = (“system” OR ecosystem OR systems)
Table 2. Demographics of screened, read, and included papers, broken down by publication year (binned in five-year intervals) and research areas.
Screened
(N = 551)
Read
(N = 80)
In Synthesis
(N = 41)
Publication year1990–19943153
1995–199971157
2000–20041071911
2005–2009107137
2010–2014107134
2015–201910794
Jan 2020–July 20202165
Research areaArts and humanities000
Life Sci and biomed5936722
Physical sciences1543419
Social sciences95134
Technology2424331
Table 3. Comparison of case study (SES and STS) and metric (single- and multiple-basins-of-attraction) types.
Single Basins of AttractionMultiple Basins of AttractionTotal
Socio-technical case study27431
Socio-ecological case study10515
Total37946
Disclaimer/Publisher’s Note: The statements, opinions and data contained in all publications are solely those of the individual author(s) and contributor(s) and not of MDPI and/or the editor(s). MDPI and/or the editor(s) disclaim responsibility for any injury to people or property resulting from any ideas, methods, instructions or products referred to in the content.

