Article

Does Government Digital Transformation Drive High-Quality Urban Economic Development? Evidence from E-Government Platform Construction

School of Management, Shanghai University, Shanghai 201899, China
*
Author to whom correspondence should be addressed.
Systems 2024, 12(9), 372; https://doi.org/10.3390/systems12090372
Submission received: 19 July 2024 / Revised: 31 August 2024 / Accepted: 12 September 2024 / Published: 15 September 2024

Abstract

:
Digitalization represents a pivotal global development trend and serves as a significant force propelling economic and social transformation. This manuscript uses the global Malmquist–Luenberger (GML) model to estimate green total factor productivity (GTFP) across 284 Chinese cities from 2003 to 2018, taking the pilot policy of “construction and application of e-government public platforms based on cloud computing” as an example to assess the impact of government digital transformation on the qualitative development of the economy by using a difference-in-differences model to explore the path of its role and driving mechanism. The results reveal that government digital transformation promotes the qualitative improvement of the city’s economic development, and its driving effect shows a marginal incremental law. Moreover, government digital transformation can contribute to the formation of a “latecomer advantage” in the lagging regions, which creates a “catch-up effect” on the regions with favorable development foundations, excellent geographical conditions, high urban ranking, and high education quality. Additionally, government digital transformation boosts economic and social development quality through both innovation spillover and structural optimization.

1. Introduction

As the representative of new government governance technology, e-government plays an irreplaceable role in enhancing organizational effectiveness, optimizing the business environment, and regulating the state-government/society-market relationship [1,2,3]. The “Internet Plus Government Services” model has increasingly become the primary method of delivering public services. The objective is to achieve collaborative management and service across various levels, regions, systems, departments, and sectors. As the digital transformation of government continues to develop in depth, concepts such as e-government and digital government are successively being introduced. Digital government encompasses the strategic use of information technology by governments to fundamentally transform the delivery of public services [4,5]. In contrast, e-government specifically pertains to the deployment of information and communication technologies to optimize governmental efficiency, enhance transparency, and bolster accountability, while concurrently reducing operational costs and mitigating the potential for corruption [6]. Although both paradigms aim to harness technology to advance governance and service provision, they diverge in their conceptual focus. E-government primarily regards technology as a functional tool for improving administrative efficiency, whereas digital government adopts a broader, more holistic approach, emphasizing the integration of digital thinking to comprehensively reform and reengineer the governance framework. This shift, facilitated by technological innovation, signifies a progressive evolution from e-government, resulting in deeper systemic changes and enhanced governance efficacy [7]. Ultimately, digital government and e-government are not mutually exclusive but will coexist and complement each other within the broader trajectory of national governance modernization. At the national policy level, “e-government” and “digital government” are both general summaries of policy objectives, tasks, and means for a specific period of time; at the academic and technical levels, “e-government” is a common “big word”, while “digital government” is a “small word”, and there is no need to make a strict distinction between the two, which indicates that both “e-government” and “digital government” are important stages in the digital transformation of governments [8,9,10]. The United Nations defines government digital transformation as a process of leveraging digital technologies to transform governance models and government–society interactions and to innovate government policies, organizations, services, and programming. At its core is an ecosystem approach that systematically integrates systems, organizations, people, technologies, data, and resources to drive much-needed transformations within and outside the public sector to generate public value and achieve sustainable development [11,12]. Government digital transformation is centered around two main elements: digital technology and government transformation. Digital technologies encompass big data, cloud computing, the blockchain, and others. Government transformation covers various aspects such as business processes, organizational structure, and the quality of public services [13,14,15].
The government digital transformation based on e-government not only has great significance in improving the effectiveness of urban governance but also provides a valuable reference for promoting high-quality economic development in China [16,17]. Therefore, to analyze the relationship between government digital transformation and the socio-economic quality of development, this manuscript takes the pilot policy of “cloud-based e-government public platform construction and application” as a starting point. It evaluates the policy effects of e-government public platform construction and deepens our rational understanding of the pathways and driving mechanisms for enhancing high-quality economic development.
By systematically reviewing the literature related to the research topic, it becomes clear that existing studies predominantly explore three core dimensions: first, the developmental history and evolutionary processes of government digital transformation; second, the mechanisms and impact pathways through which government digital transformation exerts its influence; and third, the factors and mechanisms contributing to high-quality economic development. The following discussion will synthesize and critically evaluate the findings in these three areas.
In the stage of government information digitization, work is mainly conducted from the perspective of information integration, based on network infrastructure, constructing a data integration model, removing redundant data in government departments, reducing the workload of departmental coordination and system maintenance, and enhancing the data integration capability of e-government platforms to improve the processing efficiency of government information [18,19,20,21,22,23]. In the stage of digitization of government business, work is conducted mainly from the perspective of public management, based on the “the internet plus government services”, and network office halls and social service channels have been constructed to optimize and reorganize government business processes, reduce the cost of information exchange among the public, businesses, and the government, and provide all types of social subjects with high-quality, comprehensive, transparent, and standardized management and services with international standards [24,25,26,27]. During the digitalization phase of government organizations, work is conducted mainly from the perspective of organizational structure, based on the innovation of ideas and concepts, breaking the traditional vertical operation of business lines and the internal circulation mode of a single department and focusing on the service object, with business synergy as the main line and data sharing and exchange as the core, to cultivate and improve the government’s digital mindset, capability, and awareness, so as to accelerate the realization of the government’s digital leadership [28,29,30]. Additionally, through process reengineering, model innovation, application upgrading, and other means, government departments need to transcend the limitations of time, space, and departmental dimensions and build a “vertical to the end, horizontal to the edge” of the digital governance system [31,32].
From the perspective of social development and service provision, on one hand, government digital transformation has the capacity to reshape the functioning of the economy and society. With the continuous evolution of the digital economy, data have emerged as a crucial factor in production and a significant catalyst for driving the advancement of urban economies toward superior quality. The government plays a central role in digital transformation, bears the key task of leading the economic and social operation mode empowered by digital technology, and can integrate data resources, build an e-government cloud platform, open up data circulation channels, effectively guide the digitalization and intelligent transformation of urban economies, which is essential for advancing the overall high-quality development of cities [33,34]. On the other hand, government digital transformation can accelerate the creation of a service-oriented public administration. By innovating upon the methods [35], forms [36], concepts [37], functions [34], and capabilities of public services, government digital transformation can enhance the overall quality of public service delivery [38]. Viewed from a reform standpoint, government digital transformation can further the “streamlining administration, delegating powers, and improving regulation” reforms, continuously reducing transaction costs imposed by institutional structures on businesses, compressing the rent-seeking space of the government, restraining and regulating the administrative behavior of public officials, and enhancing the satisfaction of foreign business services and investment confidence [39].
Government digital transformation not only helps to improve the scientific degree of government decision-making, policy precision, and effective governance, but also fundamentally transforms the concept and mode of government governance [40]. Currently, achieving high-quality economic development has emerged as a prominent subject of study in academia, and scholars are examining the factors that influence high-quality development, from human capital [41] to scientific and technological innovation [42,43], digital economy and entrepreneurial activity [44,45], distortion in the allocation of capital factors [46], national e-commerce pilots [47], and the construction of innovative cities [48], to explore the factors influencing GTFP and the high-quality economic development in cities.
Through a review of the existing literature, it is found that there is still much space for expanding research on government digital transformation: first, existing research on government digital transformation mostly focuses on the theoretical generalization of the evolution path and qualitative analysis of the impact and effects, but research on the relationship between government digital transformation and socio-economic development is relatively scarce. Furthermore, there is a significant lack of empirical analysis that directly focuses on the mechanisms through which government digital transformation affects high-quality economic development. Additionally, existing studies on the factors influencing high-quality economic development scarcity consider the endogeneity issues inherent in these influencing factors, leading to potential biases in ordinary least squares (OLS) estimation results. Hence, it is essential to select more comprehensive data and adopt more rigorous means of argumentation to explore and validate the correlation between government digital transformation and qualitative economic development.
Based on above discussion, this paper selects city-level data from 2003 to 2018, employing a difference-in-differences model to examine the influence of government digital transformation on high-quality economic development in cities. Furthermore, it investigates variations in impact across different quality levels, geographical conditions, development grades, and educational levels, and employs instrumental variable methods to assess the robustness of research conclusions and explore the transmission paths of the policy effects. The current manuscript makes three main contributions to the field: first, this manuscript examines the impact of government digital transformation on high-quality economic development from the perspective of e-government construction, representing a novel approach. This expands upon and enriches existing academic research on evaluating policy effects in e-government construction and factors influencing high-quality economic development and related fields. Secondly, the present research assesses the policy effects and potential transmission mechanisms of e-government public platform construction and application demonstration areas in the context of digitization. It confirms the significant driving impact of government digital transformation on high-quality urban economic development and identifies two pathways through which this policy effect is transmitted: innovation spillover and structural optimization. Thirdly, this study employs exogenous policy shocks relative to high-quality urban economic development and selects the number of urban post offices in 1984 as an instrumental variable. This choice aids in effectively identifying the causal relationship between government digital transformation and high-quality urban economic development.
The structure of this paper is organized as follows: Section 2 conducts a comprehensive review of the policy trajectory of e-government development in China, examines the potential mechanisms by which digital government transformation may influence economic development, and formulates theoretical hypotheses regarding its role in promoting high-quality urban economic growth. Section 3 elaborates on the empirical analysis methodology, detailing the data sources, processing techniques, and the operationalization of key variables and control factors. Section 4 provides a thorough interpretation of the empirical results, while Section 5 rigorously tests the robustness of these findings. Section 6 delves into the underlying mechanisms through which digital government transformation affects economic quality. Finally, Section 7 synthesizes the research conclusions and offers policy recommendations.

2. Analysis and Theoretical Hypotheses on the Impact of Government Digital Transformation on Urban Economic Development in China

2.1. Historical and Contemporary Context of E-Government Development in China

Since the 20th century, digital technology has been rapidly iterating and innovating, the digital industry has continued to flourish, and the digital economic network has been widely popularized; digitization has become an important feature of global economic development, concurrently leading and promoting an all-encompassing social transformation. The main goal of e-government-based public platform construction is to support organizational change and improve the government’s public management capability through cloud computing technology, so as to optimize the quality of public services for public demand and enhance the government’s macroeconomic control capabilities for social and economic development [49]. In the 1990s, China successively launched the national e-government construction of major information technology application projects represented by the Golden Tax Project. Entering the 21st century, widely applied and highly permeable information technology is breeding breakthroughs, and the profound impact of informatization on economic and social development is becoming increasingly apparent. During the Tenth Five-Year Plan period, the National Leading Group of Informatization comprehensively deployed the key aspects of information development, issuing a series of crucial decisions to advance e-government. During the Eleventh Five-Year Plan period, e-government applications were promoted in depth, and the e-government coverage rate of central and provincial government departments in terms of major business reached 70%. During the Twelfth Five-Year Plan period, China’s e-government further entered the fast lane of development. To propel functional transformation and instigate managerial innovation at the provincial, municipal, and county levels of local governments, the Ministry of Industry and Information Technology (MIIT) delineated 18 provinces and 59 cities/counties/districts in December 2013 as the inaugural group for piloting and demonstrating the construction and application of cloud-based e-government platforms (Table 1). The goal was to establish centralized and unified regional e-government cloud platforms to support government digital services, enable interconnection and information sharing among government agencies, enhance information security capabilities, and promote the integration, efficiency, security, and service-oriented development of e-government. These policies will accelerate the government’s digital transformation and have significant impacts on China’s socio-economic development.
To investigate whether government digital transformation influences urban economic development, this paper conducted a preliminary descriptive statistical analysis of TFP and GTFP in pilot cities and non-pilot cities affected by this policy. As shown in Figure 1 and Figure 2, it is evident that during the Eleventh Five-Year Plan period, the level and quality of China’s socio-economic development showed an upward trend, and disparities between pilot and non-pilot cities began to emerge. During the Twelfth Five-Year Plan period, with the strengthening of e-government foundations, urban economic development exhibited significant growth in level and quality. After 2013, pilot cities showed a notably higher growth rate in TFP and GTFP compared to non-pilot cities, leading to an expanding gap in development level and quality. This indicates that the construction of e-government public platforms in pilot cities has successfully facilitated government digital transformation, enhanced governance capabilities, facilitated the smooth flow of various production factors within industries, sectors, and across regions, and promoted green and innovative development. These findings support the theoretical hypothesis of this study.

2.2. Theoretical Framework and Hypotheses on the Impact of Digital Transformation on Urban Economic Development

Building and utilizing e-government public platforms based on cloud computing relies on informatization departments at or above the county level, organizing professional and technical service institutions, and using cloud computing technology to coordinate the planning of existing resources such as computation, storage, network, information, and application support, to enhance the implementation of digital solutions for government internal operations, to foster effective information sharing between different government departments, and to facilitate seamless communication channels between the government and enterprises. This shows that a cloud-computing-based e-government public platform can effectively resolve the issue of “information silos” in traditional e-government, improve the collaborative governance capabilities of the government across different levels, departments, and regions, and guide the flow of knowledge and other production factors towards a more efficient information service industry. This promotes socio-economic development to a higher level. Thus, this paper presents the first hypothesis:
H1. 
Government digital transformation enhances comprehensive governance effectiveness, propelling high-quality urban economic development.
The construction and application of e-government public platforms can obtain the tilt of national preferential policies, and local governments will also introduce corresponding supporting policies to promote the rapid development of high-tech industries. Additionally, it can promote the construction of new information network-based infrastructure, effectively enhance the spatial accessibility of pivotal production elements such as knowledge, management, and data, expand the scope of their flow, and accelerate the speed of their flow [50], to enhance the macro-control ability of local governments. Compared with developed cities, the economic conditions, talent environment, and technical level of the backward areas cannot meet the requirements for constructing new infrastructure and implementing e-government public platforms.
However, with the support of the pilot policy, backward areas can realize the redistribution of social capital, professional talents, technical knowledge, and other important factors of production among regions through the government’s digital transformation, helping them establish a “latecomer advantage” and make up for the “digital divide” caused by disparities in economic development and investment in information technology. Hence, we propose the second hypothesis:
H2. 
The driving effect of government-led digital transformation will promote the formation of a latecomer advantage in lagging areas and achieve catching up with developed regions in terms of the quality of economic development.
The establishment of a cloud-based e-government public platform, serving as a pilot policy to promote government digital transformation, represents an exploratory practice initiative in China ongoing information construction process. This paper argues that government digital transformation can promote high-quality urban economic development via two paths: the innovation spillover effect and the structural optimization effect. The specific conduction mechanism process is as follows:
First, government-led digital transformation has notably enhanced the level and capacity of urban innovation, driven by the shift in the e-government development goal from a single economic construction type to a public governance type [51]. This indicates that the government will promote the transparency and openness of the work of government departments through information technology, improve the efficiency of public servants, provide diversified service channels, optimize the content and quality of government services, and promote ongoing improvement of the urban entrepreneurial business environment, which will in turn reduce the systematic transaction costs for businesses in the production and innovation processes, motivate them to continue to take the path of innovative development, and propel the escalation of urban innovation levels and capabilities [52,53].
Secondly, government digitization promotes the optimization and upgrading of urban industrial and human resource structures. E-government applies information technology to enhance urban governance, which can broaden the channels of information sources, improve the allocation efficiency of social capital, human capital, intellectual capital, and other important resources, and then optimize the structure of urban economic and social development. Government digitization enhances resource allocation efficiency. E-government construction based on cloud computing technology can guide all kinds of factors in the information service industry with high production efficiency through the integration of government resources across levels, departments, and regions, promote the dynamic transformation process of the urban industrial structure, and elevate economic development to a higher stage. Additionally, government digital transformation can enhance the effect of macro-control. Government digital transformation needs to be supported by more managerial and technical talents so that in the process of economic and technological change and industrial transformation and upgrading, it can continuously optimize and upgrade the talent structure of the city and drive society and the economy to continue to take the road of high-quality development. Based on this, we propose the last hypothesis:
H3. 
Government digitalization transformation can drive high-quality economic development in cities through two paths: the innovation spillover effect and the structural optimization effect.

3. Research Design

3.1. Model Building

The construction and application of public platforms for e-government based on cloud computing can result in disparities between pilot cities and non-pilot regions during the observation period. Moreover, it may also lead to variations in pilot cities before and after policy implementation. Thus, we employed the difference-in-differences model to assess the impact of the “e-government public platform construction and application pilot” policy. During the observation period, a total of 59 cities (counties and districts) were approved to be the pilots of e-government public platform construction and application. Therefore, to verify the aforementioned research hypotheses, a difference-in-differences model was constructed specifically to examine the influence of government digital transformation on urban economic development:
H q d i , t = α 0 + β 1 P o l i c y i , t + γ 1 C o n t r o l i , t + μ i + δ t + ε i , t
In Equation (1), H q d i , t represents the high-quality economic development level in city i during the year t ; P o l i c y i , t represents the dummy variable for the pilot policy on the construction and application of e-government public platforms; C o n t r o l i , t represents a set of control variables; μ i represent city fixed effects; δ t represent time fixed effects; and ε i , t represents the random error term. The coefficient β 1 of the core explanatory variable P o l i c y quantifies the impact of government digital transformation on high-quality economic development in urban areas. To further explore the possible transmission mechanism between government digital transformation and the high-quality development of the urban economy, a model was constructed, guided by the methodologies of Wang [54]. The talent structure, industrial structure, and technological innovation were used as mechanism variables for examination. The model for the mechanism variable test was constructed as follows:
M e c h i , t = α 1 + β 2 × P o l i c y i , t + γ 2 × C o n t r o l i , t + μ i + δ t + ε i , t
H q d i , t = α 1 + β 3 ( P o l i c y i , t × M e c h i , t ) + γ 3 × C o n t r o l i , t + μ i + δ t + ε i , t

3.2. Variable Selection and Measurement

3.2.1. Explanatory Variant

This study focused on the level of high-quality economic development in urban areas as the dependent variable. Economic development encompasses the impact of urban development on ecological environment quality, and it can effectively characterize the level of high-quality economic development in urban areas. Thus, this paper adopted urban cumulative GTFP as a proxy variable to represent high-quality urban economic development and measures GTFP using the GML productivity index within the DEA framework. The indexes for the calculation of GTFP are described as follows:
(1) Input indicators: the three major factors, capital (K), labor (L), and resources (E), were considered as input variables. The capital input mainly used the real capital stock of the city as a proxy variable, the labor input was primarily proxied by the average number of employees across the entire society, and the resource input mainly used the urban built-up area as a proxy variable. The calculation of capital stock primarily employed the perpetual inventory method, assuming a fixed asset depreciation rate of 9.6%. The initial capital stock was set at 10% of the initial total fixed asset investment across society [55]. Capital stock for each city was computed using the year 2000 as the base year.
(2) Output indicators: the output indicators took into account both expected and unexpected output. Expected output relied primarily on using the actual GDP of each city as a proxy variable, considering the year 2000 as the base year for constant prices. The GDP deflator index for each city was applied to adjust the data through a constant-price equalization process. For the unexpected output, three variables were selected for each city: industrial wastewater discharge, industrial carbon dioxide emissions, and industrial particulate matter emissions [56]. In addition, considering that carbon dioxide emissions and PM2.5 concentration also influence urban environmental quality, the variables of carbon intensity and PM2.5 concentration were further added as relevant indicators of non-desired outputs.
Therefore, this paper utilized Stata software to measure the GML index for 284 prefecture-level cities spanning the years 2003 to 2018. Meanwhile, given that the GML index only characterizes the relative change in the pace for GTFP growth rather than the absolute magnitude of the numerical value, we took 2003 as the base period, set the value of GTFP of each city in the base period uniformly as 1, and then carried out the cumulative multiplication processing, and finally obtained the cumulative GTFP of 284 prefecture-level cities in all years.

3.2.2. Core Explanatory Variables

The central explanatory variable was government digital transformation, represented by a dummy variable for the pilot policy of building and applying e-government platforms based on cloud computing, serving as a proxy indicator. The variable P o l i c y assumed the value of 1 from the year t and onwards if city i was approved as a pilot for the construction and application of an e-government public platform; otherwise, it was 0.

3.2.3. Other Control Variables

To precisely reflect the influence of government digital transformation on the high-quality development of the urban economy, we adopted the methodologies of Zhao [57] and Gan [58], and finally selected six control variables: (1) socio-economic development ( P g d p ), using real GDP per capita in each city as a proxy; (2) population density ( D e n ), represented by the ratio of permanent residents to an administrative area; (3) financial development ( F i n ), represented by the ratio of the year-end balance of various loans in financial institutions to the nominal GDP for each city; (4) infrastructure ( I n f r a ), using urban road area per capita as a proxy indicator; (5) openness to the outside world ( O p e n ), utilizing the annual average exchange rate, in which the nominal amount of foreign capital utilization is converted into RMB and then compared with the nominal GDP to obtain the indicator of the proportion of foreign direct investment. This indicator serves as a proxy for the degree of openness to the outside world; and (6) government intervention ( G o v e r n ), represented by the ratio of government general budgetary expenditures to nominal GDP [32]. It is noteworthy that the above-mentioned control variables all underwent logarithmic transformation, and detailed variable descriptions can be found in Table 2:

3.3. Data Description

3.3.1. Sample Screening

During the observation period, 59 cities (counties and districts) were selected as pilot demonstration areas for the construction and application of e-government platforms based on cloud computing (see Table 1 for details); due to the wide distribution of the experimental cities across different regions in China, substantial variations exist in their socio-economic and informatization levels, and thus the error in the selection of the samples could be greatly reduced. In addition, given that the list of pilot demonstration areas includes samples from municipalities, prefectures, and counties, the samples from municipalities and counties were excluded from this paper to ensure that the samples could be well referenced to each other. The final total sample size obtained was 284, of which the experimental group sample contained 38 pilot demonstration cities and the control group sample comprised 246 cities.

3.3.2. Data Sources

The list of pilot areas for constructing and applying cloud-based e-government platforms was primarily sourced from the official website of the Ministry of Industry and Information Technology of China and was calibrated by manually searching for the pilot implementation program for the construction and application of e-government platforms and other means. The statistical data in this paper were primarily collected from the Dalhousie University Atmospheric Composition Analysis Group, the EPS Data Statistics Platform, China Research Data Services Platform (CNRDS), the CEIC Economic Database, the China Urban Statistical Yearbook (1985, 2001–2019), and statistical yearbooks of 31 provinces and cities in China. The descriptive statistical results of the variables are presented in Table 3:

4. Empirical Analysis

4.1. Baseline Regression

To assess the impact of government digital transformation on the high-quality development of urban economy, this study employs stepwise regression to estimate the baseline model, and the results are displayed in Table 4. The notable observation is that the estimated coefficients of the core explanatory variable ( P o l i c y ) without adding any control variables are significantly positive. This indicates that government digital transformation significantly promotes high-quality urban economic development. Adding various control variables such as socio-economic factors (columns 2 through 7 in Table 4), the numerical values and significance of the estimated coefficients for variable P o l i c y did not exhibit notable changes. This further supports the notion that government digital transformation can propel China’s cities towards higher-quality economic development. The regression results in column 7 illustrate that, all other things being equal, the pilot cities with e-government platforms built and applied increase their level of high-quality development (GTFP) by an average of 22.75%. Due to the initiation of the construction of the e-government platform in 2013, the average processing effect can be measured over the observation period of six years, revealing that government digital transformation correlates with an annual average increase of 3.79% in the level of high-quality economic development for the pilot cities.
From the control variable estimation results, a notable negative correlation exists between the socio-economic factors of each region ( L n P g d p ) and the high-quality development of the urban economy. This suggests that, despite fostering overall social economic growth, there is a lack of significant enhancement in the quality of regional economic development [59,60]; the estimated coefficients for population density ( L n D e n ), financial development ( L n F i n ), and infrastructure ( L n I n f r a ) are all positive, suggesting that growth in population density, expansion of city size, expansion of high-level capital markets, and development of regional infrastructure may contribute to some extent to advancing the progression of urban economic quality towards a higher stage. The regression result for external openness ( L n O p e n ) is significantly negative, suggesting that foreign investment exerts a certain inhibitory effect on the high-quality development of the local economy. This may be attributed to various factors. Firstly, the overall quality of foreign capital introduction in China is low, not only encompassing enterprises with low technological levels but also those causing severe environmental pollution. This situation is unfavorable for the coordinated development of the urban economy and the environment. Secondly, the introduction of a large amount of foreign capital may lead to the formation of technological dependence on the core industry, which is not conducive to the enhancement of the city’s capacity for independent innovation [61]. The estimated coefficient ( L n G o v ) for government intervention is negative and significant at the 1% confidence level, signifying that excessive government intervention adversely affects the quality of economic development in the local area. The rise in government financial expenditure might lead to a crowding-out impact on social capital, leading to reduced participation of social capital in the urban economic development process and a decline in the business environment and market liberalization.
The above findings validate Hypothesis H1: Government digital transformation enhances comprehensive governance effectiveness, propelling high-quality urban economic development.

4.2. Quantile Regression Analysis

The baseline econometric model primarily gauges the effects of government digital transformation on the high-quality development of urban economies within the mean range, overlooking its tail-state characteristics in extreme regions. In reality, government digital transformation may have nonlinear impacts on the quality of urban economic development. In comparison to cities with high economic development quality, the construction of e-government platforms can achieve a more coordinated development of the socio-economic and ecological environments through the empowerment of urban governance capacity by digital technology, resulting in a more pronounced driving effect. Hence, to precisely depict the asymmetric influence of government digital transformation on high-quality economic development and effectively capture the tail characteristics of the distribution of both government digital transformation and urban development quality, this paper utilizes quantile regression controlling for the time effect and individual effect to calculate the quantile equations at the 10%, 25%, 50%, 75%, and 90% quantile points of high-quality urban economic growth impacted by government digital transformation [62,63]. Table 5 shows that the fitted coefficients for government digital transformation are consistently and significantly positive, indicating a pronounced positive effect of government digital transformation on the high-quality development levels of urban economies across various quantiles. Furthermore, the magnitudes and significance of the fitted coefficients of government digital transformation show a growing trend with the increase in the quantile points, indicating that the driving effects of government digitized transformation on urban GTFP level showed a marginal increasing trend as the quality of urban economic development improved. The quantile regression results validate hypothesis H1: there is a marginal incremental law in the driving effect of government digital transformation.

4.3. Regional Heterogeneity Analysis

The aforementioned baseline model can assess the overall effect of government digital transformation, but potential variations in the driving effects of the construction and application of e-government platforms among different cities, analyzing the regression results for the sample population may obscure the impact of regional heterogeneity. Therefore, this paper estimates the regression of different observation samples by constructing different grouping variables based on four conditions, such as city orientation, city location, city grade, and city education, and analyzes the heterogeneous influence of government digital transformation on the quality of regional economic development.

4.3.1. Urban Orientation Heterogeneity

Considering the differences between northern and southern China, based on the demarcation lines of the Qinling–Huaihe line and the Qinghai–Tibet Plateau margin [64], we divide China into two groups, the southern region (154 cities) and the northern region (130 cities), and estimate the influence of government digital transformation on high-quality economic development in cities with different orientations through the difference-in-differences model. Table 6 demonstrates the heterogeneous effects of government digital transformation on the economic development quality in northern and southern regions. The regression results illustrate that the estimated coefficients for the north and the south are remarkably positive at the 1% statistical level, demonstrating that the implementation and utilization of e-government platforms will significantly promote regional economic development to a higher stage, both in the north and in the south. But in contrast to the size of the coefficient, it is discovered that the value of the factor in northern cities is 1.4840 times higher than that in southern cities, indicating a more pronounced utility of the driving effect of government digital transformation in northern cities. Although the northern cities have long been limited by their governance capacity and the level of urbanization management, and they have missed the dividend period of high regional economic growth, transformation, and upgrading through “effective urbanization”. But the digital transformation of the government will promote a qualitative leap in the governance capacity and level of governance of northern cities, which can bridge the “governance gap” between northern and southern cities [65], promote the “catch-up effect” of the northern region with cities in the developed southern regions, and propel China’s socio-economic development quality to a higher level.

4.3.2. Urban Location Heterogeneity

Since there is no academic consensus on the criteria for dividing China’s northern and southern regions, the aforementioned method of dividing the city locations may be problematic and lead to biased estimation results. Therefore, to further verify whether there is a “catch-up effect” of lagging regions with developed regions, this paper is based on the “Methods of Dividing East, Central, and West Regions and Northeast Region” by the National Bureau of Statistics of China in 2011, and divides China into two groups, the Central-Eastern region (200 cities) and the Western region (84 cities), and estimates the impacts of the digital transformation of the governments of cities in different regions through the difference-in-differences model. Columns (3) and (4) in Table 6, respectively, show the heterogeneous economic development impacts of government digital transformation on the West and the Central-Eastern regions. The estimation results indicate that the regression outcomes for both the Western and Central-Eastern regions are significantly positive at the 1% confidence level, indicating that the construction and implementation of the e-government platform will significantly promote the enhancement of the city’s economic development, both in the Western and Central-Eastern regions. Moreover, it is found that the coefficient value of the western cities is 1.524 times higher than the central and eastern areas, implying that the utility of the driving effect of government digital transformation is more pronounced in western cities. The reason may lie in the fact that although the cities in the Central-Eastern region have convenient transport links and are the “forerunners” of many pilot policies, with the in-depth promotion of a series of national strategies in the Western region, there is a continued increase in investment in infrastructure such as transport, energy, communications, and municipal services. This not only provides a good framework to construct and apply e-government platforms based on cloud computing but also provides a stable guarantee to optimize the business environment in the region and enhance technological innovation capacity, thus guiding innovation factors to proactively cluster in the Western region and facilitating the formation of “a latecomer’s advantage” for cities in the west by advancing high-quality economic development.

4.3.3. Urban Hierarchical Heterogeneity

The above city orientation and city location are mainly based on geographic regions. However, given potential variations in the economic development stages among cities in the same region, the impact of government digital transformation on the economic development quality of cities at different levels may also differ, and thus it is necessary to explore this matter in depth. Referring to the “Business Ranking of Chinese Cities” published by YICAI [66], we set up two groups of higher-grade levels (Tier 1, 2, and 3 cities: 32) and general-grade levels (Tier 4 and 5 cities: 252), and estimated the impact of government digital transformation on the high-quality economic development in cities of different levels through the difference-in-differences model. Columns (5) and (6) of Table 6, respectively, demonstrate the heterogeneous effects of government digital transformation on the economic development quality of higher-grade and general-grade cities. The regression results show that only the general-grade cities have significantly positive estimated coefficients, reflecting that the promotion of high-quality economic development by government digital transformation is mainly manifested in general-grade cities, and the digital driving effect in higher-grade cities has not yet become apparent. This may be due to the fact that the general level of innovation and governance capacity of cities is low in general-grade cities and in the primary stage of economic development, and the establishment of e-government platforms can create a high-level open platform through the continuous optimization of government management efficiency, attract social capital to support the local transformation and upgrading of traditional industries, fully explore the creative potential of local industries, and form regional industrial clusters to accelerate the digital industrialization and digitalization process of the local industries. On the contrary, the government governance effectiveness and digital development of higher-level cities have already matured, and the marginal effect of building a pilot e-government platform is relatively small. Hence, the driving influence of government digital transformation on the quality of economic development is not significant.

4.3.4. Urban Scientific and Educational Heterogeneity

Higher education is a necessary condition for cities to cultivate high-end talents. The science and education level of a city may be related to the talent cultivation capacity and the research and innovation level; therefore, it is necessary to analyze the heterogeneous impact of differences in scientific and educational capabilities on the quality of urban economic development. We set higher-education-type (35 cities) and general-education-type (249 cities) cities based on whether the city had been selected as a “211 projects” or “985 projects” university and carried out sub-sample regression through the difference-in-differences model. Columns (7) and (8) of Table 6 demonstrate the heterogeneous impact of government digital transformation on the economic development quality of higher-education-based and general education-based cities, respectively. The estimation results reveal that only the regression coefficient for the sample of cities with a general education focus is significantly positive, indicating that the driving influence of e-government platform construction in cities with a high science and education level can only be realized in the sample of cities with a low science and education level, while its influence effect in cities with a high science and education level is not obvious. The reason for this may lie in the fact that in higher-education cities, urban development is in a relatively mature stage, human capital and innovation resources are more abundant, and the government’s governance capacity and the business environment are relatively developed, so the marginal effect of cloud-computing-based e-government platform construction and application is small on economic development quality in urban areas; meanwhile, in general-education cities, the construction of e-government platforms provides a suitable platform and opportunity for the concentration of key production factors like human capital, social capital, and innovation resources.
Based on the above discussion, the hypothesis H2 is further verified: government digital transformation will facilitate the formation of a latecomer advantage for regions that are lagging behind in terms of geographic location, development level, and quality of education to realize catching up in the economic development quality of developed regions.

5. Robustness Tests

To ensure the reliability of the aforementioned regression results, this study conducts robustness checks from various perspectives, including parallel trend tests, examinations based on the PSM-DID method, and other robustness tests.

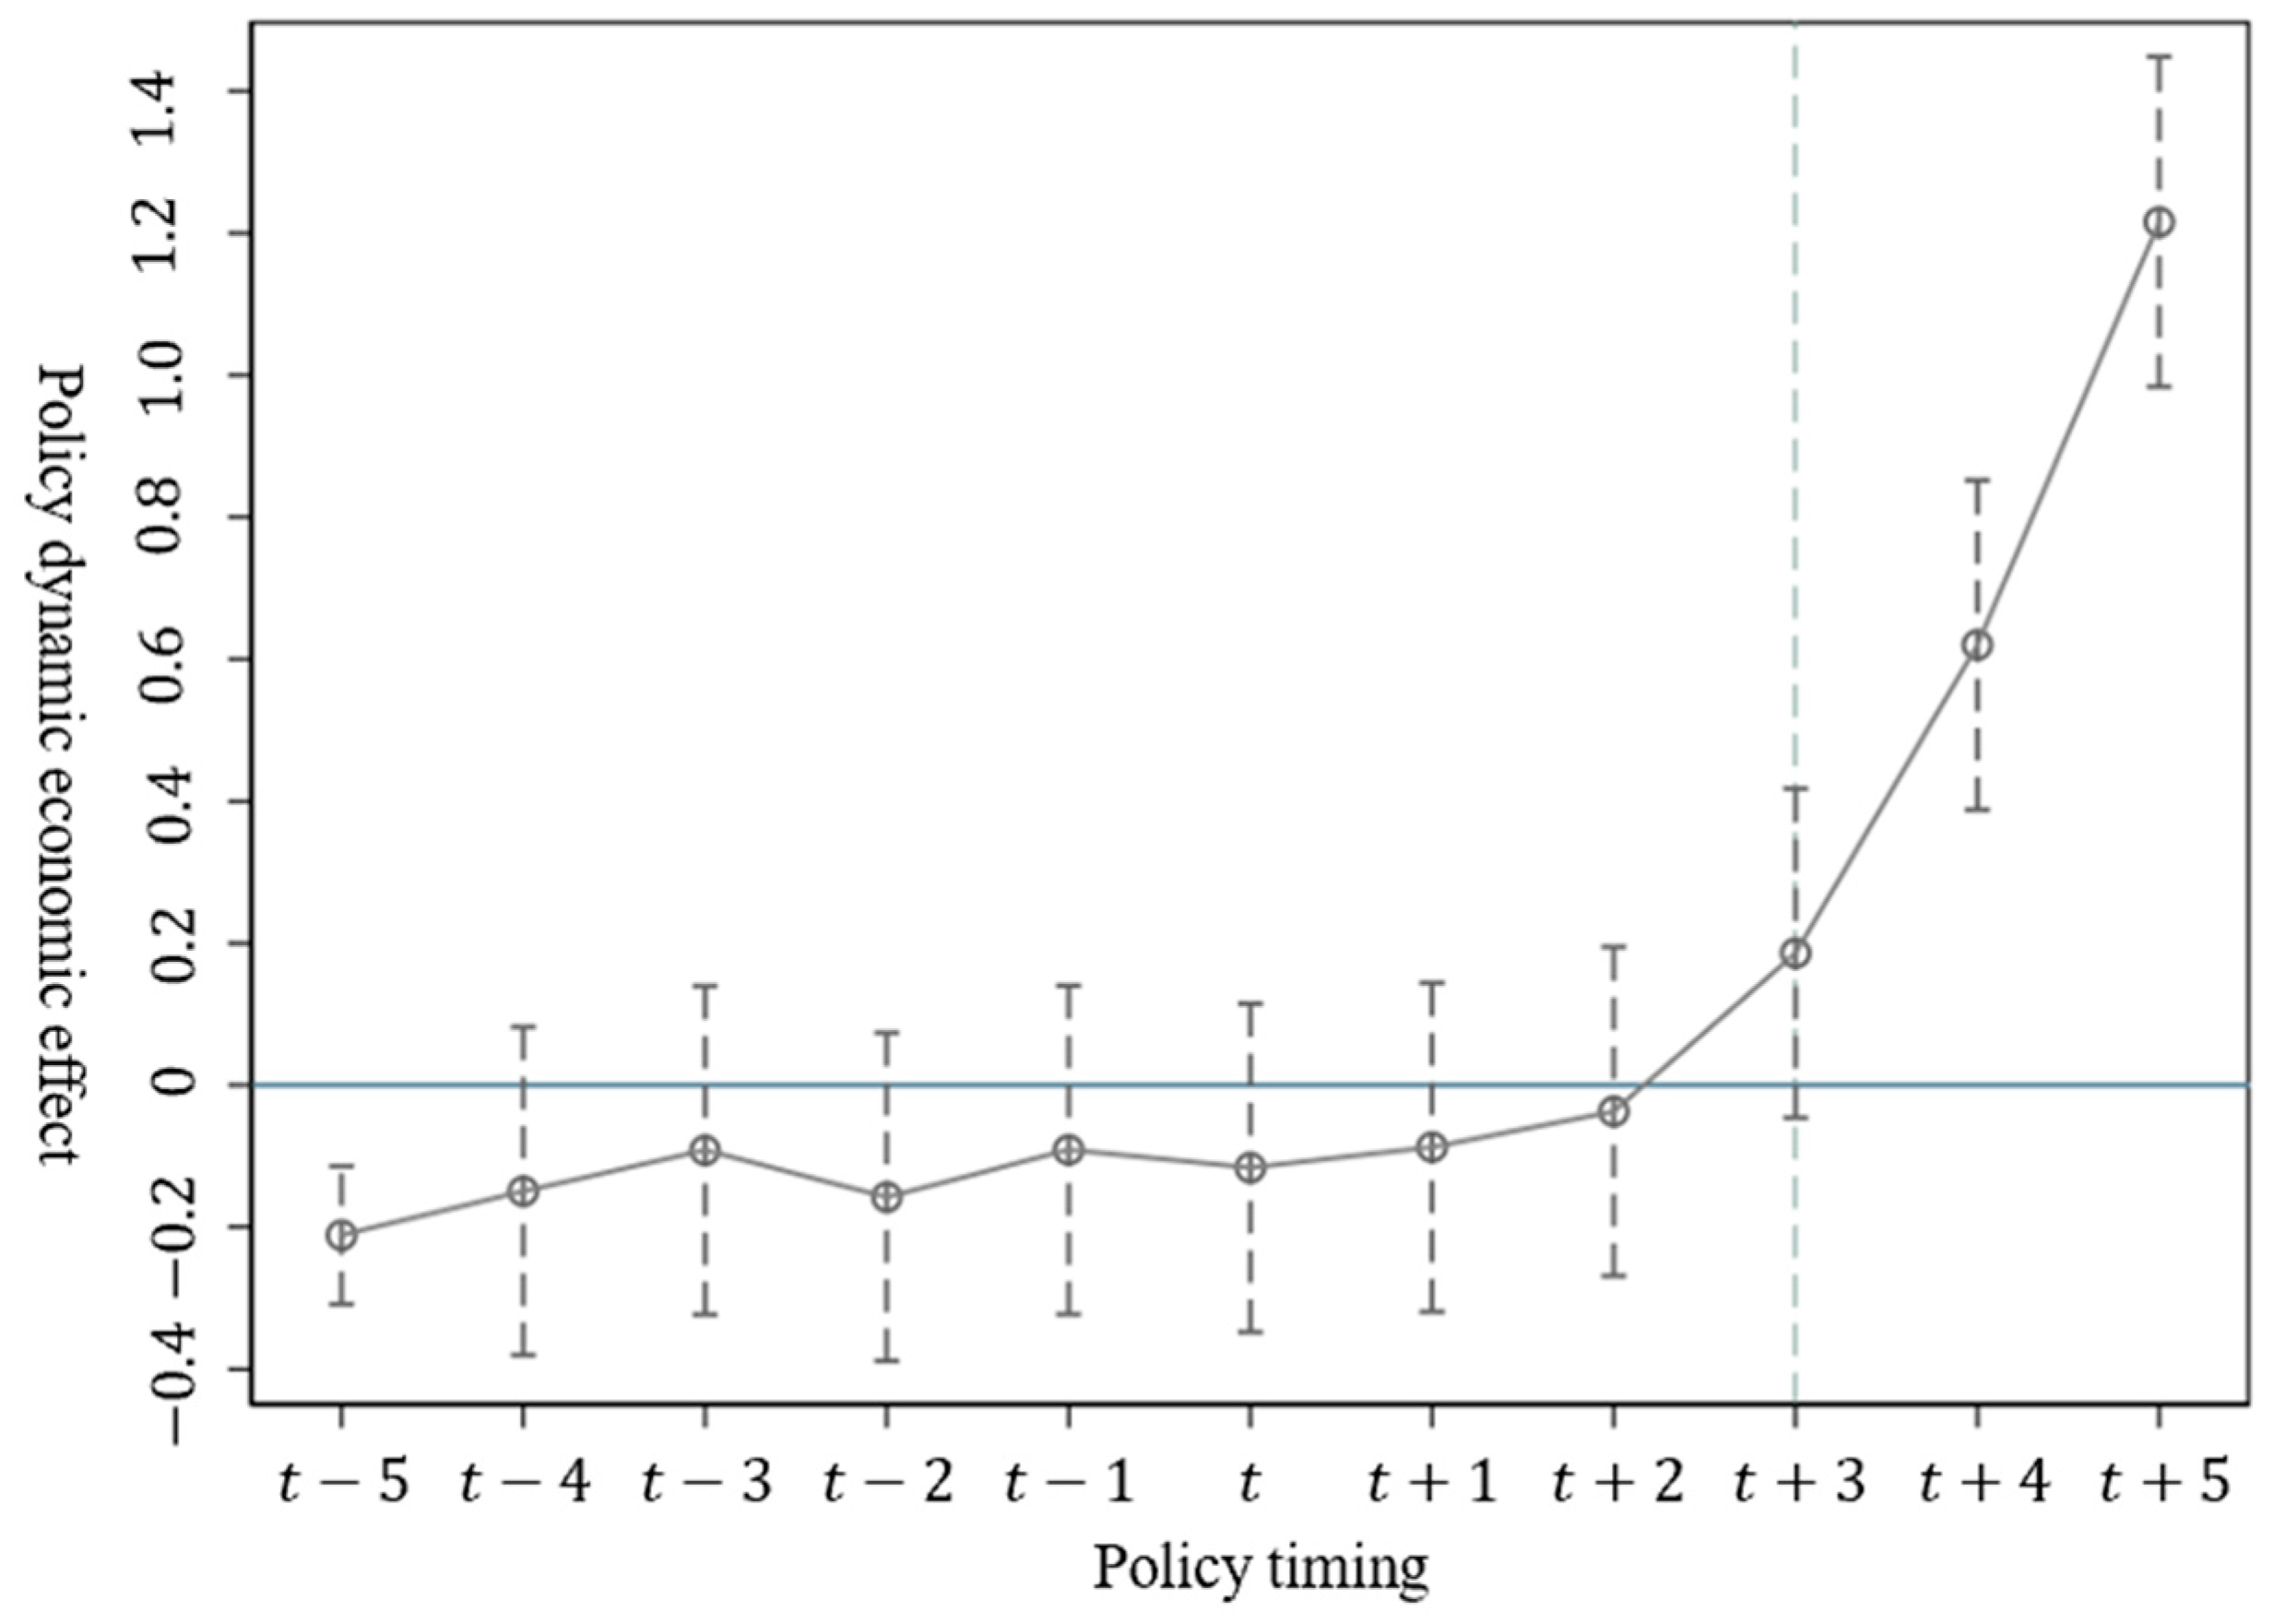
5.1. Parallel Trend Test

A necessary condition for regression estimation using a double difference model is the fulfillment of the parallel trend assumption. Before the policy implementation, it is crucial that the experimental and control groups exhibit similar tendencies of change. One year before the policy of e-government platform construction and application was introduced, a reference group was used to verify the existence of parallel trends in the observation sample through the event study method [67]. Figure 3 depicts the regression results for the core explanatory variable P o l i c y and its corresponding 90% confidence interval, and it is evident that the coefficient of regression is not significant from period ( t 5 ) to t , indicating that before the pilot policy’s implementation, there was no significant difference in the economic development quality between the experimental and the control groups, satisfying the parallel trend assumption. Furthermore, since the commencement of the ( t 3 ) period, there has been a marked increase in the significance of the estimated coefficient P o l i c y , indicating that government digital transformation has a driving effect on the high-quality development of urban economy with an approximate lag period of three years. Moreover, this promotional effect is enduring.

5.2. Tests Based on the PSM-DID Methodology

In the e-government platform construction process, the state may give priority to areas with strong governance capacity, a high level of information technology, a good foundation for economic development, and an obvious regional radiation-driven role as pilot cities, leading to bias in the selection of pilot regions. To ensure robustness testing and mitigate potential biases, the PSM-DID model is employed. Specifically, considering the level of high-quality economic development ( L n H q d ) as the outcome variable, with socio-economic development ( L n P g d p ), population density ( L n D e n ), financial development ( L n F i n ), infrastructure ( L n I n f r a ), openness to the outside world ( L n O p e n ), and government intervention ( L n G o v ) as matching variables, corresponding matching was conducted using the 1:1 nearest-neighbor matching method. The PSM balance test demonstrated that the standardized deviations for the variables stayed below 10% in absolute value after all the matching. Additionally, the transition from statistically significant to non-significant mean differences before and after matching indicates minimal distinctions between the experimental and control groups following the matching process. Therefore, based on the matched samples, the estimation was again conducted through the baseline model. The results in Table 7 indicate that regardless of the inclusion of control variables, the estimated outcomes of the core explanatory variable are consistently significant and positive, and the outcome underscores that government digital transformation can facilitate the urban economy to move towards a higher-quality development stage. In terms of the strength of the driving effect, the regression coefficient of 0.1779 for PSM-DID is lower than the baseline model estimates of 0.2275, but it does not impact on the central conclusions of this study.

5.3. Other Robustness Tests

Following the aforementioned tests, this manuscript also adopts other methods to test the reliability of the research findings, including the below four aspects:
(1) Replacement of explanatory variables. In the baseline regression stage, the green total factor productivity ( L n H q d ) incorporating urban cumulative multiplication is selected as a proxy indicator for high-quality economic development. To further assess the reliability of the driving effect of government digital transformation on urban economic development quality, we considered the adoption of the Slacks-Based Measure (SBM) model based on slack variables to reevaluate the GTFP of each city [68,69], and the resulting estimates served as a proxy for the economy’s high-quality development. Column (1) of Table 8 displays the regression results, revealing that even with the replacement of the dependent variable, the estimated coefficients remain significantly positive at the 1% statistical level. This confirms the robustness and reliability of the baseline regression findings.
(2) Abnormal value processing. Firstly, some of the data themselves may have anomalies during the data collection process; secondly, for the missing data, filling in using methods such as interpolation and smoothing may lead to anomalies in the total sample data. To prevent sample outliers from interfering with the findings of the study, the Winsor2 command of Stata was used to shrink the tails at the 1% level for all continuous variables and subsequently re-estimating the baseline model. Column (2) in Table 8 illustrates the regression results, indicating that even after trimming at the 1% level, the estimated coefficients remain significantly positive. Although the regression coefficients are slightly reduced numerically, they do not affect the core conclusions.
(3) Controlling for fixed effects. Cities demonstrating high economic development quality are likely to prioritize the development of e-government platforms, gaining a “first-mover advantage” in government digital transformation initiatives, leading to endogeneity problems in the causality judgment of the empirical analysis. For this reason, we control for province fixed effects (Pro-FE) and the interaction effect between the province and year ((Pro × Time)-FE) to address potential alterations in the macro-systemic environment resulting from government digital transformation [70]. Columns (3) and (4) in Table 8 demonstrate that the core findings remain strong and robust after considering systematic changes in macro factors.

5.4. Instrumental Variables Approach

Mitigating endogeneity is a non-negligible issue in the field of economic research. First, the rapid improvement in the quality of urban economic development is inseparable from the continuous enhancement of government governance capabilities, and the capabilities are closely linked to the elevation of the socioeconomic development level. Thus, a plausible causal endogenous relationship could exist between government digital transformation and the high-quality development of urban economy. Second, although the baseline model controls for time and city fixed effects as well as six variables related to economic development quality, including socio-economic factors, population density, financial development, infrastructure, openness to foreign markets, and government intervention, there exist additional factors influencing socio-economic development quality, and it is a challenge to prevent the occurrence of omitted variables with the control variables involved in the current data. Consequently, the fundamental findings could be influenced by factors like bidirectional causation and omitted variables. To tackle these endogeneity concerns, this paper employs an instrumental variables approach to discern the net effects of government digital transformation on the high-quality development of urban economy.
The historical postal and telecommunications data for each city in 1984 were chosen as an instrumental variable for assessing government digital transformation [71]. As government digital transformation is the continuation and development a traditional government office platform, and the local historical telecommunication base will influence subsequent stages of e-government platform establishment and utilization in terms of technological development and habit formation. Therefore, this is consistent with the requirement to use the number of post offices as an indicator variable for the government’s digital transformation. In comparison to the swift progress in digital and information technologies, the historical influence of the number of post offices on the quality and level of economic development is gradually diminishing. Presently, the quantity of post offices seems to have limited impact on the developmental stages of cities. In this sense, the selection of historical post office volume as an instrumental variable after controlled for factors satisfies the exclusive requirement to some extent. On this basis, the selection of the 1984 historical records for the number of post offices in each city was performed as an instrumental variable for government digital transformation.
The observed dataset used in this paper comprises balanced panel data. However, the original cross-sectional instrumental variable data were not directly utilized for econometric analysis of panel data. This study constructed interaction terms between the number of post offices in each city in 1984 and the proportion of employees in information transmission, computer services, and software industries [71]. These terms were employed as instrumental variables for the regression estimation of government digital transformation. Detailed results can be found in Table 9. Observing the results in columns (2) and (4) of Table 9, it is evident that the p-values for the Kleibergen–Paap rk LM statistic are both 0.000, significantly rejecting the null hypothesis of insufficient instrument identification. Moreover, the Kleibergen–Paap rk Wald F statistic exceeds the critical value of the Stock–Yogo weak identification test at the 10% statistical level, indicating the absence of weak instrument issues. In summary, the findings suggest that employing the interaction term as an instrumental variable for government digital transformation is a reasonable choice. Furthermore, a comparison of the estimated results between OLS and 2SLS demonstrates persistent significantly positive coefficients after considering the endogeneity problem, and the regression coefficients of the variable I V are significantly higher than those of the variable P o l i c y , suggesting that the issue of endogeneity selection in pilot cities tends to underestimate the strength of the driving effect of government digital transformation on high-quality economic development.

6. Mechanism Testing

By analyzing the estimation results, this paper preliminarily confirms the research hypotheses H1: government digital transformation has a positive driving effect on high-quality economic development in urban areas and H2: Government digital transformation will foster the formation of a “latecomer advantage” in lagging areas, to achieve the “catching-up effect” of the developed areas. But what potential pathways does government digital transformation follow to impact the high-quality development of urban economies? To explore the transmission mechanism, building upon previous theoretical hypotheses, it is proposed that government digital transformation mainly drives the high quality of urban economy through two paths, namely the innovation spillover effect and the structural optimization effect. Therefore, the theoretical hypothesis H3 is further tested through models (2) and (3).

6.1. Innovation Spillover Effect

To investigate the mechanism of the innovation spillover effect, the two dimensions of innovation environment and innovation capability are examined. Firstly, the City Innovation and Entrepreneurship Index ( I n d e x ) compiled by the Fudan University Industry Development Research Center is employed as a proxy indicator for the innovation environment [72]. Secondly, the number of granted invention patents per ten thousand people is selected as an alternative variable for urban innovation capability ( A u t ).
Columns (1) and (3) of Table 10 show that the development of an e-government platform as an exogenous policy shock effectively promotes the optimization of the urban innovation and entrepreneurship environment and drives the improvement of the urban technological innovation capacity. Meanwhile, the results in columns (2) and (4) of Table 10 indicate that the regression outcomes of the interaction terms between the innovation and entrepreneurship index ( I n d e x ), the number of patents granted per ten thousand people ( A u t ), and the core explanatory variable ( P o l i c y ) for the high-quality development of urban economies ( L n H q d ) are significantly positive at the 1% statistical level. This indicates that government digital transformation can promote the urban economy quality to move to a higher development stage by optimizing innovation and entrepreneurship environments and improving technological innovation capability. Furthermore, the regression outcomes in columns (2) and (4) of Table 10 exhibit numerical values lower than those of the benchmark model’s estimated coefficients, suggesting that the innovation and entrepreneurship environment, along with innovation and invention capacity, partially mediates the observed outcomes. In summary, the innovation spillover effect of government digital transformation is verified.

6.2. Structural Optimization Effect

Government digital transformation will promote the construction and application of e-government platforms, improve the urban business environment, facilitate the concentration of vital production factors in the region, and drive the enhancement of the urban talent structure. In addition, government digital transformation will enhance the efficacy of governance, effectively guide the flow of factor resources to digital technology, information services, and other industries with higher productivity, fostering the optimization and upgrading of the industrial structure, and driving urban development towards a green, intensive, and high-quality development path.
To verify the structural optimization mechanism of government digital transformation, we initially adopt the industrial structure perspective, utilizing the ratio of the output values of the tertiary industry to the secondary industry as an indicator for assessing the dynamic transformation pattern in the industrial structure of each city [73,74]. To ensure the robustness and reliability of the research conclusions, the ratio of employees in the tertiary industry to those in the secondary industry ( I n d ) is used to measure the level of industrial structure optimization in cities. Additionally, considering talent structure optimization, we use the proportion of public management practitioners as a metric to evaluate the transformation and upgrading of the city’s managerial talent composition. For enhanced robustness, the proportion of R&D practitioners is further adapted to measure the city’s optimization and upgrading of innovative talent structure.
Observing columns (1), (3), (5), and (7) of Table 11 reveals that government digital transformation significantly promotes the dynamic transformation of urban industrial structure, driving a shift in talent structure towards managerial and innovative orientations. Meanwhile, the results in columns (2), (4), (6), and (8) of Table 11 indicate that the estimated coefficients of the interaction terms involving the industrial structure optimization indicator ( I n d , T h d ), the talent structure optimization indicator ( M a g , R a d ), and the core explanatory variable ( P o l i c y ) with high-quality economic development ( L n H q d ) are significantly positive at the 1% confidence level. It can be concluded that these two factors are potential mechanisms through which government digital transformation influences the high-quality development of urban economies. This implies that government digital transformation can enhance the quality of urban economic development by fostering changes in industrial structure and talent structure upgrading. The mechanism test results confirm hypothesis H3: government digital transformation facilitates high-quality urban economic development through the effects of innovation spillover and structural optimization.

7. Discussion and Conclusions

Based on urban panel data from 2003 to 2018, this study employs a difference-in-differences model to estimate the driving effects of government digital transformation on the high-quality urban economy development. To assess the variations in the effects across different geographical conditions, developmental levels, and educational levels of cities, a series of methods such as parallel trend analysis, PSM-DID, and instrumental variable approaches were employed to conduct robustness tests on the research conclusions. This study also delves into the marginal increment patterns and transmission mechanisms of the policy, and the key conclusions are as follows:
(1) Government digital transformation contributes to improving the quality of urban economic development, with a noticeable pattern of marginal increment in this effect. Compared with non-pilot cities, the establishment and utilization of e-government public platforms promote an average annual increase of 3.79% in the high-quality economic development level within the demonstration area.
(2) The driving effects of the government digital transformation program are more evident in cities with weaker development bases, lower urban grades, and inferior education quality, but the improvement in the level of high-quality economic development in areas with good bases and high grades is relatively small. This shows that the policy can promote the less developed areas to form a “latecomer advantage”, in order for them to catch up with more developed areas.
(3) The number of urban post offices satisfies the assumptions of instrument relevance and exogeneity. Furthermore, estimation through two-stage least squares estimation finds that the endogeneity problem of the pilot policy “Cloud Computing-based E-government Public Platform Construction and Application” tends to underestimate the driving effects of government digital transformation on the high-quality development of urban economies.
(4) The mechanism analysis indicates that government digital transformation can drive the improvement in the quality of urban economic development through two pathways: the structural optimization effect and the innovation spillover effect.
Based on the above findings, this research provides empirical support for the positive external effects of government digital transformation on urban economic development quality from a policy-driven perspective. This study suggests the following policy recommendations: first, the central government should consider regional variations in e-government development and increase its investment in digital transformation, facilitate coordinated regional development, and actively create external conditions conducive to the promotion of public and business innovation. It should continue to enhance the effectiveness of government governance and improve the business environment in the market to achieve synergy between “effective governance” and “effective government”. Secondly, local governments should focus on constructing new infrastructure to establish a robust material foundation for e-government development. Meanwhile, it is necessary to vigorously promote industrial digitization and digital industrialization using industrial structural adjustment as a leverage point, fully leveraging market mechanisms, improving the efficiency of production factor allocation, and accelerating the transformation and upgrading of urban development structures and modes. Finally, relying on the e-government cloud platform can promote the quality and efficiency of government services. E-government services essentially still belong to the category of basic government functions, such as social management and public services. The government should use high-quality public services to attract talents specializing in urban governance, administration, and e-government. In addition, the government should also establish a comprehensive re-education and in-training system to strengthen the systematic training of professionals, so as to comprehensively and diversely optimize the structure of urban talents.
While this paper offers preliminary insights into the impact of government digital transformation on high-quality urban economic development, it is important to acknowledge several limitations that present opportunities for future research. First, the analysis is primarily based on data from Chinese cities, which may constrain the generalizability of the findings. Considering the considerable variation in government digitalization processes and economic development models across different countries and regions, future research should explore cross-national comparative studies to validate and extend the conclusions presented here. Additionally, although this study examines the innovation spillover effects and structural optimization effects of government digital transformation, it does not fully explore the heterogeneity of these effects across different industries and sectors. Future research should investigate these sectoral variations to uncover the multidimensional impacts of digital transformation on the quality of economic development. Furthermore, regarding the theoretical contributions of this study, while it provides initial evidence supporting the positive influence of government digital transformation on urban economic development, it does not sufficiently explore how these findings interact with or challenge existing theoretical frameworks. Future research should engage in more in-depth theoretical analysis to situate the results within broader theoretical discourses and to elucidate their practical implications for policymakers, practitioners, and organizations. This approach would not only enhance the theoretical rigor but also increase the practical relevance of the findings. Finally, this study is limited by its data, which extend only until 2018. Given the rapid advancements in digital technologies—particularly emerging technologies such as the blockchain and artificial intelligence—future research should incorporate more recent data and consider the evolving technological landscape to provide a comprehensive assessment of the continued impact of government digital transformation on economic development. Moreover, future studies should adopt a more systematic approach to discussing limitations, explicitly addressing potential biases related to sample selection, data scope, and model specification, and offering strategies to mitigate these issues.

Author Contributions

L.X., data curation; X.W., Z.L. and X.L., writing—original draft. All authors have read and agreed to the published version of the manuscript.

Funding

This research received no external funding.

Data Availability Statement

Data will be made available on request.

Conflicts of Interest

The authors declare that they have no known competing financial interests or personal relationships that could have appeared to influence the work reported in this paper.

References

  1. Liu, X.P.; Zheng, L. Cross-departmental collaboration in one-stop service center for smart governance in China: Factors, strategies and effectiveness. Gov. Inf. Q. 2018, 35, S54–S60. [Google Scholar] [CrossRef]
  2. Mergel, I.; Gong, Y.W.; Bertot, J. Agile government: Systematic literature review and future research. Gov. Inf. Q. 2018, 35, 291–298. [Google Scholar] [CrossRef]
  3. Rana, N.P.; Dwivedi, Y.K.; Williams, M.D. A meta-analysis of existing research on citizen adoption of e-government. Inf. Syst. Front. 2015, 17, 547–563. [Google Scholar] [CrossRef]
  4. Lofstedt, U. E-government-assesment of current research and some proposals for future directions. Int. J. Public Inf. Syst. 2012, 1, 39–52. [Google Scholar]
  5. Ndou, V. E-government for developing countries: Opportunities and challenges. Electron. J. Inf. Syst. Dev. Ctries. 2004, 18, 1–24. [Google Scholar] [CrossRef]
  6. Schorr, H.; Stolfo, S.J. A digital government for the 21st century. Commun. ACM 1998, 41, 15–19. [Google Scholar] [CrossRef]
  7. Manoharan, A.P.; Ingrams, A. Conceptualizing e-government from local government perspectives. State Local Gov. Rev. 2018, 50, 56–66. [Google Scholar] [CrossRef]
  8. Gil-Garcia, J.R.; Dawes, S.S.; Pardo, T.A. Digital government and public management research: Finding the crossroads. Public Manag. Rev. 2018, 20, 633–646. [Google Scholar] [CrossRef]
  9. Grossi, G.; Meijer, A.; Sargiacomo, M. A public management perspective on smart cities: ‘Urban auditing’ for management, governance and accountability introduction. Public Manag. Rev. 2020, 22, 633–647. [Google Scholar] [CrossRef]
  10. Joseph, R.C. A structured analysis of e-government studies: Trends and opportunities. Gov. Inf. Q. 2013, 30, 435–440. [Google Scholar] [CrossRef]
  11. Chatfield, A.T.; Reddick, C.G. A framework for Internet of Things-enabled smart government: A case of IoT cybersecurity policies and use cases in US federal government. Gov. Inf. Q. 2019, 36, 346–357. [Google Scholar] [CrossRef]
  12. Dunleavy, P.; Margetts, H.; Bastow, S.; Tinkler, J. New public management is dead—Long live digital-era governance. J. Public Adm. Res. Theory 2006, 16, 467–494. [Google Scholar] [CrossRef]
  13. Meijer, A.; Bekkers, V. A metatheory of e-government: Creating some order in a fragmented research field. Gov. Inf. Q. 2015, 32, 237–245. [Google Scholar] [CrossRef]
  14. Mergel, I.; Edelmann, N.; Haug, N. Defining digital transformation: Results from expert interviews. Gov. Inf. Q. 2019, 36, 101385. [Google Scholar] [CrossRef]
  15. Weerakkody, V.; Irani, Z.; Kapoor, K.; Sivarajah, U.; Dwivedi, Y.K. Open data and its usability: An empirical view from the Citizen’s perspective. Inf. Syst. Front. 2017, 19, 285–300. [Google Scholar] [CrossRef]
  16. Yan, Y.C.; Lyu, S.J. Can e-government reduce local governments’ financial deficits?—Analysis based on county-level data from China. Gov. Inf. Q. 2023, 40, 101812. [Google Scholar] [CrossRef]
  17. Zhang, J.; Bates, J.; Abbott, P. State-steered smartmentality in Chinese smart urbanism. Urban Stud. 2022, 59, 2933–2950. [Google Scholar] [CrossRef]
  18. Angelopoulos, S.; Bendoly, E.; Fransoo, J.; Hoberg, K.; Ou, C.; Tenhiälä, A. Digital transformation in operations management: Fundamental change through agency reversal. J. Oper. Manag. 2023, 69, 876–889. [Google Scholar] [CrossRef]
  19. Bélanger, F.; Carter, L. Digitizing government interactions with constituents: An historical review of e-government research in information systems. J. Assoc. Inf. Syst. 2012, 13, 363–394. [Google Scholar] [CrossRef]
  20. Kamal, M.M.; Weerakkody, V.; Jones, S. The case of EAI in facilitating e-Government services in a Welsh authority. Int. J. Inf. Manag. 2009, 29, 161–165. [Google Scholar] [CrossRef]
  21. Klievink, B.; Janssen, M. Realizing joined-up government—Dynamic capabilities and stage models for transformation. Gov. Inf. Q. 2009, 26, 275–284. [Google Scholar] [CrossRef]
  22. Morte-Nadal, T.; Esteban-Navarro, M.A. Digital competences for improving digital Inclusion in e-government services: A mixed-methods systematic review protocol. Int. J. Qual. Methods 2022, 21, 16094069211070935. [Google Scholar] [CrossRef]
  23. Sharma, P.N.; Morgeson, F.V.; Mithas, S.; Aljazzaf, S. An empirical and comparative analysis of E-government performance measurement models: Model selection via explanation, prediction, and parsimony. Gov. Inf. Q. 2018, 35, 515–535. [Google Scholar] [CrossRef]
  24. Chanias, S.; Myers, M.D.; Hess, T. Digital transformation strategy making in pre-digital organizations: The case of a financial services provider. J. Strateg. Inf. Syst. 2019, 28, 17–33. [Google Scholar] [CrossRef]
  25. Dwivedi, Y.K.; Rana, N.P.; Janssen, M.; Lal, B.; Williams, M.D.; Clement, M. An empirical validation of a unified model of electronic government adoption (UMEGA). Gov. Inf. Q. 2017, 34, 211–230. [Google Scholar] [CrossRef]
  26. Gong, Y.W.; Yang, J.; Shi, X.J. Towards a comprehensive understanding of digital transformation in government: Analysis of flexibility and enterprise architecture. Gov. Inf. Q. 2020, 37, 101487. [Google Scholar] [CrossRef]
  27. Janowski, T. Digital government evolution: From transformation to contextualization. Gov. Inf. Q. 2015, 32, 221–236. [Google Scholar] [CrossRef]
  28. Bharadwaj, A.; El Sawy, O.A.; Pavlou, P.A.; Venkatraman, N. Digital business strategy: Toward a next generation of insights. Mis Q. 2013, 37, 471–482. [Google Scholar] [CrossRef]
  29. De Tuya, M.; Cook, M.; Sutherland, M.; Luna-Reyes, L.F. The leading role of the government CIO at the local level: Strategic opportunities and challenges. Gov. Inf. Q. 2020, 37, 101218. [Google Scholar] [CrossRef]
  30. Katsonis, M.; Botros, A. Digital government: A primer and professional perspectives. Aust. J. Public Adm. 2015, 74, 42–52. [Google Scholar] [CrossRef]
  31. Boyle, C.; Ryan, G.; Bhandari, P.; Law, K.M.Y.; Gong, J.Z.; Creighton, D. Digital transformation in water organizations. J. Water Resour. Plan. Manag. 2022, 148, 03122001. [Google Scholar] [CrossRef]
  32. Yang, Y.; Chen, W.Y.; Yu, Z.X. Local government debt and corporate digital transformation: Evidence from China. Financ. Res. Lett. 2023, 57, 104282. [Google Scholar] [CrossRef]
  33. Akter, S.; Michael, K.; Uddin, M.R.; McCarthy, G.; Rahman, M. Transforming business using digital innovations: The application of AI, blockchain, cloud and data analytics. Ann. Oper. Res. 2022, 308, 7–39. [Google Scholar] [CrossRef]
  34. Choudhuri, B.; Srivastava, P.R.; Mangla, S.K.; Kazancoglu, Y. Enterprise architecture as a responsible data driven urban digitization framework: Enabling circular cities in India. Ann. Oper. Res. 2023, 1–29. [Google Scholar] [CrossRef]
  35. Anthopoulos, L.G.; Siozos, P.; Tsoukalas, L.A. Applying participatory design and collaboration in digital public services for discovering and re-designing e-government services. Gov. Inf. Q. 2007, 24, 353–376. [Google Scholar] [CrossRef]
  36. Guo, Q.Z.; Geng, C.X.; Yao, N.Z. How does green digitalization affect environmental innovation? The moderating role of institutional forces. Bus. Strategy Environ. 2023, 32, 3088–3105. [Google Scholar] [CrossRef]
  37. Scuotto, V.; Tzanidis, T.; Usai, A.; Quaglia, R. The digital humanism era triggered by individual creativity. J. Bus. Res. 2023, 158, 113709. [Google Scholar] [CrossRef]
  38. Wu, Y.; Li, H.H.; Luo, R.Y.; Yu, Y.B. How digital transformation helps enterprises achieve high-quality development? Empirical evidence from Chinese listed companies. Eur. J. Innov. Manag. 2023. [Google Scholar] [CrossRef]
  39. Alhassan, U. E-government and the impact of remittances on new business creation in developing countries. Econ. Chang. Restruct. 2023, 56, 181–214. [Google Scholar] [CrossRef]
  40. Huang, Z.; Cheng, X. Environmental regulation and rural migrant workers’ job quality: Evidence from China migrants dynamic surveys. Econ. Anal. Policy 2023, 78, 845–858. [Google Scholar] [CrossRef]
  41. Bagheri, M.; Mitchelmore, S.; Bamiatzi, V.; Nikolopoulos, K. Internationalization orientation in SMEs: The mediating role of technological innovation. J. Int. Manag. 2019, 25, 121–139. [Google Scholar] [CrossRef]
  42. Liu, G.T.; Wang, B.; Zhang, N. A coin has two sides: Which one is driving China’s green TFP growth? Econ. Syst. 2016, 40, 481–498. [Google Scholar] [CrossRef]
  43. Wu, C. Human capital, life expectancy, and the environment. J. Int. Trade Econ. Dev. 2017, 26, 885–906. [Google Scholar] [CrossRef]
  44. Glaeser, E.L.; Kerr, S.P.; Kerr, W.R. Entrepreneurship and urban growth: An empirical assessment with historical mines. Rev. Econ. Stat. 2015, 97, 498–520. [Google Scholar] [CrossRef]
  45. Sestino, A.; Kahlawi, A.; De Mauro, A. Decoding the data economy: A literature review of its impact on business, society and digital transformation. Eur. J. Innov. Manag. 2023. [Google Scholar] [CrossRef]
  46. Hsieh, C.T.; Klenow, P.J. Misallocation and manufacturing tfp in China and India. Q. J. Econ. 2009, 124, 1403–1448. [Google Scholar] [CrossRef]
  47. Greenstone, M.; Hanna, R. Environmental regulations, air and water pollution, and infant mortality in India. Am. Econ. Rev. 2014, 104, 3038–3072. [Google Scholar] [CrossRef]
  48. Wang, K.L.; Miao, Z.; Zhao, M.S.; Miao, C.L.; Wang, Q.W. China’s provincial total-factor air pollution emission efficiency evaluation, dynamic evolution and influencing factors. Ecol. Indic. 2019, 107, 105578. [Google Scholar] [CrossRef]
  49. Shin, S.C.; Ho, J.W.; Pak, V.Y. Digital Transformation through e-Government Innovation in Uzbekistan. In Proceedings of the 2020 22nd International Conference on Advanced Communication Technology (Icact), Phoenix Park, Republic of Korea, 16–19 February 2020; pp. 632–639. [Google Scholar] [CrossRef]
  50. Acemoglu, D.; Restrepo, P. The race between man and machine: Implications of technology for growth, factor shares, and employment. Am. Econ. Rev. 2018, 108, 1488–1542. [Google Scholar] [CrossRef]
  51. Aisaiti, G.; Xie, J.P.; Zhang, T.T. National innovation demonstration zone policy and city innovation capability—A quasi-natural experimental analysis. Ind. Manag. Data Syst. 2022, 122, 1246–1267. [Google Scholar] [CrossRef]
  52. Kar, A.K.; Ilavarasan, V.; Gupta, M.P.; Janssen, M.; Kothari, R. Moving beyond smart cities: Digital nations for social innovation & sustainability. Inf. Syst. Front. 2019, 21, 495–501. [Google Scholar] [CrossRef]
  53. Liu, Y.H.; Yang, Z.H. Can data center green reform facilitate urban green technology innovation? Evidence from China. Environ. Sci. Pollut. Res. 2023, 30, 62951–62966. [Google Scholar] [CrossRef] [PubMed]
  54. Wang, K.L.; Pang, S.Q.; Zhang, F.Q.; Miao, Z.; Sun, H.P. The impact assessment of smart city policy on urban green total-factor productivity: Evidence from China. Environ. Impact Assess. Rev. 2022, 94, 106756. [Google Scholar] [CrossRef]
  55. Paprotny, D.; Kreibich, H.; Morales-Nápoles, O.; Terefenko, P.; Schröter, K. Estimating exposure of residential assets to natural hazards in Europe using open data. Nat. Hazards Earth Syst. Sci. 2020, 20, 323–343. [Google Scholar] [CrossRef]
  56. Wu, W.Q.; Wang, W.W.; Zhang, M. Does internet public participation slow down environmental pollution? Environ. Sci. Policy 2022, 137, 22–31. [Google Scholar] [CrossRef]
  57. Zhao, T.; Zhang, Z.; Liang, S.K. Digital economy, entrepreneurship, and high-quality economic development: Empirical evidence from urban China. J. Manag. World 2020, 36, 65–76. [Google Scholar] [CrossRef]
  58. Gan, T.; Zhang, M.X.; Zhang, Z.Q. The impact of digital government policy on entrepreneurial activity in China. Econ. Anal. Policy 2023, 79, 479–496. [Google Scholar] [CrossRef]
  59. Lv, C.C.; Song, J.; Lee, C.C. Can digital finance narrow the regional disparities in the quality of economic growth? Evidence from China. Econ. Anal. Policy 2022, 76, 502–521. [Google Scholar] [CrossRef]
  60. Qiang, Q.; Jian, C. Natural resource endowment, institutional quality and China’s regional economic growth. Resour. Policy 2020, 66, 101644. [Google Scholar] [CrossRef]
  61. Muradian, R.; Martinez-Alier, J. Trade and the environment: From a ‘Southern’ perspective. Ecol. Econ. 2001, 36, 281–297. [Google Scholar] [CrossRef]
  62. Dai, X.W.; Yan, Z.; Tian, M.Z.; Tang, M.L. Quantile regression for general spatial panel data models with fixed effects. J. Appl. Stat. 2020, 47, 45–60. [Google Scholar] [CrossRef] [PubMed]
  63. Kato, K.; Galvao, A.F.; Montes-Rojas, G.V. Asymptotics for panel quantile regression models with individual effects. J. Econom. 2012, 170, 76–91. [Google Scholar] [CrossRef]
  64. Zhang, J.X.; Li, W.S.; Zhai, L. Understanding geographical conditions monitoring: A perspective from China. Int. J. Digit. Earth 2015, 8, 36–55. [Google Scholar] [CrossRef]
  65. Huang, H.Y.; Mbanyele, W.; Fan, S.S.; Zhao, X. Digital financial inclusion and energy-environment performance: What can learn from China. Struct. Chang. Econ. Dyn. 2022, 63, 342–366. [Google Scholar] [CrossRef]
  66. YICAI. 2017 “New First-tier” Cities Ranking Released. 2017. Available online: https://www.yicai.com/news/5293378.html (accessed on 15 January 2018).
  67. Beck, T.; Levine, R.; Levkov, A. Big bad banks? The winners and losers from bank deregulation in the United States. J. Financ. 2010, 65, 1637–1667. [Google Scholar] [CrossRef]
  68. He, X.L.; Liang, Y.F.; Liang, D.; Deng, H. The impact of China’s information infrastructure construction policy on green total factor productivity: Moving towards a green world. Environ. Sci. Pollut. Res. 2023, 30, 103017–103032. [Google Scholar] [CrossRef]
  69. Zhang, Y.J.; Song, Y.; Zou, H. Transformation of pollution control and green development: Evidence from China’s chemical industry. J. Environ. Manag. 2020, 275, 111246. [Google Scholar] [CrossRef]
  70. Zhao, H.; Chen, S.W.; Zhang, W.K. Does digital inclusive finance affect urban carbon emission intensity: Evidence from 285 cities in China. Cities 2023, 142, 104552. [Google Scholar] [CrossRef]
  71. Nunn, N.; Qian, N. US Food Aid and Civil Conflict. Am. Econ. Rev. 2014, 104, 1630–1666. [Google Scholar] [CrossRef]
  72. Fudan Institute of Industrial Development; Yicai Research Institute; Research Institute of Chinese Economy Fudan University. FIND Report on City and Industrial Innovation in China. 2017. Available online: http://imgcdn.yicai.com/uppics/files/2018/01/636507587751508252.pdf (accessed on 15 January 2018).
  73. Lin, B.Q.; Wang, C.H. Does industrial relocation affect regional carbon intensity? Evidence from China’s secondary industry. Energy Policy 2023, 173, 113339. [Google Scholar] [CrossRef]
  74. Muhammad, S.; Pan, Y.C.; Agha, M.H.; Umar, M.; Chen, S.Y. Industrial structure, energy intensity and environmental efficiency across developed and developing economies: The intermediary role of primary, secondary and tertiary industry. Energy 2022, 247, 123576. [Google Scholar] [CrossRef]
Figure 1. Comparison of TFP in pilot and non-pilot cities.
Systems 12 00372 g001
Figure 2. Comparison of GTFP in pilot and non-pilot cities.
Systems 12 00372 g002
Figure 3. Parallel trend test.
Systems 12 00372 g003
Table 1. Pilot cities for cloud-computing-based e-government public platforms.
ProvincesCity LevelCityQuantities
BeijingProvincial-levelBeijing1
TianjinProvincial-levelTianjin1
Inner MongoliaPrefecture-levelHohhot, Baotou, Hulunbeier, Tongliao, Chifeng, Xilingol League, Ordos, Bayannur, Wuhai, Alxa League10
HeilongjiangPrefecture-level Harbin1
AnhuiPrefecture-levelMaanshan, Chizhou2
FujianPrefecture-levelFuzhou, Sanming, Longyan, Nanping, Putian5
County-level Wuyishan, Jianyang2
JiangxiPrefecture-levelNanchang1
ShandongPrefecture-levelQingdao, Jinan, Weifang, Weihai4
GuizhouPrefecture-levelGuiyang, Liupanshui, Zunyi3
ShaanxiPrefecture-levelXianyang, Weinan, Yan’an, Yulin4
He’nan Prefecture-levelZhengzhou, Jiaozuo, Shangqiu, Xinxiang4
County-levelJiyuan
GuangdongPrefecture-levelShenzhen 1
SichuanPrefecture-levelChengdu1
Table 2. Description of variables.
VariantTypologyNameCausalitySpecify the Composition
Explanatory variableGreen total factor productivity H q d Throw oneself intoCapital stockBillions
Average number of employeesTen thousand people
Land supplySquare kilometer
Expected outputsReal GDPRMB 10,000
Non-expected outputsIndustrial wastewater dischargeTons
Industrial emissionsTons
carbon intensity/
PM2.5 concentrationUg/m3
Core explanatory variablesGovernment digital transformation P o l i c y Forwardpolicy variable
Control variableSocio-economic P g d p ForwardGDP per capitaRMB 10,000
Population density D e n ForwardResident population and administrative area
area ratio
Persons per square kilometer
Financial development F i n ForwardFinancial loan balances as a percentage of/
Infrastructure I n f r a ForwardUrban road space per capitaSquare meter
Open to the Outside world O p e n ForwardShare of foreign direct investment/
government intervention G o v ForwardFiscal expenditure as a share of GDP/
Table 3. Descriptive statistics of variables.
VariantNMeanSdMinMax
L n H q d 45440.2070.405−1.9922.473
L n P g d p 45449.9360.7667.31212.19
L n D e n 45445.7110.9551.6039.403
L n F i n 4544−0.4540.285−2.4700.494
L n I n f r a 4544−0.2980.699−3.5622.780
L n O p e n 45442.2151.533−6.5725.929
L n G o v 45440.3730.482−1.1622.329
Table 4. Benchmark regression.
Variant(1)(2)(3)(4)(5)(6)(7)
P o l i c y 0.2573 **
(0.1014)
0.2657 ***
(0.0470)
0.2618 ***
(0.0474)
0.2601 ***
(0.0472)
0.2614 ***
(0.0473)
0.2731 ***
(0.0469)
0.2275 ***
(0.0467)
L n P g d p −0.5599 ***
(0.0756)
−0.4987 ***
(0.0817)
−0.4827 ***
(0.0817)
−0.4914 ***
(0.0829)
−0.4217 ***
(0.0807)
−0.4458 ***
(0.0812)
L n D e n 0.0002
(0.0001)
0.0002
(0.0001)
0.0002
(0.0001)
0.0002
(0.0001)
0.0001
(0.0001)
L n F i n 0.1942 ***
(0.0725)
0.1987 ***
(0.0726)
0.1366 *
(0.0729)
0.0257
(0.0716)
L n I n f r a 0.0346
(0.0442)
0.0354
(0.0423)
0.0201
(0.0347)
L n O p e n −0.0034 ***
(0.0008)
−0.0028 ***
(0.0007)
L n G o v −0.2129 ***
(0.0214)
City-FeYESYESYESYESYESYESYES
Time-FEYESYESYESYESYESYESYES
N4544454445444544454445444544
R20.30630.60580.60880.60940.60950.61470.6280
Annotation: *, **, and *** denote significance at the 10%, 5% and 1% confidence levels, respectively; values in parentheses represent standard errors clustered at the city level.
Table 5. Quantile regression analysis.
(1)(2)(3)(4)(5)
10% Loci25% Loci50% Loci75% Loci90% Loci
P o l i c y 0.0229
(0.0265)
0.0781 ***
(0.0235)
0.0716 ***
(0.0246)
0.1140 ***
(0.0282)
0.1236 ***
(0.0278)
ControlYESYESYESYESYES
Ctiy-FEYESYESYESYESYES
Time-FEYESYESYESYESYES
N45444544454445444544
R2/0.56200.52800.56600.6365
Annotation: *** indicate significance with 1% confidence levels, respectively; bracketed values are standard errors for clustering to the city level; the quantile regression estimation is chosen to be implemented by the sqreg command in Stata 16.0 using the Bootstrapped method, with the number of resamples set to 200.
Table 6. Heterogeneity analysis.
City OrientationCity LocationCity LevelCity Science Education
The Northern Part of the CountryThe Southern Part of the CountryWestern PartEast Central RegionHigher LevelGeneralPost-SecondaryOrdinary
(1)(2)(3)(4)(5)(6)(7)(8)
P o l i c y 0.3198 ***
(0.0585)
0.2155 ***
(0.0759)
0.3730 ***
(0.0805)
0.2447 ***
(0.0563)
0.0029
(0.0991)
0.0814 *
(0.0456)
0.0768
(0.1007)
0.1346 ***
(0.0470)
ControlYESYESYESYESYESYESYESYES
City-FeYESYESYESYESYESYESYESYES
Time-FEYESYESYESYESYESYESYESYES
N208024641344320051240325603984
R20.63360.60680.61500.61330.77220.59550.74590.6053
Annotation: * and *** indicate significance at the 10% and 1% confidence levels, respectively; bracketed values are cluster to city-level standard errors.
Table 7. PSM-DID analysis.
(1)(2)
P o l i c y 0.1736 ***
(0.0598)
0.1779 ***
(0.0581)
ControlNOYES
City-FEYESYES
Time-FEYESYES
N13911391
R20.60470.6181
Note: *** indicate significance at the 1% confidence levels, respectively; bracketed values are standard errors clustered to the city level.
Table 8. Other robustness tests.
(1)
L n S B M
(2)
L n H q d
(3)
L n H q d
(4)
L n H q d
P o l i c y 0.0350 ***
(0.0102)
0.1285 ***
(0.0194)
0.0467 **
(0.0187)
0.2838 ***
(0.0748)
ControlYESYESYESYES
Pro-FENONOYESYES
City-FeYESYESYESYES
Time-FEYESYESYESYES
(Pro × Time)-FENONONOYES
N4544454445444464
R20.79950.71920.47650.4095
Note: **, and *** indicate significance at 5%, and 1% confidence levels, respectively; values within parentheses represent cluster-robust standard errors.
Table 9. Instrumental variable tests.
(1)(2)(3)(4)
OLS2SLSOLS2SLS
P o l i c y 0.2573 **
(0.1014)
0.2275 ***
(0.0467)
I V 2.0797 ***
(0.3170)
1.3316 ***
(0.1375)
ControlNONOYESYES
Kleibergen-Paap Rk LM 23.703
[p = 0.000]
23.887
[p = 0.000]
Kleibergen-Paap Rk Wald F 80.525
{16.38}
154.510
{16.38}
City-FEYESYESYESYES
Time-FEYESYESYESYES
N4544454445444544
Note: **, and *** indicate significance at 5%, and 1% confidence levels, respectively; Values in [] are p-values and value in {} represents the critical threshold for the Stock–Yogo identification test at a 10% confidence level.
Table 10. Innovation spillover mechanisms.
Innovation EnvironmentInnovation Capacity
I n d e x L n H q d A u t L n H q d
(1)(2)(3)(4)
P o l i c y 1.1565 ***
(0.2839)
2.9779 ***
(0.8722)
P o l i c y × I n d e x 0.0153 ***
(0.0024)
P o l i c y × A u t 0.0023 ***
(0.0003)
ControlYESYESYESYES
Ctiy-FEYESYESYESYES
Time-FEYESYESYESYES
N4544454444804480
R20.67560.72130.88990.7191
Note: *** indicate significance at the 1% confidence levels, respectively; parenthesized values represent clustered standard errors at the city level.
Table 11. Structural optimization mechanisms.
Optimization of Industrial StructureTalent Structure Optimization
I n d L n H q d T h d L n H q d M a g L n H q d R a d L n H q d
(1)(2)(3)(4)(5)(6)(7)(8)
P o l i c y 0.0826 ***
(0.0174)
0.0239 *
(0.0145)
0.0018 ***
(0.0004)
0.0110 ***
(0.0023)
P o l i c y × I n d 0.4168 ***
(0.0492)
P o l i c y × T h d 0.3292 ***
(0.0381)
P o l i c y × M a g 0.9453 ***
(0.1671)
P o l i c y × R a d 0.0643 ***
(0.0083)
ControlYESYESYESYESYESYESYESYES
Ctiy-FEYESYESYESYESYESYESYESYES
Time-FEYESYESYESYESYESYESYESYES
N45444544454445444544454445444544
R20.70700.68070.81680.72350.91340.72000.83030.7222
Note: *, and *** indicate significance at the 10% and 1% confidence levels, respectively; parenthesized values represent clustered standard errors at the city level.
Disclaimer/Publisher’s Note: The statements, opinions and data contained in all publications are solely those of the individual author(s) and contributor(s) and not of MDPI and/or the editor(s). MDPI and/or the editor(s) disclaim responsibility for any injury to people or property resulting from any ideas, methods, instructions or products referred to in the content.

