Article

Integrating System Perspectives to Optimize Ecosystem Service Provision in Urban Ecological Development

1
The Center for Modern Chinese City Studies, Institute of Urban Development, East China Normal University, Shanghai 200062, China
2
State Key Laboratory of Urban and Regional Ecology, Research Center for Eco-Environment Sciences, Chinese Academy of Sciences, Shuangqing Rd. 18, Beijing 100085, China
3
The Digital Engineering Technology Innovation Center for Ecological Governance of Land and Space under the Ministry of Natural Resources, Shanghai Jiao Tong University, 800 Dongchuan Rd., Minhang District, Shanghai 200240, China
*
Author to whom correspondence should be addressed.
Systems 2024, 12(9), 375; https://doi.org/10.3390/systems12090375
Submission received: 1 August 2024 / Revised: 6 September 2024 / Accepted: 13 September 2024 / Published: 17 September 2024

Abstract

:
System-based approaches are critical for addressing the complex and interconnected nature of urban ecological development and restoration of ecosystem services. This study adopts a system perspective to investigate the spatiotemporal drivers of key ecosystem services, including carbon sequestration, water conservation, sediment reduction, pollution mitigation, and stormwater regulation, within the Yangtze River Delta Eco-Green Integrated Development Demonstration Area (YRDDA) from 2000 to 2020. We propose a novel framework for defining enhanced-efficiency ecosystem service management regions (EESMR) to guide targeted restoration. Our analysis revealed the complex interplay of 11, 9, 6, 6, and 10 driving factors for selected ecosystem services, highlighting the spatiotemporal heterogeneity of these drivers. By overlaying these key factors, we identified high-efficiency restoration priority areas for EESMR that ensure high returns on investment and the efficient restoration of ecosystem functions. This system-oriented approach provided critical spatial guidance for integrated ecological restoration, green development, and eco-planning. These findings offer valuable insights for policymakers and planners in the Yangtze River Delta and other rapidly urbanizing regions, supporting the formulation of effective land-use policies that balance environmental sustainability and urban growth.

1. Introduction

Ecosystem services (ESs) are defined as the direct and indirect benefits that humans derive from natural ecosystems, including provision, regulation, cultural, and supporting services [1,2]. ESs provide essential resources that contribute to human well-being, maintain ecological balance, and mitigate environmental hazards [3,4]. However, as globalization and urbanization accelerate, ES are increasingly stressed, particularly in urbanizing areas where ecological vulnerability and population density converge.
The structure and function of the global ecosystem have been damaged to varying degrees by the backdrop of population explosion [5], rapid urbanization [6], climate warming [7,8], and many other factors. ES degradation is becoming a significant barrier to sustainable socio-economic development [9,10,11]. Extensive research has shown that ESs are influenced by a combination of physical processes and human activities [12,13]. Physical driving factors, such as climate parameters (precipitation and temperature) and forest cover, play a crucial role in constructing ES supply aspects through energy flows and material cycles [14]. For instance, climate change can directly alter precipitation and temperature, leading to a decrease in water and food supply [11,15,16,17]. Additionally, climate-induced changes in biodiversity can affect ecosystem functions [7,18,19,20]. Furthermore, the proportion of forest cover in the land-use type is a crucial natural feature, as forests with their complex internal environments and biological activities are the largest source of ES supply on Earth [21]. On the other hand, human activities, particularly urbanization, significantly impact ES by altering land-use patterns and reducing natural habitats [22,23]. For instance, the expansion of industrial and urban areas often results in the destruction of forests [24] and wetlands [25], subsequently impairing natural functions such as matter cycling, energy flow, and biodiversity maintenance [26]. Furthermore, frequent infrastructure projects disrupt the continuity of natural landscapes [27,28], undermining ecological connectivity [29,30] and thereby reducing the spatial and functional efficacy of ecosystem services [31,32]. These changes indicate that urbanization not only alters land use patterns but also has profound effects on the supply and functionality of ecosystem services.
Despite the profound impacts of urbanization on ecosystem services (ESs), it is remarkable that they retain their crucial roles in urban ecosystems. Despite the challenges posed by human activities, ESs continue to play an indispensable role in regulating microclimates [33,34], supplying clean air and water [35,36], and mitigating the impact of natural disasters [37,38]. With the support of these services, urbanized areas can better adapt to climate change, enhance residents’ quality of life, and promote sustainable economic and social development [39]. Therefore, policymakers and researchers should consider ways to effectively enhance ecosystem services in urban areas to meet the demands mentioned above. Many researchers have conducted supply and demand assessments of ecosystem services at specific scales and identified deficit areas, proposed targeted natural space enhancement projects [40,41,42]; in addition, there are many articles on trade-offs and synergies between different ecosystem services [43,44,45], providing a scientific basis for the synergistic enhancement of multiple ecosystem services. Nevertheless, the effective and efficient assessment and optimization of ES face numerous challenges [46]. Current approaches to ecological restoration and protection often lack precise methods for evaluating ES and systematic considerations for prioritization and efficiency [47,48]. Regarding assessment methods, although the method based on the coefficient of value of ecosystem types does not require much data, the accuracy of the assessment results is not high and does not consider ecosystem quality. The biophysical process method based on localized parameters has a high degree of accuracy in assessment and analysis and can reflect local ecosystem characteristics; however, it is more demanding in terms of data acquisition. In the field of ecological restoration, the focus has been on identifying ‘low-value areas’, ‘vulnerable areas’, etc., based on the current state of assessments, but there has been a lack of consideration for ‘efficiency’. We should recognize that the formation of ‘low-value areas’ and ‘vulnerable areas’ in ecosystem services is the result of a complex interplay of multiple factors. Not all ‘low-value’ and ‘sensitive’ regions can achieve the anticipated ecological benefits through ecological restoration efforts. These shortcomings hinder the effectiveness and efficiency of ecological restoration efforts and subsequently affect the quality of ES.
The Yangtze River Delta Eco-Green Integrated Development Demonstration Area (YRDDA) is a rapidly urbanizing region in the Yangtze River Delta that represents a critical interface between natural ecosystems and urban infrastructure. This area is characterized by a complex interplay between diverse ecosystem services. This study aims to address the complex and interconnected nature of urban ecological development and restore ecosystem services (ESs) through a system-based approach. Based on the system perspective, we investigated the spatiotemporal drivers of key ESs, including carbon sequestration, water conservation, sediment reduction, pollution mitigation, and stormwater regulation, within the YRDDA from 2000 to 2020. The research objectives include (1) quantifying the physical and value-based aspects of these ESs, (2) identifying and optimizing the key drivers of ES provision, and (3) developing and promoting effective and efficient ES assessment and restoration strategies.

2. Materials and Methods
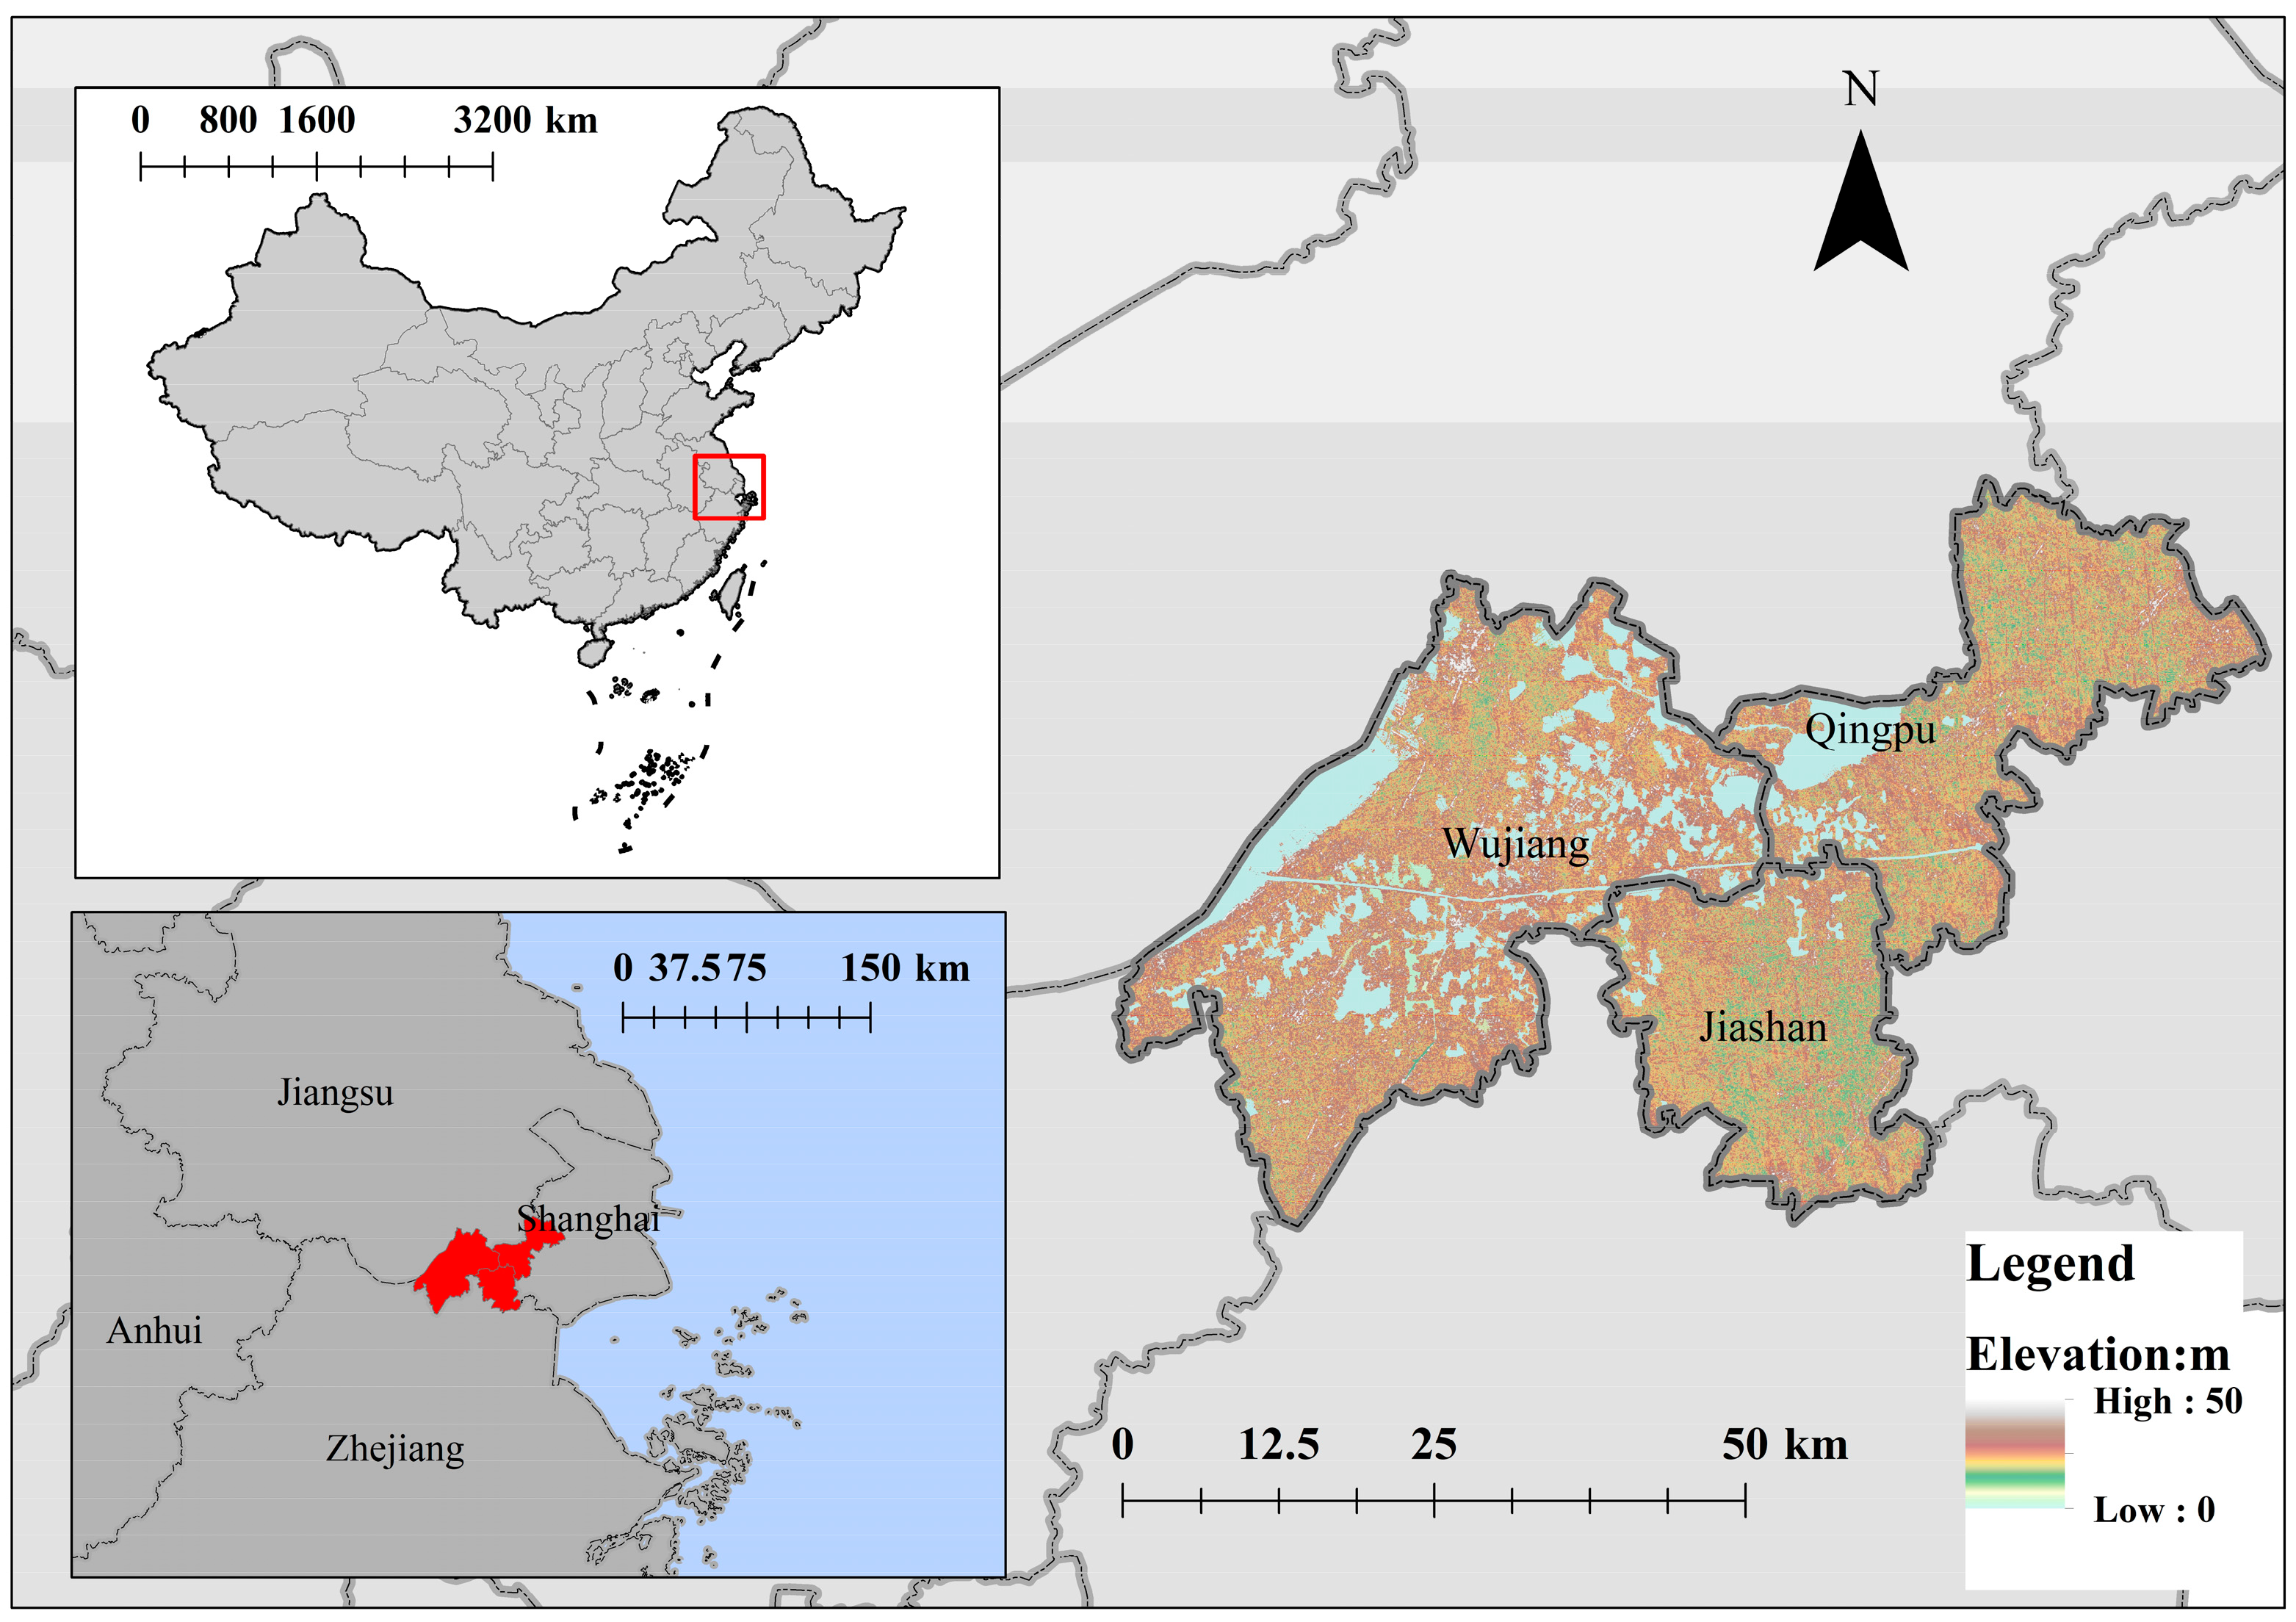
2.1. Study Area

To create an eco-friendly integrated development example, the Chinese government established the Yangtze River Delta Eco-Green Integration Demonstration Area (YRDDA) in November 2018, covering more than 2400 km2 [49]. Located in one of China’s most economically vibrant regions, the Yangtze River Delta, the YRDDA spans three provinces—Jiangsu, Zhejiang, and Shanghai—and includes Wujiang District, Qingpu District, and Jiashan County (Figure 1). The entire Yangtze River Delta region currently faces trade-offs between economic development and ecological protection. Within the YRDDA, rapid development has posed serious challenges to the quality of the ecological environment, with issues such as vegetation degradation, soil compaction, fragmentation of green spaces [50], water pollution [49], soil contamination, and air pollution [51], severely constraining the economic sustainability of the region and threatening the health and safety of local residents.
At the regional positioning level, the YRDDA focuses on ‘One River, Three Lakes’ (Taipu River, Dianshan Lake, Yuandang Lake, and Fen Lake), aiming to establish three new pillars: ‘ecological value’, ‘green innovation and development’, and ‘sustainable green living’. Comprehensive environmental management initiatives are being implemented to create beautiful and harmonious ecological spaces. However, because the YRDDA consists of three separate administrative districts belonging to different provincial administrative units, ecological issues and restoration strategies within the YRDDA have become complex and multifaceted, rendering systematic traceability and management challenging. Given the complex and multifaceted nature of ecological issues and restoration strategies within the YRDDA, there is an urgent need for a systematic assessment of long-term trends in ecosystem services (ES) in the region. This study aimed to identify the main drivers of ES, delineate effective and efficient areas for ES enhancement, and provide spatial guidance for current or future ecological restoration or enhancement projects within the YRDDA.

2.2. Data Collection

In this study, multi-source remote sensing data combined with meteorological monitoring data and socioeconomic development data were used to conduct research on ES assessment and driving force. A detailed description of the data used in the ES assessment process is presented in Table 1. To reduce the impact of inter-annual fluctuations in rainfall on the results of ES assessment, increase the comparability of inter-annual assessment results, and make them more responsive to actual changes in ecosystem quality and quantity, this study conducted a multi-year ES assessment using the 2020 rainfall conditions within the YRDDA as comparable rainfall conditions [52,53].
In the process of selecting driving factors, we have comprehensively considered the ‘generation mechanisms’ and ‘disturbance mechanisms’ of ESs, which correspond to the two broad categories of ‘natural factors’ and ‘socioeconomic factors’, respectively [54]. ‘Natural factors’ such as ecosystem type, vegetation quality, precipitation, and topography are key elements in ES production [54]. These factors have different impacts and spatial distribution patterns and interact to create a spatially differentiated ES provisioning capacity. Meanwhile, ‘socioeconomic factors’ such as population and GDP can disturb ESs within certain limits [55]. Infrastructure construction in the context of socioeconomic development has caused varying degrees of damage to ecosystem diversity, authenticity, connectivity, and other aspects of ecosystems, seriously reducing the capacity of ecosystems to provide ESs [56]. Therefore, in the research process on the drivers of various ESs, the study thoroughly considered the potential driving factors mentioned in the existing literature [57,58,59], incorporating eighteen types of potential drivers (Table 2).
These include ecosystem type, topography, climate, habitat quality, soil properties, and socioeconomic factors (Table 2): DEM, slope, precipitation, relative air humidity, annual average temperature, evapotranspiration, NDVI, NPP, clay content, sand content, silt content, organic matter content, GDP/m2, distance to water bodies, distance to railways, distance to major highways, population density, and ecosystem type. Nine factors, including ecosystem type, DEM, NDVI, NPP, slope, sticky particle content, powder particle content, organic matter content, and sand particle content (Table 2), were classified as habitat factors, which constitute the fundamental characteristics of the ecosystem and form the critical basis for the generation of ESs [54]. Two factors, GDP/m2 and population density, were categorized as socioeconomic factors [55]. Human activities and economic development were not only disturbance factors for the spatiotemporal variations of ESs but also the primary beneficiaries of such services [55]. Four meteorological factors, including precipitation, average annual air humidity, average annual temperature, and evapotranspiration, were considered [60]. These meteorological factors often exhibit significant spatial heterogeneity, which has a substantial impact on the spatial distribution patterns of ESs such as water supply and flood regulation [4,61]. Furthermore, three factors, namely, distance from the water system, distance from railways, and distance from major roads, were classified as transportation factors [62,63]. The large-scale construction of transportation infrastructure not only causes the degradation of ecological spaces but also leads to the fragmentation and disruption of ecosystems, which severely affects the supply and scale benefits of ESs [62,63].

2.3. Ecosystem Service Evaluation and Valuation

Five typical ecosystem services were assessed using the following quantitative methods [64,65], based on local parameters [66]:
Ecosystems conserve water through their structure and processes by intercepting precipitation, enhancing soil infiltration, retaining soil moisture, replenishing groundwater, and regulating river flow, thereby increasing available water resources. The equation for water conservation (WC) is as follows:
Q w c = i = 1 i = n   ( P i R i E T i ) × 0.001 × S g r i d
V w c =   Q w c ×   ( P o c + P c c × D R )
where Q w c represents the physical quantity of water conservation service (m3/a); V w c represents the monetary value of water conservation service (CNY/a); P i represents precipitation in grid i (mm/a); R i represents runoff in grid i (mm/a); E T i represents evapotranspiration in grid i , including evaporation from water surfaces, soil, snow, and ice and transpiration from plants (mm/a); i represents grid number, i = 1, 2, 3, …, n ; S g r i d represents the area of each grid (m2); P o c represents the annual operational cost per unit volume of the reservoir (CNY/(m3·year)); P c c represents the construction cost per unit volume of the reservoir (CNY/m3); D R represents the annual depreciation rate of the reservoir.
Stormwater runoff regulation (SRR) refers to the role of ecosystems, through vegetation and water bodies, in regulating stormwater runoff, reducing flood peaks, and mitigating flood hazards. The formula is as follows:
Q s r r = i = 1 i = n   ( P s i R s i ) × 0.001 × S g r i d
V s r r = C f m ×   ( P o c + P c c × D R )
where Q s r r represents the physical quantity of stormwater runoff regulation services (m3/year); V s r r represents the monetary value of stormwater runoff regulation services (CNY/year); P s i represents rainfall during storms in grid i (mm/year); R s i represents stormwater runoff in grid i (mm/year); i represents grid number, i = 1, 2, 3, …, n ; S g r i d represents the area of each grid (m2); P o c represents the annual operational cost per unit volume of the reservoir (CNY/(m3·year)); P c c represents the construction cost per unit volume of the reservoir (CNY/m3); D R represents the annual depreciation rate of the reservoir.
Ecosystems sequester carbon by absorbing carbon dioxide through organic matter synthesis in organisms and dissolving it in water bodies, thereby reducing its atmospheric concentration. The formula for carbon sequestration (CDS) is as follows:
Q c d s = Q V c d s + Q W c d s
Q V c d s = i = 1 i = n   ( M C O 2 / M C × N E P i ) × 0.0001 × S g r i d
N E P i = α × N P P i
Q W c d s = S w e t × V w e t
V c d s = Q c d s × C C O 2
where Q c d s represents the physical quantity of carbon sequestration service (t· C O 2 /a); V c d s represents the monetary value of carbon sequestration services (CNY/year); Q V c d s represents the physical quantity of carbon sequestration service by vegetation ecosystems (t· C O 2 /a); Q W c d s represents the physical quantity of carbon sequestration service by wetland ecosystems (t· C O 2 /a); M C O 2 / M C represents the conversion coefficient of C to C O 2 ; N E P i represents net ecosystem productivity in grid i (t· C /ha/a); α represents conversion coefficient between N E P and N P P ; N P P i represents net primary productivity in grid i (t· C /ha/a); S w e t represents the area of wetland ecosystems (km2); V w e t represents the fixed carbon dioxide rate of wetland ecosystems (t· C O 2 /km2/a); i represents grid number, i = 1, 2, 3, …, n ; S g r i d represents the area of each grid (m2); C C O 2 represents the price of CO2 (CNY/t), adopting the average trading price of carbon dioxide emission rights of major cities in the Yangtze River Delta region in 2020.
Ecosystems reduce sedimentation by protecting soil through their structure and processes, reducing rainwater erosion, and minimizing soil loss and sediment blocking in river channels. In this study, soil retention was calculated using a modified universal soil loss equation [67,68], and the sediment accumulation coefficient and soil bulk density were used to calculate the final amount of reduced sedimentation. Reducing non-point source pollution refers to the ecosystem’s soil retention function, thereby decreasing the transport of soil-borne nutrients such as nitrogen and phosphorus into downstream aquatic environments, including rivers, lakes, and reservoirs. The formulas for the reduction of sedimentation (RS) and the reduction of non-point source pollution (RNSP) are as follows:
Q r s = λ × Q s r / ρ
Q s r = i = 1 i = n R i × K i × L i × S i × 1 C i × 0.0001 × S g r i d
Q r n s p = i = 1 i = n R i × K i × L i × S i × 1 C i × β i j × 0.0001 × S g r i d
V r s = Q r s × c
V r n s p = j = 1 m Q r n s p × p j
where Q r s represents the physical quantity of reduced sedimentation service (m3/a); Q s r represents soil retention amount (t/a); V r s represents the monetary value of reduced sedimentation service (CNY/year); Q r n s p represents the physical quantity of reduced non-point source pollution service (t/a); V r n s p represents the monetary value of the reduction of non-point source pollution (CNY/year); λ represents sediment accumulation coefficient, dimensionless; ρ represents soil bulk density (t/m3); R i represents the rainfall erosivity factor in grid i, indicating the potential for rainfall-induced soil erosion, quantified by the long-term mean annual rainfall erosivity index (MJ·mm/(hm2·h·a)); K i represents the soil erodibility factor in grid i, which reflects the ease of soil particle disintegration and transport by water, and this factor primarily depends on soil texture, organic matter content, soil structure, and permeability, typically expressed in terms of soil loss per unit of rainfall erosivity on a standard plot (t·hm2·h/(hm2·MJ·mm)); L i is the slope length factor in grid i, indicating the impact of slope length on soil erosion, dimensionless; S i is the slope steepness factor in grid i, reflecting the influence of slope gradient on soil erosion, dimensionless; C i is the vegetation cover factor in grid i, depicting the ecosystem’s impact on soil erosion, which varies with the type of ecosystem and the extent of vegetation cover, dimensionless; β i j represents the pure content of soil nutrient j in grid i (%); i represents grid number, i = 1, 2, 3, …, n ; S g r i d represents the area of each grid (m2); j represents the type of pollutant, j = 1, 2, 3, …, m ; p j represents the pricing of category j pollutants (CNY/t); c represents sediment removal costs (CNY/t).

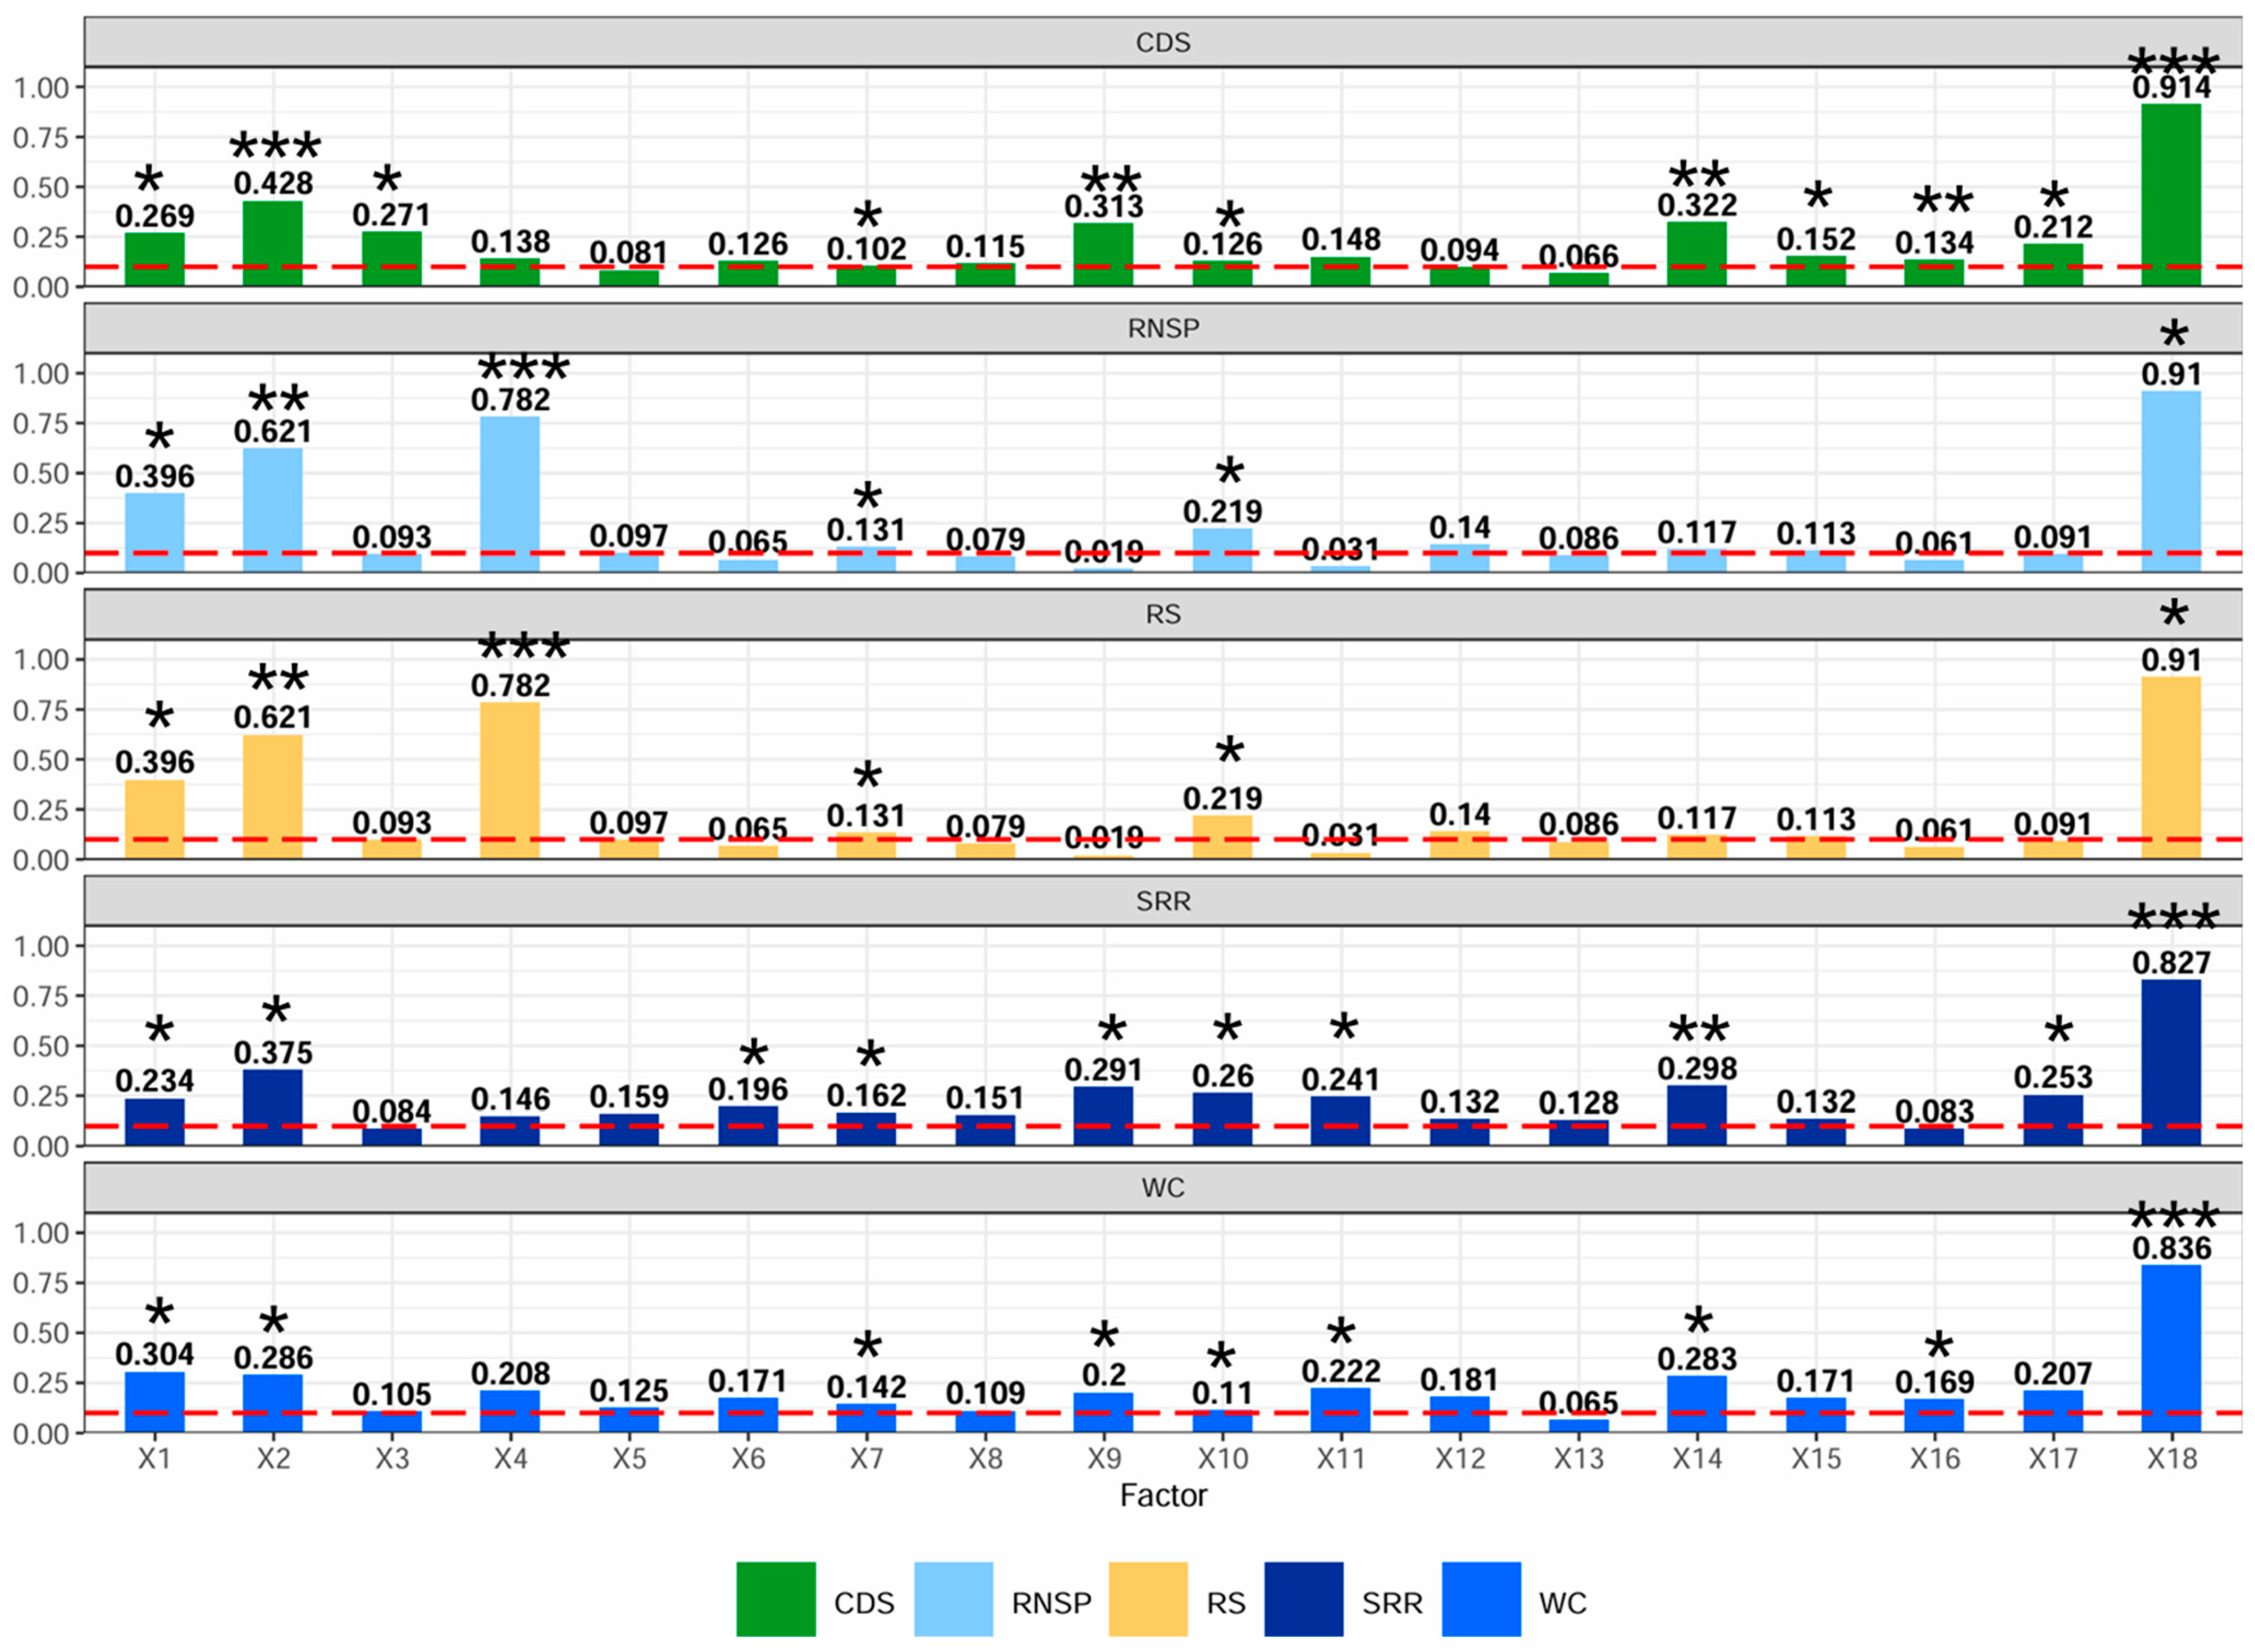
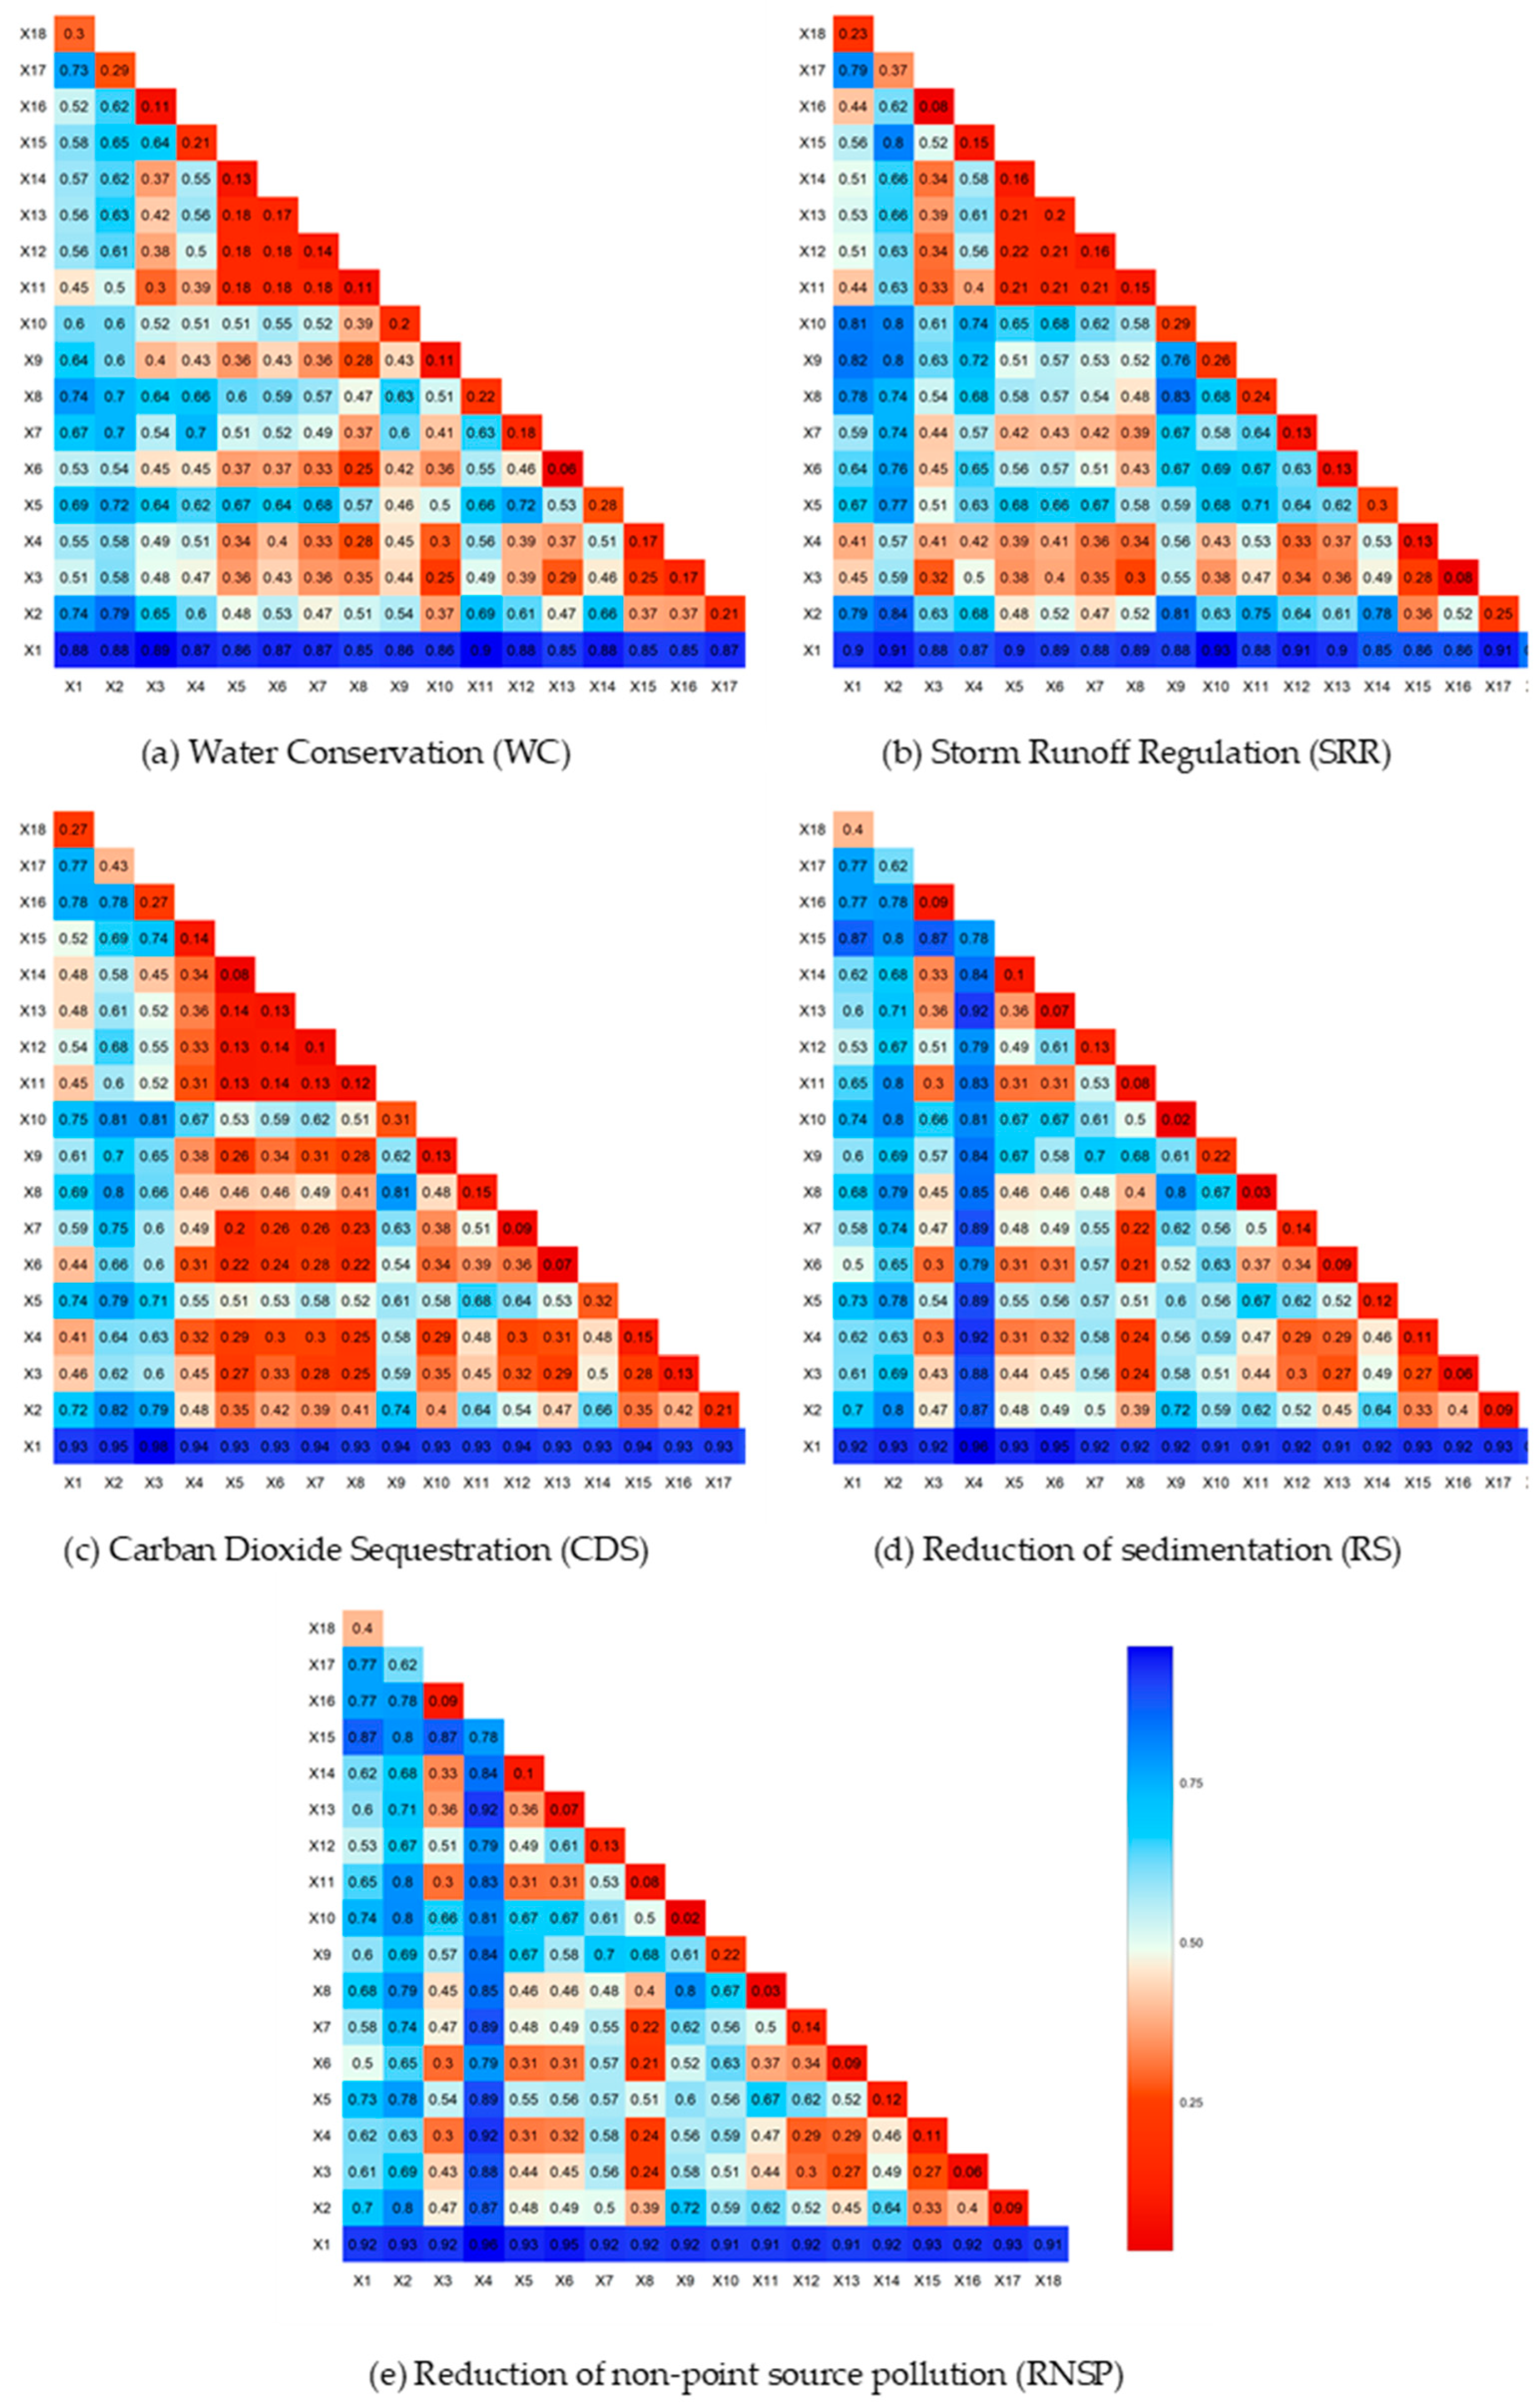
2.4. Driver Analysis

Drivers are a set of variables that affect the quantity and quality of ecosystem services at a given time and place. Geodetectors are a set of statistical methods used to detect spatial heterogeneity and reveal the underlying drivers [69], and they are applicable across a wide range of fields, from natural to social sciences [70,71]. They can be applied at scales as large as nations or as small as individual towns. Their core concept is based on the hypothesis that if an independent variable significantly influences a dependent variable, the spatial distributions of the independent and dependent variables should exhibit similarity [72].
The spatial heterogeneity of ESs is not only directly affected by the quality and quantity of local ecological assets, but also by objective natural conditions, such as local climate, topography, and soil properties [39,73]. Based on the synthesis of previous studies, e.g., [74,75,76], this study analyzed 18 drivers (Table 2). Two detectors, a factor detector, and an interaction detector in the Geodetector were used to reveal the explanatory power of each driver on the spatial divergence of each type of ES and the change characteristics of the explanatory power of each type of ES after the interaction of different drivers compared with the explanatory power of a single driver.

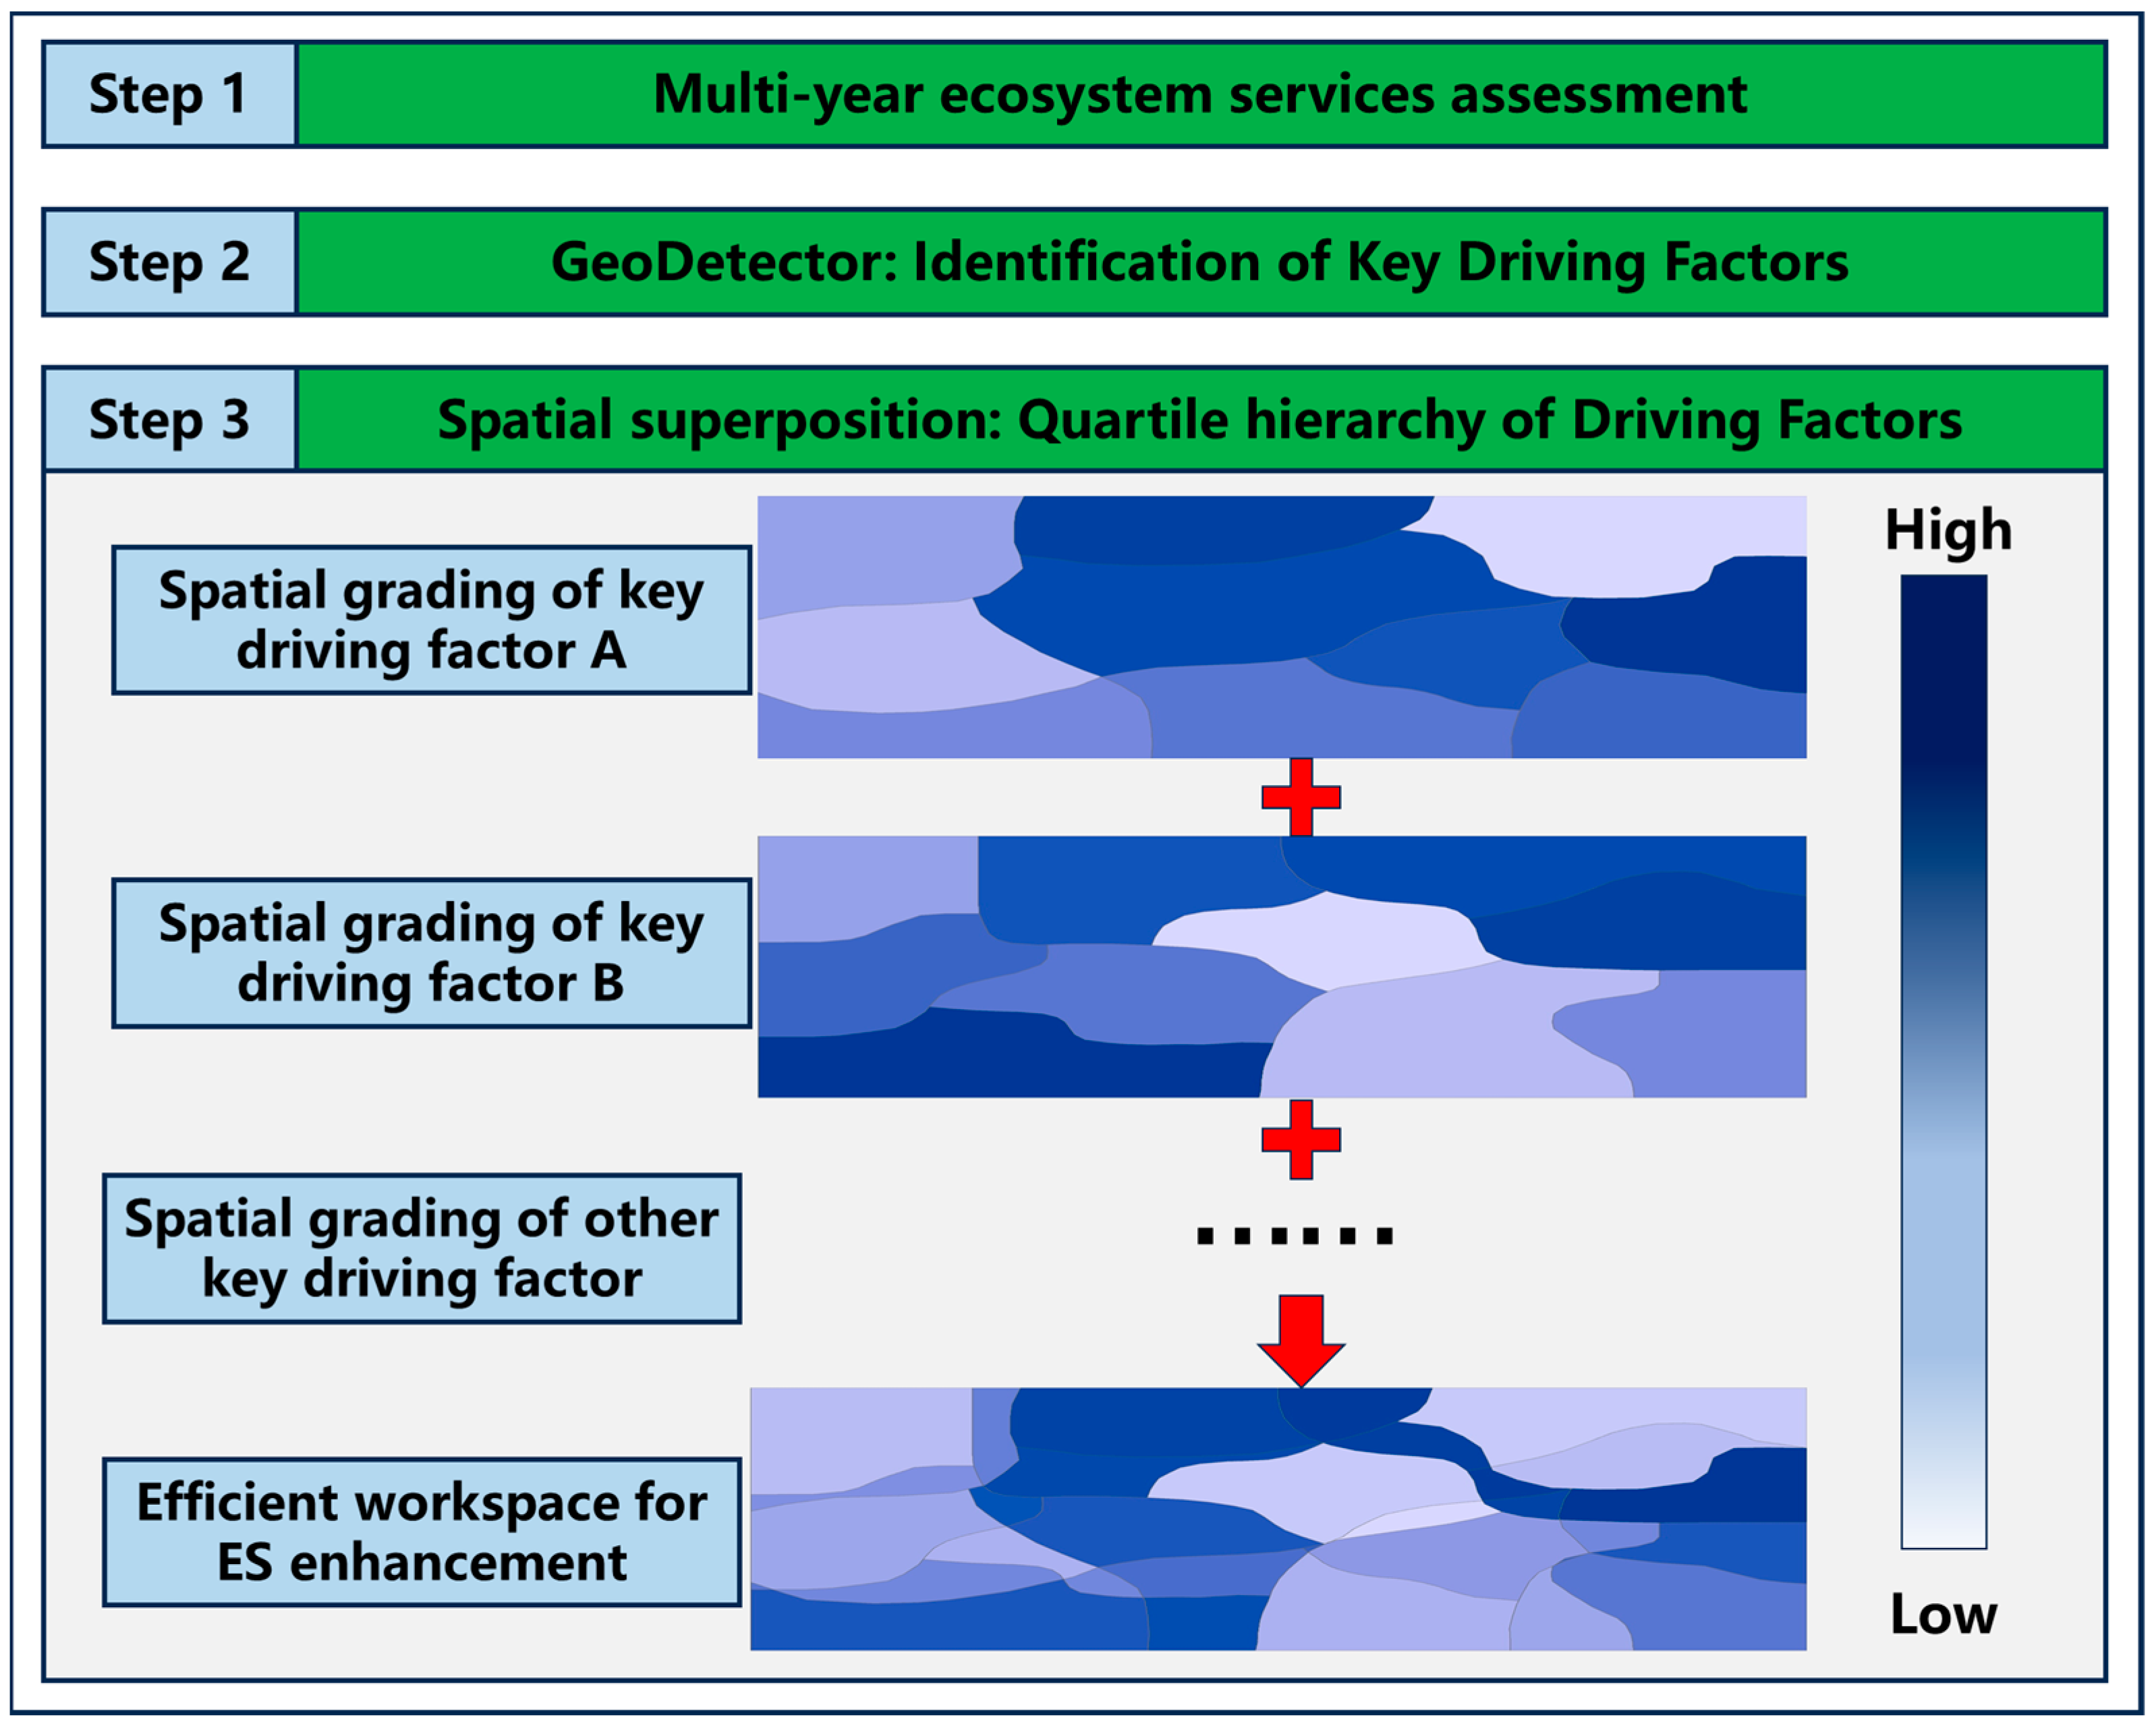
2.5. Identification and Delineation of Enhanced-Efficiency Ecosystem Service Management Region

The planning and implementation of ecological restoration projects aimed at enhancing ecosystem services (ESs) requires systematic identification and prioritization of high-efficiency areas for intervention. Therefore, we introduced the concept of an enhanced-efficiency ecosystem service management region (EESMR). We define EESMR as a space where the efficiency of ecosystem service enhancement in ecological restoration work is higher than that of the surrounding areas. Policymakers working on ecological restoration within the EESMR can achieve more significant and efficient ecosystem service enhancements with the same financial and human resource investments.
The key principle behind EESMR is that if a factor has a significant driving effect on the supply and spatial differentiation of a certain type of ES, then adjusting this driver through human intervention can greatly change the supply and spatial distribution characteristics of this ES. Similarly, when multiple key factors jointly drive a certain type of ES, adjusting another driver in the area where the influence of one driver is higher can have a more pronounced impact on the change in ES than in other areas.
As illustrated in Figure 2, the darker the color of drivers A and B, the higher the ability of the region to influence the spatial differentiation of the ES. The darker the area when the two factors are superimposed, the more significant the impact of adjusting the driver in that area on enhancing ES.
Therefore, based on a systematic analysis and identification of the key drivers of each ES and their interactions, this study proposes a methodology to spatially grade and superimpose the strength of each driver strongly related to the spatial differentiation of each ES. The resulting spatial distribution map of the high-efficiency priority of the EESMRs for each ES can then guide the prioritization of ecological restoration efforts, with the areas of higher value being prioritized to achieve greater enhancement of ES.

3. Results

3.1. Spatiotemporal Heterogeneity of Ecosystem Services

3.1.1. Water Conservation

In 2000, ecosystems retained 2.55 billion cubic meters of precipitation, which held an economic value of approximately 66,124.78 million yuan, effectively replenishing local groundwater resources. However, by 2020, groundwater retention had decreased by 15.69% to 2.15 billion cubic meters, and its economic value had dropped to 55,550.39 million yuan. From 2000 to 2020, water conservation services showed a decreasing trend, with the largest decline of 6.15% occurring between 2005 and 2010 (Figure S1). Owing to the efficient water storage capacity of wetland ecosystems, the western region near Taihu Lake and the northern area around Dianshan Lake in the demonstration area had a higher intensity of water conservation service supply. The entire northern region, with its dense network of water bodies and rivers (Figure S1), is a major area for water resource conservation. In contrast, the southern region, which has a higher proportion of farmland ecosystems, exhibits insufficient water conservation capacity, particularly in the southeastern area, where the intensity of water conservation service supply is relatively low. From 2000 to 2020, influenced by the expansion of artificial surfaces, areas that previously provided high-intensity services underwent severe degradation (Figure S1). The degraded areas are primarily located in densely populated regions such as the northeastern part of Qingpu District, the southern part of Jiashan County, and the northern and southern parts of Wujiang District.

3.1.2. Stormwater Runoff Regulation

In the year 2000, vegetation and wetlands in the demonstration area mitigated urban flood risks by reducing stormwater runoff and enhancing infiltration, collectively retaining about 0.48 billion cubic meters of stormwater, thereby ensuring the safety of agricultural production. The estimated economic value of this service was approximately 12,396.37 million yuan. By 2020, the stormwater retention decreased to 0.40 billion cubic meters, a reduction of about 16.67%, with an economic value of approximately 10,459.70 million yuan. Over the past 20 years, stormwater runoff regulation has gradually declined (Figure S2), with the greatest reduction of 6.13%, similar to the water conservation services that occurred between 2005 and 2010. Areas with a high supply intensity of stormwater runoff regulation services were primarily located in the northern and northeastern parts of the demonstration area, particularly around the Dianshan Lake area, whereas other regions, particularly the southern area, had lower service supply intensities (Figure S2). Several factors contributed to the spatial variability of stormwater runoff regulation services within the demonstration area, mainly influenced by the geographic distribution of heavy rainfall, which was concentrated in the northern and northeastern regions. These areas have a dense network of rivers, and ecosystems possess a greater capacity to mitigate extreme runoff events. Moreover, the Dianshan Lake area in the northeast has the strongest stormwater retention capacity. Similar to the water conservation service, from 2000 to 2020, areas that previously had high intensities of stormwater runoff regulation services experienced a significant decline (Figure S2), and these declines were also concentrated in the northeastern part of Qingpu District, the southern part of Jiashan County, and both the northern and southern parts of Wujiang District. The stormwater runoff regulation service directly safeguards the overall ecological safety of the city, and the accelerated degradation of this service supply capacity might increase local residents’ risk of facing urban flooding.

3.1.3. Carbon Dioxide Sequestration

In the year 2000, ecosystems within the region sequestered approximately 0.69 million tons of carbon dioxide through photosynthesis by vegetation and absorption by terrestrial water bodies, attributing an economic value of 16.37 million yuan and contributing to the reduction of regional heat risks. By 2020, carbon sequestration decreased to 0.52 million tons, a decline of 24.64%, with an economic value of 12.33 million yuan. Influenced by overall vegetation degradation and the expansion of artificial surfaces, carbon fixation showed a downward trend from 2000 to 2020, with the largest decline of 11.31% occurring between 2005 and 2010 (Figure S3). Areas with high intensity of carbon fixation services were concentrated around Taihu Lake, Dianshan Lake, and the densely river-networked region between the two lakes (Figure S3). The wetlands within the demonstration area exhibited a significantly higher carbon sequestration capacity than other ecosystems, benefiting from both water absorption and biological transformation. Given the widespread distribution of farmland, particularly in the southern and northeastern parts of the area, the carbon sequestration capability of ecosystems other than wetlands lacked spatial heterogeneity. From 2000 to 2020, due to the annual conversion of large areas of farmland into artificial surfaces, the carbon sequestration services of farmland in the northeastern part of Qingpu District, the southern part of Jiashan County, and both the northern and southern parts of Wujiang District continually declined in spatial terms (Figure S3). Although the carbon sequestration service of wetland ecosystems expanded slightly spatially from 2000 to 2015, it faced a severe decline from 2015 to 2020. The diminishing capacity for carbon fixation not only impacts local climate regulation but also affects regional ecological stability, highlighting the critical need to protect and restore these valuable ecosystems.

3.1.4. Reduction of Sedimentation

In 2000, vegetation in the entire demonstration area retained rainwater, thereby preventing approximately 2.66 million cubic meters of sediment from entering river channels and forming deposits, with an estimated economic value of 70.00 million yuan. By 2020, the volume of prevented sediment deposition decreased to 2.58 million cubic meters, a reduction of approximately 3.01%, and the economic value dropped to 67.65 million yuan. However, over the 20-year period from 2000 to 2020, the trend initially declined, then increased between 2005 and 2015 with an average growth rate of 1.12%, and significantly decreased again by approximately 3.50% from 2015 to 2020 (Figure S4). Owing to the relatively flat terrain and small differences in elevation within the demonstration area, the overall spatial variability of the sediment deposition reduction service was insignificant. Areas with a higher service provision capacity are typically located in regions with some elevation differences, such as roadsides, lake embankments, farmlands, and ridges. Moreover, from 2000 to 2020, there was no significant spatial variation in the intensity of the sediment deposition reduction service (Figure S4). This indicates that, although the overall capacity to prevent sediment deposition has been relatively stable, specific areas susceptible to erosion and sediment issues might still benefit from targeted conservation and management strategies to maintain or enhance this vital ecosystem service.

3.1.5. Reduction of Non-Point Source Pollution

In the year 2000, the ecosystems within the demonstration area collectively reduced 19,144.60 tons of total nitrogen and 6148.19 tons of total phosphorus from forming non-point source pollution, with their total economic values estimated at 183.27 million yuan and 61.48 million yuan, respectively, effectively ensuring the safety of agricultural product production. By 2020, the reduction in total nitrogen and total phosphorus fell to 18,501.67 tons and 5941.71 tons, respectively, a decrease of approximately 3.36%, with total economic values of 177.12 million yuan and 59.42 million yuan. Similar to the service of reducing sediment deposition, the service of reducing non-point source pollution displayed an overall trend of initial decline, followed by an increase from 2005 to 2015 with an average growth rate of 1.12%, and a significant decrease from 2015 to 2020, approximately 3.50% (Figures S5 and S6). Given the relatively flat terrain and minor differences in elevation within the demonstration area, the spatial variability in the intensity of the service to reduce non-point source pollution is generally small. Areas with a higher service provision capacity are typically located in regions with elevation differences, such as roadsides, lake embankments, farmlands, and ridges. Moreover, from 2000 to 2020, there was no significant spatial variation in the intensity of the services to reduce non-point source pollution (Figures S5 and S6). This suggests that while the overall capacity to mitigate non-point source pollution has been relatively stable, specific measures and targeted conservation strategies might still be necessary to maintain or enhance this vital ecosystem service to safeguard environmental quality and public health.

3.2. Identifying Suitable Cropland Landscape Patches for Priority Conservation

The results showed that the top five factors with high explanatory power for the spatial differentiation of WC were ecosystem type, DEM, NDVI, population density, and distance from the water system.
In addition, GDP/m2, average annual temperature, organic matter content, and precipitation also had strong explanatory power for the spatial variance of water conservation services. The other factors were less influential (Figure 3 and Table S1). Regarding the spatial distribution of SRR, the principal factors were ecosystem type, NDVI, population density, GDP/m2, and precipitation. Factors such as evaporation, proximity to water systems, DEM, silt content, and organic matter content also played significant roles, whereas other factors exerted minor effects (Figure 3 and Table S1). For the spatial distribution of the CDS, the leading factors included ecosystem type, NDVI, population density, GDP/m2, and NPP. Additional influential factors were DEM, evaporation, air relative humidity, annual mean temperature, precipitation, and organic matter content, whereas other factors exerted minor effects (Figure 3 and Table S1).
RS and RNSP were calculated based on the same model; therefore, the geodetector results were the same. The top five factors with high explanatory power for the spatial distribution of both services were ecosystem type, Slope, NDVI, DEM, and precipitation, in addition to organic matter content, which also had high explanatory power for the services.
The results of the interaction detection factors showed that for all five types of ES, the q-value of the interaction of the influencing factors was higher than that of the single-factor effect, indicating that the explanatory power of the interaction between any two factors on the spatial differentiation of services was significantly enhanced compared with that of the single factor. All factor interactions showed two types of relationship: two-factor enhancement and nonlinear enhancement. Among all the interactions, the interaction between ecosystem type and other factors had the strongest influence, reflecting that changes in land use attributes would greatly affect the fluctuation of spatial differentiation of ES in the context of most driving forces (Figure 4).
For WC (Figure 4a), DEM, NDVI, and population density generally had strong interaction effects with other factors. For SRR and CDS (Figure 4b,c), NDVI, land mean GDP, and population density generally had strong interaction effects with other factors. For RS and RNSP (Figure 4d,e), Slope, NDVI, DEM, and precipitation generally had a greater influence on the interaction with other factors. This phenomenon further illustrates the strong explanatory power of these factors in explaining the spatial differentiation of the corresponding ES within the YRDDA.

3.3. Enhanced-Efficiency Ecosystem Service Management Region Identification and Delineation

When identifying EESMRs for WC, the effects of eight key drivers (DEM, NDVI, organic matter content, GDP/m2, precipitation, distance from the water system, population density, and average annual temperature) were considered in the spatial overlay analysis. This analysis revealed that areas with strong interactions between the main drivers of WC were mainly in Wujiang District within the YRDDA, followed by Jiashan County, with the lowest interaction in Qingpu District. In particular, a large area in the south and a small area in the north of Wujiang District had many high-priority plots for ecological restoration work oriented toward the enhancement of WC, whereas in Jiashan County, the EESMR for water conservation services was centrally located in the southern urban area, with sporadic distributions in the scenic area of the town and its surroundings (Figure 5a).
To identify EESMRs for SRR, the effects of nine key drivers (DEM, NDVI, sand content, organic matter content, GDP/m2, precipitation, distance from the water system, population density, and evapotranspiration) were combined for spatial overlay analysis. The area with stronger interactions among the main drivers was still located in Wujiang District. Jiashan County and Qingpu Districts are similar in extent. The EESMRs with higher priority in Wujiang District are distributed from north to south, and the red areas can be prioritized as areas to be considered in the practice of carrying out special ecological restoration work oriented toward the enhancement of SRR. Unlike WC, in Qingpu District, there are large high-priority EESMRs around Dianshan Lake in the west, the Taipu River in the south, and a large area in the northeast, which can also be used as ecological restoration high-efficiency priority plots. The high-priority EESMRs within Jiashan County are mainly located around Fen Lake in the north and in the area around the scenic area of Xitang Ancient Town (Figure 5b).
When identifying EESMRs for CDS, the effects of 10 key drivers (DEM, NDVI, NPP, organic matter content, GDP/m2, precipitation, population density, relative air humidity, average annual temperature, and evapotranspiration) were considered for spatial overlay analysis. The interaction of the main drivers was stronger in the southern part of Wujiang District and more moderate in other regions. In carrying out project work oriented toward CDS enhancement, the southern part of Wujiang District remains the area with a high concentration of high-priority parcels, while parcels in other regions are more dispersed. In Qingpu District, a large number of high-priority EESMRs are located in the southern and northeastern regions and parts of the northwestern region around Dianshan Lake. In Jiashan County, the higher-priority EESMRs are concentrated in the southern part of the administrative district as well as in the northern part of the county in a large area around the ancient town of Xitang (Figure 5c).
To identify the EESMRs for RS and RNSP enhancement, the effects of five key drivers (DEM, NDVI, slope, organic matter content, and precipitation) were integrated into the spatial overlay analysis. The interactions of each key driver were stronger in the entire area of Jiashan County and Wujiang District within the YRDDA and weaker in Qingpu District. When carrying out ecological restoration projects oriented toward the enhancement of sedimentation reduction and surface pollution reduction services in the YRDDA, work should focus on Jiashan County and Wujiang District. The high-priority EESMRs were concentrated in the south-central region of Wujiang District and the southern region of Jiashan County and scattered in the central region of Jiashan County (Figure 5d).
Figure 5 clarifies the spatial prioritization of ecological restoration project practices under the ES enhancement objective, especially the red area in the figure, which is recommended to be considered first when carrying out the spatial selection of special projects oriented to the enhancement of various ESs. In addition, the key human-controllable drivers of each ES are factors that should be prioritized in the ecological restoration process, such as the quality of vegetation, soil structure, and ecosystem type. Within high-efficiency workspaces with high priority, comprehensive bare-land re-greening projects can be carried out to increase the quantity of ecological assets, especially in the YRDDA, where a large area of farmland slopes and ridge spaces have a high potential for greening space. It is also possible to carry out low-quality forest renovation projects to improve the quality of ecological assets; accurately identify high-efficiency workspaces to improve forest quality; scientifically utilize native tree species to accurately improve forest quality; carry out forest conservation; repair and renovate degraded forests and low-quality forests; and improve the quality of forest ecosystems.

4. Discussion

4.1. Urbanization and Ecosystem Service Degradation

As a core driver of economic development in China, the Yangtze River Delta region, primarily comprising Jiangsu, Zhejiang, and Shanghai, has undergone significant changes over the past 20 years. The influx of large populations and rapid industrial development have resulted in drastic transformations in regional ecosystems. Extensive areas of forests, grasslands, wetlands, and farmland have been converted into hardened spaces for factories, residences, and plazas. Furthermore, transportation planning has fragmented ecological spaces, causing the disintegration of existing green and wetland areas, thereby diminishing their ecological benefits. Additionally, the quality of forests has declined due to the establishment of plantations following natural forest logging and human disturbances, such as invasive plants, air pollution, extreme climate events, and poor maintenance.
Within this context, the overall trend of ecosystem services in the Yangtze River Delta Eco-Green Integrated Development Demonstration Area has been declining over the past 20 years, particularly in terms of water conservation, carbon sequestration, and stormwater runoff regulation, which have shown annual declines. The period from 2005 to 2010 experienced the most significant decline, with reductions of 6.15%, 11.31%, and 6.13%, respectively. Although services related to reducing sediment deposition and non-point source pollution showed signs of recovery in 2005 and 2015, by 2020, they had decreased to the lowest levels in nearly two decades.
From 2000 to 2020, regions with a high ecosystem service supply that surround population centers were in a state of continuous degradation, especially noticeable in water conservation, stormwater runoff regulation, and carbon sequestration services. However, due to the relatively flat terrain and minor elevation differences within the demonstration area, the spatial variability in the intensity of services for reducing sediment deposition and non-point source pollution is not pronounced.

4.2. An Integrated System Approach to Optimizing Ecosystem Services

Ecological problems result from the integration of natural, social, and economic factors, and the concept of a system is embedded in the mechanism of problem occurrence. Therefore, in the process of eco-spatial optimization for the enhancement of ecosystem services, policymakers can greatly improve efficiency and save resources if they fully consider the influence of potential drivers from the integrated systems perspective.
In previous similar studies, the authors mostly identified degraded or vulnerable spaces based on the status of ecological assets or the results of ES assessments and used the results to guide actual ecological restoration work [38,77]. Although such methods directly reveal real ecological problems and the degree of urgency, they ignore the actual reasons behind ecological degradation and the driving factors that affect the spatial differentiation of ES. Compared with the traditional method of prioritizing ecological restoration zones, the EESMR delineation method based on the integrated systems perspective in this study also considers the current situation of ES provision but pays more attention to the driving mechanism behind ES provision, as well as the specific strategies and efficiency in the process of ecological restoration practice. This method is a better complement to, rather than a complete replacement of, the previous ecological restoration zone delineation method and can answer an important question faced by urban managers: which plots of land can be restored to obtain more significant ES enhancement benefits in a short period of time?

4.3. Identifying Key Drivers for Enhanced-Efficiency Ecosystem Service Management Region

Understanding the drivers of changes in ecosystem services is essential for designing interventions that maximize benefits while minimizing adverse effects. The mechanisms by which various ecosystem services are generated and influenced by the drivers differ significantly. Assessing the long-term variation characteristics of these services and analyzing the key driving factors are fundamental for urban managers to develop scientifically sound and targeted ecological restoration plans.
There were similarities in the types of key drivers for each of the five ecosystem services categories. The ecosystem type was the most crucial driver influencing the spatial differentiation of all five categories of ecosystem services, with q-values exceeding 0.8, which were significantly higher than those of the other drivers. The NDVI also significantly affected the spatial differentiation of all five categories of ecosystem services. The population density showed high q-values for water conservation, stormwater runoff regulation, and carbon sequestration. Precipitation was a significant driver of sediment deposition, non-point source pollution, and stormwater runoff regulation. The DEM also showed high q-values for water conservation, sediment deposition reduction, and non-point source pollution services. Additionally, water conservation services were influenced by proximity to water systems, carbon sequestration by NPP, and both sediment deposition reduction and non-point source pollution by slope. The interaction detection results revealed that for all five categories of ecosystem services, the q-values for the interaction effects of drivers were higher than those for individual effects, indicating that dual-factor interactions enhance the influence on spatial differentiation.
The delineation of EESMR for various ecosystem services also showed significant spatial variability. A commonality is that Wujiang District contains large areas of high-priority EESMRs for all five categories of ecosystem services, making it a focal area for future ecological restoration efforts. High-priority EESMRs for the enhancement of water conservation services are concentrated in a large area in the southern part of Wujiang District and a few areas in the north, in the southern part of the urban area of Jiashan County, and sporadically in and around the scenic area of the town of Xitang. EESMRs prioritized for the enhancement of stormwater runoff regulation services are distributed throughout the entire area of Wujiang District. They are concentrated in the area around Dianshan Lake in the west, the area around the Taipu River in the south, a large part of the northeastern part of Qingpu District, the area around Fen Lake in the northern part of Jiashan County, and the area around the scenic area of the Xitang Ancient Town. High-priority EESMRs for carbon dioxide sequestration are concentrated in the southern part of Wujiang District, in the southern and northeastern areas of Qingpu District, and in parts around Dianshan Lake in the northwestern part of Qingpu District. Large areas of high-priority EESMRs are also distributed in the southern part of Jiashan County, as well as in the area around the ancient town of Xitang in the north. EESMRs with high upgrading priority for sedimentation reduction and surface pollution reduction services are concentrated in the south-central region of Wujiang District and the southern region of Jiashan County and are also scattered in the central region of Jiashan County. In the preliminary planning for ecological restoration, the differences in the spatial distribution of EESMRs for various types of ecosystem services should be analyzed in depth, and the corresponding higher-priority areas should be considered in conjunction with the main objectives of ecological restoration.

4.4. Potential of Enhanced-Efficiency Ecosystem Service Management Region in Ecological Restoration

Numerous studies have demonstrated that ecosystem services, such as water conservation, stormwater runoff regulation, and carbon sequestration, can mitigate the ecological challenges faced by the region. In the context of ecological degradation and reduced ecosystem services, launching ecological restoration projects or initiatives to enhance ecosystem quality is crucial to ensure sustainable regional development. Researching the key drivers of various ecosystem services and integrating findings to develop actionable spatial strategies for enhancing these services is a critical consideration for urban and regional managers and researchers.
Numerous typical ecological restoration cases and ecological engineering projects have been successfully implemented at various spatial scales, contributing to the enhancement of regional ecosystem services. In large-scale regions, especially those with highly developed socioeconomic status, ecological issues often present diverse and widespread characteristics. Systemic ecological restoration across the entire region. The designation of ecological restoration or project areas often lacks foresight into the systemic ecological restoration process across an entire region. Questions such as ‘Which plots should be prioritized?’ and ‘Which plots can achieve more significant improvements in ecosystem services within a short time?’ are difficult to answer, necessitating the formation of a scientific mechanism to determine priority plots to support the early planning of ecological restoration. This is the concept of EESMR proposed in this article. Natural, social, and economic factors influence the spatial differentiation of ecosystem services. Based on the study of long-term changes in ecosystem services in the Yangtze River Delta Eco-Green Integrated Development Demonstration Area, key driving factors and their interactions have been identified using a geographic detector, which has innovatively proposed the method of delineating EESMRs based on these key driving factors, providing spatial guidance for future specialized ecological restoration projects in the region.

4.5. Revolutionizing Planning with Systems Science for Sustainable Ecosystem Services

Examining urban planning challenges amidst accelerated global urbanization requires addressing their intricate implications. Urban ecosystems face unprecedented stress as spaces expand and economic activities intensify, often at the cost of ecosystem service preservation, which leads to water pollution, air quality degradation, and biodiversity loss. These issues impair residents’ quality of life and hinder their sustainable development.
Rapidly developing cities exemplify the consequences of inadequate planning, with unchecked green space encroachment, wetland destruction, and river pollution exacerbating heat islands and flooding [78,79]. This underscores the limitations of traditional planning, prioritizing land economics over ecosystem significance for city functionality and long-term development.
Systems science revolutionizes urban planning by treating cities as complex ecosystems and analyzing component interactions to reveal ecosystem service dynamics and driving factors [12,80]. This holistic approach integrates natural, socioeconomic, and policy-legal factors, supporting comprehensive scientific planning [39,81].
Our study applied systems science to assess the demonstration area ecosystem services, identify key drivers, and propose an EESMR. This innovation prioritizes restoration projects and fosters green development–ecological planning integration [82,83].
To integrate findings into local planning, such as the Yangtze River Delta Demonstration Zone Plan (2021–2035), we recommend the following: interdepartmental working groups for strategic planning, leveraging study results to designate EESMR priority areas; detailed implementation plans with objectives, tasks, funding, and timelines; public participation through education, outreach, and activities to enhance ecosystem service awareness; and technological advancements for assessment, monitoring, and project efficiency, driving sustainable urban development [84,85].

4.6. Limitations and Prospects

Although this article provides specific spatial guidelines for potential green development and ecological restoration projects based on the assessment of long-term changes in ES and key driving factors in the YRDDA, the EESMRs formed represent a zone based on the degree of interaction among driving factors, without detailed implementation plans for specific indicators. Future research could start with controllable driving factors, such as vegetation quality or area, and focus on high-priority plots within EESMRs to develop more practical ecological restoration implementation plans based on natural backgrounds. When delineating EESMR, we considered all driving factors that could have both indirect and direct impacts on ecosystem services. When it comes to further implementing ecological restoration practices within an EESMR, the analysis of causal factors should be prioritized, which is the direction of our next research step. Additionally, owing to the limitations of available data and recognized calculation methods in this study, pollutants that were not associated with soil transport were not considered in the calculation of services for reducing non-point source pollution. Based on the EESMRs and detailed plans, it is advisable to further assess the growth potential of regional ESs, not only to select the optimum among multiple ecological restoration plans but also to enable urban managers to proactively formulate urban development plans for sustainable socio-economic development.

5. Conclusions

Amid the continuous decline in ecosystem services (ESs) in rapidly urbanizing regions, the development of effective strategies for ecological restoration has become a critical research focus. This study adopts a system-based approach to investigate the spatio-temporal drivers of key ecosystem services, including carbon sequestration, water conservation, sediment reduction, pollution mitigation, and stormwater regulation, within the Yangtze River Delta Eco-Green Integrated Development Demonstration Area (YRDDA) from 2000 to 2020. The analysis revealed significant disparities in the driving factors for different ESs, with carbon sequestration, water conservation, sediment reduction, pollution mitigation, and stormwater regulation influenced by 11, 9, 6, 6, and 10 key factors, respectively. The complex interplay among these factors highlights the spatiotemporal heterogeneity of ES provision across the region. By overlaying the key driving factors, this study proposes a novel framework for defining EESMR to guide targeted ecological restoration efforts. The identified EESMR priority areas in the densely populated southwestern urbanizing zones are characterized by significant carbon sequestration, water conservation, sediment reduction, and pollution mitigation potential, whereas priority areas for stormwater regulation are dispersed across the entire zone. This system-oriented approach provides critical spatial guidance for integrated ecological restoration, green development, and eco-planning in the Yangtze River Delta region. The findings offer valuable insights for policymakers and planners, supporting the formulation of effective land-use policies that balance environmental sustainability and urban growth. The proposed methodologies and strategies can serve as a blueprint for addressing ecosystem service challenges in other rapidly urbanizing regions worldwide.

Supplementary Materials

The following supporting information can be downloaded at: https://www.mdpi.com/article/10.3390/systems12090375/s1, Figure S1: Spatial Distribution and Trend of Water Conservation Services from 2000 to 2020; Figure S2: Spatial Distribution and Trend of Stormwater Runoff Regulation Services from 2000 to 2020; Figure S3: Spatial Distribution and Trend of Carbon Sequestration from 2000 to 2020; Figure S4: Spatial Distribution and Trend of Sediment Deposition Reduction Services from 2000 to 2020; Figure S5: Spatial Distribution and Trend of Non-Point Source Pollution Reduction (TN) Services from 2000 to 2020; Figure S6: Spatial Distribution and Trend of Non-Point Source Pollution Reduction (TP) Services from 2000 to 2020; Table S1: Results of Single-Factor Detection q-Values.

Author Contributions

Conceptualization, W.C.; methodology, C.S.; formal analysis, W.C.; investigation, C.S.; writing—original draft preparation, C.S.; writing—review and editing, W.C.; supervision, W.C.; project administration, W.C.; funding acquisition, W.C. All authors have read and agreed to the published version of the manuscript.

Funding

This research was funded by the National Natural Science Foundation of China (Grant No. 72104232), and ‘Research on Renaturalization and Enhancement of Ecological Value in Rural and Suburban Areas of Shanghai Based on BEC Multidimensional Methods’, a soft science research project (Grant No. 24692116500) under the 2024 ‘Science and Technology Innovation Action Plan’ of Shanghai.

Data Availability Statement

The data are contained within the article.

Conflicts of Interest

The authors declare no conflicts of interest.

References

  1. Brauman, K.A.; Garibaldi, L.A.; Polasky, S.; Aumeeruddy-Thomas, Y.; Brancalion, P.H.S.; DeClerck, F.; Jacob, U.; Mastrangelo, M.E.; Nkongolo, N.V.; Palang, H.; et al. Global trends in nature’s contributions to people. Proc. Natl. Acad. Sci. USA 2020, 117, 32799–32805. [Google Scholar] [CrossRef] [PubMed]
  2. Costanza, R.; d’Arge, R.; de Groot, R.; Farber, S.; Grasso, M.; Hannon, B.; Limburg, K.; Naeem, S.; O’Neill, R.V.; Paruelo, J.; et al. The value of the world’s ecosystem services and natural capital. Nature 1997, 387, 253–260. [Google Scholar] [CrossRef]
  3. Liu, Y.X.; Fu, B.J.; Wang, S.; Rhodes, J.R.; Li, Y.; Zhao, W.W.; Li, C.J.; Zhou, S.; Wang, C.X. Global assessment of nature’s contributions to people. Sci. Bull. 2023, 68, 424–435. [Google Scholar] [CrossRef] [PubMed]
  4. Xu, Z.; Ma, J.; Zheng, H.; Wang, L.; Ying, L.; Li, R.; Yang, Y. Quantification of the flood mitigation ecosystem service by coupling hydrological and hydrodynamic models. Ecosyst. Serv. 2024, 68, 101640. [Google Scholar] [CrossRef]
  5. Yang, D.; Luan, W.-X.; Zhang, X. Projecting spatial interactions between global population and land use changes in the 21st century. npj Urban Sustain. 2023, 3, 53. [Google Scholar] [CrossRef]
  6. Soni, H.; Yadav, R.K.; Patra, S.K. Global impact of urbanization on ecosystems: A comprehensive bibliometric analysis. Nat. Hazards Res. 2024. [Google Scholar] [CrossRef]
  7. Weiskopf, S.R.; Rubenstein, M.A.; Crozier, L.G.; Gaichas, S.; Griffis, R.; Halofsky, J.E.; Hyde, K.J.W.; Morelli, T.L.; Morisette, J.T.; Muñoz, R.C.; et al. Climate change effects on biodiversity, ecosystems, ecosystem services, and natural resource management in the United States. Sci. Total Environ. 2020, 733, 137782. [Google Scholar] [CrossRef]
  8. Trégarot, E.; D’Olivo, J.P.; Botelho, A.Z.; Cabrito, A.; Cardoso, G.O.; Casal, G.; Cornet, C.C.; Cragg, S.M.; Degia, A.K.; Fredriksen, S.; et al. Effects of climate change on marine coastal ecosystems—A review to guide research and management. Biol. Conserv. 2024, 289, 110394. [Google Scholar] [CrossRef]
  9. Sieber, I.M.; Campagne, C.S.; Villien, C.; Burkhard, B. Mapping and assessing ecosystems and their services: A comparative approach to ecosystem service supply in Suriname and French Guiana. Ecosyst. People 2021, 17, 148–164. [Google Scholar] [CrossRef]
  10. Costanza, R. Valuing natural capital and ecosystem services toward the goals of efficiency, fairness, and sustainability. Ecosyst. Serv. 2020, 43, 101096. [Google Scholar] [CrossRef]
  11. Rendon, P.; Steinhoff-Knopp, B.; Burkhard, B. Linking ecosystem condition and ecosystem services: A methodological approach applied to European agroecosystems. Ecosyst. Serv. 2022, 53, 16. [Google Scholar] [CrossRef]
  12. Khosravi Mashizi, A.; Sharafatmandrad, M. Investigating tradeoffs between supply, use and demand of ecosystem services and their effective drivers for sustainable environmental management. J. Environ. Manag. 2021, 289, 112534. [Google Scholar] [CrossRef]
  13. Zhou, A.; Zhao, W.W.; Pereira, P. Mapping and assessing freshwater ecosystem services supply and demand in Inner Mongolia (China). Landsc. Ecol. 2023, 38, 1885–1902. [Google Scholar] [CrossRef]
  14. Wang, L.-J.; Ma, S.; Jiang, J.; Zhao, Y.-G.; Zhang, J.-C. Spatiotemporal Variation in Ecosystem Services and Their Drivers among Different Landscape Heterogeneity Units and Terrain Gradients in the Southern Hill and Mountain Belt, China. Remote Sens. 2021, 13, 1375. [Google Scholar] [CrossRef]
  15. Proctor, J.; Rigden, A.; Chan, D.; Huybers, P. More accurate specification of water supply shows its importance for global crop production. Nat. Food 2022, 3, 753–763. [Google Scholar] [CrossRef] [PubMed]
  16. Rosińska, W.; Jurasz, J.; Przestrzelska, K.; Wartalska, K.; Kaźmierczak, B. Climate change’s ripple effect on water supply systems and the water-energy nexus—A review. Water Resour. Ind. 2024, 32, 100266. [Google Scholar] [CrossRef]
  17. Konapala, G.; Mishra, A.K.; Wada, Y.; Mann, M.E. Climate change will affect global water availability through compounding changes in seasonal precipitation and evaporation. Nat. Commun. 2020, 11, 3044. [Google Scholar] [CrossRef]
  18. Peng, Y.; Chen, W.; Pan, S.; Gu, T.; Zeng, J. Identifying the driving forces of global ecosystem services balance, 2000–2020. J. Clean. Prod. 2023, 426, 139019. [Google Scholar] [CrossRef]
  19. Li, W.; Li, X.; Zhao, Y.; Zheng, S.; Bai, Y. Ecosystem structure, functioning and stability under climate change and grazing in grasslands: Current status and future prospects. Curr. Opin. Environ. Sustain. 2018, 33, 124–135. [Google Scholar] [CrossRef]
  20. Grimm, N.; Chapin Iii, F.S.; Bierwagen, B.; Gonzalez, P.; Groffman, P.; Luo, Y.; Melton, F.; Nadelhoffer, K.; Pairis, A.; Raymond, P.; et al. The impacts of climate change on ecosystem structure and function. Front. Ecol. Environ. 2013, 11, 474–482. [Google Scholar] [CrossRef]
  21. Hua, F.; Bruijnzeel, L.A.; Meli, P.; Martin, P.A.; Zhang, J.; Nakagawa, S.; Miao, X.; Wang, W.; McEvoy, C.; Pena-Arancibia, J.L.; et al. The biodiversity and ecosystem service contributions and trade-offs of forest restoration approaches. Science 2022, 376, 839–844. [Google Scholar] [CrossRef] [PubMed]
  22. Li, J.; Xie, B.; Dong, H.; Zhou, K.; Zhang, X. The impact of urbanization on ecosystem services: Both time and space are important to identify driving forces. J. Environ. Manag. 2023, 347, 119161. [Google Scholar] [CrossRef]
  23. Wang, Y.; Fu, Q.; Guo, J.; Wang, T.; Chen, J. Unveiling the dynamics of urbanization and ecosystem services: Insights from the Su-Xi-Chang Region, China. npj Urban Sustain. 2024, 4, 36. [Google Scholar] [CrossRef]
  24. Obateru, R.O.; Okhimamhe, A.A.; Fashae, O.A.; Aweda, E.; Dragovich, D.; Conrad, C. Community-based assessment of the dynamics of urban landscape characteristics and ecosystem services in the rainforest and guinea savanna ecoregions of Nigeria. J. Environ. Manag. 2024, 360, 121191. [Google Scholar] [CrossRef]
  25. Abdullah, H.M.; Mukti, M.; Miah, M.G.; Karim, M.A.; Tanzir, M.T.; Hossain, M.S. Development at the cost of unsustainable degradation of wetlands: Unraveling the dynamics (historic and future) of wetlands in the megacity Dhaka. World Dev. Sustain. 2024, 4, 100131. [Google Scholar] [CrossRef]
  26. Xin, R.; Skov-Petersen, H.; Zeng, J.; Zhou, J.; Li, K.; Hu, J.; Liu, X.; Kong, J.; Wang, Q. Identifying key areas of imbalanced supply and demand of ecosystem services at the urban agglomeration scale: A case study of the Fujian Delta in China. Sci. Total Environ. 2021, 791, 148173. [Google Scholar] [CrossRef]
  27. Namwinbown, T.; Imoro, Z.A.; Weobong, C.A.-A.; Tom-Dery, D.; Baatuuwie, B.N.; Aikins, T.K.; Poreku, G.; Lawer, E.A. Patterns of green space change and fragmentation in a rapidly expanding city of northern Ghana, West Africa. City Environ. Interact. 2024, 21, 100136. [Google Scholar] [CrossRef]
  28. Nazombe, K.; Nambazo, O. Monitoring and assessment of urban green space loss and fragmentation using remote sensing data in the four cities of Malawi from 1986 to 2021. Sci. Afr. 2023, 20, e01639. [Google Scholar] [CrossRef]
  29. Clauzel, C.; Godet, C.; Tarabon, S.; Eggert, C.; Vuidel, G.; Bailleul, M.; Miaud, C. From single to multiple habitat connectivity: The key role of composite ecological networks for amphibian conservation and habitat restoration. Biol. Conserv. 2024, 289, 110418. [Google Scholar] [CrossRef]
  30. Linero-Triana, D.; Correa-Ayram, C.A.; Velásquez-Tibatá, J. Prioritizing ecological connectivity among protected areas in Colombia using a functional approach for birds. Glob. Ecol. Conserv. 2023, 48, e02713. [Google Scholar] [CrossRef]
  31. Reygadas, Y.; Spera, S.A.; Salisbury, D.S. Effects of deforestation and forest degradation on ecosystem service indicators across the Southwestern Amazon. Ecol. Indic. 2023, 147, 109996. [Google Scholar] [CrossRef]
  32. Saha, S.; Bera, B.; Kumar Shit, P.; Bhattacharjee, S.; Sengupta, D.; Sengupta, N.; Pratim Adhikary, P. Recurrent forest fires, emission of atmospheric pollutants (GHGs) and degradation of tropical dry deciduous forest ecosystem services. Total Environ. Res. Themes 2023, 7, 100057. [Google Scholar] [CrossRef]
  33. Aznarez, C.; Kumar, S.; Marquez-Torres, A.; Pascual, U.; Baró, F. Ecosystem service mismatches evidence inequalities in urban heat vulnerability. Sci. Total Environ. 2024, 922, 171215. [Google Scholar] [CrossRef] [PubMed]
  34. Pereira, P.; Wang, F.; Inacio, M.; Kalinauskas, M.; Bogdzevic, K.; Bogunovic, I.; Zhao, W.W.; Barcelo, D. Nature-based solutions for carbon sequestration in urban environments. Curr. Opin. Environ. Sci. Health 2024, 37, 100536. [Google Scholar] [CrossRef]
  35. Ureta, J.U.; Ureta, J.C.; Bower, L.M.; Peoples, B.K.; Motallebi, M. The value of improving freshwater ecosystem services: South Carolina residents’ willingness to pay for improved water quality. J. Environ. Manag. 2024, 353, 120260. [Google Scholar] [CrossRef] [PubMed]
  36. Malik, I.; Wistuba, M.; Sun, L.; He, J.; Li, C.; Yu, Y.; Yu, R.; Sitko, K. Adverse effects of air pollution on human health predicted from tree-ring reductions—A conceptualization of a new ecosystem service. Ecosyst. Serv. 2023, 64, 101573. [Google Scholar] [CrossRef]
  37. Manes, S.; Vale, M.M.; Pires, A.P.F. Nature-based solutions potential for flood risk reduction under extreme rainfall events. Ambio 2024, 53, 1168–1181. [Google Scholar] [CrossRef]
  38. Tschikof, M.; Stammel, B.; Weigelhofer, G.; Bondar-Kunze, E.; Costea, G.; Pusch, M.; Srdevic, Z.; Benka, P.; Vizi, D.B.; Borgs, T.; et al. Cross-scale and integrative prioritization of multi-functionality in large river floodplains. J. Environ. Manag. 2024, 358, 120899. [Google Scholar] [CrossRef]
  39. Jato-Espino, D.; Capra-Ribeiro, F.; Moscardó, V.; Bartolomé del Pino, L.E.; Mayor-Vitoria, F.; Gallardo, L.O.; Carracedo, P.; Dietrich, K. A systematic review on the ecosystem services provided by green infrastructure. Urban For. Urban Green. 2023, 86, 127998. [Google Scholar] [CrossRef]
  40. Ji, Z.; Zou, S.; Zhang, W.; Song, F.; Yuan, T.; Xu, B. Optimizing zoning for ecological management in alpine region by combining ecosystem service supply and demand with ecosystem resilience. J. Environ. Manag. 2024, 365, 121508. [Google Scholar] [CrossRef]
  41. Wu, S.; Zhao, C.; Yang, L.; Huang, D.; Wu, Y.; Xiao, P. Spatial and temporal evolution analysis of ecological security pattern in Hubei Province based on ecosystem service supply and demand analysis. Ecol. Indic. 2024, 162, 112051. [Google Scholar] [CrossRef]
  42. Kpienbaareh, D.; Bezner Kerr, R.; Nyantakyi-Frimpong, H.; Iverson, A.; Luginaah, I.; Lupafya, E.; Dakishoni, L.; Shumba, L. Ecosystem service demand and supply dynamics under different farming systems: A participatory GIS assessment in Malawi. Appl. Geogr. 2024, 171, 103372. [Google Scholar] [CrossRef]
  43. Yang, Y.; Yuan, X.; An, J.; Su, Q.; Chen, B. Drivers of ecosystem services and their trade-offs and synergies in different land use policy zones of Shaanxi Province, China. J. Clean. Prod. 2024, 452, 142077. [Google Scholar] [CrossRef]
  44. Wei, G.; Zhang, W.; Bi, M.; Sun, P.; Li, S.; Ouyang, X.; Liu, Y.; Tian, X. Trade-offs and synergies pattern evolution of ecosystem structure-resilience-activity-services (SRAS) in the Belt and Road Initiative region. Resour. Conserv. Recycl. 2024, 211, 107883. [Google Scholar] [CrossRef]
  45. Pellowe, K.E.; Meacham, M.; Peterson, G.D.; Lade, S.J. Global analysis of reef ecosystem services reveals synergies, trade-offs and bundles. Ecosyst. Serv. 2023, 63, 101545. [Google Scholar] [CrossRef]
  46. Xu, Z.; Peng, J. Ecosystem services-based decision-making: A bridge from science to practice. Environ. Sci. Policy 2022, 135, 6–15. [Google Scholar] [CrossRef]
  47. Ye, B.; Sui, X.; Wang, X.; Yin, Q.; Wang, J.; Zhou, S. Identification and Demarcation of Territory Space Ecological Conservation and Restoration Areas in Jiangsu Province. Resour. Environ. Yangtze Basin 2023, 32, 250–259. [Google Scholar]
  48. Wang, P.; Zhao, W. Ecological restoration zoning of territorial space in typical karst region: A case study of Maotiao River Basin in Guizhou. J. Nat. Resour. 2022, 37, 2403–2417. [Google Scholar] [CrossRef]
  49. Zhang, X.D.; Wang, X.Y.; Zhang, C.Y.; Zhai, J. Development of a cross-scale landscape infrastructure network guided by the new Jiangnan watertown urbanism: A case study of the ecological green integration demonstration zone in the Yangtze River Delta, China. Ecol. Indic. 2022, 143, 1–13. [Google Scholar] [CrossRef]
  50. Fu, X.R.; Cai, Q.X.; Yang, Y.T.; Xu, Y.; Zhao, F.H.; Yang, J.; Qiao, L.P.; Yao, L.; Li, W.Y. Application of Mobile Monitoring to Study Characteristics of Air Pollution in Typical Areas of the Yangtze River Delta Eco-Green Integration Demonstration Zone, China. Sustainability 2023, 15, 205. [Google Scholar] [CrossRef]
  51. Locosselli, G.M.; de Camargo, E.P.; Lopes Moreira, T.C.; Todesco, E.; Andrade, M.d.F.; Saldiva de Andre, C.D.; de Andre, P.A.; Singer, J.M.; Ferreira, L.S.; Nascimento Saldiva, P.H.; et al. The role of air pollution and climate on the growth of urban trees. Sci. Total Environ. 2019, 666, 652–661. [Google Scholar] [CrossRef] [PubMed]
  52. Shu, C.; Meng, H.; Han, B.; Yang, H.; Pan, X.; Lin, L.; Ouyang, Z. Impact of precipitation factors on gross ecosystem product. Acta Ecol. Sin. 2023, 43, 1054–1063. [Google Scholar]
  53. Guo, C.; Han, B.; Shu, C.; Ding, S.; Wang, H. Research on CLUFS and Its Application in Rapid Prediction of the Impact of Regulating Services Value in Construction Projects. Land 2023, 12, 2041. [Google Scholar] [CrossRef]
  54. Smith, A.C.; Harrison, P.A.; Soba, M.P.; Archaux, F.; Blicharska, M.; Egoh, B.N.; Eros, T.; Domenech, N.F.; Gyorgy, A.I.; Haines-Young, R.; et al. How natural capital delivers ecosystem services: A typology derived from a systematic review. Ecosyst. Serv. 2017, 26, 111–126. [Google Scholar] [CrossRef]
  55. Jiang, W.; Fu, B.; Gao, G.; Lv, Y.; Wang, C.; Sun, S.; Wang, K.; Schueler, S.; Shu, Z. Exploring spatial-temporal driving factors for changes in multiple ecosystem services and their relationships in West Liao River Basin, China. Sci. Total Environ. 2023, 904, 166716. [Google Scholar] [CrossRef]
  56. Chen, W.; Geng, Y.; Zhong, S.; Zhuang, M.; Pan, H. A bibliometric analysis of ecosystem services evaluation from 1997 to 2016. Environ. Sci. Pollut. Res. 2020, 27, 23503–23513. [Google Scholar] [CrossRef]
  57. Liu, W.; Zhan, J.; Zhao, F.; Wang, C.; Zhang, F.; Teng, Y.; Chu, X.; Kumi, M.A. Spatio-temporal variations of ecosystem services and their drivers in the Pearl River Delta, China. J. Cleaner Prod. 2022, 337. [Google Scholar] [CrossRef]
  58. Liu, Y.; Lu, Y.; Fu, B.; Harris, P.; Wu, L. Quantifying the spatio-temporal drivers of planned vegetation restoration on ecosystem services at a regional scale. Sci. Total Environ. 2019, 650, 1029–1040. [Google Scholar] [CrossRef]
  59. Iniesta-Arandia, I.; Garcia-Llorente, M.; Aguilera, P.A.; Montes, C.; Martin-Lopez, B. Socio-cultural valuation of ecosystem services: Uncovering the links between values, drivers of change, and human well-being. Ecol. Econ. 2014, 108, 36–48. [Google Scholar] [CrossRef]
  60. Wang, S.; Cao, Y.; Li, S.; Bai, Z. Temporal-spatial evolution and driving mechanism of ecosystem service in coal-based towns in loess region, China. Ecol. Indic. 2024, 160, 111805. [Google Scholar] [CrossRef]
  61. Xie, L.; Wang, H.; Liu, S. The ecosystem service values simulation and driving force analysis based on land use/land cover: A case study in inland rivers in arid areas of the Aksu River Basin, China. Ecol. Indic. 2022, 138, 108828. [Google Scholar] [CrossRef]
  62. Cheng, P.; Tang, H.; Zhu, S.; Jiang, P.; Wang, J.; Kong, X.; Liu, K. Distance to river basin affects residents? willingness to pay for ecosystem services: Evidence from the Xijiang river basin in China. Ecol. Indic. 2021, 126, 107691. [Google Scholar] [CrossRef]
  63. Khan, S.U.; Khan, I.; Zhao, M.; Chien, H.; Lu, Q.; Ali, M.A.S.; Khan, A.A.; Fahad, S. Spatial heterogeneity of ecosystem services: A distance decay approach to quantify willingness to pay for improvements in Heihe River Basin ecosystems. Environ. Sci. Pollut. Res. 2019, 26, 25247–25261. [Google Scholar] [CrossRef] [PubMed]
  64. Ouyang, Z.; Zheng, H.; Xiao, Y.; Polasky, S.; Liu, J.; Xu, W.; Wang, Q.; Zhang, L.; Xiao, Y.; Rao, E.M.; et al. Improvements in ecosystem services from investments in natural capital. Science 2016, 352, 1455–1459. [Google Scholar] [CrossRef] [PubMed]
  65. Ouyang, Z.Y.; Song, C.S.; Zheng, H.; Polasky, S.; Xiao, Y.; Bateman, I.J.; Liu, J.G.; Ruckelshaus, M.; Shi, F.Q.; Xiao, Y.; et al. Using gross ecosystem product (GEP) to value nature in decision making. Proc. Natl. Acad. Sci. USA 2020, 117, 14593–14601. [Google Scholar] [CrossRef]
  66. Cai, W.; Shu, C.; Zhu, Y. Using Ecosystem Services to Inform Sustainable Waterfront Area Management: A Case Study in the Yangtze River Delta Ecological Green Integration Demonstration Zone. Land 2023, 12, 1351. [Google Scholar] [CrossRef]
  67. Gao, G.; Liang, Y.; Liu, J.; Dunkerley, D.; Fu, B. A modified RUSLE model to simulate soil erosion under different ecological restoration types in the loess hilly area. Int. Soil Water Conserv. Res. 2024, 12, 258–266. [Google Scholar] [CrossRef]
  68. Räsänen, T.A.; Tähtikarhu, M.; Uusi-Kämppä, J.; Piirainen, S.; Turtola, E. Evaluation of RUSLE and spatial assessment of agricultural soil erosion in Finland. Geoderma Reg. 2023, 32, e00610. [Google Scholar] [CrossRef]
  69. Wang, J.; Xu, C. Geodetector: Principle and prospective. Acta Geogr. Sin. 2017, 72, 116–134. [Google Scholar]
  70. Wu, Z.; Hou, Q.; Yang, Z.; Yu, T.; Li, D.; Lin, K.; Ma, X. Identification of factors driving the spatial distribution of molybdenum (Mo) in topsoil in the Longitudinal Range-Gorge Region of Southwestern China using the Geodetector model. Ecotoxicol. Environ. Saf. 2024, 271, 115846. [Google Scholar] [CrossRef]
  71. Lin, J.; He, S.; Liu, X.; Huang, Z.; Li, M.; Chen, B.; Hu, W. Identifying conservation and restoration priorities for degraded coastal wetland vegetations: Integrating species distribution model and GeoDetector. Sci. Total Environ. 2024, 906, 167491. [Google Scholar] [CrossRef] [PubMed]
  72. Wang, J.; Haining, R.; Zhang, T.; Xu, C.; Hu, M.; Yin, Q.; Li, L.; Zhou, C.; Li, G.; Chen, H. Statistical Modeling of Spatially Stratified Heterogeneous Data. Ann. Am. Assoc. Geogr. 2024, 114, 499–519. [Google Scholar] [CrossRef]
  73. Shu, C.; Du, K.; Han, B.; Chen, Z.; Wang, H.; Ouyang, Z. Driving Forces on the Distribution of Urban Ecosystem’s Non-Point Pollution Reduction Service. Atmosphere 2023, 14, 873. [Google Scholar] [CrossRef]
  74. Mitchell, M.G.E.; Qiu, J.; Cardinale, B.J.; Chan, K.M.A.; Eigenbrod, F.; Felipe-Lucia, M.R.; Jacob, A.L.; Jones, M.S.; Sonter, L.J. Key questions for understanding drivers of biodiversity-ecosystem service relationships across spatial scales. Landsc. Ecol. 2024, 39, 36. [Google Scholar] [CrossRef]
  75. Reader, M.O.; Eppinga, M.B.; de Boer, H.J.; Damm, A.; Petchey, O.L.; Santos, M.J. Biodiversity mediates relationships between anthropogenic drivers and ecosystem services across global mountain, island and delta systems. Glob. Environ. Chang.-Hum. Policy Dimens. 2023, 78, 102612. [Google Scholar] [CrossRef]
  76. Rodriguez, B.C.; Palma-Torres, V.M.; Castanenda, T.E.; Codtiyeng, S.K.; Castillo, J.F.; Sasi, A.P.V.; Tercero, M.U.; Andrada, R.T. Drivers and impacts of land use and land cover changes on ecosystem services provided by the watersheds in the Philippines: A systematic literature review. Int. For. Rev. 2023, 25, 473–490. [Google Scholar] [CrossRef]
  77. Bian, H.; Li, M.; Deng, Y.; Zhang, Y.; Liu, Y.; Wang, Q.; Xie, S.; Wang, S.; Zhang, Z.; Wang, N. Identification of ecological restoration areas based on the ecological safety security assessment of wetland-hydrological ecological corridors: A case study of the Han River Basin in China. Ecol. Indic. 2024, 160, 111780. [Google Scholar] [CrossRef]
  78. Cai, W.; Gibbs, D.; Zhang, L.; Ferrier, G.; Cai, Y. Identifying hotspots and management of critical ecosystem services in rapidly urbanizing Yangtze River Delta Region, China. J. Environ. Manag. 2017, 191, 258–267. [Google Scholar] [CrossRef]
  79. Tao, Y.; Li, Z.; Sun, X.; Qiu, J.; Pueppke, S.G.; Ou, W.; Guo, J.; Tao, Q.; Wang, F. Supply and demand dynamics of hydrologic ecosystem services in the rapidly urbanizing Taihu Lake Basin of China. Appl. Geogr. 2023, 151, 102853. [Google Scholar] [CrossRef]
  80. Liu, Q.; Qiao, J.; Li, M.; Huang, M. Spatiotemporal heterogeneity of ecosystem service interactions and their drivers at different spatial scales in the Yellow River Basin. Sci. Total Environ. 2024, 908, 168486. [Google Scholar] [CrossRef]
  81. García-Pardo, K.A.; Moreno-Rangel, D.; Domínguez-Amarillo, S.; García-Chávez, J.R. Remote sensing for the assessment of ecosystem services provided by urban vegetation: A review of the methods applied. Urban For. Urban Green. 2022, 74, 127636. [Google Scholar] [CrossRef]
  82. Manes, S.; Vale, M.M.; Malecha, A.; Pires, A.P.F. Nature-based solutions promote climate change adaptation safeguarding ecosystem services. Ecosyst. Serv. 2022, 55, 101439. [Google Scholar] [CrossRef]
  83. Chen, D.; Zhao, Q.; Jiang, P.; Li, M. Incorporating ecosystem services to assess progress towards sustainable development goals: A case study of the Yangtze River Economic Belt, China. Sci. Total Environ. 2022, 806, 151277. [Google Scholar] [CrossRef] [PubMed]
  84. Cheng, L.; Samah, A.; Zhang, Y.; Jia, Z.; Li, F. Towards urban energy sustainability and resiliency through smart agriculture and effective renewable resource allocation. Sustain. Cities Soc. 2024, 107, 105420. [Google Scholar] [CrossRef]
  85. Ehigiamusoe, K.U.; Shahbaz, M.; Vo, X.V. How Does Globalization Influence the Impact of Tourism on Carbon Emissions and Ecological Footprint? Evidence from African Countries. J. Travel Res. 2022, 62, 1010–1032. [Google Scholar] [CrossRef]
Figure 1. Location of the Yangtze River Delta Eco-Green Integration Demonstration Area.
Systems 12 00375 g001
Figure 2. System-based conceptual framework of the Enhanced-Efficiency Ecosystem Service Management Region (EESMR).
Systems 12 00375 g002
Figure 3. Single-factor detection q-values (* p < 0.05, ** p < 0.01, *** p < 0.001). CDS represents carbon sequestration, RS represents reduction of sedimentation, RNSP represents reduction of non-point source pollution, SRR represents stormwater runoff regulation, and WC represents water conservation.
Systems 12 00375 g003
Figure 4. Interaction detection results for ecosystem service drivers.
Systems 12 00375 g004
Figure 5. Interaction detection results for ecosystem service drivers. Enhanced-Efficiency Ecosystem Service Management Region targeting ecosystem service enhancement. WC represents water conservation, SRR represents stormwater runoff regulation, CDS represents carbon sequestration, RS represents reduction of sedimentation, and RNSP represents reduction of non-point source pollution.
Systems 12 00375 g005
Table 1. Data used for ES assessment.
DataYearResolutionData TypeData Source
Ecosystem Classification Data2000, 2005, 2010, 2015, 202030 mRasterChinese Academy of Sciences Resource and Environmental Data Center (https://www.resdc.cn/), accessed on 1 January 2024
Daily Heavy Rainfall Standards--TextChina Meteorological Administration GB/T28592−2012, accessed on 1 January 2024
Daily Rainfall Monitoring Data2020-ExcelChinese Academy of Sciences Resource and Environmental Data Center (https://www.resdc.cn/), accessed on 1 January 2024
Soil Attributes Data (clay, sand, silt, organic matter content)-1000 mRasterWorld Soil Database (https://www.fao.org/home/en/), accessed on 1 January 2024
Soil Bulk Density-1000 mRasterWorld Soil Database (https://www.fao.org/home/en/), accessed on 1 January 2024
Ecosystem Type CN Values--TextU.S. Department of Agriculture Natural Resources Conservation Service
Ecosystem Evapotranspiration Data2000, 2005, 2010, 2015, 2020500 mRasterThe Earth Science Data Systems (ESDS) Program (https://www.earthdata.nasa.gov/), accessed on 1 January 2024
Net Primary Productivity Data2000, 2005, 2010, 2015, 202010RasterChinese Academy of Sciences Ecological Environment Research Center (based on MODIS annual NPP data and Sentinel-2 imagery)
Digital Elevation Model-30 mRasterASTER GDEM V3
Normalized Difference Vegetation Index Data2000, 2005, 2010, 2015, 202010RasterChinese Academy of Sciences Resource and Environmental Data Center (https://www.resdc.cn/), accessed on 1 January 2024
Table 2. Data used for driver analysis.
CodePotential Driving ForcesData Sources
X1DEMASTER GDEM V3 DEM data
X2NDVIChinese Academy of Sciences Resource and Environmental Data Center (https://www.resdc.cn/), accessed on 1 January 2024
X3NPPState Key Laboratory of Urban and Regional Ecology, Research Center for Eco-Environment Sciences, Chinese Academy of Sciences
X4SlopeSlope analysis based on ASTER GDEM V3 DEM data
X5Content of sticky particlesWorld Soil Database (https://www.fao.org/home/en/), accessed on 1 January 2024
X6Content of powder particlesWorld Soil Database (https://www.fao.org/home/en/), accessed on 1 January 2024
X7Content of organic matterWorld Soil Database (https://www.fao.org/home/en/), accessed on 1 January 2024
X8Content of sand particlesWorld Soil Database (https://www.fao.org/home/en/), accessed on 1 January 2024
X9GDP/m2Chinese Academy of Sciences Resource and Environmental Data Center (https://www.resdc.cn/), accessed on 1 January 2024
X10PrecipitationChinese Academy of Sciences Resource and Environmental Data Center (https://www.resdc.cn/), accessed on 1 January 2024
X11Distance from the water systemArcGIS distance analysis based on water body extent in ecosystem classification data
X12Distance from railwaysArcGIS distance analysis based on Golder Electronic Basemap railroad data
X13Distance from major roadsArcGIS distance analysis based on highway data from Golder Electronic Basemap
X14Population densityChinese Academy of Sciences Resource and Environmental Data Center (https://www.resdc.cn/), accessed on 1 January 2024
X15Average annual air humidityChinese Academy of Sciences Resource and Environmental Data Center (https://www.resdc.cn/), accessed on 1 January 2024
X16Average annual temperatureChinese Academy of Sciences Resource and Environmental Data Center (https://www.resdc.cn/), accessed on 1 January 2024
X17EvapotranspirationChinese Academy of Sciences Resource and Environmental Data Center (https://www.resdc.cn/), accessed on 1 January 2024
X18Ecosystem typesChinese Academy of Sciences Resource and Environmental Data Center (https://www.resdc.cn/), accessed on 1 January 2024
Disclaimer/Publisher’s Note: The statements, opinions and data contained in all publications are solely those of the individual author(s) and contributor(s) and not of MDPI and/or the editor(s). MDPI and/or the editor(s) disclaim responsibility for any injury to people or property resulting from any ideas, methods, instructions or products referred to in the content.

