Abstract
New product development (NPD) is crucial for helping companies to maintain competitive advantages. In this study, a methodological framework is presented combining a novel Kano model and fuzzy axiomatic design (FAD) for improving the product development capability in the whole NPD process. In the Kano model, a novel mixed-class classification method is presented to classify each evaluation indicator agreed on by the majority, and to calculate the affiliation value based on category strength (CS) to display the degree to which the indicator belongs to a certain attribute. A new importance ratio is also proposed to adjust the importance of each indicator attribute. This helps to achieve higher customer satisfaction and improve the attractiveness of the product or service. FAD is then used to measure the gap between customer satisfaction and the company’s expected levels of satisfaction in terms of product functions. This enables the company to obtain more comprehensive information for decision-making. A case study is provided to verify the practicability of the proposed method. Sensitivity analysis proves the robustness of the results based on the number of respondents. Finally, comparative analysis with existing approaches demonstrates the strengths of the proposed method.
1. Introduction
In an increasingly competitive environment, new product development (NPD) has become more important, constantly pushing companies to produce better products/services so that customers can find products/services that exceed their expectations [1]. NPD mainly involves transforming customer needs into a product/service. It is the process of creating tangible products/services from an intangible idea, forming new ways of generating wealth [2]. An effective NPD can meet a company’s requirements for quality, delivery time, cost, and is also related to competitive advantages such as efficiency and first-mover status [3,4]. However, the highly uncertain and rapidly changing market environment makes NPD extremely ambiguous and complex. NPD is a complex systematic engineering process that must continuously consider customer needs and how to fulfill them until the overall structure and detailed features are completely justified to produce a successful product/service [5]. Zheng et al. [6] pointed out that since multiple subunits within each company are involved in the NPD process, the external uncertainty is inevitably formed. Therefore, a reasonable and effective method is the key to solving this problem.
The Kano model was first proposed by Noriaki Kano in 1984. It is a useful tool for the NPD process, helping to identify which product/service features are key differentiators from the customer perspective [7]. It classifies product/service features into the following six different attributes: must-be (M), one-dimensional (O), attractive (A), indifferent (I), reverse (R), and questionable (Q). Determining which features are essential and which are irrelevant helps companies to optimize the allocation of resources in NPD [8]. While the Kano model has its limitations, which have been addressed by various scholars over the years. The first set of studies focuses on the improvement of the Kano questionnaire. Lee et al. [9] proposed the fuzzy Kano questionnaire to deal with uncertainty and ambiguity in participants’ responses. It allows participants to select percentages or decimals, rather than single values, to represent their feelings. The other approach to improving the Kano model focuses on improving attribute classification. The traditional Kano model classifies indicators into the six major attributes (A, O, M, I, R, and Q). However, the accurate selection of a category for each indicator is not always simple. For example, if the values of A, O, M, I, and R are 32, 17, 31, 25, and 2, respectively (attribute Q is zero in general), a traditional approach would select A (the highest value). However, the difference between the values of attributes M and A is only 1. To deal with such cases, Lee and Newcomb [10] presented the concept of the mixed-class and introduced the CS approach. Madzík [11] refined attribute classification without increasing the difficulty of completing the questionnaire for respondents. Ilbahar and Çebi [12] proposed that indicators can be affiliated to multiple attributes at the same time and introduced the concept of fuzzy sets to determine the affiliation values of indicators to different types of attributes through the center of gravity method. Tan and Shen [13], Chaudha et al. [14], and Avikal et al. [15] presented the importance ratio for different attributes.
While the methods mentioned above are useful in NPD, there are five problems associated with its application, as follows: (a) compared with the traditional Kano model, the calculation and operation of attribute affiliation values in fuzzy Kano are more complex, and the classification results differ [15,16]; (b) fuzzy Kano needs to reserve the possibility degrees because using the consensus standard—α-cut—does not effectively identify its crisp Kano category [15]; (c) the respondents are asked to distribute their feelings proportionally in the questionnaire, so their background and experience are more important, which may affect the validity of the results [8]; (d) the CS approach is not accurate because it cannot classify all attributes [10]; and (e) the calculated results of the importance ratio for attributes are inconsistent and inaccurate, which directly impacts the decision results [13,14,15]. These limitations mean that determining whether the attributes exist in a product is a process full of ambiguity and uncertainty. Moreover, while considering customer needs, companies must also consider their own limitations in resources and capabilities. Thus, both production capacity and market demand must be factored into product/service development and improvement.
To overcome the above issues, in this paper, a methodological framework is presented for the improvements in the whole NPD procedure performance based on a new Kano model and FAD. The contribution of this paper is two-fold. First, a novel mixed-class classification method with the importance of each indicator ranked by the Kano model is presented to flexibly classify the product attributes according to majority opinion. This reliably determines the impact values of product features, thereby identifying which attributes of the product/service are important to customers and categorizing how these attributes affect customer satisfaction. Second, FAD is then used to investigate the relationship between customer satisfaction level and the satisfaction expected by the company to identify priorities in terms of improvement/development. This enables companies to obtain more comprehensive information, thereby correctly allocating and assigning the right resources to key product features for NPD. We present an example relating to disposable surgical masks to illustrate the efficacy of the proposed method in product quality improvement.
The remainder of this paper is organized as follows. Section 2 briefly reviews the Kano model and FAD. Section 3 presents details of the proposed method including classification and the importance of indicator attributes. A case study is given in Section 4 to illustrate the proposed method and algorithm. Sensitivity analysis and comparative analysis are used to demonstrate the advantages of the proposed method. Conclusions are drawn in Section 5.
2. Materials and Methods
2.1. Kano Model
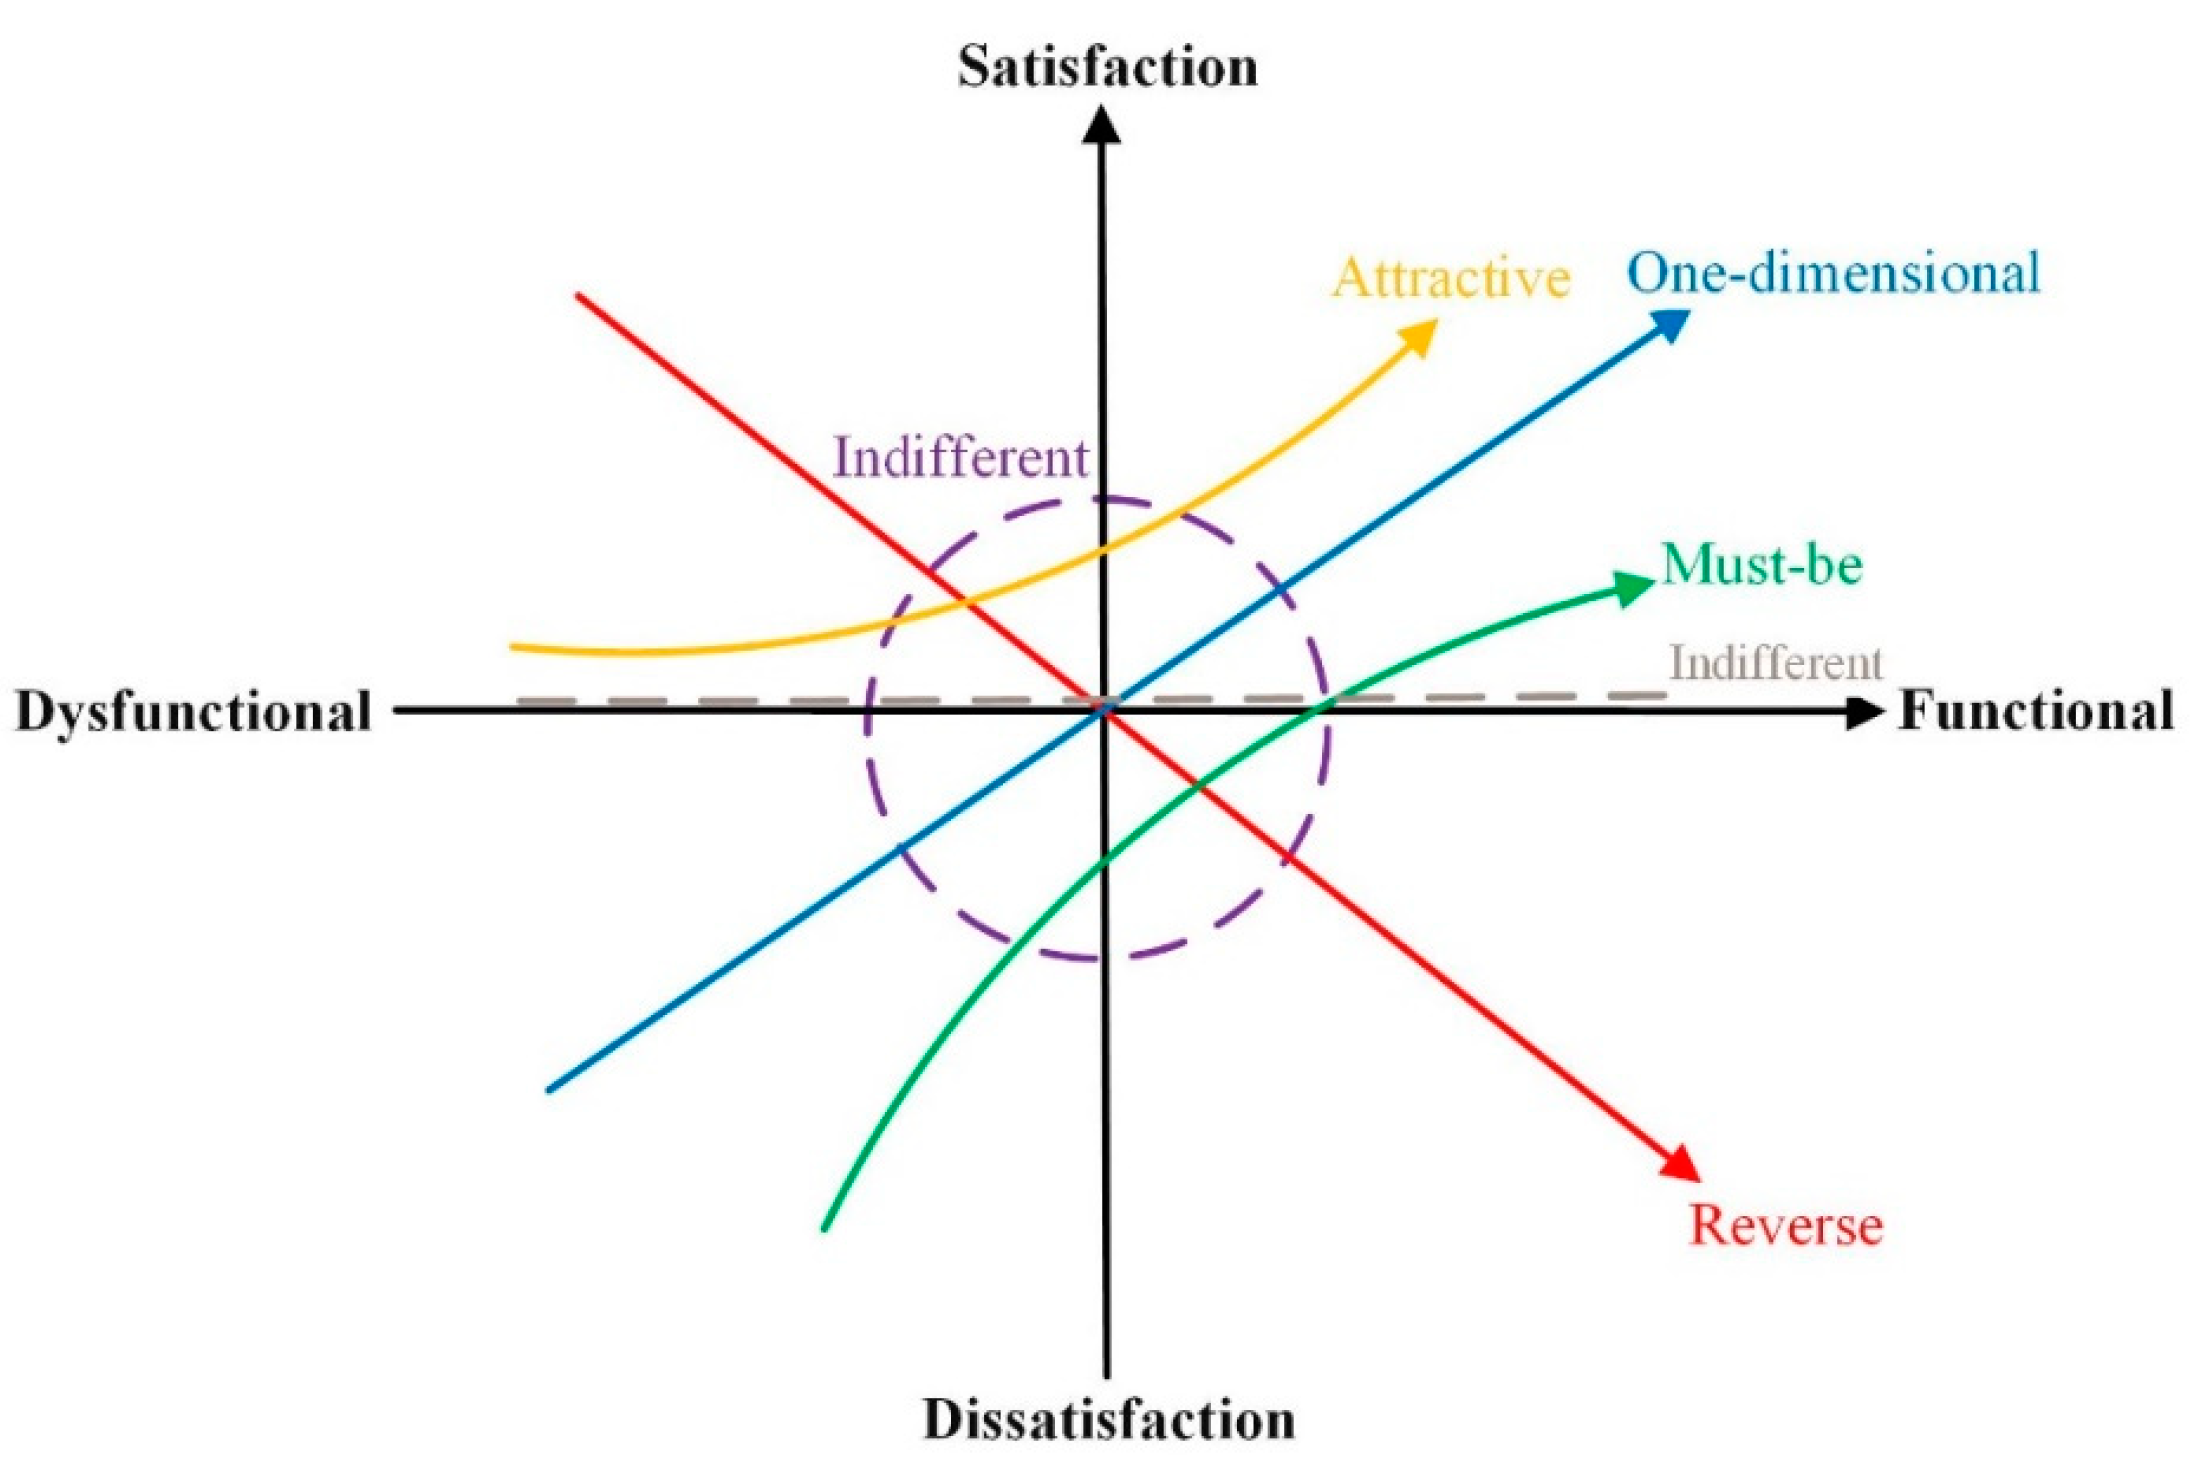
In practice, attribute improvements may not effectively improve customer satisfaction because of the dynamics and the different importance of each attribute to customers [17,18]. The Kano model is a powerful tool to measure the relationship between customer satisfaction and product/service performance. The Kano model has been widely used in various industries, including medicine [19], food processing [20], airlines [21], industrial technology [22], tourism [23], and construction [24]. The Kano model explains the perception of the relationship between the satisfaction of an attribute and the degree of its fulfillment. It classifies the attributes of a product/service into six major attributes, each of which has a different impact on customer satisfaction [7]. Referring to Figure 1, the six attributes of the Kano model are briefly explained as follows.
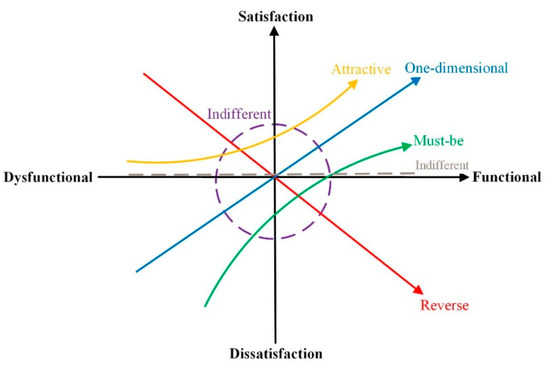
Figure 1.
An overview of the theory of Kano model.
- Must-be attributes (M): These are also called necessary attributes; these are the characteristics of a product/service which customers take for granted. When the attribute in product/service is present, the customer will likely feel neutral; however, if these attributes are missing, the customer will be very dissatisfied.
- One-dimensional attributes (O): These are also called linear attributes. When the attribute is absent from the product/service, customer satisfaction is low; when it is present, customer satisfaction is high.
- Attractive attributes (A): These attributes are not expected by the customer; however, their presence increases customer satisfaction substantially.
- Indifferent attributes (I): Whether these attributes are present or not, customer satisfaction remains unaffected.
- Reverse attributes (R): These are also called inverse attributes. When these attributes are present, customer satisfaction will decrease.
- Questionable (Q): These are also called invalid attributes, which means that the customer’s answer to the Kano questionnaire was nonsensical or the question was worded incorrectly. Note that this attribute may not only mean incorrect wording but may point to more meanings of the question, and therefore, it is necessary to discuss this question with the respondents to find the root cause of this answer.
The Kano model was implemented using the Kano questionnaire to investigate the attitudes of customer groups; in the questionnaire, functional (dysfunctional) questions evaluate the customer’s satisfaction (dissatisfaction) when the product/service satisfies (does not satisfy) a particular attribute [7]. Table 1 explains the relationships of the Kano categories to each pair of functional and dysfunctional questions [25]. A given pair of questions with the greatest number of respondents represents the dominant customer view [11].

Table 1.
Evaluation table for classifying attributes using the Kano questionnaire.
2.2. Fuzzy Axiomatic Design
Axiomatic design is a design theory proposed by [26]. It not only provides a framework for designers, but it also translates user needs into technical information to create products that satisfy users [27,28]. Axiomatic design contains the following two main axioms: the independence axiom and the information axiom. The independence axiom states that design parameters and function requirements are independent of each other, while the information axiom provides the design basis for decision analysis, which states that the solution with the minimum information content (IC) is the best solution.
Axiomatic design is based on the IC, which corresponds to a probability function for satisfying a function requirement. In the process of design, the probability of success is calculated by the intersection of the design range (function requirements) and the system range (capacity of the system). The overlap between the design range and system range is the common area where the acceptable solution appears. The IC can be obtained by
where p is the probability of satisfying the functional requirements.
Due to the complexity of design and the fuzziness of human thinking, there is usually uncertainty between the functional requirements and design parameters of products. Kulak and Kahraman [29] proposed FAD by introducing the concept of fuzzy information axioms. FAD has been applied to various industries. Karatas [30] used fuzzy hierarchical analysis and weighted FAD to select hydrogen energy storage schemes in Turkey. Wu and Liao [31] introduced a hybrid utility-based FAD with an ordinal aggregation method for assessing credit risk problems in supply chain finance. Feng [32] used satisfaction-based FAD to evaluate and rank alternatives for wind farm addresses in a mixed decision information environment. Ilbahar et al. [33] combined Pythagorean fuzzy sets with axiomatic design to evaluate biomass conversion technologies and select suitable renewable energy technologies. Gölcük [34] proposed a new FAD with risk factors to solve the green supplier selection problem under an interval type-2 fuzzy environment.
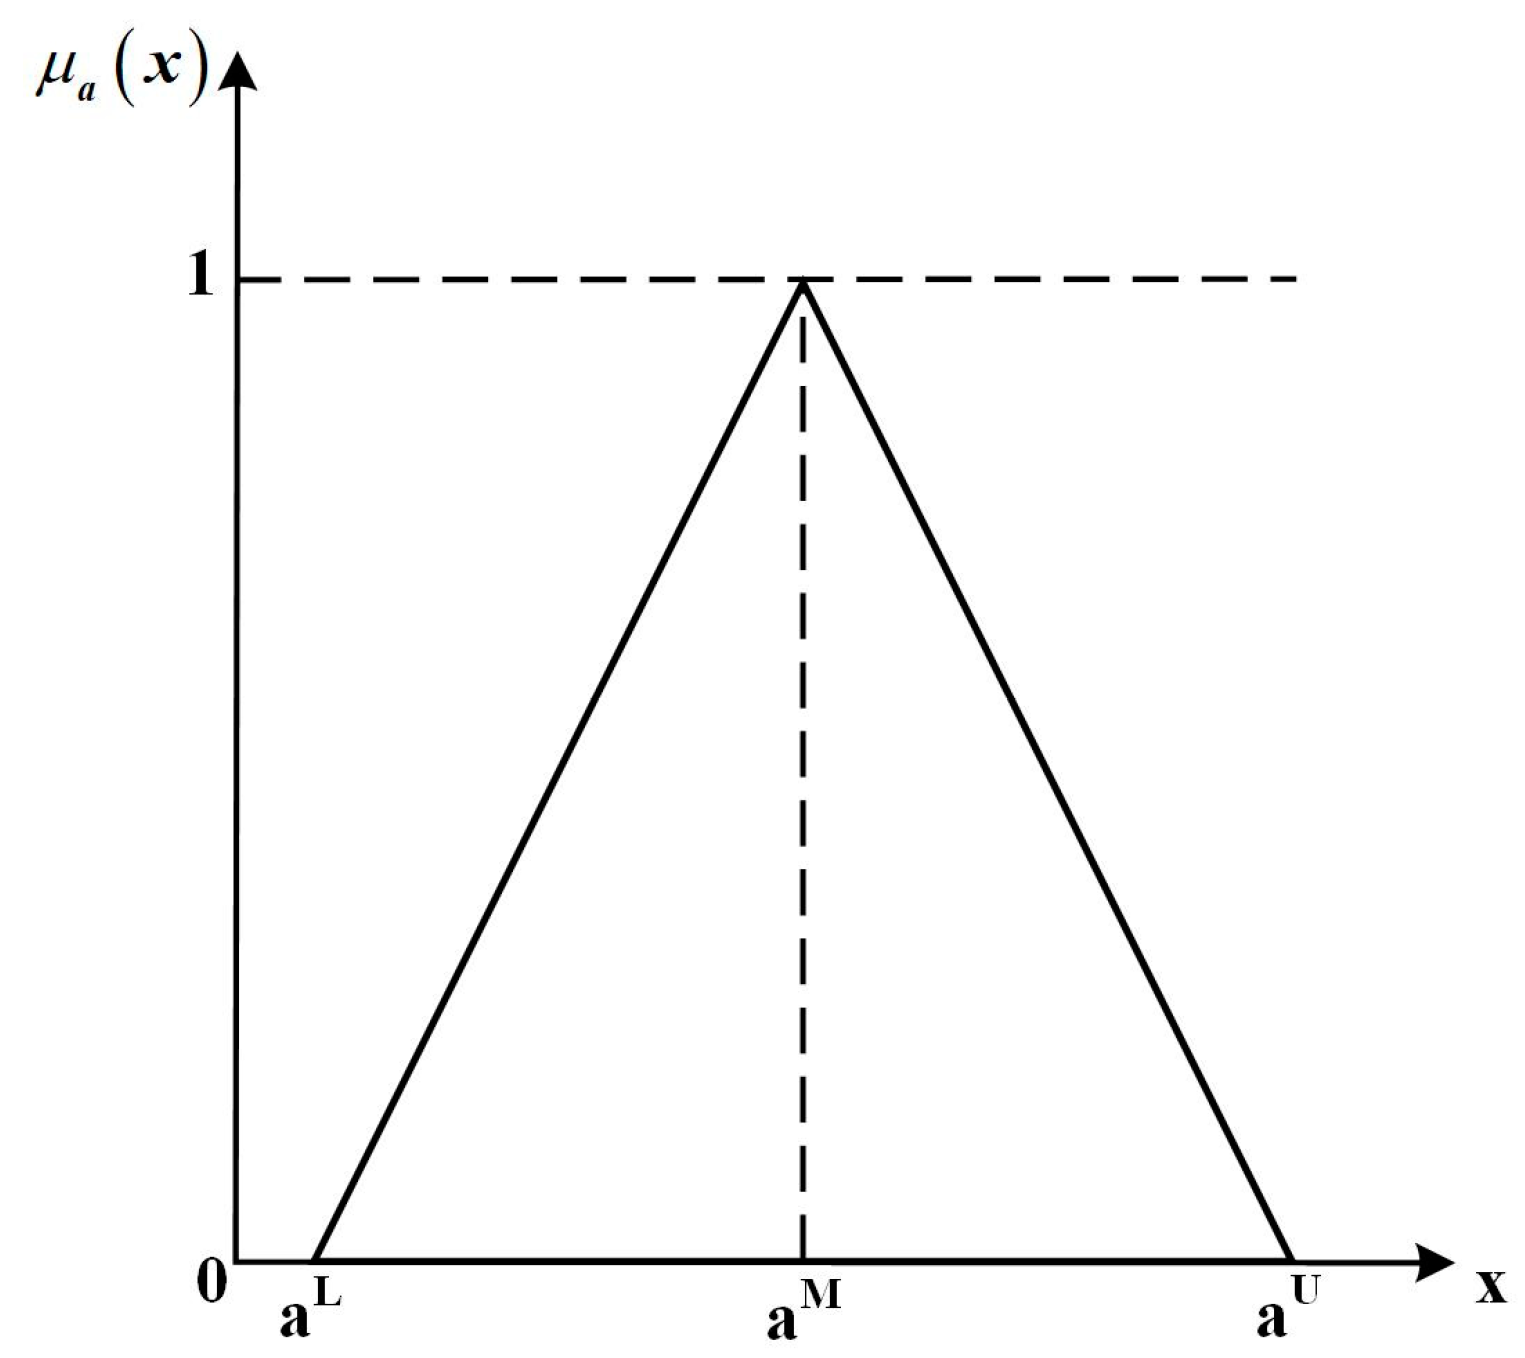
If , where and a is a triangular fuzzy number (TFN), as shown in Figure 2, its membership function can be expressed as follows [35,36]:
where is the lower boundary; is the upper boundary; and is the mean value.
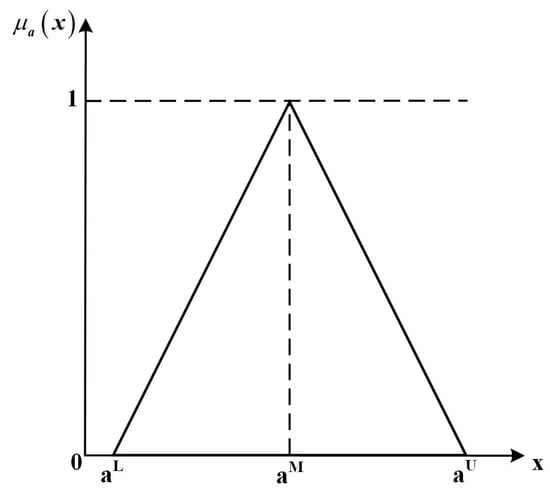
Figure 2.
The membership function of an TFN.
Let and be two TFNs. Their operational laws are then interpreted as follows:
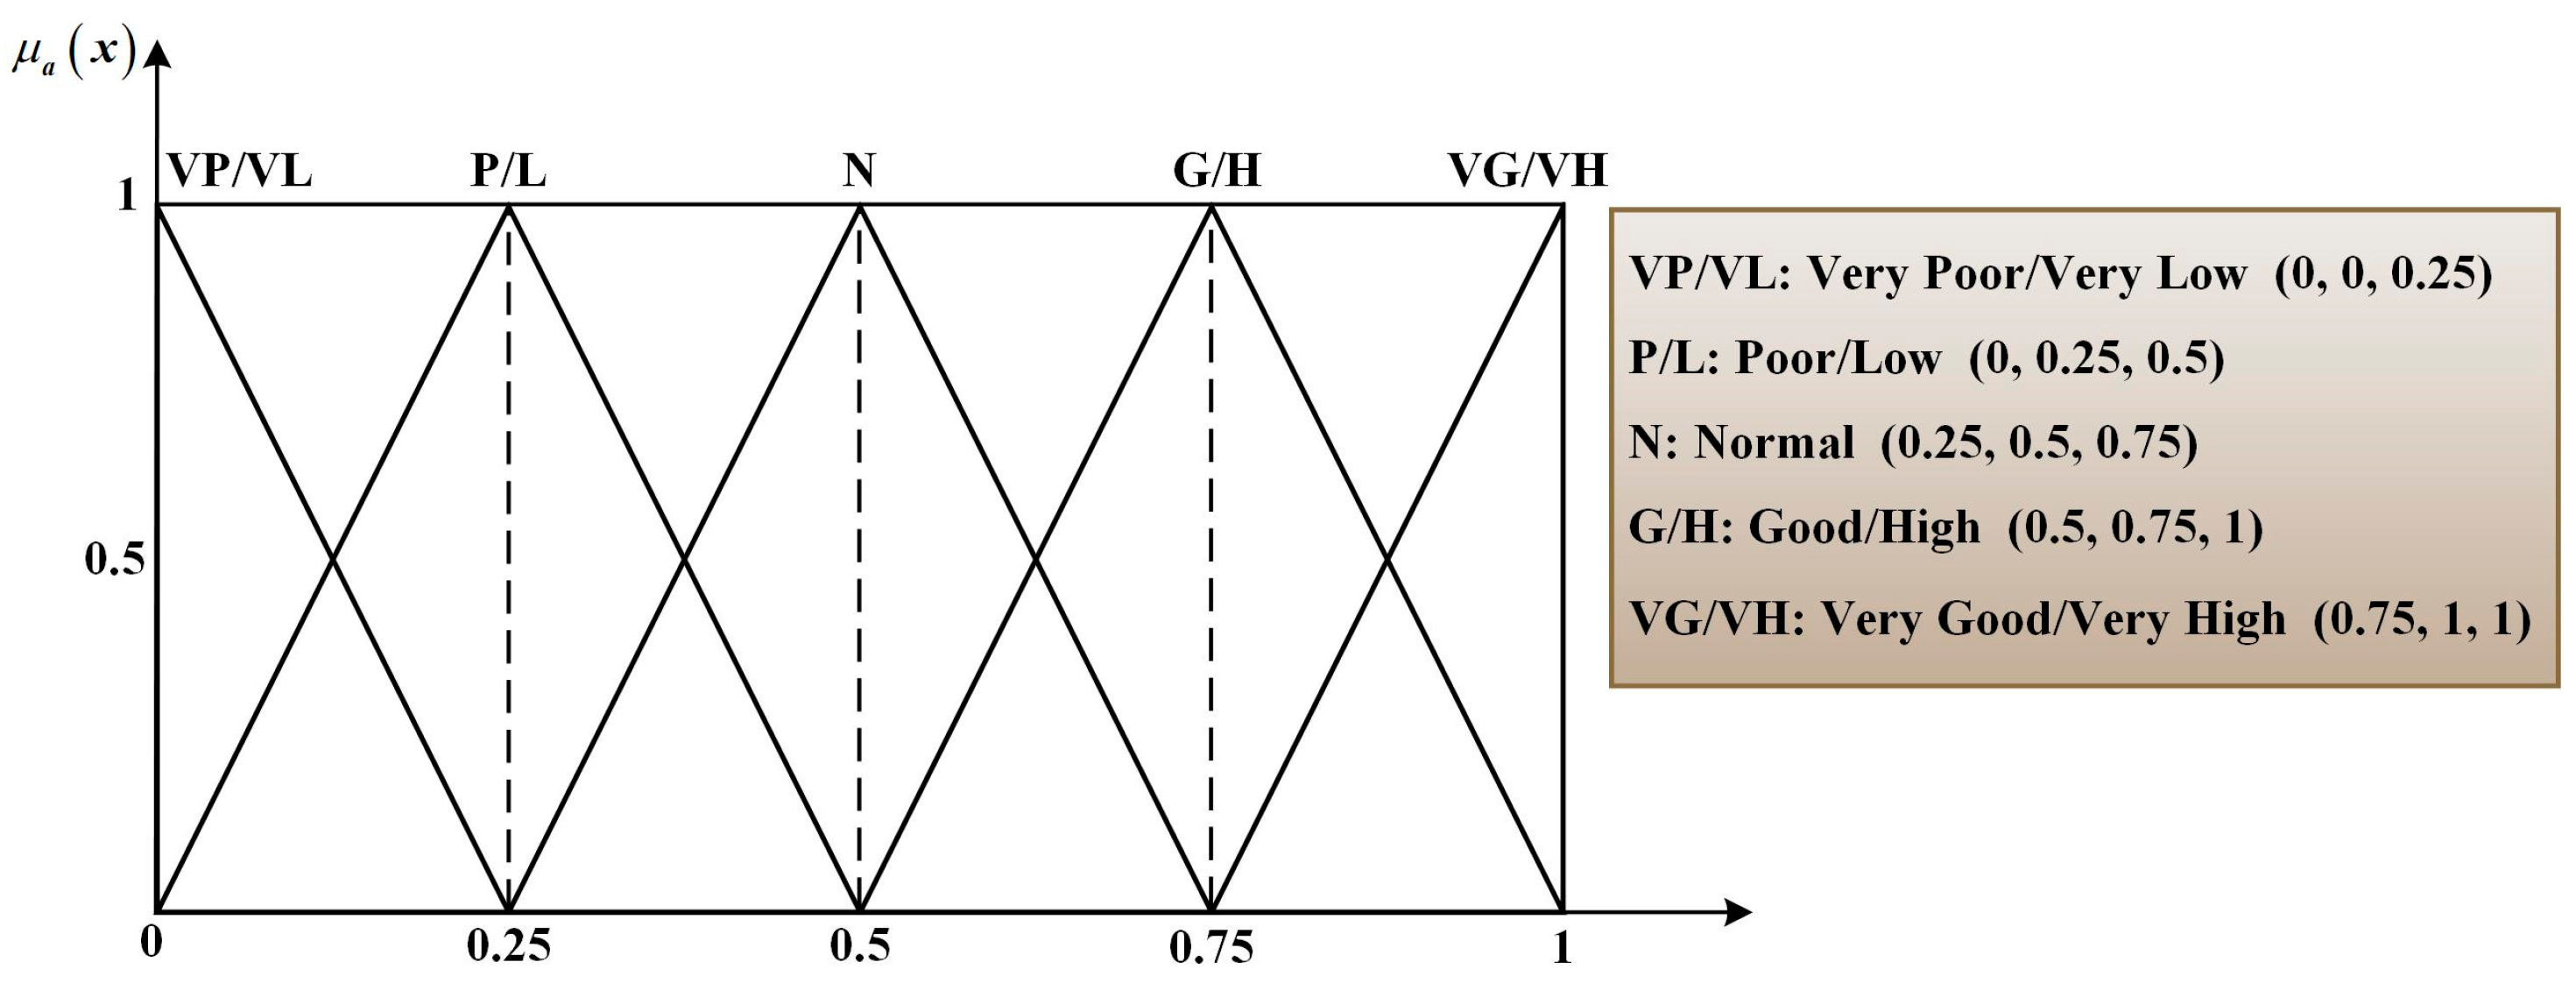
In the FAD evaluation process, linguistic descriptions are more easily understood. Usually, fuzzy evaluations are expressed by using linguistic variables, such as very poor (VP)/very low (VL), poor (P)/low (L), normal (N), good (G)/high (H), and very good (VG)/very high (VH). Linguistic variables can be transformed into explicit values (qualitative to quantitative) by means of TFNs, which are simple to use and easy to understand [37]. Linguistic variables are transformed into the corresponding TFNs using a scoring system that includes five conversion scales, such as low (L) is set to (0, 0.25, 0.5) and high (H) is set to (0.5, 0.75, 1), as shown in Figure 3.
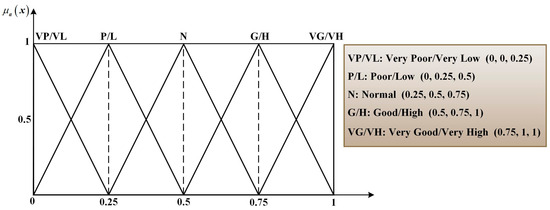
Figure 3.
Membership functions of linguistic variables.
In FAD, the IC is calculated as follows [38]:
where the fuzzy common area (FCA) is the overlapping area between the fuzzy design range (FDR) and the fuzzy system range (FSR) that satisfies the functional requirements, , the FSR is denoted by , and the FDR is denoted by . A larger overlapping area indicates that the probability p of achieving the functional requirements is higher [29]. Figure 4 illustrates the FDR and FSR as well as the FCA.
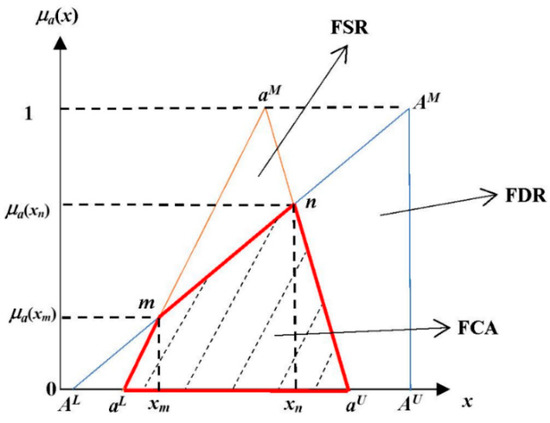
Figure 4.
The overlapping area of FDR and FSR in FAD.
3. Proposed Methodological Framework for New Product Development
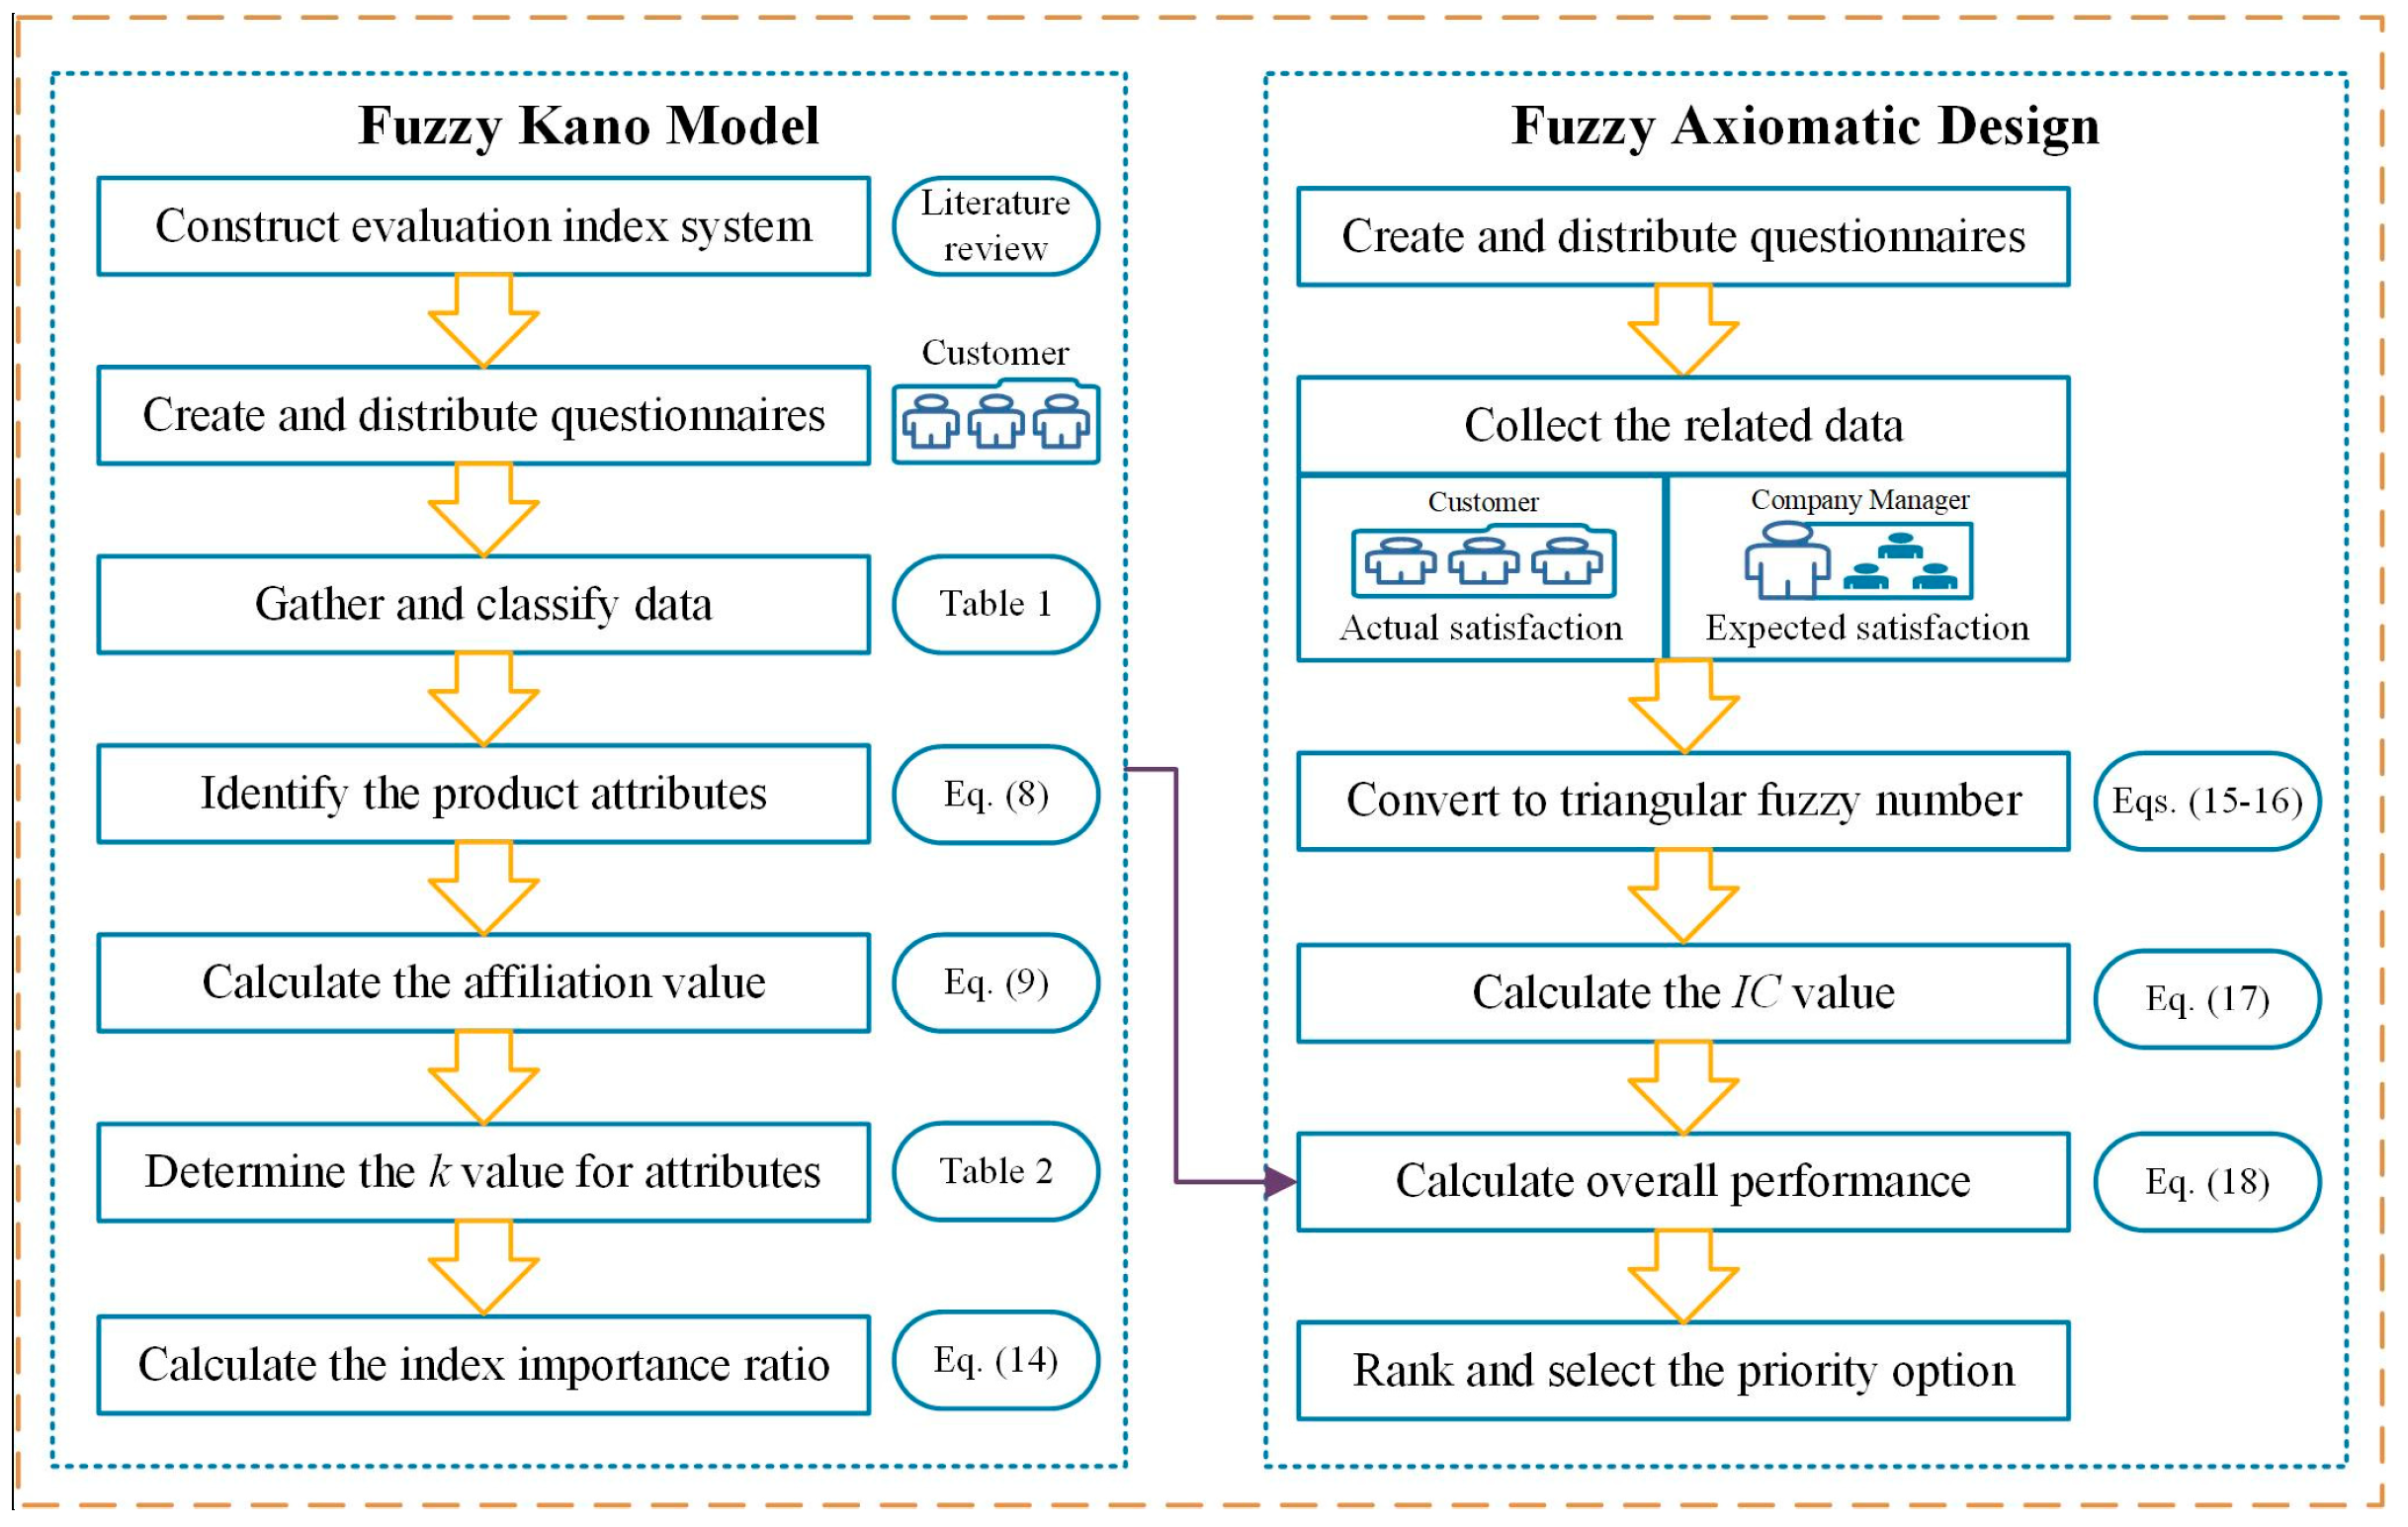
The Kano model is a useful tool for the identification of the attribute categories of indicators; however, past studies have ignored small differences between classification data, resulting in inaccurate and even incorrect decisions. In addition, the nature and importance of each attribute differ among customers. Therefore, in the current study, a novel mixed-class classification method was developed for the Kano model to classify the attributes of different indicators as determined by majority consensus and to assign weights according to the importance of each attribute, which enables managers to understand customer requirements on a deeper level and provides decision support for resilience solution development. We integrated this approach with FAD to solve the problem of satisfaction matching using practical information taken from the perspectives of both the customers and company managers, which helps managers to identify priorities for selecting the best design alternative and improvement targets in the whole NPD process. The framework of the proposed method is shown in Figure 5.

Figure 5.
Framework of the proposed method for NPD.
3.1. Mixed-Class Classification Method
The traditional Kano model uses the highest identification frequency of an attribute agreed on by the majority to determine the attribute category of each indicator. However, in cases when the difference between the indicator attribute values is small, many respondents have conflicting opinions on the attribute classification of indicators, and the traditional Kano model ignores these opinions, resulting in incorrect classification [12].
To better distinguish the differences between Kano attributes for an indicator, the concept of mixed-class and introduced CSs are presented, as follows [10]:
When CS < 6%, there is no obvious difference between the Kano attributes, which should be classified as “mixed”; when CS ≥ 6%, there is a significant difference between Kano attributes, and thus the indicator is classified as a single attribute [10].
As a classical Kano attribute classification method, the CS approach has attracted the attention of many scholars. However, the CS approach is not accurate because it only judges the difference between the highest and the second-highest attributes and cannot classify all attributes. For instance, when the attribute classification value of an indicator is , it should be A + O according to the CS approach, but in fact, the difference between M and O is small, and this indicator should therefore be classified as A + O + M. The current study thus modified the mixed-class classification method as follows:
Let (Q is zero in general) and represent the values of A, O, M, I, and R. Then, rank in descending order and use Equation (8) to judge whether the difference between the highest and the second-highest values is less than 6%. If , the indicator is classified as a single attribute; otherwise, the second-highest attribute should also be considered. Analogously, it is determined that this indicator has t attributes ():
where represents the jth largest value in and .
For instance, when the attribute classification value of an indicator is , the calculated results are as follows:
Hence, the indicator is classified as I + A + O.
Next, calculate the affiliation value to display the degree to which the indicator belongs to a certain attribute by Equation (9), as follows:
where the larger is, the stronger is the belonging to this attribute.
3.2. New Importance Ratio for Attributes
In the Kano model, different attributes have different effects on customer satisfaction because different customers have different views and perspectives on attributes and the importance of product indicators [39]. Therefore, the relationship between customer satisfaction s and product performance q can be expressed as follows [13]:
where k is the adjustment parameter for each Kano attribute.
Assume that and are the existing customer satisfaction level and product performance level, respectively, and that and are the customer’s expected satisfaction level and the customer’s expected product performance level, respectively. Equation (10) can be converted as and , where c is a constant. Therefore, we obtain the following:
Letting be the adjusted importance ratio and be the original importance ratio, we have,
It can be seen from Equation (12) that the value of k will affect the importance and ranking results of indicators. Tan and Shen [13], Chaudha et al. [14], and Avikal et al. [15] defined k values of different attributes. Tan and Shen [38] believed that attribute M is the most important, followed by attribute O; attribute A is relatively unimportant and the value of attribute M is thus the largest and attribute A is the smallest, while attribute I is not considered. Therefore, a possible set of k values could be 0.5, 1, and 2 for attributes M, O, and A, respectively. Chaudha et al. [14] supposed attribute A is the most important and expressed that all attributes would change in a lifecycle; therefore, they cannot be omitted. As such, a possible set of k values can be taken as 0, 0.5, 1, and 1.5 for attributes I, M, O, and A, respectively. Moreover, Chaudha et al. [14] considered the self-stated importance to propose an adjusted importance ratio:
where ; is the satisfaction index; and is the dissatisfaction index. Avikal et al. [14] further considered the importance of attribute R to indicators and stated that and . In addition, based on the principle that attribute R is contrary to attribute O, the k value is set to −1.
The k values of different attributes are shown in Table 2.
Table 2.
k values for different attributes.
Although many studies have focused on the importance of attributes, we can find from Equations (12) and (13) that when an indicator belongs to attribute I, the calculated results are not equal. This does not conform to the definition of attributes in the Kano model. It also influences the accuracy of decision-makers in evaluating problems, thus affecting the selection and implementation of management schemes. For this, we develop a new importance ratio as follows:
where the k values are defined as 0, 0.5, 1, 1.5, and −1 for attributes I, M, O, A, and R, respectively.
3.3. Proposed Procedure
The proposed method is implemented as follows:
- Step 1:
- Design and distribute a questionnaire. Select w indicator and then collect customer demographics and Kano model data. Linguistic variables, such as satisfaction and dissatisfaction, are adopted to collect customer satisfaction and the company’s expected satisfaction for each indicator.
- Step 2:
- Classify the attributes of product indicators. Use Table 1 to evaluate and classify the indicator attributes of the product from the functional and dysfunctional questions of the questionnaire.
- Step 3:
- Calculate the affiliation value . Determine the final attribute of the indicator using Equation (8), and then calculate the value of for each indicator belonging to different attributes using Equation (9).
- Step 4:
- Calculate the value of new importance ratio . Given the value of each indicator obtained from Step 3 and the k value from Table 2, the value of for each indicator can be calculated using Equation (14).
- Step 5:
- Obtain the TFNs of customer satisfaction and the company’s expected satisfaction . The values of customer satisfaction and the company’s expected satisfaction for each indicator can be converted into TFNs using Figure 3 and the following equations:where g is the number of valid questionnaires and r is the number of company managers.
- Step 6:
- Calculate the value of information content . The value of can be calculated using the following equation:where the fuzzy matching area is the overlapping area between the fuzzy range of customer satisfaction and the fuzzy range of the company’s expected satisfaction that satisfies customer requirements. The larger the overlapping area, the more satisfied the customer’s requirements. In other words, the smaller the value, the higher the degree of satisfaction matching between customers and the company, and the better the indicator performance. Otherwise, the indicator should be improved.
- Step 7:
- Calculate overall performance . The overall performance of each indicator can be obtained as follows:
- Step 8:
- Rank alternatives. The improvement order of indicators is determined according to the value. The larger the value, the higher the priority of the indicator.
4. Results
4.1. Implementation and Computation
Company M, founded in 2015, is a manufacturer of medical devices in Guangdong Province, China. One of its major products is disposable surgical masks, which are widely used as a filter barrier to protect the respiratory system and slow down the spread of viruses, especially COVID-19. In order to improve product quality and increase the market share of disposable surgical masks, Company M adopted the proposed method. Four company managers, namely the design manager, the research and development manager, the project manager, and the project general manager (r = 4), each with an average of five years’ experience in the medical manufacturing industry, participated in the survey. These managers used linguistic variables (e.g., high and low) to describe the expected customer satisfaction with various indicators of the company’s existing disposable surgical masks. The main evaluation process was as follows:
- Step 1:
- The 27 indicators presented in Table 3 (w = 27) were selected to investigate customer satisfaction and the satisfaction levels expected by the company. A total of 307 survey responses were received, of which 207 were valid (g = 207), representing a valid response rate of 67.42%. Among them, 42.03% were male and 57.97% were female.
Table 3. Attribute classification results for each indicator.
- Step 2:
- Step 3:
- Table 4 shows the final classification results and affiliation values of each indicator. To highlight the features of the proposed method, we compared our results with those of the traditional Kano model.
Table 4. Affiliation values and classification results for each indicator.
- Steps 4 to 8:
- Table 5 shows the values of , , , , and and lists the rank of each indicator of disposable surgical masks made by Company M. The lower the rank of the indicator is, the higher the preference for it is.
Table 5. Results of , , , , , and ranking.
4.2. Comparative Analysis
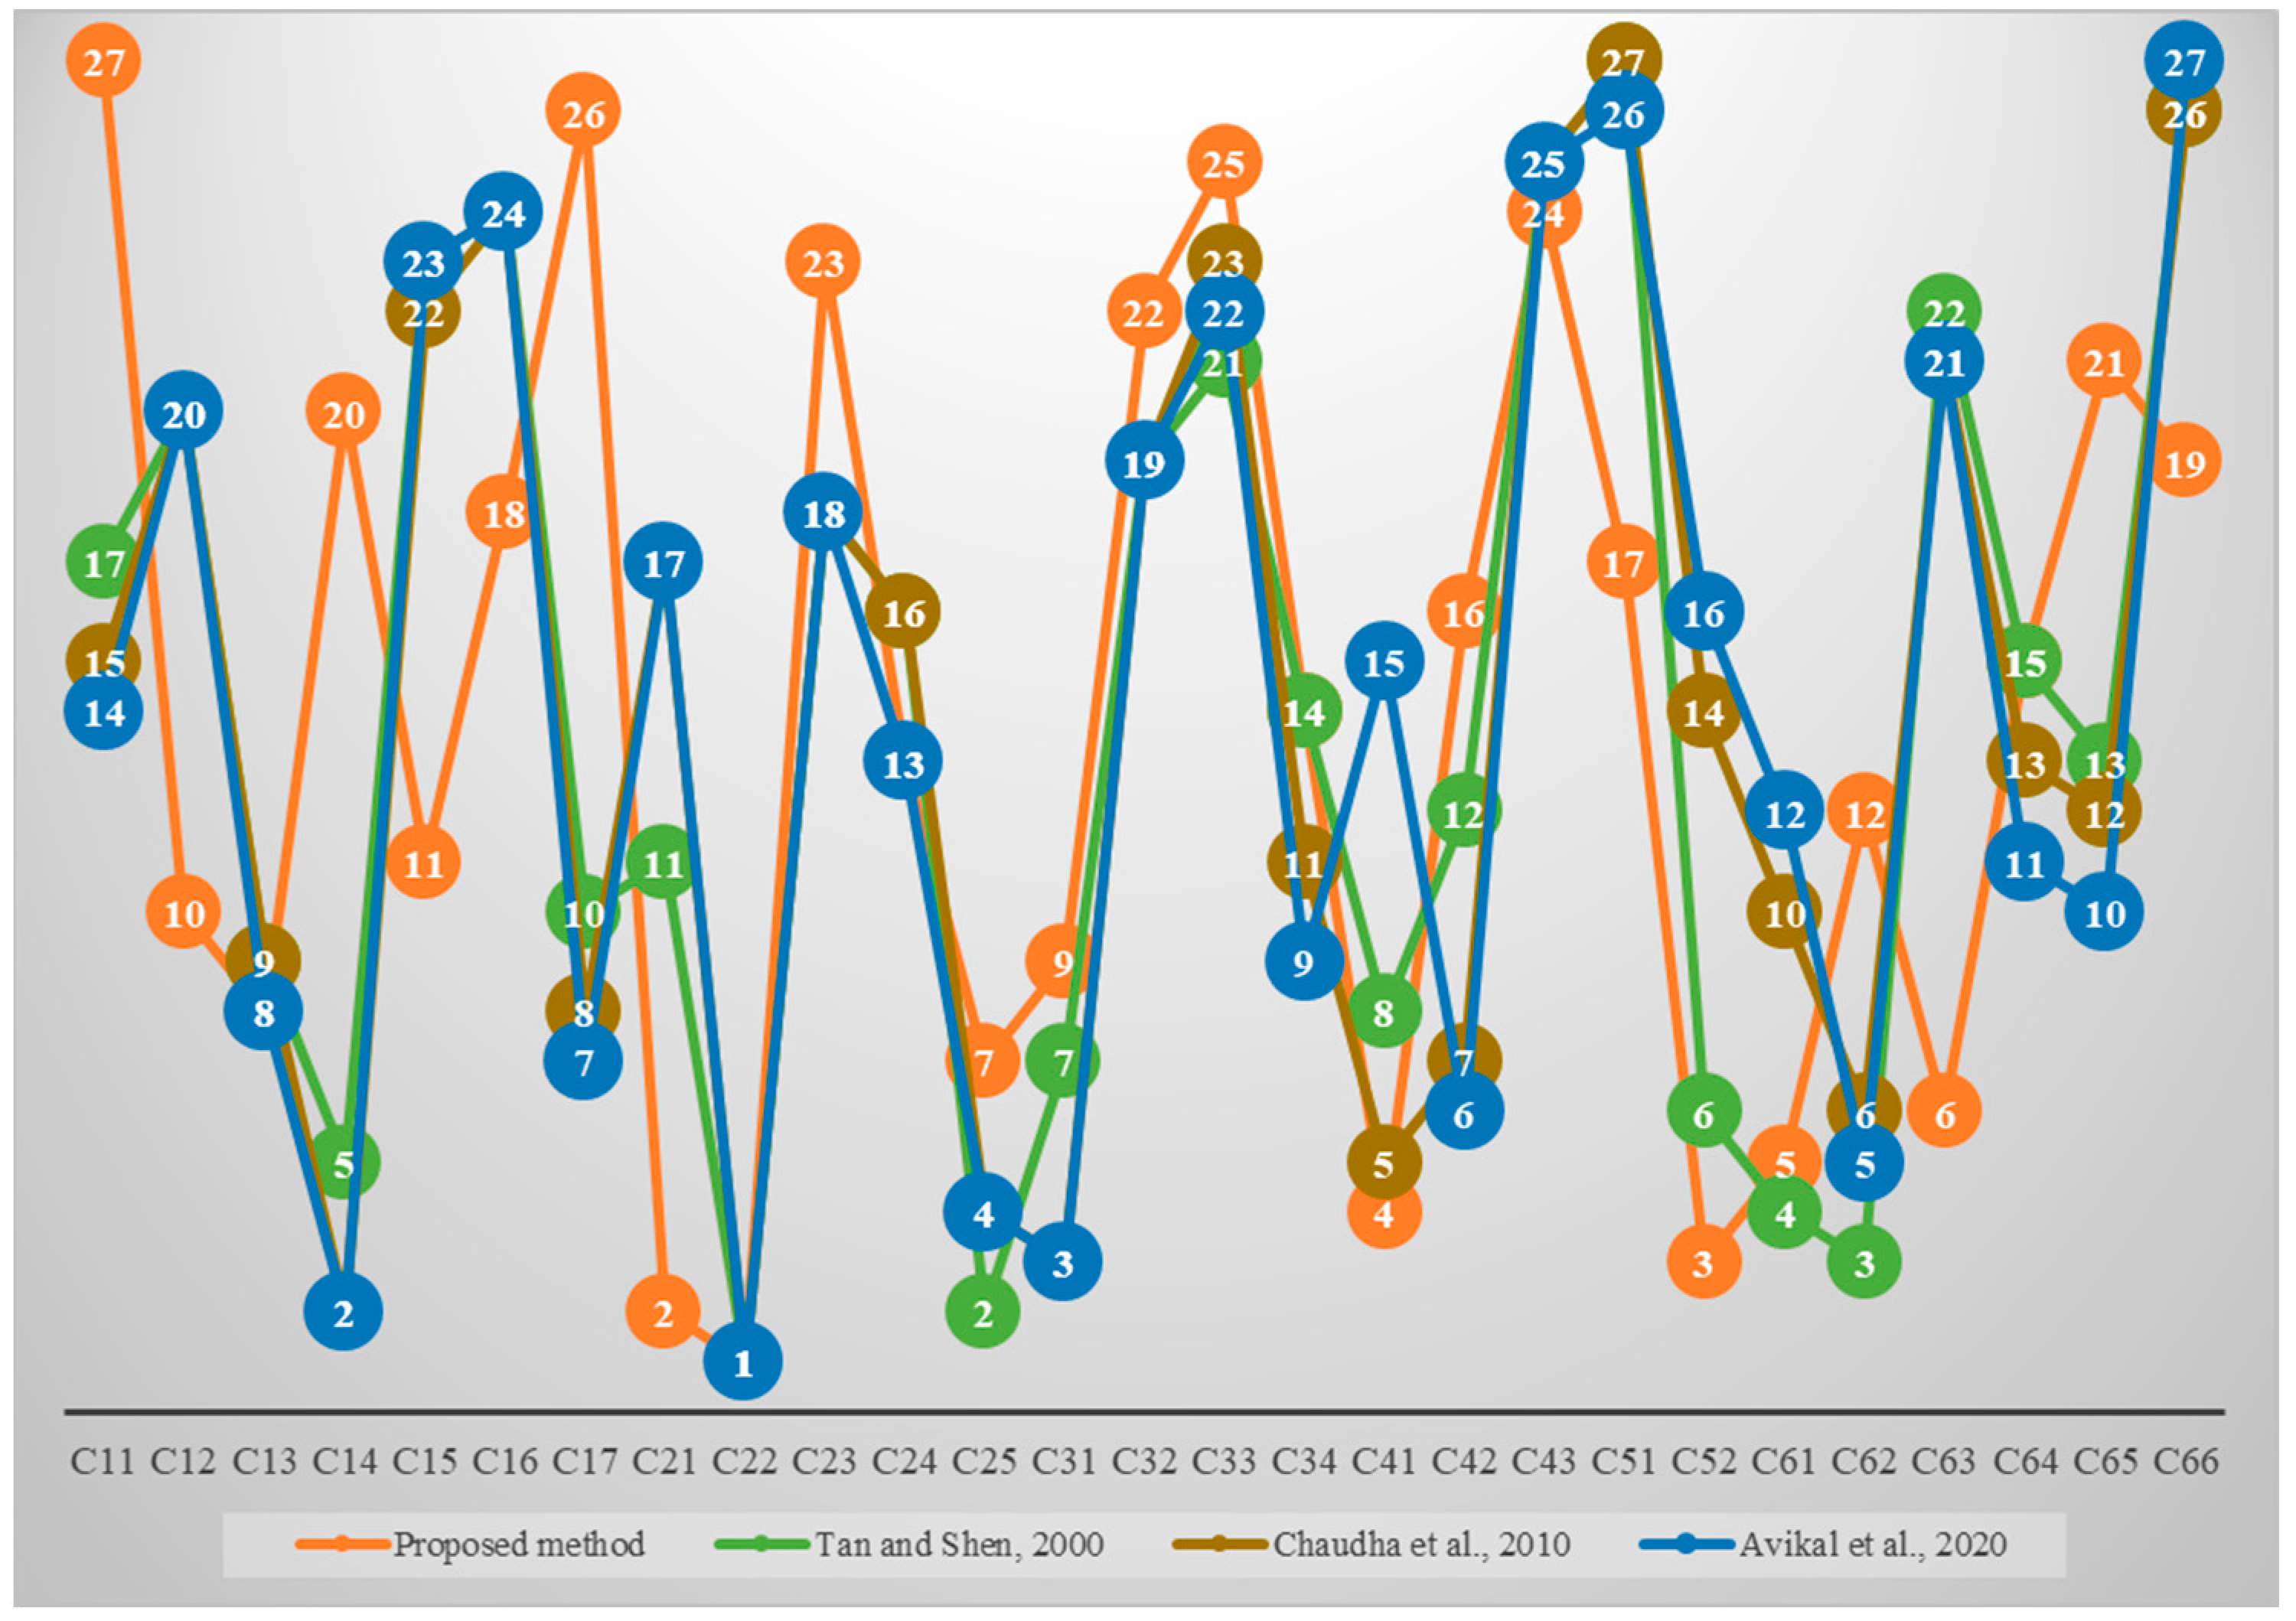
To highlight the advantages of the proposed method, we compared our results with those obtained using the approaches of Tan and Shen [13], Chaudha et al. [14], and Avikal et al. [15] based on the importance ratio. Because Tan and Shen [38] only took the k values of attributes A, O, and M and Chaudha et al. [14] only calculated the k values of attributes A, O, M, and I, for the sake of consistency, we standardized the data in Table 3 using the arithmetic average to obtain the importance ratio results of all methods. It can be seen from Figure 6 that except for breathability (C22), the ranking results of the other three methods differ from our results. This is because Tan and Shen [13] did not take attributes R and I into account in the analysis process, while Chaudha et al. [14] did not realize the importance of attribute R and thus ignored indicators that caused substantial impact. Moreover, the indictor values of attribute I are not equal in the methods proposed by Chaudha et al. [14] and Avikal et al. [15]. Not only does the method proposed in the current study fully consider the importance of the five attributes in the Kano model and the highest recognition frequencies based on the indicator attributes agreed on by the majority, but this method also solves the problem of product development and/or performance improvement from the perspective of both customers and the company by integrating FAD. These modifications improve the reliability and validity of the results. Therefore, the proposed method is an efficient aid for product iteration and service design.

Figure 6.
Results of ranking orders by different methods [13,14,15].
4.3. Sensitivity Analysis
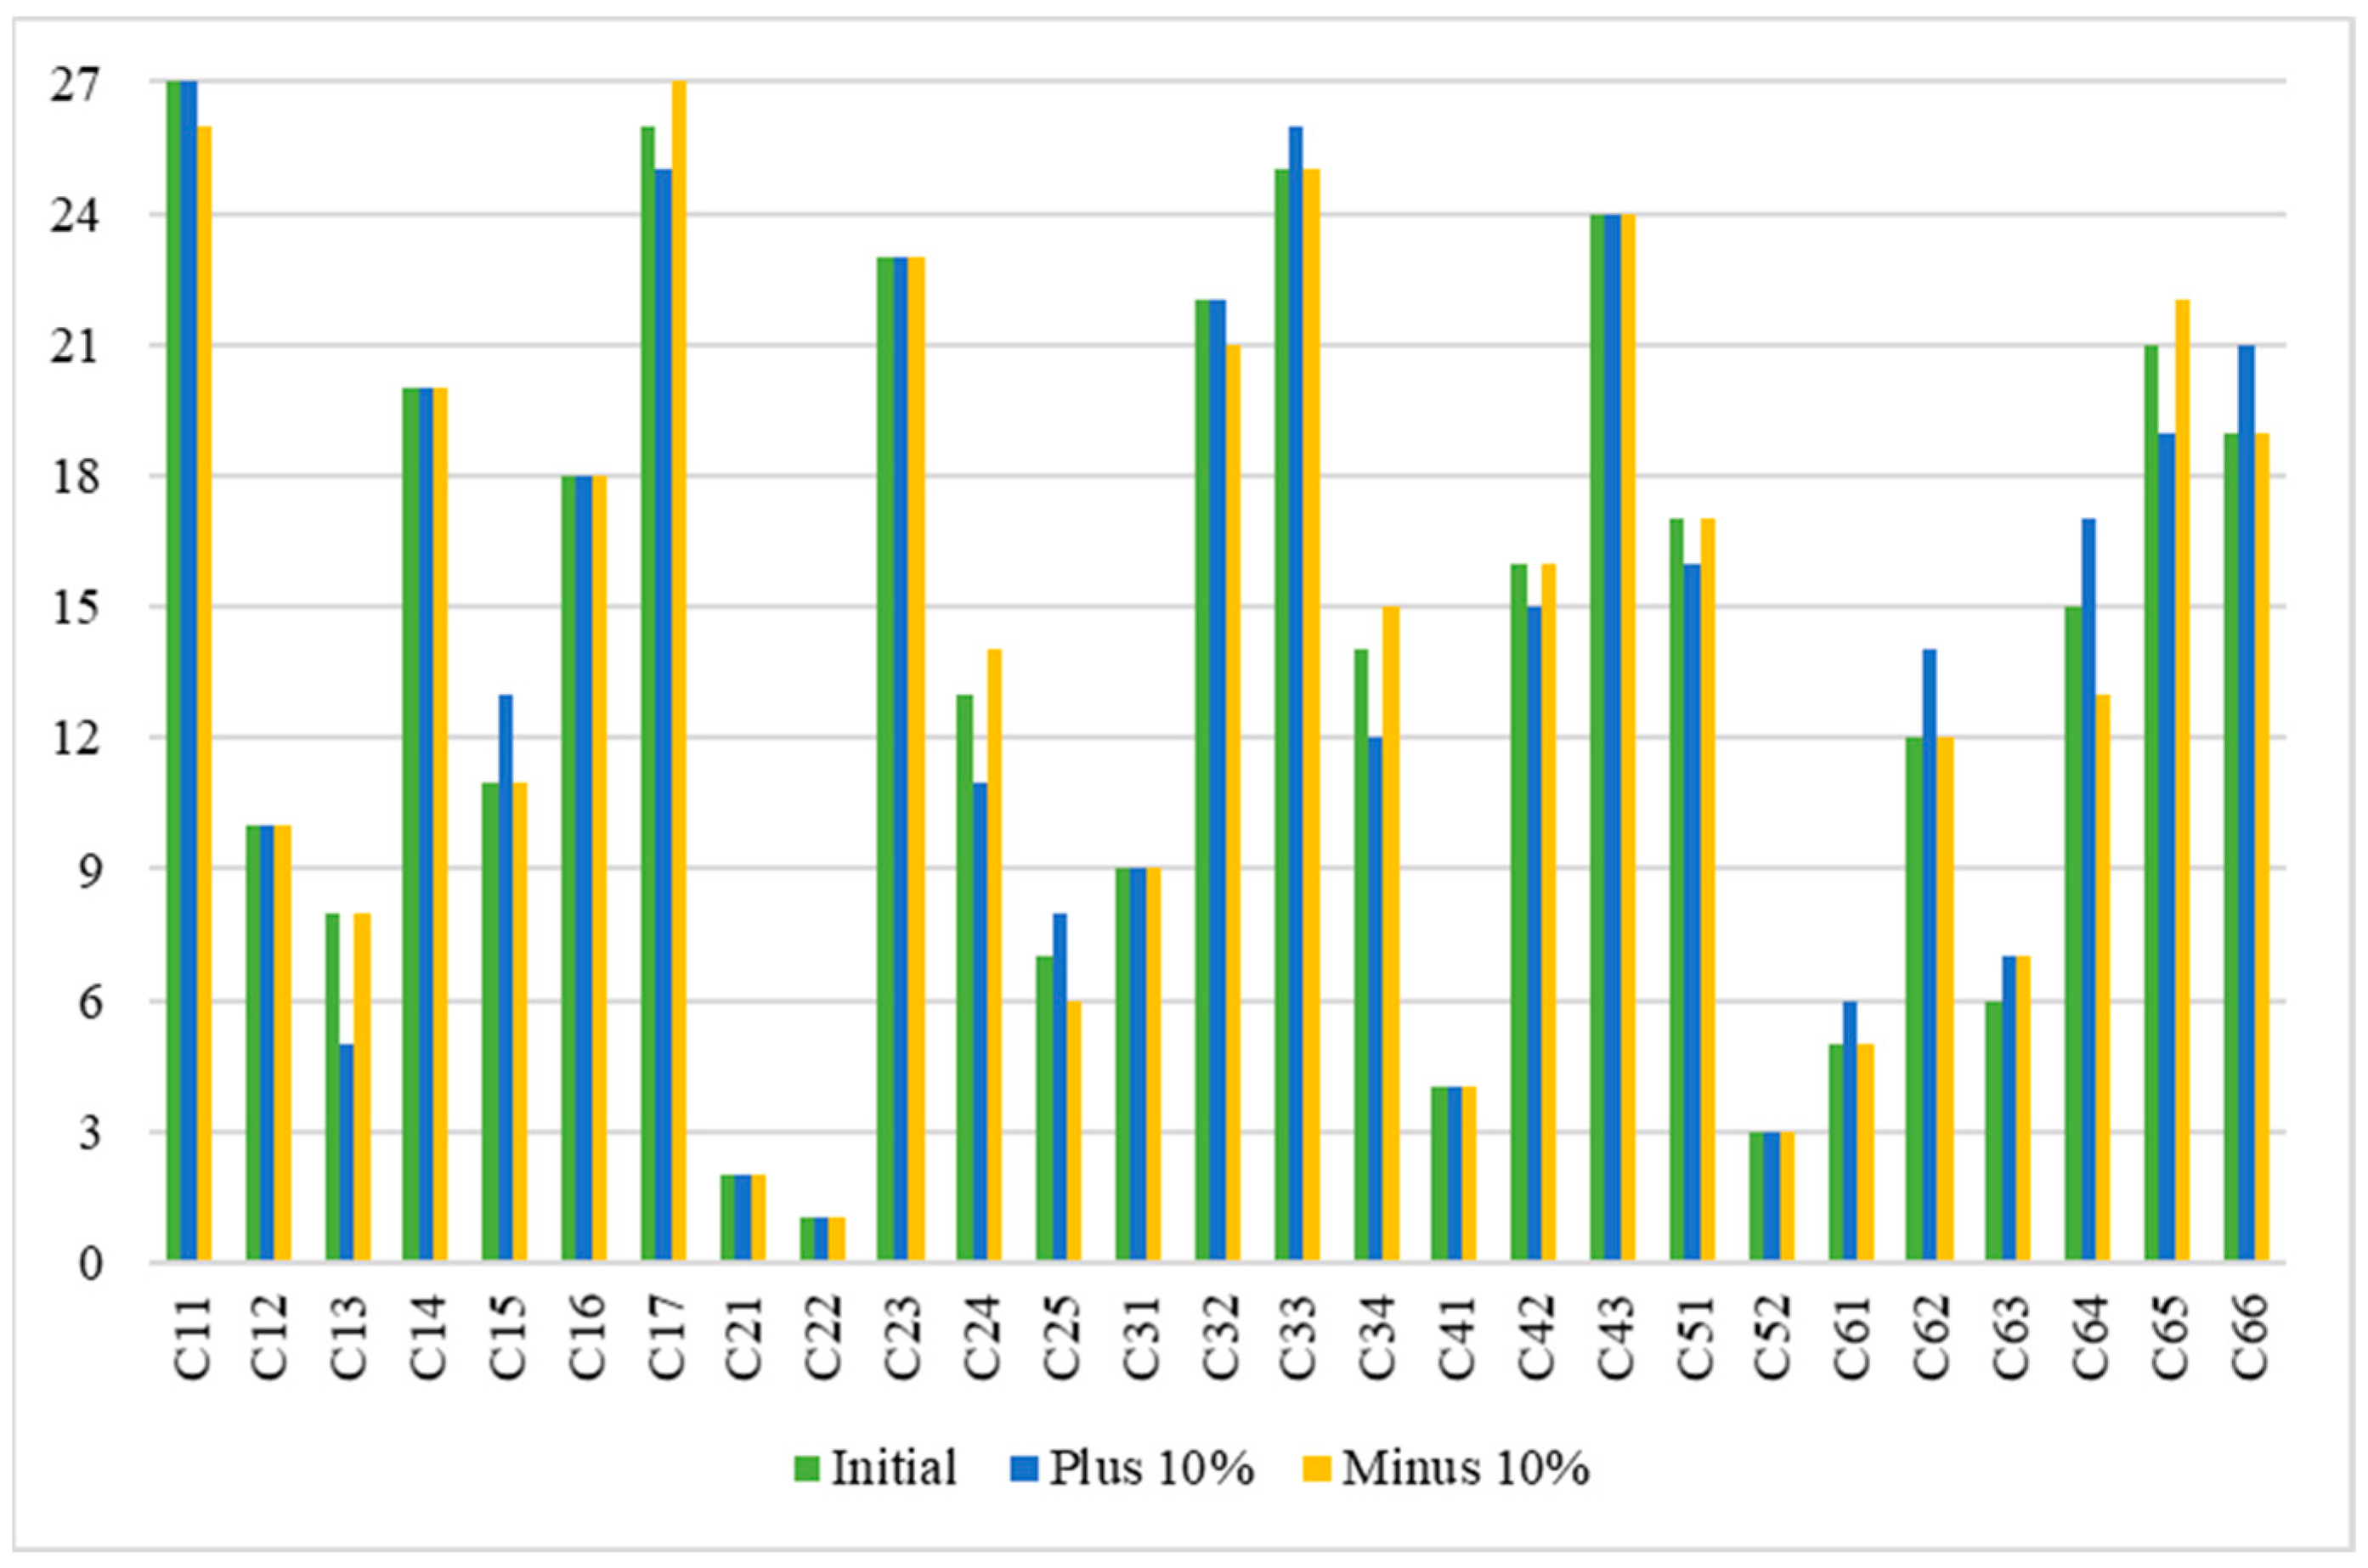
Because response frequencies reflect the classification results of indicator attributes in the Kano model, we set the number of respondents at three levels (0%, 10%, and −10%) to test the impact of response frequencies on decision results. At the first level, there was no change in the number of respondents. In the second and third levels, we prorated the maximum number of responses to other attributes and varied these by up to ±10%. When the number of responses was decreased by 10%, this value was distributed in the same proportion among the other attributes. The same process was performed when 10% was added. In other words, the value needed to increase the maximum number of responses and the other attributes by 10% was reduced by the same proportion. Figure 7 shows that the ranking of the top four attributes in the three levels did not change (C22 > C21 > C52 > C41) because the category remained dominant. This verifies the robustness of the proposed method.
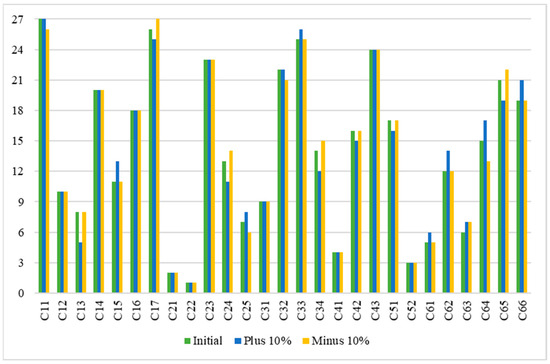
Figure 7.
Sensitivity analysis through changes in the number of respondents.
4.4. Discussion
It can be seen from Table 3 that in several cases, the indicators were classified as attribute A and at the same time attribute I (e.g., C11, C13, C17, C24, and C33). This result positively confirms the findings of Nilsson-Witell and Fundin [17], indicating that the attributes are dynamic and fuzzy, and different customers hold diverse perspectives on the same attribute. Consequently, companies can identify various types of consumer groups through market segmentation, and subsequently formulate targeted marketing strategies and products tailored to better satisfy the distinct needs of each segmented market, thereby improving customer satisfaction.
Table 4 indicates that according to the traditional Kano method, fit (C21) belongs to the attribute I. However, in fact, fit (C21) also exhibits a substantial proportion in both attributes A and O. Through our proposed method, fit (C21) is ranked second in priority for the development of disposable surgical masks (see Table 5). This method is used to better understand the relationship between indicator performance, customer satisfaction, and managers’ cognitive ability, and to address the trade-off dilemma in product development and improvement by identifying key indicators in customer satisfaction.
As shown in Table 5, there is a strong agreement between customer satisfaction and the satisfaction expected by Company M for the factors thickness (C11), appearance (C17), and fragrance (C33). The resource input for these indicators can thus be reduced in future development or improvement. On the other hand, breathability (C22), fit (C21), and recyclability (C52) are key areas for improvement. Since the first impact of the COVID-19 pandemic, people have worn masks for longer periods of time. High levels of breathability and a good fit provide customers with a more comfortable and safe wearing experience, thereby increasing the importance of these indicators. In addition, with the extensive use of masks, customers’ awareness of the associated environmental pollution has also increased. Therefore, Company M should explore the recyclability of disposable surgical masks as well as the use of environmentally friendly materials and the optimization of the production and manufacturing process to reduce waste generation.
It can be seen from Table 5 that after introducing the values of for each indicator, the indicator ranking results changed. Compared with brand (C63), price (C61) was associated with higher levels of satisfaction. However, because the price (C61) belongs to both attributes M and A and brand (C63) only belongs to attribute I, the value of for price (C61) is higher than brand (C63); therefore, price (C61) should be prioritized for improvement. Similarly, the ranking of filtration efficiency (C25), size (C13), moisture-wicking (C31), and other indicators also changed. It is worth noting that attribute R is considered in this paper. Attributes such as reuse (C51) and endorsement (C66) belong to attribute R. The reuse of masks may cause infections and disease due to incomplete cleaning and sterilization and endorsement will increase marketing costs (which will be passed on to customers through increases in the final price). Thus, these indicators should be avoided in the product and service development process to ensure sustainable operations.
Overall, the proposed method is a powerful approach for NPD, but it faces some challenges, such as competitive product analysis and comparison, market uncertainty and volatility, technological limitations, and resource constraints. Therefore, companies must collect and analyze user feedback in a timely manner at each stage of NPD, allocate resources reasonably, and continuously optimize processes to flexibly respond to market changes and technical challenges, thereby increasing the success rate of NPD.
5. Conclusions
NPD is crucial for companies to maintain competitive advantage and sustainable growth. This study proposes a methodological framework to evaluating the performance of disposable surgical masks in fuzzy environments. The proposed method not only helps companies to recognize which product characteristics are critical, but it also identifies which characteristics are irrelevant to customers, which saves resources and optimizes product iteration and service design.
In the proposed method, a questionnaire was used to collect data on customer requirements, customer satisfaction, and the company’s expected levels of satisfaction for each indicator. The attribute classification results and the affiliation values of each indicator were then obtained for the Kano model using a novel mixed-class classification method. A new importance ratio was also used to calculate the attribute importance of each indicator. TFNs were adopted to handle the imprecision and vagueness inherent to linguistic survey data. The proposed approach then incorporated FAD to match customer satisfaction with the levels of satisfaction expected by the company, and the indicators were ranked based on their overall performance. The application of the proposed method to the mask produced by Company M verified its practicality and effectiveness. Furthermore, comparisons with other methods illustrate the method’s superiority and robustness. The proposed method resolves the ambiguity inherent in gathering information from company managers and customers, thereby obtaining a more accurate improvement priority ranking. This approach will provide a valuable reference for product and engineering designers in the development of products and services based on the joint perspective of customers and companies.
Compared with previous studies, this study presents a methodological framework that considers the attributes and importance of each indicator for NPD. Despite these valuable improvements, further issues remain. Directions for future work include the following: (a) Incorporating dynamic measurements of the attributes and importance of each indicator to allow them to change with external conditions. Attention should be paid to objectively and accurately determining the importance and attribute classification of each indicator; (b) Given that managers may tend to overestimate the impact of innovations on customer satisfaction, and the voice of the customer is different from that of engineers, researchers can identify and meet customer needs from different perspectives. Market segmentation based on demographic, psychographic, geographic, and behavioral criteria, as recommended by [53], assists in gaining a more comprehensive understanding of customer preferences and helps companies adjust their strategies accordingly; (c) Sample size and coverage play crucial roles in the final analysis. A more comprehensive survey and an extension of the sample size would ensure more reliable results with greater precision and power; (d) The scope of the proposed method could also be widened to solve other complex multi-attribute decision-making problems, such as the development of electric vehicles, performance improvement of e-service quality, and sustainable supply chain assessment.
Author Contributions
Conceptualization, C.-M.Y.; data curation, S.L. and M.L.; formal analysis, C.-M.Y., S.L. and W.L.; funding acquisition, C.-M.Y.; investigation, S.L. and W.L.; methodology, C.-M.Y., S.L. and K.-S.C.; project administration, K.-S.C., M.L. and W.L.; resources, W.L.; software, S.L.; supervision, C.-M.Y., K.-S.C. and M.L.; validation, K.-S.C.; visualization, M.L.; writing—original draft, C.-M.Y., S.L. and W.L.; writing—review and editing, C.-M.Y., K.-S.C. and M.L. All authors have read and agreed to the published version of the manuscript.
Funding
This research was funded by National Natural Science Foundation of China, grant No. 71762008, the Ministry of Education Humanities and Social Sciences Youth Fund Project, grant No. 22YJC630060, and the Guangxi Philosophy and Social Sciences Research Project, grant No. 23AGL001.
Data Availability Statement
Data are contained within this article.
Conflicts of Interest
The authors declare no conflicts of interest.
References
- Blais, C.; St-Pierre, J.; Bergeron, H. Performance measurement in new product development projects: Findings from successful small and medium enterprises. Int. J. Proj. Manag. 2023, 41, 102451. [Google Scholar] [CrossRef]
- Göçer, F.; Büyüközkan, G. A novel extension of Pythagorean fuzzy MULTIMOORA approach for new product development. Heliyon 2023, 9, e16726. [Google Scholar] [CrossRef] [PubMed]
- Jou, Y.T.; Chen, C.H.; Hwang, C.H.; Lin, W.T.; Huang, S.J. A study on the improvements of new product development procedure performance—An application of design for Six Sigma in a semi-conductor equipment manufacturer. Int. J. Prod. Res. 2010, 48, 5573–5591. [Google Scholar] [CrossRef]
- Chang, C.Y.; Lou, Y.C.; Bei, L.T. Balanced or imbalanced, that is the question: The effect of R&D/marketing power structure on new product development time. J. Eng. Technol. Manag. 2024, 72, 101817. [Google Scholar]
- Huang, S.; Zhang, J.; Yang, C.; Gu, Q.; Li, M.; Wang, W. The interval grey QFD method for new product development: Integrate with LDA topic model to analyze online reviews. Eng. Appl. Artif. Intell. 2022, 114, 105213. [Google Scholar] [CrossRef]
- Zheng, Y.; Jiang, J.; Huang, W.; Wu, X.; Ren, H. Coordination resistance in cross-functional NPD projects: The moderating role of temporal leadership. IEEE Trans. Eng. Manag. 2022, 71, 2138–2152. [Google Scholar] [CrossRef]
- Kano, N.; Seraku, N.; Takahashi, F.; Tsuji, S. Attractive quality and must-be quality. J. Jpn. Soc. Qual. Control 1984, 14, 147–156. [Google Scholar]
- Wu, T.; Liu, X.; Qin, J.; Herrera, F. An interval type-2 fuzzy Kano-prospect-TOPSIS based QFD model: Application to Chinese e-commerce service design. Appl. Soft Comput. 2021, 111, 107665. [Google Scholar] [CrossRef]
- Lee, Y.C.; Sheu, L.C.; Tsou, Y.G. Quality function deployment implementation based on Fuzzy Kano model: An application in PLM system. Comput. Ind. Eng. 2008, 55, 48–63. [Google Scholar] [CrossRef]
- Lee, M.C.; Newcomb, J.F. Applying the Kano methodology to meet customer requirements: NASA’s microgravity science program. Qual. Manag. J. 1997, 4, 95–106. [Google Scholar] [CrossRef]
- Madzík, P. Increasing accuracy of the Kano model-a case study. Total Qual. Manag. Bus. 2018, 29, 387–409. [Google Scholar] [CrossRef]
- Ilbahar, E.; Çebi, S. Classification of design parameters for E-commerce websites: A novel fuzzy Kano approach. Telemat. Inform. 2017, 34, 1814–1825. [Google Scholar] [CrossRef]
- Tan, K.C.; Shen, X.X. Integrating Kano’s model in the planning matrix of quality function deployment. Total Qual. Manag. 2000, 11, 1141–1151. [Google Scholar] [CrossRef]
- Chaudha, A.; Jain, R.; Singh, A.R.; Mishra, P.K. Integration of Kano’s Model into quality function deployment (QFD). Int. J. Adv. Manuf. Technol. 2011, 53, 689–698. [Google Scholar] [CrossRef]
- Avikal, S.; Singh, R.; Rashmi, R. QFD and Fuzzy Kano model based approach for classification of aesthetic attributes of SUV car profile. J. Intell. Manuf. 2020, 31, 271–284. [Google Scholar] [CrossRef]
- Taimouri, A.; Emamisaleh, K.; Mohammadi, D. Assessing the usability of online food ordering websites using a new fuzzy Kano method: Implications for improvement. Int. J. Bus. Manag. 2019, 14, 87–100. [Google Scholar] [CrossRef]
- Nilsson-Witell, L.; Fundin, A. Dynamics of service attributes: A test of Kano’s theory of attractive quality. Int. J. Serv. Ind. Manag. 2005, 16, 152–168. [Google Scholar] [CrossRef]
- Florez-Lopez, R.; Ramon-Jeronimo, J.M. Managing logistics customer service under uncertainty: An integrative fuzzy Kano framework. Inform. Sci. 2012, 202, 41–57. [Google Scholar] [CrossRef]
- Materla, T.; Cudney, E.A.; Antony, J. The application of Kano model in the healthcare industry: A systematic literature review. Total Qual. Manag. Bus. 2019, 30, 660–681. [Google Scholar] [CrossRef]
- Djekic, I.; Ilic, J.; Guiné, R.P.F.; Tomasevic, I. Can we understand food oral processing using Kano model? Case study with confectionery products. J. Texture Stud. 2020, 51, 861–869. [Google Scholar] [CrossRef]
- Tseng, C.C. An IPA-Kano model for classifying and diagnosing airport service attributes. Res. Transp. Bus. Manag. 2020, 37, 100499. [Google Scholar] [CrossRef]
- Salahuddin, M.; Lee, Y.A. Identifying key quality features for wearable technology embedded products using the Kano model. Int. J. Cloth. Sci. Technol. 2020, 33, 93–105. [Google Scholar] [CrossRef]
- Pandey, A.; Sahu, R.; Joshi, Y. Kano model application in the tourism industry: A systematic literature review. J. Qual. Assur. Hosp. Tour. 2022, 23, 1–31. [Google Scholar] [CrossRef]
- Zoghi, M.; Rostami, G.; Khoshand, A.; Motalleb, F. Material selection in design for deconstruction using Kano model, fuzzy-AHP and TOPSIS methodology. Waste Manag. Res. 2022, 40, 410–419. [Google Scholar] [CrossRef]
- Zhang, J.; Chen, D.; Lu, M. Combining sentiment analysis with a fuzzy Kano model for product aspect preference recommendation. IEEE Access 2018, 6, 59163–59172. [Google Scholar] [CrossRef]
- Suh, N.P. Axiomatic Design: Advances and Applications; Oxford University Press: New Yok, NY, USA, 2001. [Google Scholar]
- Orbak, A.Y.; Korkmaz, Ş.; Aydın, F.U. Application of quality function deployment and axiomatic design for design choice of intercity bus seats. Int. J. Eng. Trends Technol. 2021, 69, 83–91. [Google Scholar] [CrossRef]
- Alipour, A.; Ashtiani, M.A.S.; Shahmiri, F. Using axiomatic design approach in preliminary design of a blended wing body aircraft. Aircr. Eng. Aerosp. Technol. 2022, 94, 837–847. [Google Scholar] [CrossRef]
- Kulak, O.; Kahraman, C. Fuzzy multi-attribute selection among transportation companies using axiomatic design and analytic hierarchy process. Inform. Sci. 2005, 170, 191–210. [Google Scholar] [CrossRef]
- Karatas, M. Hydrogen energy storage method selection using fuzzy axiomatic design and analytic hierarchy process. Int. J. Hydrogen Energy 2020, 45, 16227–16238. [Google Scholar] [CrossRef]
- Wu, X.; Liao, H. Utility-based hybrid fuzzy axiomatic design and its application in supply chain finance decision making with credit risk assessments. Comput. Ind. 2020, 114, 103144. [Google Scholar]
- Feng, J. Wind farm site selection from the perspective of sustainability: A novel satisfaction degree-based fuzzy axiomatic design approach. Int. J. Energy Res. 2021, 45, 1097–1127. [Google Scholar] [CrossRef]
- Ilbahar, E.; Çebi, S.; Kahraman, C. A multi-criteria assessment of biomass conversion technologies with Pythagorean fuzzy axiomatic design approach. J. Mult.-Valued Log. Soft Comput. 2021, 37, 317–334. [Google Scholar]
- Gölcük, İ. An interval type-2 fuzzy axiomatic design method: A case study for evaluating blockchain deployment projects in supply chain. Inform. Sci. 2022, 602, 159–183. [Google Scholar] [CrossRef]
- Khalili-Damghani, K.; Sadi-Nezhad, S. A hybrid fuzzy multiple criteria group decision making approach for sustainable project selection. Appl. Soft Comput. 2013, 13, 339–352. [Google Scholar] [CrossRef]
- Awasthi, A.; Omrani, H. A goal-oriented approach based on fuzzy axiomatic design for sustainable mobility project selection. Int. J. Syst. Sci-Oper. 2019, 6, 86–98. [Google Scholar] [CrossRef]
- van Laarhoven, P.J.M.; Pedrycz, W. A fuzzy extension of Saaty’s priority theory. Fuzzy Sets Syst. 1983, 11, 229–241. [Google Scholar] [CrossRef]
- Earl, C. Axiomatic design advances and applications. Des. Stud. 2003, 24, 391–392. [Google Scholar] [CrossRef]
- Cohen, L. Quality Function Deployment: How to Make QFD Work for You; Addison-Wesley: Boston, MA, USA, 1995. [Google Scholar]
- Lee, K.P.; Yip, J.; Kan, C.W.; Chiou, J.C.; Yung, K.F. Reusable face masks as alternative for disposable medical masks: Factors that affect their wear-comfort. Int. J. Environ. Res. Public Health 2020, 17, 6623. [Google Scholar] [CrossRef]
- Rogak, S.N.; Sipkens, T.A.; Guan, M.; Nikookar, H.; Figueroa, D.V.; Wang, J. Properties of materials considered for improvised masks. Aerosol Sci. Technol. 2021, 55, 398–413. [Google Scholar] [CrossRef]
- de Silva, A.P.; Niriella, M.A.; de Silva, H.J. Masks in COVID-19: Let’s unmask the evidence. Expert Rev. Resp. Med. 2021, 15, 293–299. [Google Scholar] [CrossRef]
- Saberian, M.; Li, J.; Kilmartin-Lynch, S.; Boroujeni, M. Repurposing of COVID-19 single-use face masks for pavements base/subbase. Sci. Total Environ. 2021, 769, 145527. [Google Scholar] [CrossRef] [PubMed]
- Lee, A.W.L.; Neo, E.R.K.; Khoo, Z.Y.; Yeo, Z.; Tan, Y.S.; Chng, S.; Yan, W.; Lok, B.K.; Low, J.S.C. Life cycle assessment of single-use surgical and embedded filtration layer (EFL) reusable face mask. Resour. Conserv. Recy. 2021, 170, 105580. [Google Scholar] [CrossRef] [PubMed]
- Sobuj, M.; Alam, M.A.; Zannat, A. Evaluation of face masks quality features using Kano model and unsupervised machine learning technique. Res. J. Text. Appar. 2023, 27, 560–572. [Google Scholar] [CrossRef]
- Matuschek, C.; Moll, F.; Fangerau, H.; Fischer, J.C.; Zänker, K.; van Griensven, M.; Schneider, M.; Kindgen-Milles, D.; Knoefel, W.T.; Lichtenberg, A.; et al. Face masks: Benefits and risks during the COVID-19 crisis. Eur. J. Med. Res. 2020, 25, 32. [Google Scholar] [CrossRef]
- Price, A.; Cui, Y.; Liao, L.; Xiao, W.; Yu, X.; Wang, H.; Zhao, M.; Wang, Q.; Chu, S.; Chu, L. Is the fit of N95 facial masks effected by disinfection? A study of heat and UV disinfection methods using the OSHA protocol fit test. medRxiv 2020. [Google Scholar] [CrossRef]
- Doyon, V.C.; Khosravi-Hafshejani, T.; Richer, V. An added benefit of masks during the COVID-19 pandemic: Ultraviolet protection. J. Cutan. Med. Surg. 2022, 26, 63–70. [Google Scholar] [CrossRef]
- Fabiani, C.; Cavagnoli, S.; Chiatti, C.; Pisello, A.L. Management of disposable surgical masks for tackling pandemic-generated pollution: Thermo-acoustic investigations and life cycle assessment of novel recycled building panels. Resour. Conserv. Recy. 2022, 186, 106509. [Google Scholar] [CrossRef]
- Blattberg, R.C.; Neslin, S.A. Sales promotion models. Handb. Oper. Res. Manag. Sci. 1993, 5, 553–609. [Google Scholar]
- Bruce, M.; Daly, L. Design and marketing connections: Creating added value. J. Market. Manag. 2007, 23, 929–953. [Google Scholar] [CrossRef]
- Hoch, S.J. Product experience is seductive. J. Consum. Res. 2002, 29, 448–454. [Google Scholar] [CrossRef]
- Weinstein, A.T. Market Segmentation: Using Demographics, Psychographics and Other Niche Marketing Techniques to Predict and Model Consumer Behavior; Probus Publishing: Chicago, IL, USA, 1994. [Google Scholar]

Disclaimer/Publisher’s Note: The statements, opinions and data contained in all publications are solely those of the individual author(s) and contributor(s) and not of MDPI and/or the editor(s). MDPI and/or the editor(s) disclaim responsibility for any injury to people or property resulting from any ideas, methods, instructions or products referred to in the content. |
© 2024 by the authors. Licensee MDPI, Basel, Switzerland. This article is an open access article distributed under the terms and conditions of the Creative Commons Attribution (CC BY) license (https://creativecommons.org/licenses/by/4.0/).