Article

Evaluation and Optimization Research on the Spatial Distribution of Automated External Defibrillators Based on a Genetic Algorithm: A Case Study of Central Urban District of Nanjing, China

by
Ge Shi
1,2,
Jiahang Liu
1,2,
Chuang Chen
1,3,
Jingran Zhang
1,*,
Jinghai Xu
1,2,
Yu Chen
1,2,
Jiaming Na
4 and
Wei Chen
1
1
Institute for Emergency Governance and Policy, Nanjing Tech University, Nanjing 211816, China
2
School of Geomatics Science and Technology, Nanjing Tech University, Nanjing 211816, China
3
College of Electrical Engineering and Control Science, Nanjing Tech University, Nanjing 211816, China
4
College of Civil Engineering, Nanjing Forestry University, Nanjing 210037, China
*
Author to whom correspondence should be addressed.
Systems 2025, 13(1), 64; https://doi.org/10.3390/systems13010064
Submission received: 22 September 2024 / Revised: 13 January 2025 / Accepted: 15 January 2025 / Published: 20 January 2025

Abstract

:
Automated external defibrillators (AEDs) are portable emergency medical devices critical for resuscitating individuals experiencing sudden cardiac arrest. The installation of AEDs in public spaces is essential for enhancing society’s emergency response capabilities. However, many cities in China currently face issues such as inadequate AEDs deployment and uneven distribution. This study aims to explore a rational layout plan for AEDs through systematic site optimization. Initially, this paper evaluates the current spatial configuration of AEDs in the central urban district of Nanjing using various spatial analysis methods. Subsequently, a coverage model is constructed to simulate the coverage capacity of potential emergency needs for new facilities, and a genetic algorithm is utilized to solve it. Finally, an AED site selection experiment is conducted, and the site selection results are discussed and analyzed in conjunction with practical conditions. The research conclusions are as follows: (1) AED distribution in Nanjing’s central urban district is clustered, with some areas lacking facilities, and the coverage rate of AEDs within 100 m and 200 m ranges is relatively low, particularly across different types of venues; and (2) the optimization experiment, with 90 new site selection points, effectively addressed AED distribution gaps, significantly improved coverage, and ameliorated the overall distribution across various public venues. This study provides a scientific basis for the rational placement of AEDs in urban public spaces through systematic analysis and optimization experiments. It enhances the efficiency of current AED deployment in the main urban areas of Nanjing and offers significant insights for the optimization of urban emergency resource allocation.

1. Introduction

Automated external defibrillators (AEDs) are portable emergency medical devices designed for the resuscitation of patients experiencing sudden cardiac arrest. Due to their user-friendly operation and significant improvements in the success rate of resuscitation, AEDs are widely deployed in public places. In the pre-hospital emergency care system, increasing the number of AEDs and optimizing their deployment locations are not only effective methods for enhancing the community’s emergency response capabilities but are also crucial for safeguarding the life and health safety of urban citizens [1,2]. In recent years, governments at all levels in China have been introducing policies and revising laws to promote the construction of emergency care capabilities, repeatedly emphasizing the need to “strengthen the deployment of automated external defibrillators in public places.” However, the development of AEDs in China is still relatively lagging, with most cities at the initial stage, facing situations such as insufficient numbers and uneven distribution [3,4]. Therefore, the rational planning of AED locations has become a focal point of current research.
Urban public service facilities include a variety of amenities such as medical, educational, and sports facilities, and the optimization of their allocation is a classic issue in geography [5,6,7]. Scholars have already made significant progress in spatial configuration and optimization. In terms of spatial configuration, analyzing the spatial distribution of facilities can reveal the regularity and deviation of facility layout in cities, which is of great importance for understanding the structure of facility layout and enhancing urban service capabilities. Existing research mainly focuses on the balance and accessibility of facility distribution, often employing methods such as kernel density analysis [8], k-means clustering [9], spatial autocorrelation [10], geographically weighted regression [11], and the two-step floating catchment area (2SFCA) method [12] to assess the spatial configuration of facility distribution. For instance, Huang [13] utilized multi-source geospatial data to study the allocation of various facilities, including medical and educational ones; Tan [14] used a coupling coordination development model to analyze the rationality of the distribution of public fitness service facilities. In recent years, discussions on the fairness of facility services and the supply–demand relationship have been increasing. Many studies have focused on the preference for public service facilities among different social groups, such as children [15], women [16], and the elderly [17,18]. Additionally, socioeconomic status [19] and ethnicity [20] have also been considered as important factors in the discussion. For example, Tahmasbi et al. [21] assessed the fairness of retail chain store distribution for low-income populations using a multimodal gravity model; Liu et al. [22] discussed the accessibility of medical resources based on public transportation, taking into account racial differences. Secondly, in spatial optimization, reasonable site optimization can maximize resource utilization efficiency while enhancing facility coverage and service response speed. Classic site selection models include the P-center model [23], P-median model [24], maximum coverage model [25], and set covering model [26]. These models propose various site selection strategies based on different optimization objectives (such as maximizing the number of facilities covered [27], minimizing travel distance [28], etc.), providing a theoretical foundation for site selection optimization research. As societal needs become more diverse and complex, site selection research is also evolving, gradually transitioning from single-objective to multi-objective, multi-level models. For example, Aydin [29] established a decision-dependent, multi-objective, and multi-period stochastic model to minimize costs, distances, and carbon emissions for the site selection optimization of public parking lots; Jiang et al. [30] combined the concepts of maximum coverage and set coverage with the L-A model, taking into account factors such as land type, building function, crime characteristics, and road congestion to perform multi-criteria optimization for the layout of police stations in cities. Additionally, heuristic algorithms such as genetic algorithms [31,32,33], simulated annealing [34], and particle swarm optimization [35] are widely applied to site selection optimization problems, particularly showing high efficiency and accuracy in large-scale, complex site selection optimizations.
Existing research has achieved certain results in the optimization of public service facility allocation, but AEDs, as medical emergency facilities with a small service range and short response time, present unique challenges in their optimization that differ from general medical facilities or public service facilities. In response, scholars have conducted extensive research, exploring the optimization of AED deployment from multiple perspectives. Lin et al. [36] constructed a novel AED deployment optimization scheme tailored for the unique elongated urban structure. Lorenzo et al. [37] focused on residential areas and proposed a new strategy for AED layout. Zhang et al. [38] employed a superimposed spatiotemporal optimization method, assessing the effectiveness of new AEDs through cost–effectiveness curves. Aeby et al. [39] integrated past out-of-hospital cardiac arrest (OHCA) events with the existing distribution of AEDs to identify OHCA hotspots not covered by AEDs, thereby re-planning the AED layout. Additionally, some scholars have employed mathematical optimization techniques [6], mixed integer non-linear models [7], or spatiotemporal models [33] to study the spatial optimization of AEDs.
In recent years, in Chinese society, with vigorous promotion and advocacy by government agencies and social organizations, the public’s awareness of first aid has been gradually increasing. Emergency medical devices, such as AEDs, are increasingly drawing attention. As a result, an increasing number of scholars have focused on the distribution of AEDs in Chinese cities. Chen et al. [3] developed a GIS-based model to optimize the spatial layout of AEDs in Hangzhou City. Liao et al. [40] utilized data from a WeChat mini-program to compare the equity of AED distribution between Shenzhen and Guangzhou. Some studies have assessed the awareness levels of AEDs among residents in different cities through methods such as surveys [41,42]. However, in China, although research on AEDs is gradually increasing, existing studies still have some shortcomings. For instance, some studies lack empirical analysis and may not fully reflect actual conditions; moreover, the research perspectives are relatively singular, failing to effectively integrate facility characteristics and lacking comprehensive consideration of multi-dimensional and multi-objective factors. Overall, most domestic research related to AEDs is qualitative, with relatively fewer studies focusing on optimizing their spatial layout.
This study systematically evaluates the current distribution and optimized layout of AEDs in Nanjing, China, focusing on spatial configuration and site selection optimization. By integrating various spatial analysis methods, a coverage site selection model based on genetic algorithms is proposed. The model is capable of self-adjustment and evolution, providing effective optimization solutions for multi-objective systems by simulating the system’s self-organization process and dynamically adjusting and optimizing its structure to adapt to environmental changes. The development of AED deployment in most Chinese cities has been slow, but Nanjing, with its relatively advanced AEDs infrastructure, serves as a representative case for studying the spatial distribution of such equipment. This analysis not only provides a valuable reference for other cities in China but also establishes a theoretical framework for enhancing urban emergency response capabilities. Furthermore, by identifying deficiencies in the spatial distribution of AEDs, this study constructs a coverage site selection model, which is solved using genetic algorithms, and proposes a practical AED layout optimization plan. By combining quantitative analysis with spatial optimization, the research findings are more feasible and practically instructive. The aim of this study is to explore scientific methods for the placement of AEDs in urban public spaces, providing effective guidance for the rational allocation of emergency medical resources in Nanjing. This research not only enhances the city’s emergency response capabilities but also lays the theoretical foundation and offers practical references for future AED planning and layout that are scientifically sound and reasonable.

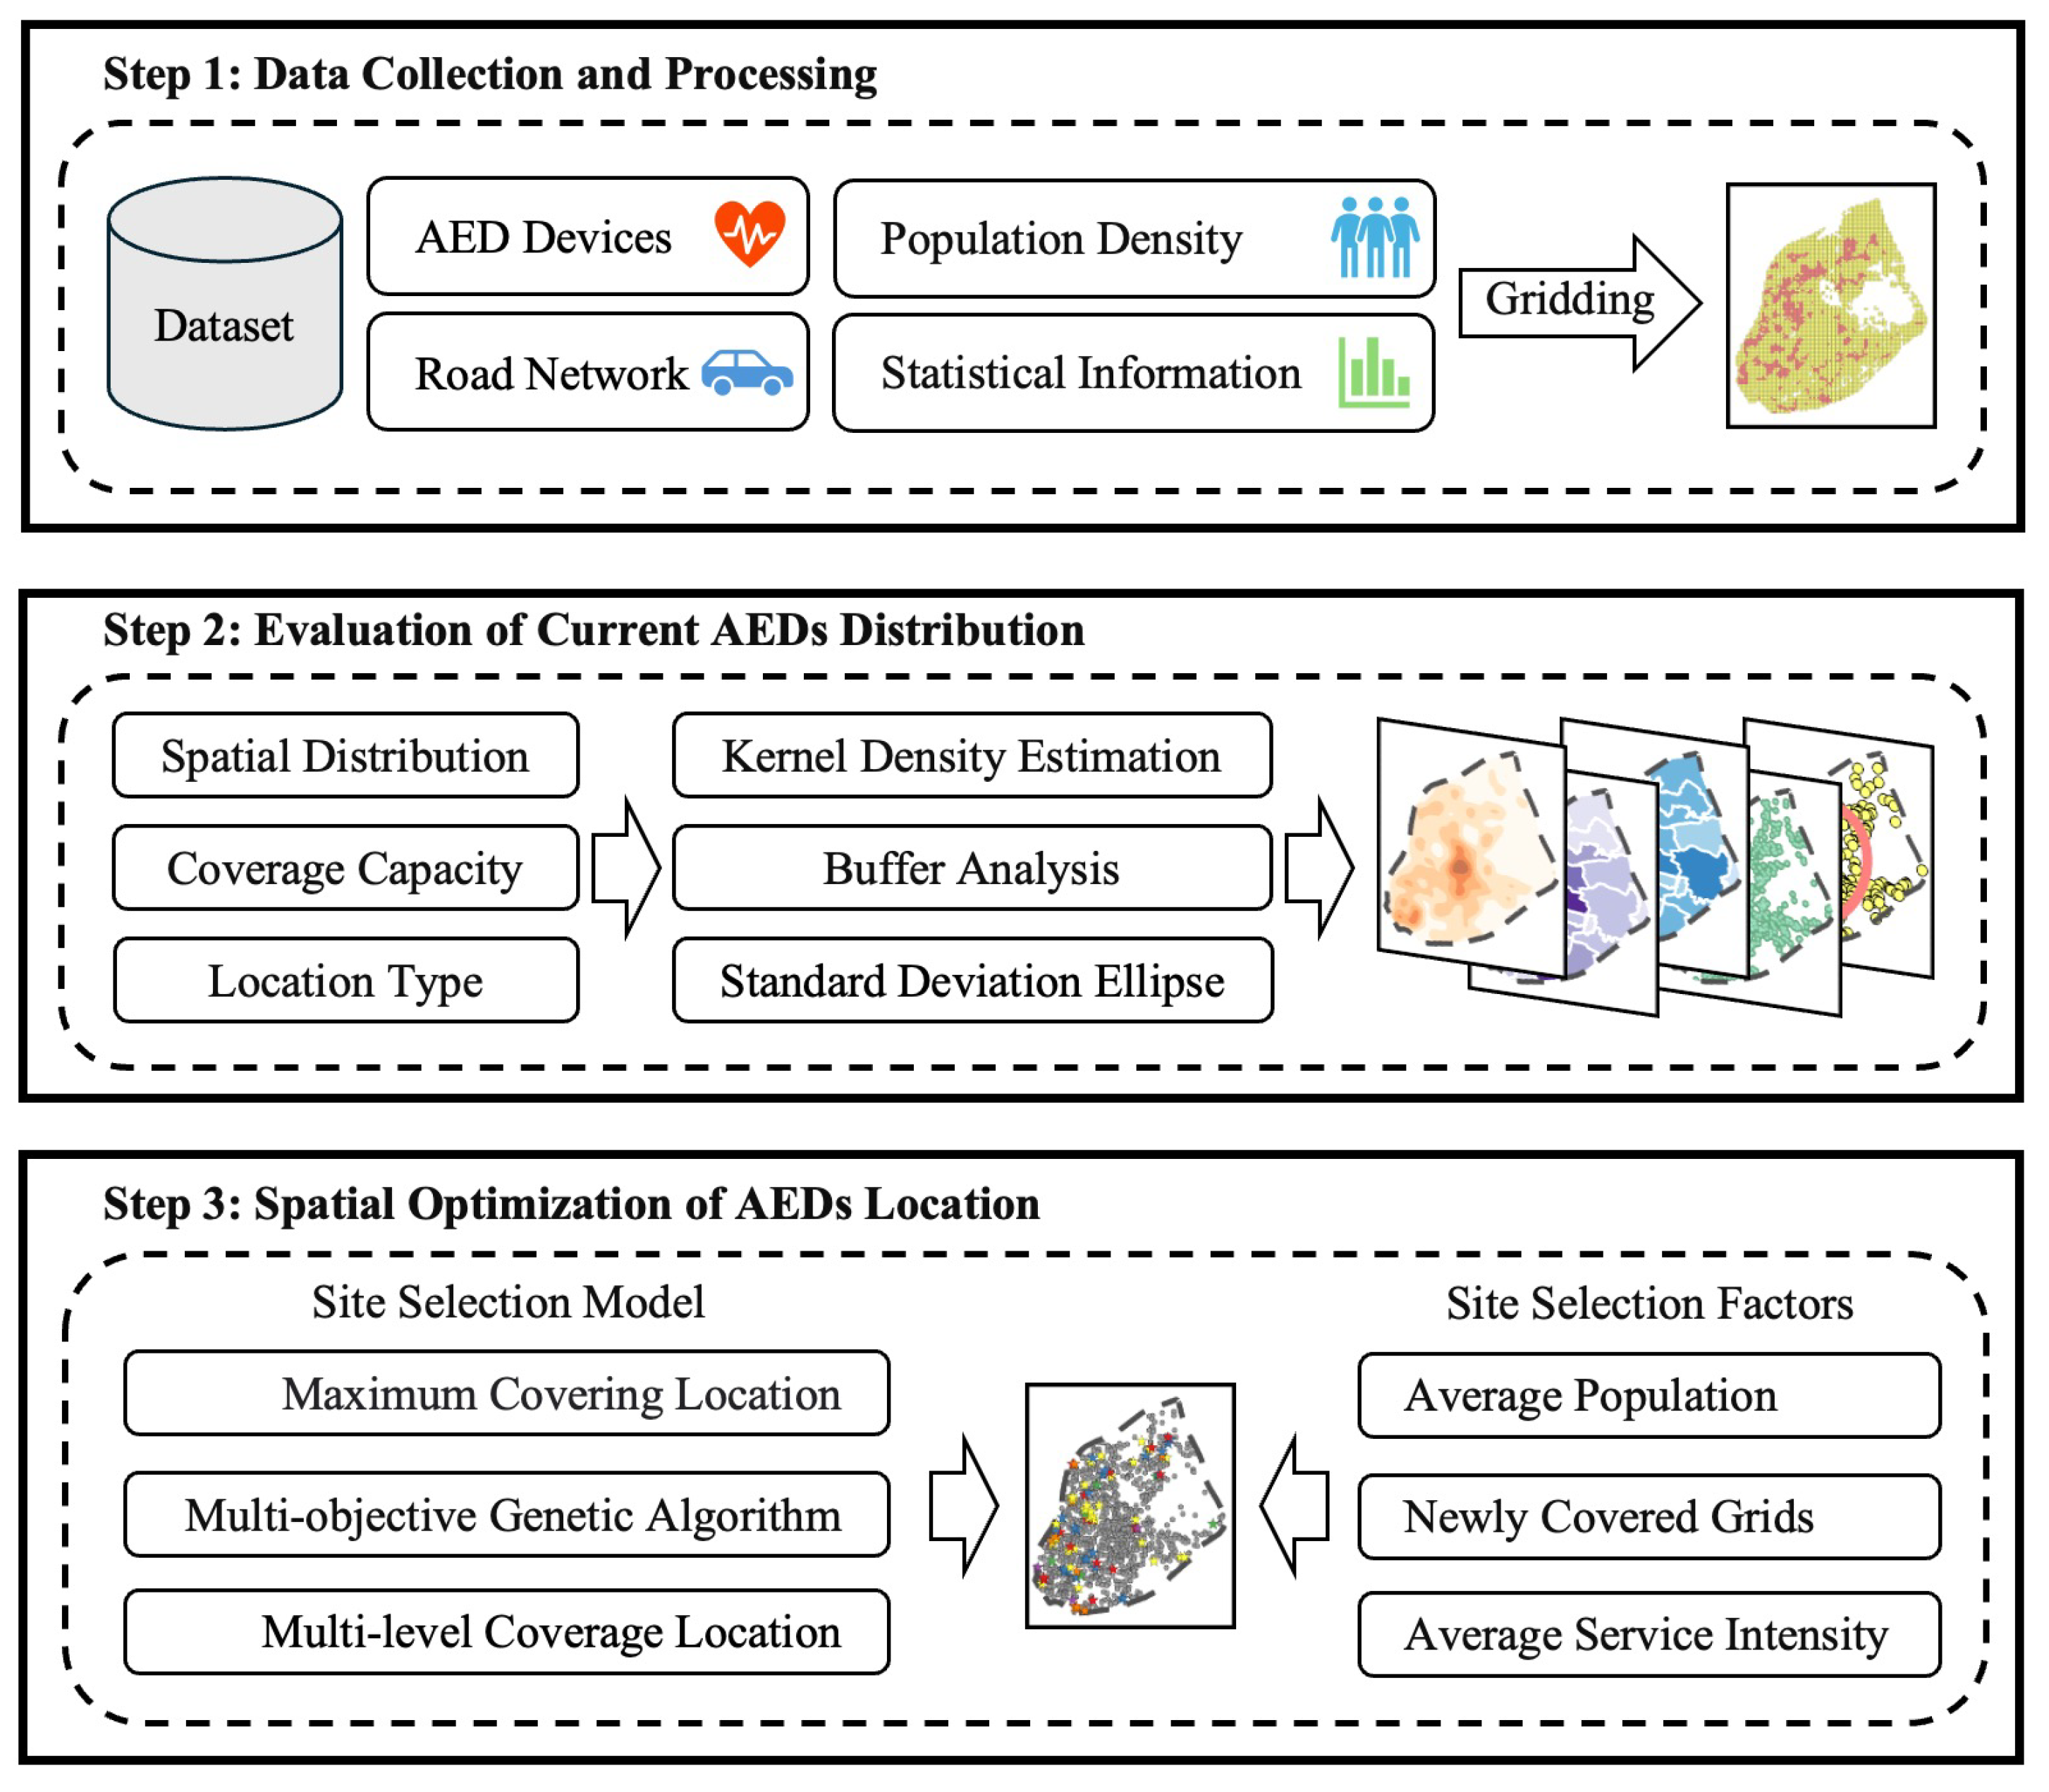
2. Materials and Methods
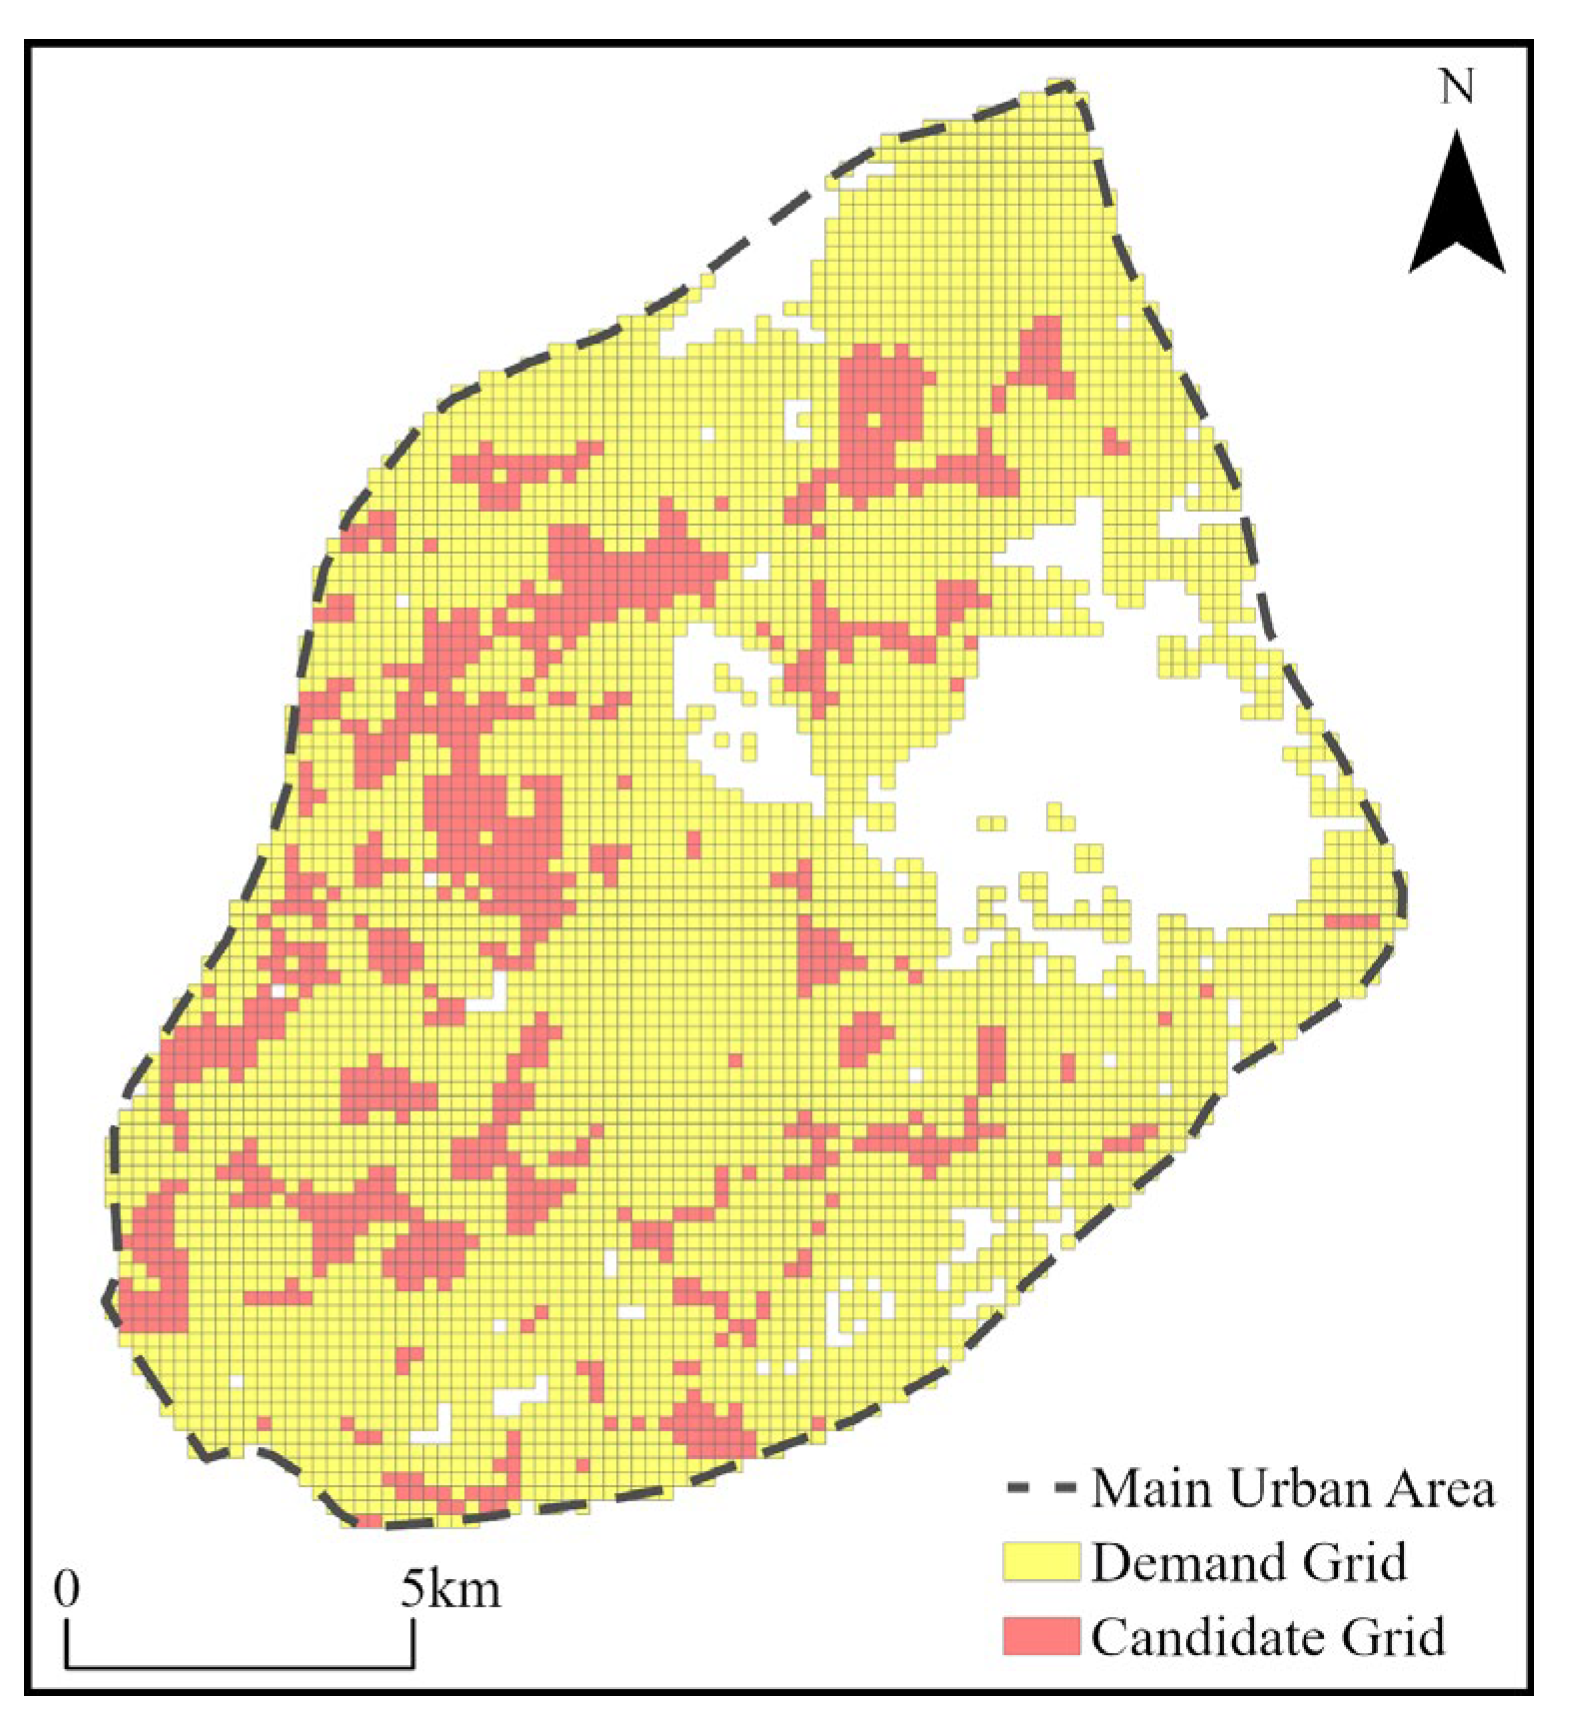
This study evaluates the spatial distribution and allocation of AEDs using a composite spatial analysis approach and constructs a coverage site selection model based on genetic algorithms to investigate spatial optimization issues. The research framework is illustrated in Figure 1, which includes data acquisition and processing, an assessment of the current configuration, and spatial site selection optimization.

2.1. Study Area

Nanjing, located in the eastern part of China at the lower reaches of the Yangtze River, is economically prosperous and serves as the capital of Jiangsu Province as well as a significant central city in the eastern region. In 2023, the city had a permanent population of approximately 9.55 million. In recent years, Nanjing has been actively promoting the construction of a social emergency aid system, with rapid development in the field of emergency medical services. In 2021, Nanjing became the first city in the Yangtze River Delta region to achieve full coverage of AEDs in subway stations [40]. As of 2024, more than 4000 AEDs have been deployed across the city. Compared to other cities in China, Nanjing has a relatively advanced level of AED deployment [43,44]. By examining the optimization of AED placement in Nanjing, valuable insights can be provided for other cities, contributing to the scientific layout of a broader urban pre-hospital emergency medical system. This study selects the main urban area of Nanjing as the study area (Figure 2), including Xuanwu District, Qinhuai District, Gulou District, and parts of Jianye District, Qixia District, and Yuhuatai District, encompassing 43 sub-districts with a total area of approximately 244 km2, which accounts for 3.7% of the city’s area.

2.2. Data

  • AED distribution data
The AED distribution data for the main urban area of Nanjing in 2024 used in this study were sourced from the Nanjing Red Cross and include information on installation locations, operating hours, and geographic coordinates. This study selected 1030 AEDs within the main urban area as the subject of research, representing 25.4% of the city’s total number [45].
  • Basic data on the city
The foundational data on the city characteristics, including the district boundaries, city names, capital cities, road networks, urban centers, etc., were provided by the Yangtze River Delta Science Data Center, National Science and Technology Infrastructure of China, and National Earth System Science Data Sharing Infrastructure (http://nnu.geodata.cn, accessed on 30 January 2024) [45]. These data were stored in shapefile format for subsequent spatial analysis.
  • Socioeconomic data on the city
When evaluating the need of AEDs and their usage efficiency, the population density and economic development, among other characteristics, are needed. Those socioeconomic indicator data are sourced from the authoritative publications “China Urban Statistical Yearbook” and “Jiangsu Statistical Yearbook” issued by the government [46].

2.3. Research Method

2.3.1. Average Nearest Neighbor Index

The average nearest neighbor (ANN) method is commonly used to analyze the spatial distribution characteristics of point features. It determines the distribution pattern of point features by calculating the distance between a point and its nearest neighbor [47]. This study employs the average nearest neighbor method to investigate the spatial distribution characteristics of AEDs. The calculation formula is as follows:
R = i = 1 N d i N / 1 2 N / A
where N is the total number of AEDs, A represents the total area of main urban area, and di represents the distance from the ith point to its nearest neighbor. When the index is less than 1, it indicates that the AEDs exhibit a clustered distribution; when the index is greater than 1, it suggests a tendency towards a uniform distribution; and when the index equals 1, it indicates a random distribution pattern of the AEDs.

2.3.2. Geographical Concentration Index

The geographical concentration index (GCI) is a statistical measure that quantifies the degree to which a particular phenomenon, such as the distribution of AEDs, is concentrated within a geographic area. It provides a single value that represents the overall concentration or dispersion of the observed values across the spatial domain [48,49]. In the context of AED distribution, a GCI could be calculated by considering the number of AEDs in each street or neighborhood and comparing this to the expected number if AEDs were distributed uniformly across the area. The formula is as follows:
G = 100 × i = 1 N ( x i / X ) 2
where N represents the total number of sub-districts in the main urban area, and xi is the number of AED facilities in the ith sub-district. The higher the index value, the more concentrated the distribution of AEDs across the sub-districts.

2.3.3. Standard Deviation Ellipse

The standard deviation ellipse (SDE) is utilized to describe the spatial distribution characteristics of point features, with its major axis, minor axis, and orientation angle representing the distribution direction, shape, and trend of the point features [50]. This study employs the SDE to analyze the distribution characteristics of AEDs across different venue types. The calculation formula for the standard deviation is as follows:
S x = ( 1 / n ) i = 1 n ( x i x ¯ ) 2
S y = ( 1 / n ) i = 1 n ( y i y ¯ ) 2
where Sx and Sy represent the standard deviations of the AED facilities in the X-axis and Y-axis directions, respectively, ( x i , y i ) are the coordinates of the ith facility, x ¯ and y ¯ are the coordinates of the mean center, and n is the total number of facilities.

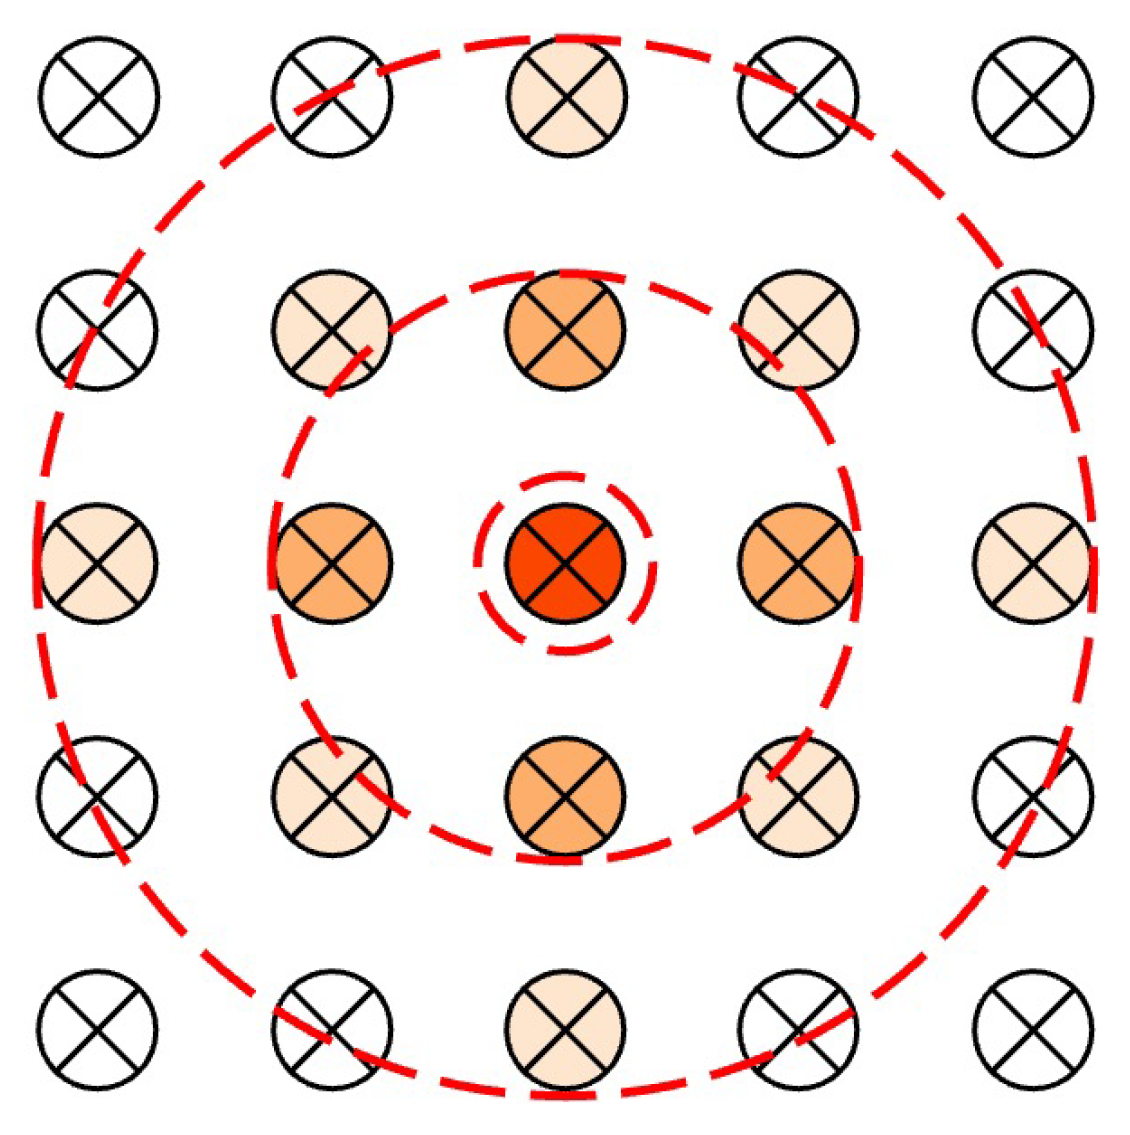
2.3.4. Kernel Density Estimation

Kernel density estimation (KDE) is a non-parametric method used to estimate the spatial distribution of point features [51]. By extending point features into a continuous surface, a density distribution map of the point features can be generated. This study employs KDE to analyze the spatial distribution of AEDs. The mathematical model for KDE is as follows:
f x = ( 1 / n h ) i = 1 n K ( x x i ) / h
where f(x) is the estimated density function at point x, n is the total number of AED points, xi represents the location of the ith point feature, K is the kernel function, which is a smoothing function often chosen to be the Gaussian function, and h is the bandwidth, which is a smoothing parameter that determines the width of the kernel function and thus the smoothness of the estimated density surface.

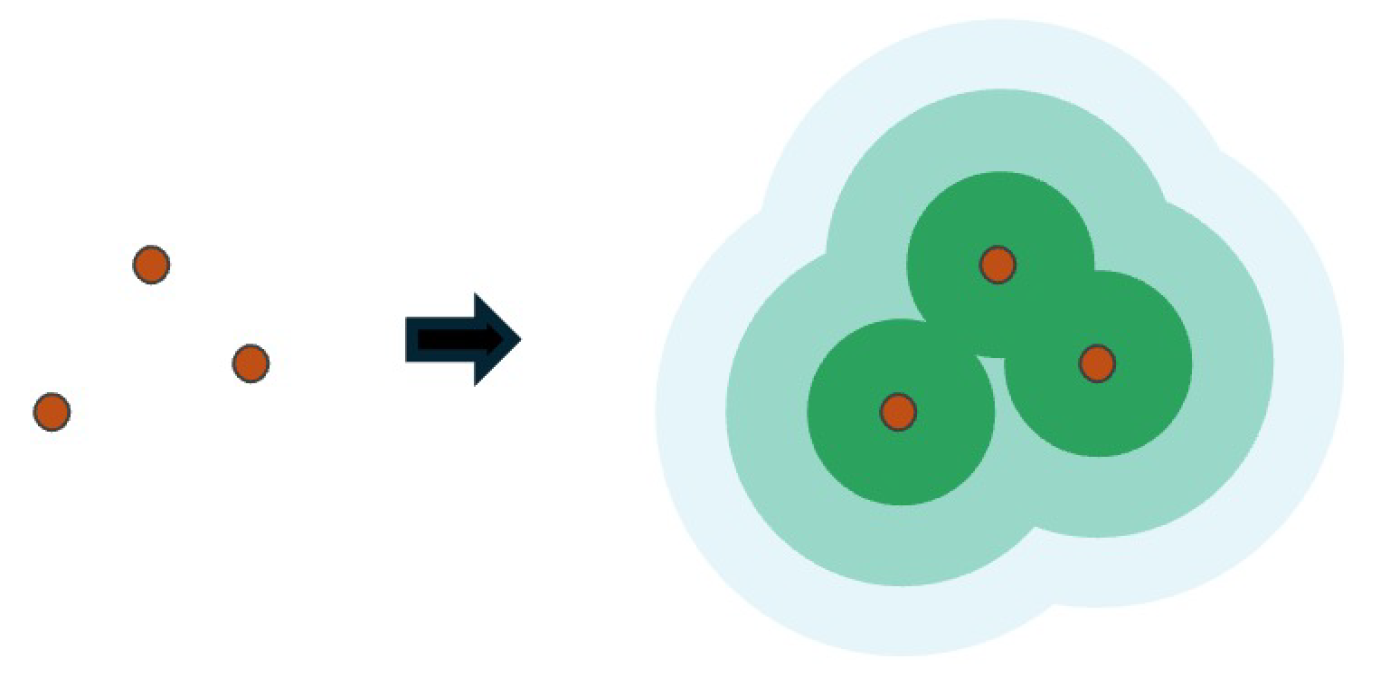
2.3.5. Buffer Analysis

Buffer analysis refers to the creation of buffer zones at specific distances around point, line, or polygon features, often used to assess impacts or potential risks within a particular area [52]. It can be divided into single buffer zones and multiple-ring buffer zones. This study uses multiple-ring buffer zones to evaluate the coverage capability of AEDs at different service distances. Figure 3 is a schematic diagram of establishing multiple-ring buffer zones for point features.

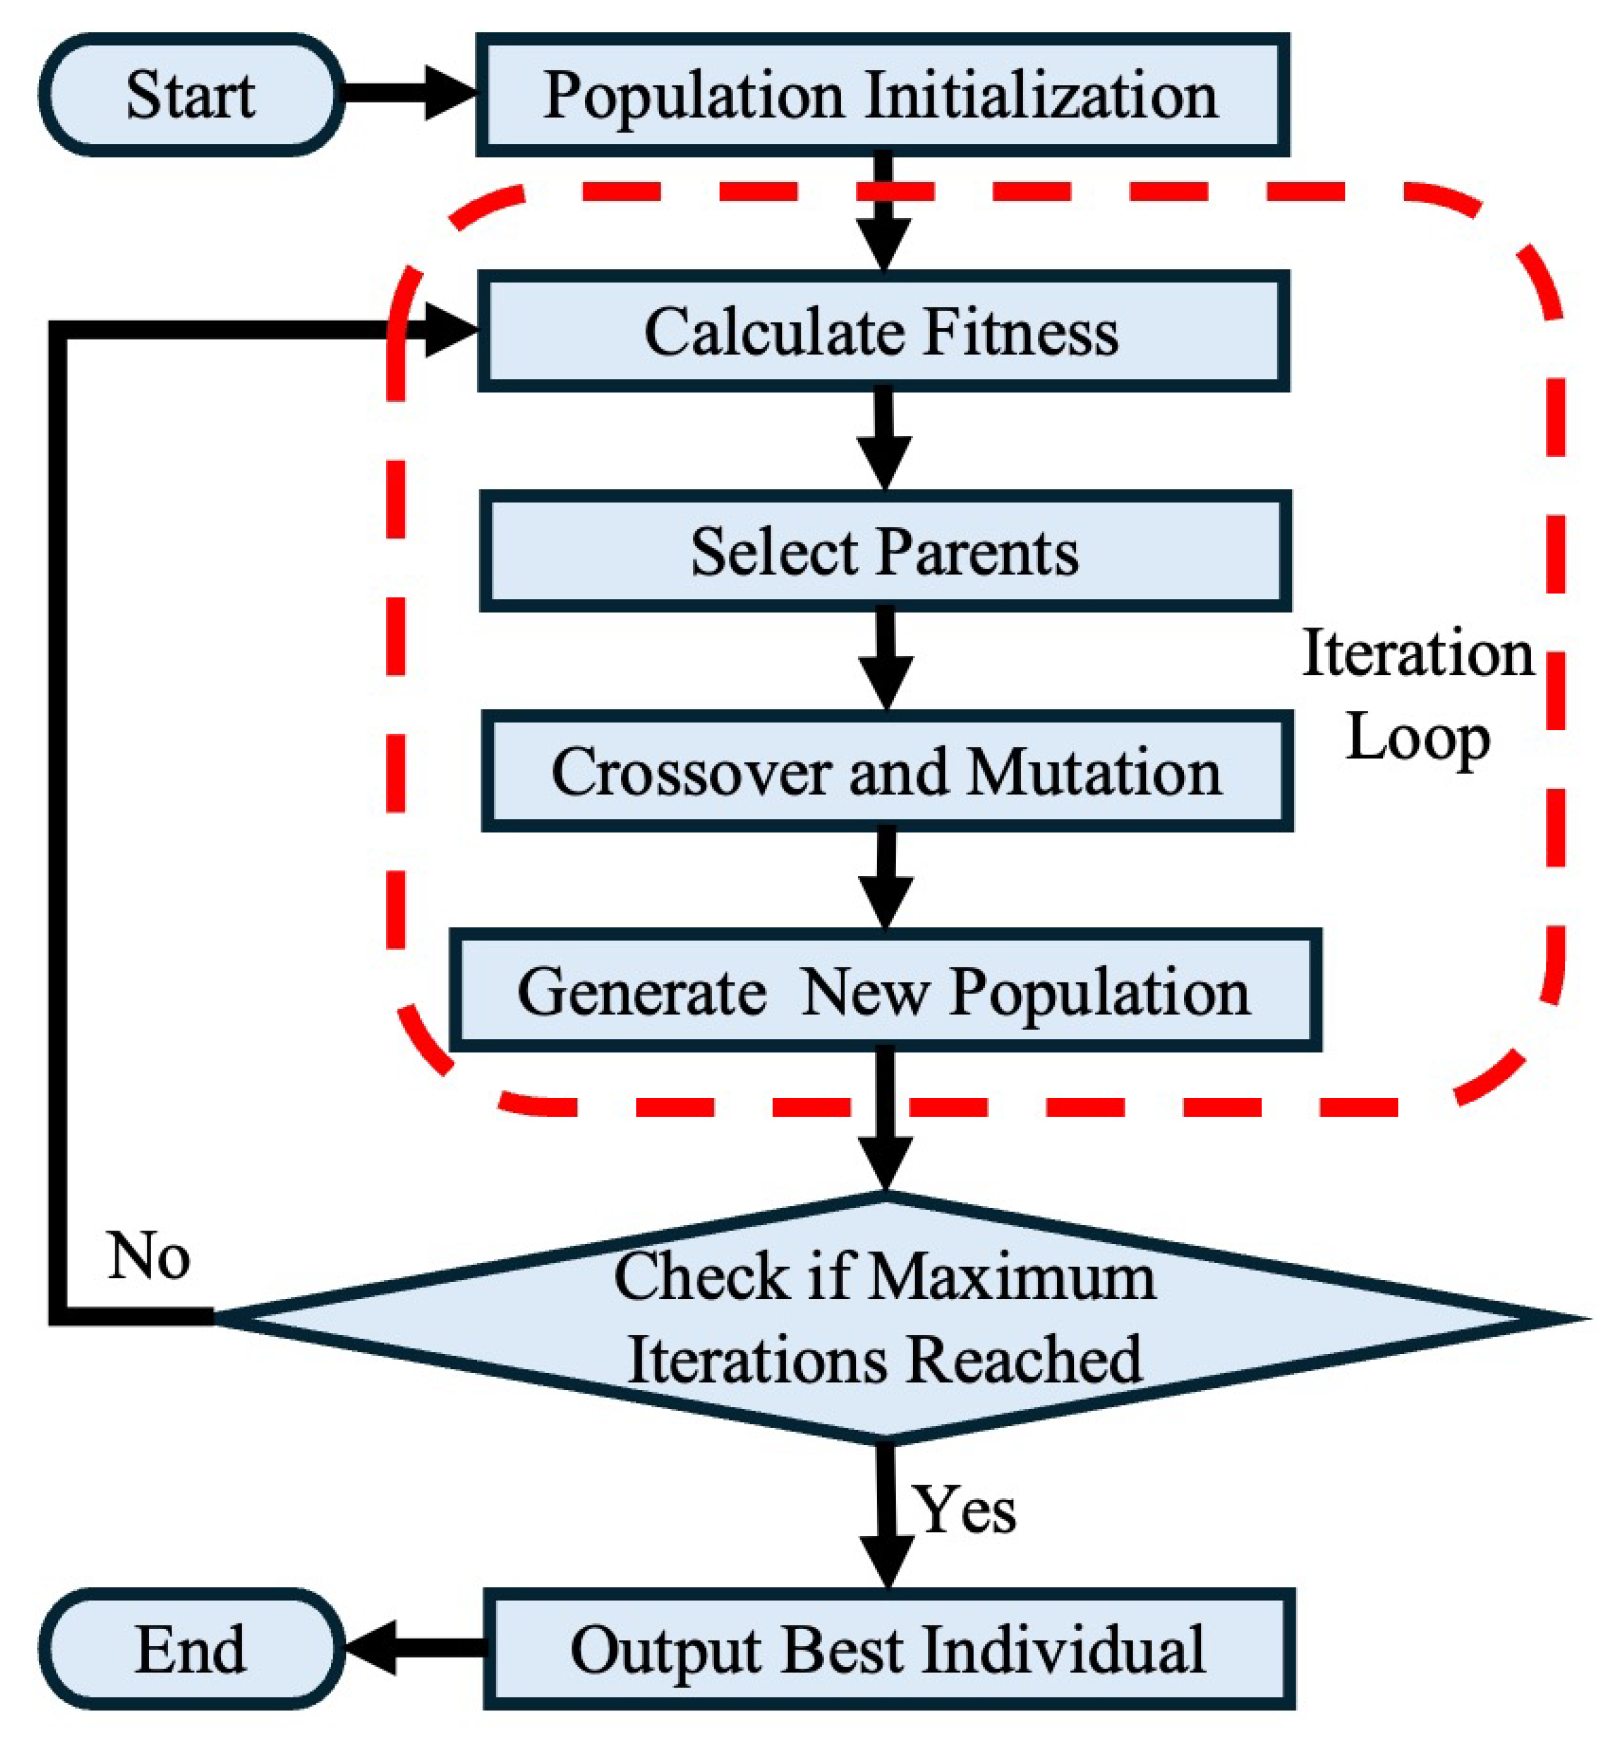
2.3.6. Coverage Site Selection Model Based on Genetic Algorithm

  • Site selection model input
To achieve the goal of maximizing the service coverage area of AEDs, this study employs the maximum coverage location problem (MCLP) [53] to address its optimization. This model is a classic in location research and is extensively applied in the fields of public facility siting and emergency resource allocation. The mathematical model is as follows:
max i = 1 n w i y i
j = 1 m w j J
y i j S ( i ) x j , i
x j { 0 , 1 } , j
y i { 0 , 1 } , i
where Equation (6) represents the objective function, while Equations (7)–(10) denote the constraints. n is the number of demand points, m is the number of facility sites to be located, wi is the weight of demand point i, indicating whether the demand point is covered, xj is a binary variable indicating whether facility j is selected, S(i) is the set of facilities that can cover demand point I, and J is the maximum number of facilities allowed to be selected.
Considering the inherent randomness in the potential demand for emergency medical services by urban citizens [54], this study divides the research area into a grid of 200 × 200 m squares, employing a continuous siting strategy to delineate demand points and siting points [55]. Here, grids with a population greater than zero are defined as demand grids, and grids with a population above the average and service capacity below the average are considered candidate grids. The division results are shown in Figure 4.
Existing research indicates that the average walking speed for pedestrians is approximately 75 m per minute, while the average cycling speed is about 225 m per minute [56,57]. Furthermore, Jonsson points out that the speed of non-professional first aid responders is around 108 m per minute [58]. According to the “golden four minutes” principle of first aid, and considering the walking speed, the speed of non-professional first aid personnel, and the cycling speed as mentioned above, the distances that can be covered within four minutes under different modes of transportation are approximately 200 m, 400 m, and 800 m, respectively [59,60]. However, urban road environments and architectural structures exhibit significant complexity, with various obstacles on the roads and differences in building floor levels, all of which can lead to certain time losses during the first-aid process. Additionally, the process of retrieving an AED and returning to the patient may require a longer distance, which will double the driving time. Therefore, this study establishes three tiers of service distances for AEDs: an optimal service distance of 100 m, a maximum running distance of 200 m, and a maximum cycling distance of 400 m. Accordingly, the grid coverage radii are set to 0 (100 m), 1 (200 m), and 2 (400 m) for different coverage ranges. The coverage areas under different coverage radii are shown in Figure 5.
  • Objective function construction
In this study, the objective function is constructed based on the following three site selection indicators: (1) average population number, representing the average permanent resident population of the candidate grid; (2) new coverage number, indicating the impact of the site selection combination on the number of covered grids; and (3) average service capacity, representing the average coverage area of the current AED placement combination—the higher the objective function’s value, the larger the area protected by the AEDs under that placement scheme [61,62]. After normalizing and standardizing all indicators, this paper calculates the objective function according to the following formula:
f = C x i = 1 N P x i i = 1 N S x i
In the formula, f represents the objective function, C(x) denotes the new coverage number of the current site selection combination, xi is the ith candidate grid in the site selection combination, N is the number of sites, and P(xi) and S(xi) refer to the average population number and the average service capacity of the ith candidate grid, respectively.
  • Output of genetic algorithm
The genetic algorithm (GA) is an efficient optimization algorithm that simulates the process of natural selection to continuously optimize individuals within a population, solving complex optimization problems. The core steps of GA include population initialization, fitness (objective function) calculation, selection, crossover, and mutation operations. Selection, crossover, and mutation are crucial for controlling the accuracy of the algorithm. The selection operation refers to the process of choosing individuals with higher fitness within the population for “reproduction” to inherit superior genes. The crossover operation simulates genetic recombination, creating new individuals through gene exchange. The mutation operation involves randomly altering an individual’s genes to maintain population diversity [63,64]. The mathematical formula of the genetic algorithm can be represented as follows:
P ( t + 1 ) = S ( C ( M ( P ( t ) ) ) )
where P(t) represents the population at generation t, M represents the mutation operation, C represents the crossover operation, and S represents the selection operation. The algorithm process is illustrated in Figure 6, which shows that through continuous iterative cycles, the algorithm eventually converges to a global optimal solution.

3. Results

3.1. Assessment of Distribution of AEDs

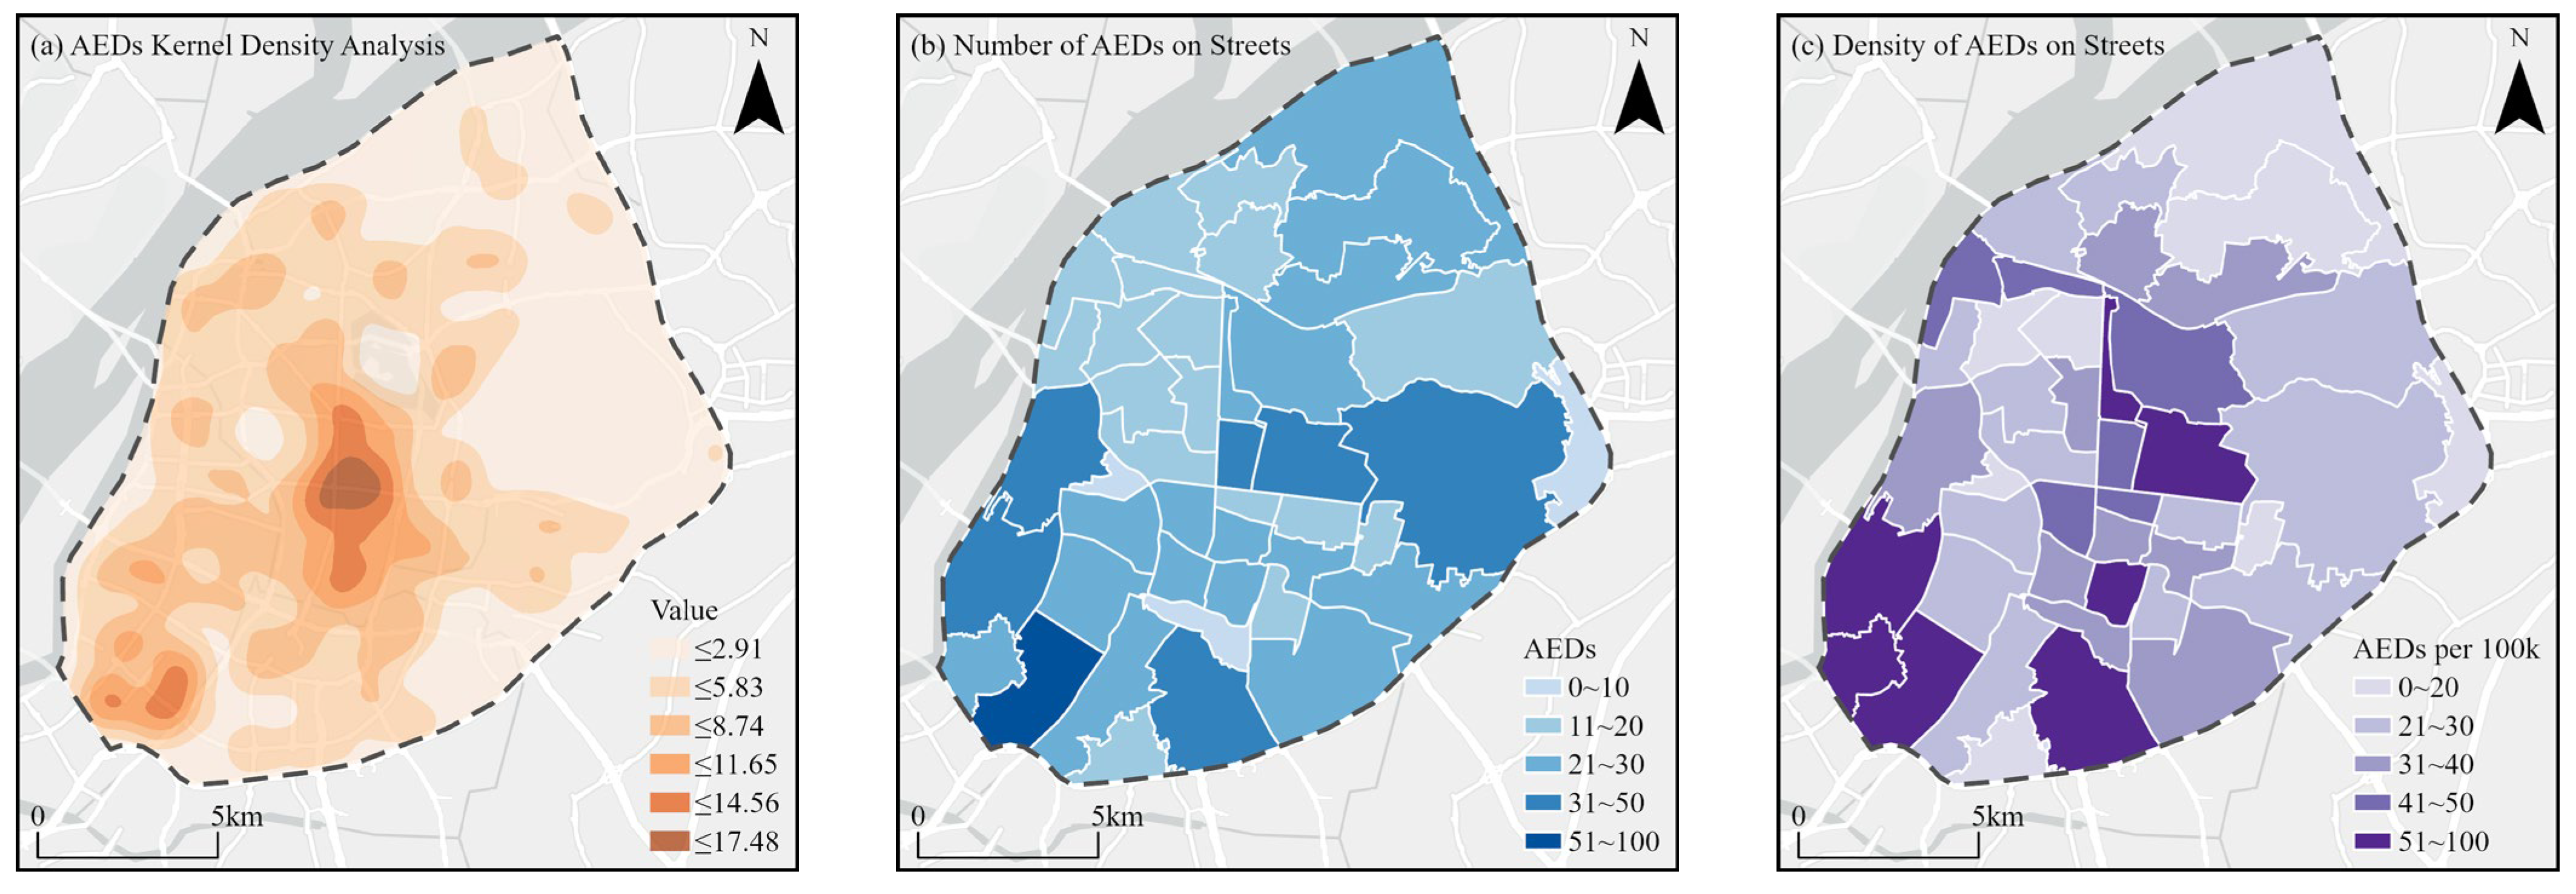
3.1.1. Spatial Distribution Patterns

In the main urban area of Nanjing, the average nearest neighbor index for AEDs is 0.78, which is less than 1, suggesting a tendency towards clustered distribution with significant spatial clustering characteristics. Further exploration of the clustering distribution of AEDs is conducted through kernel density analysis (Figure 7a). The results indicate that AEDs have formed distinct distribution hotspots in the main urban area, generally exhibiting a pattern of radiating from the central area to the periphery, with a more favorable distribution on the southwest side compared to the northeast side.
At the street level, the geographic concentration index for AEDs is 16.92, indicating significant disparities in their distribution across different streets and a weak regional balance in AED distribution. According to statistical data (Table 1) and visualization results (Figure 7b,c), the number of AEDs in each street of the main urban area is generally low, with significant density differences. Over 80% of the streets have fewer than 30 units, and nearly 50% of the streets have fewer than 20 units. Regarding AED density, there is a considerable variation in the density levels among the streets in the main urban area, with only seven central and southwestern streets achieving an advanced national density level, while twenty-one streets still have a facility density below 20 units per 100,000 people.

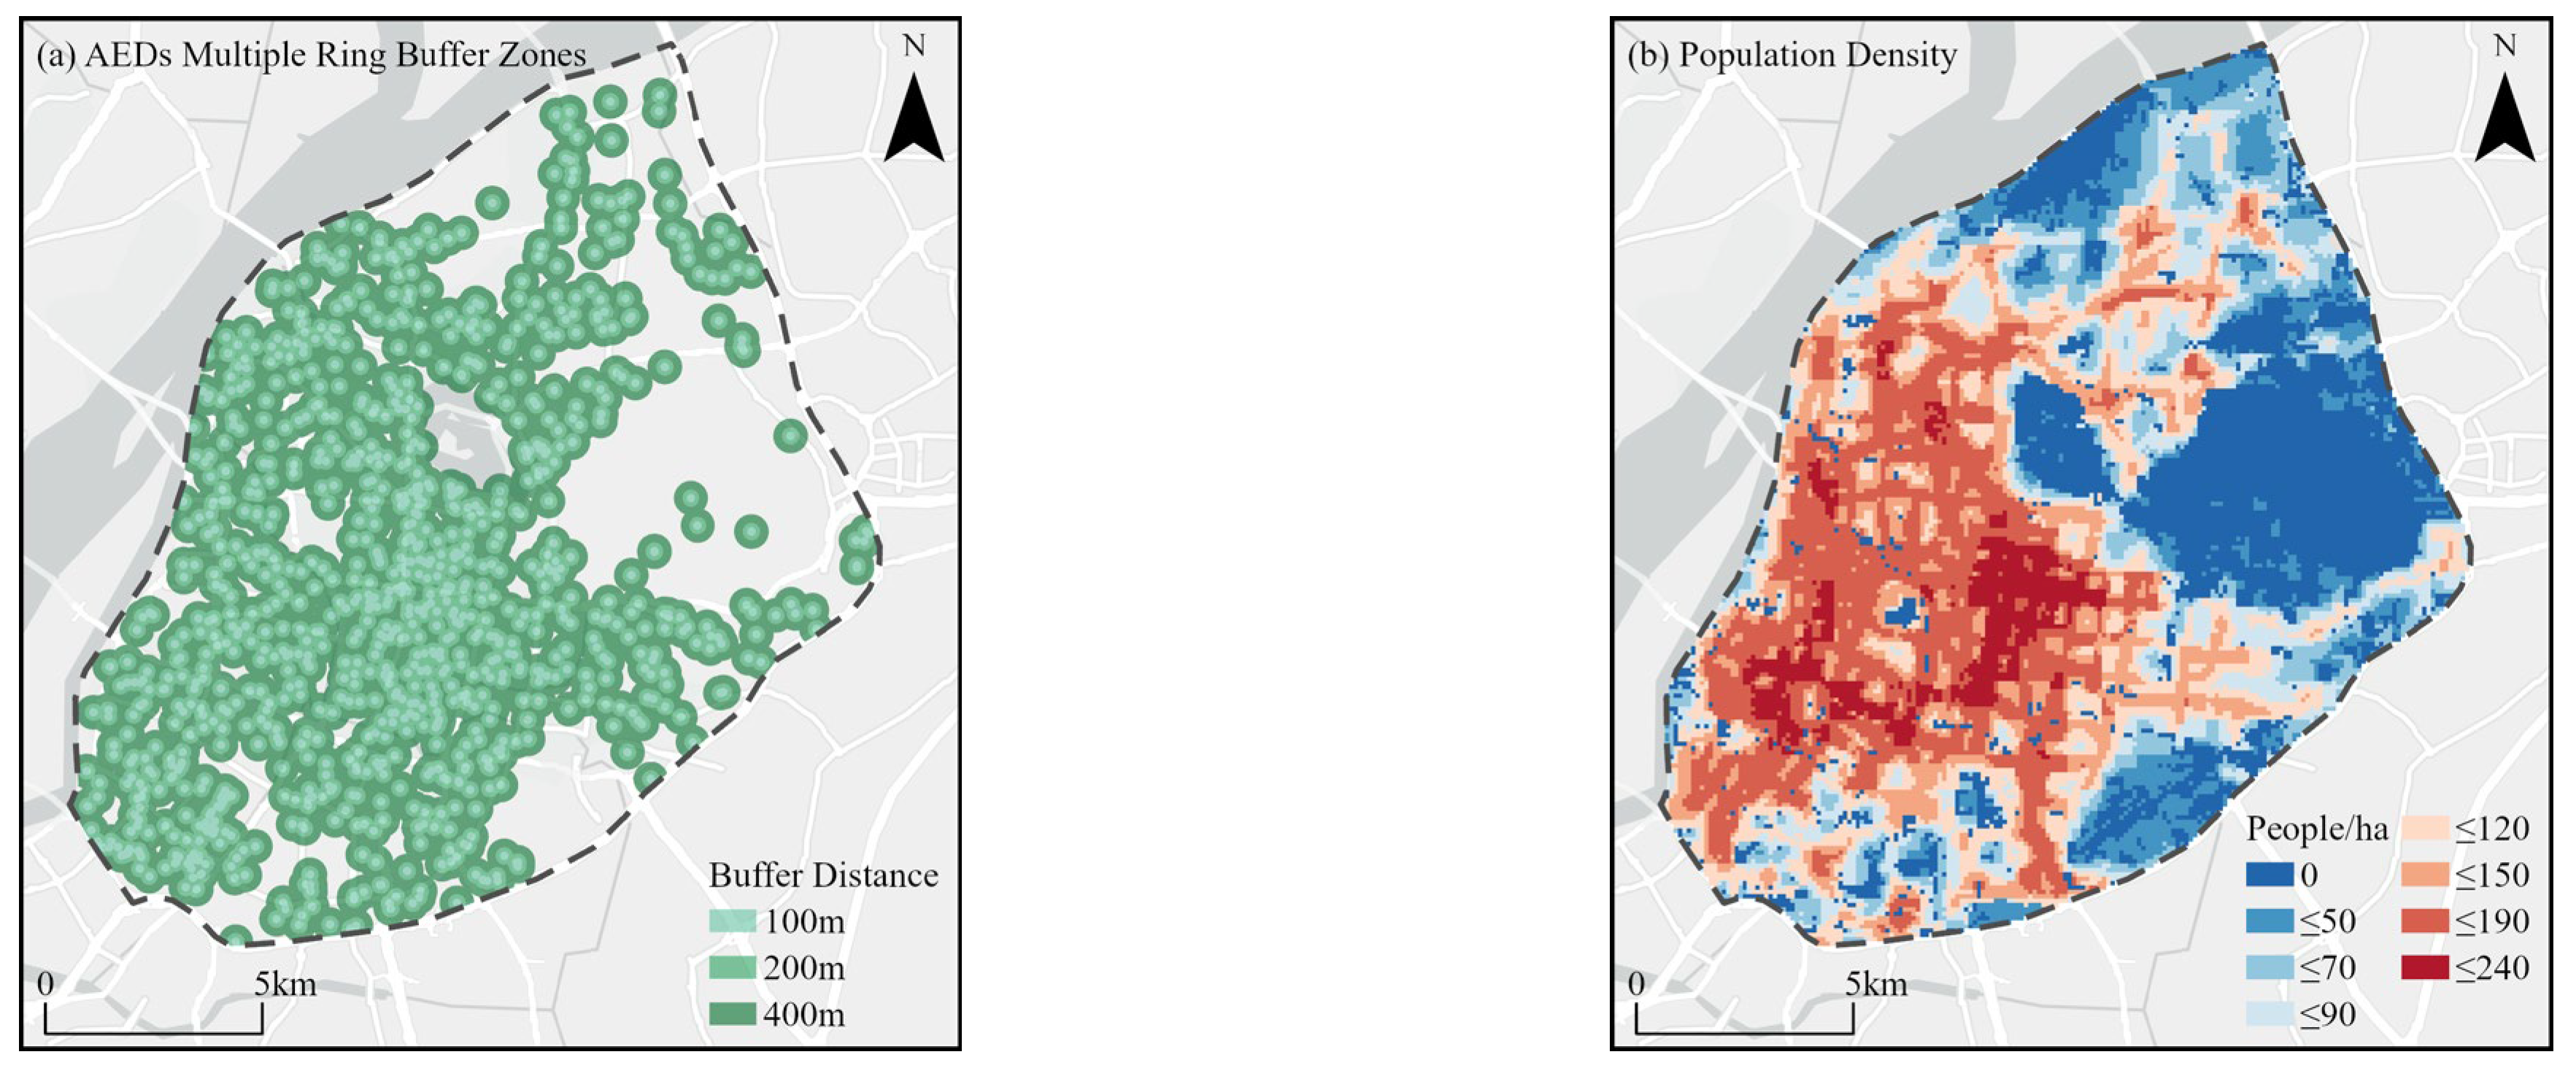
3.1.2. Spatial Coverage Patterns

Spatial coverage capability is a key factor in assessing the spatial configuration of AEDs. This study establishes multi-ring buffer zones for existing AEDs based on three levels of service distance (Figure 8a), evaluating the coverage capability of AEDs in terms of both covered area and served population. By calculating the buffer zone area at different distances and the population within, the study determines the coverage area and served population of AEDs in the main urban area and further calculates the spatial coverage rate and population coverage rate. Figure 8b displays the population density distribution of the main urban area.
In terms of coverage area, the research findings indicate that while AEDs can cover most areas of the main urban area within a 400 m range with a spatial coverage rate exceeding 90%, excluding large scenic areas, the 400 m range represents only the minimum level of service distance. Within a 200 m range, the spatial coverage rate of AEDs is approximately 50%, and within a 100 m range, it is only about 16%. Regarding the served population, the results are similar to the coverage area; the population coverage rates within 100 m and 200 m ranges are 20% and 50%, respectively, and the population coverage rate within the 400 m range approaches 90%. Overall, the existing AEDs achieve a relatively high level of coverage within a 400 m range, but there is still significant room for improvement in short-distance coverage capabilities at 100 m and 200 m, and the density of AEDs needs to be further enhanced.

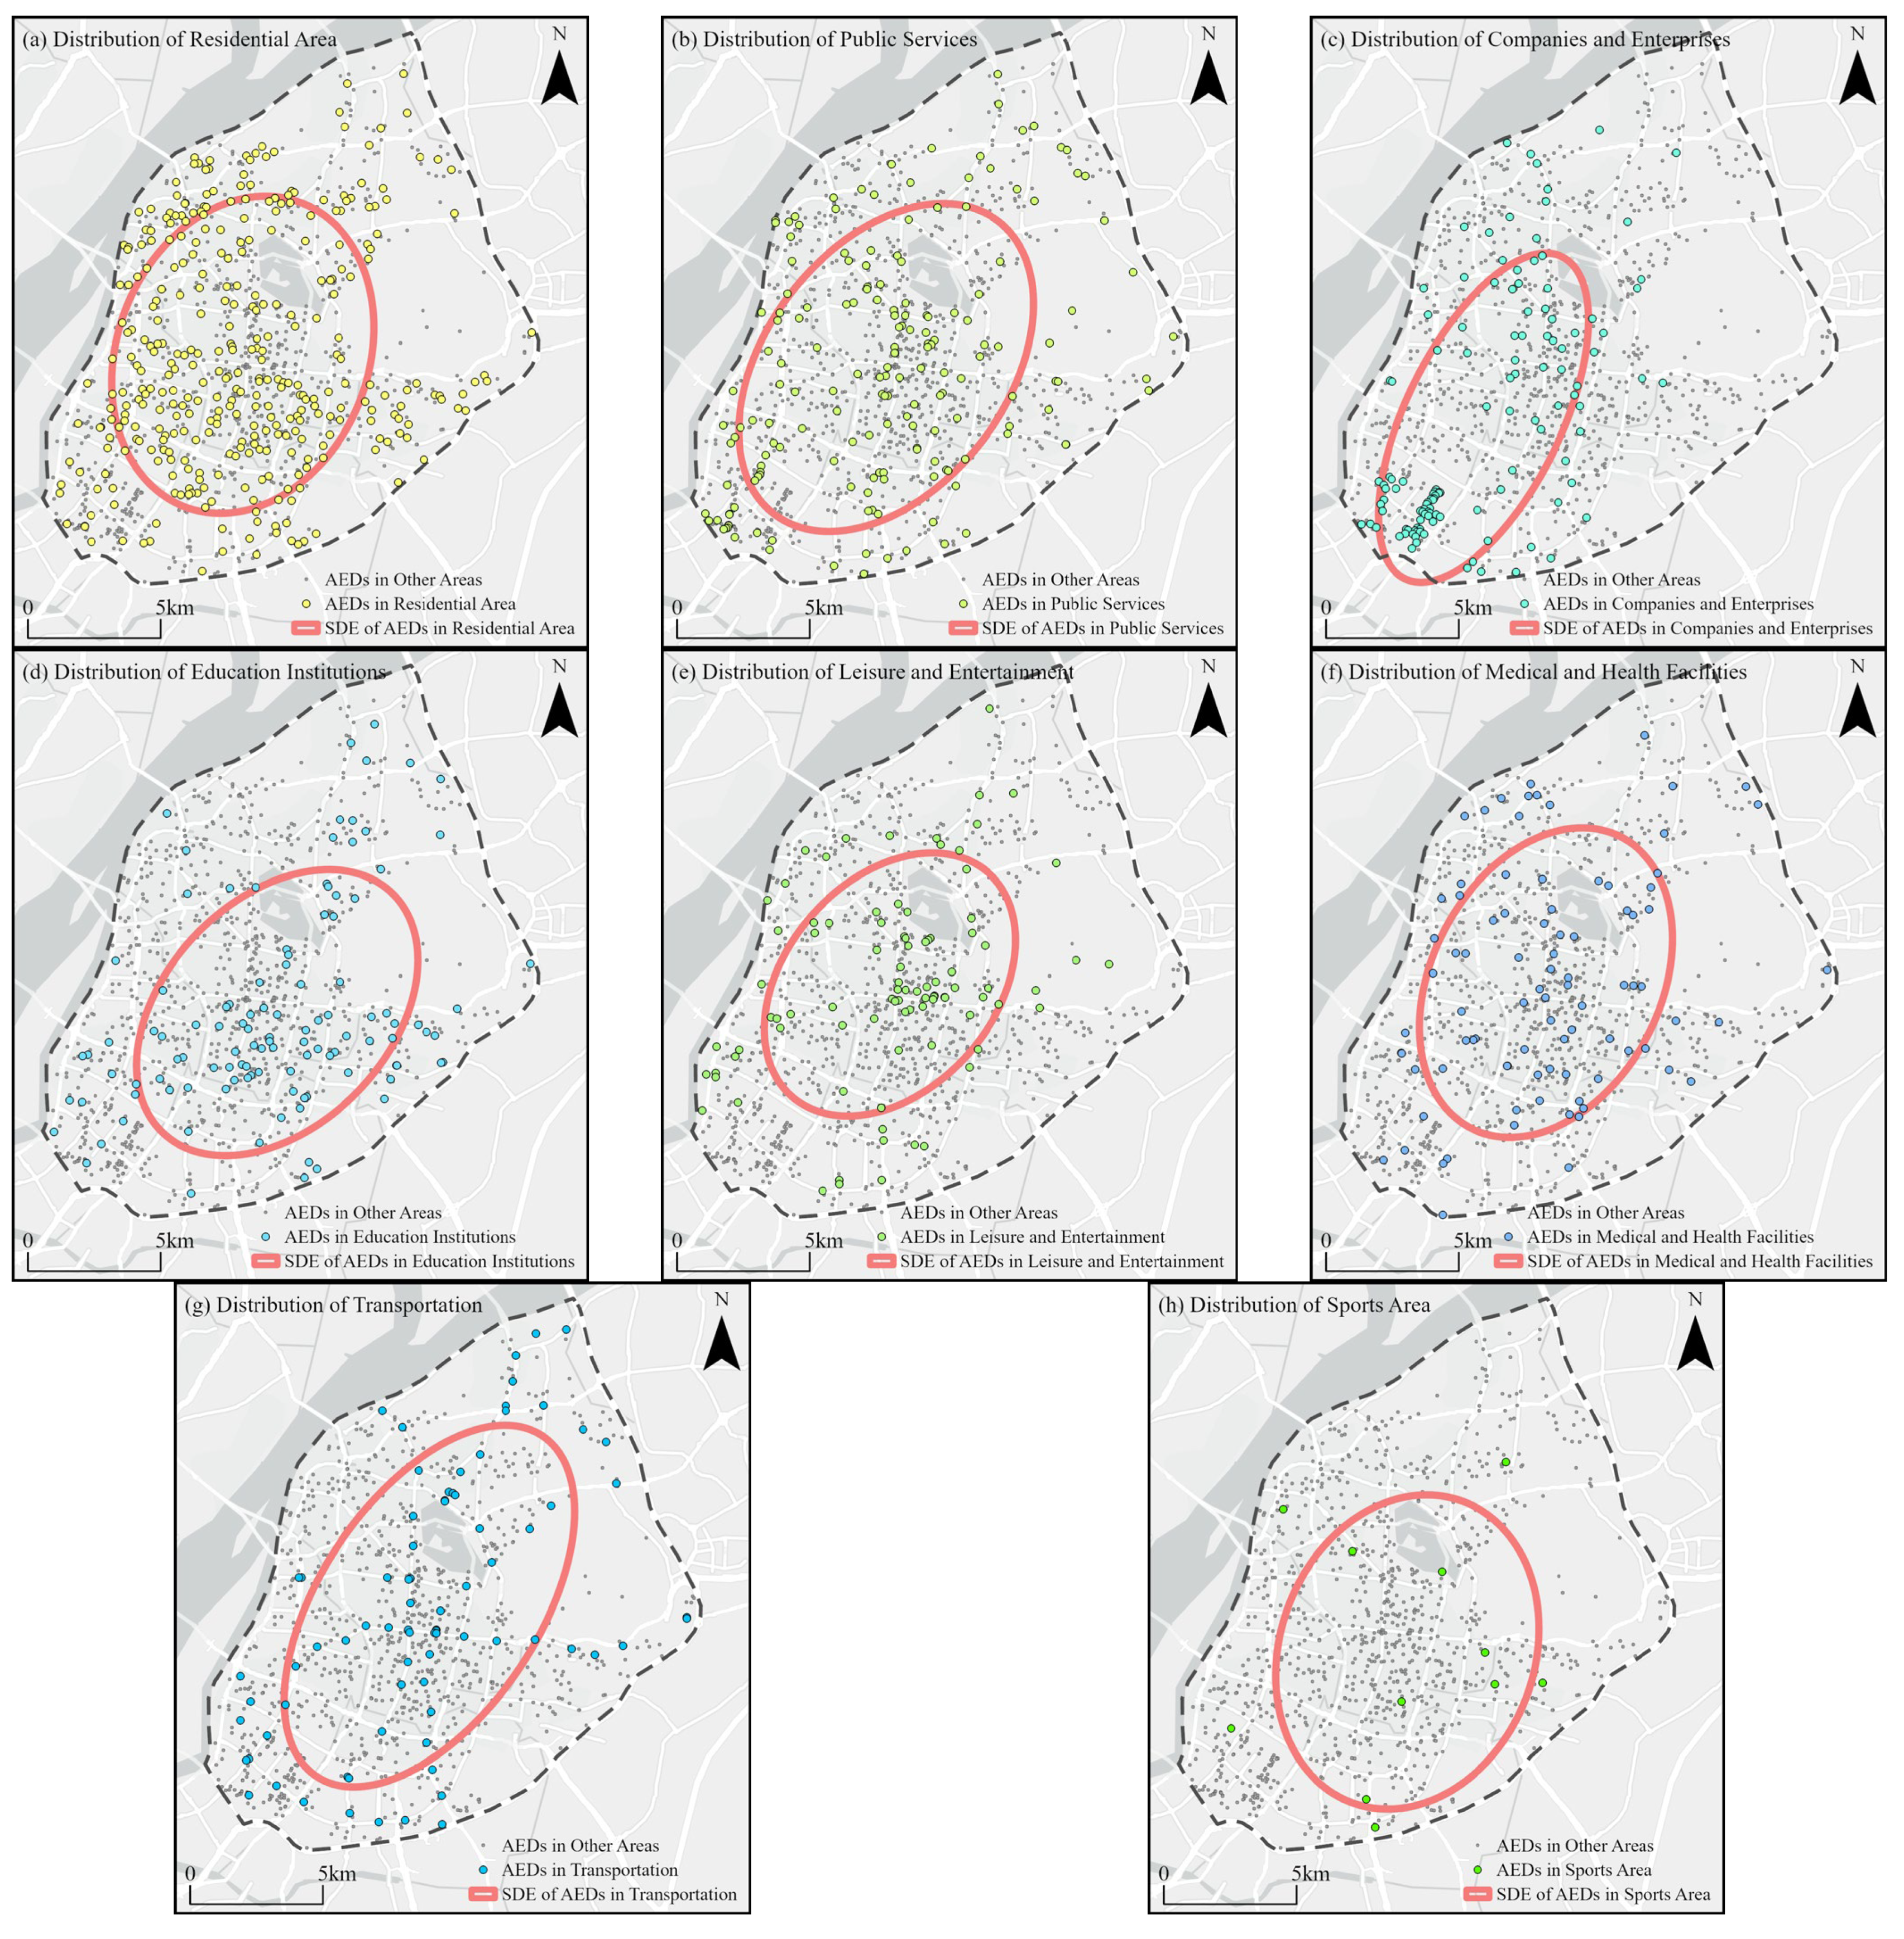
3.1.3. Types of Distribution Locations

Based on the types of venues where existing AEDs are located, this study categorizes AEDs into eight types: residential area, public services, companies and enterprises, educational institutions, leisure and entertainment, medical and health facilities, transportation, and sports area. The quantity of AEDs in each category is as shown in Table 2.
The standard deviational ellipse model was utilized to analyze the spatial distribution characteristics of AEDs across different types of areas (Figure 9). The study indicates significant differences in the distribution of AEDs in various settings. Residential communities and public service venues have the highest number of AEDs, accounting for 33.98% and 16.80% of the total, respectively, with these two categories comprising over half of the AEDs distribution. Specifically, AEDs in residential communities make up more than one-third of the total, with 154 units located in community service halls and party–mass service centers, while the remaining 196 units are situated in property offices, fire stations, guardhouses, and post stations. Public service venues, which include public security organs (such as traffic police stations, police boxes, police stations), administrative organizations (such as government offices, courts, administrative centers), and public facilities (such as hotels, banks, ATMs), in combination with residential community AEDs, account for over 50% of the total. The distribution of these two types of AEDs is similar to the overall layout, with the sizes and orientations of the standard deviational ellipses being relatively consistent.
Corporate and educational institution categories have similar proportions of AEDs, both slightly exceeding 10%, but their distribution characteristics differ. Corporate AEDs are concentrated in the Hexi CBD area, with 40% (approximately 50 units) of their total number, resulting in a more flattened shape of the standard deviational ellipse, with the major axis orientation toward southwest. Educational institution AEDs are predominantly found in primary and secondary schools, with forty-three units in the southeastern Qinhuai District, and eleven, eight, and two units in the northern Xuanwu District, Qixia District, and Gulou District, respectively, causing the standard deviational ellipse to lean more towards the southeast.
Leisure and entertainment venues and medical and health facilities have approximately 90 AEDs each, with their distribution closely resembling the overall layout. The leisure and entertainment category includes a variety of types, such as museums, park scenic areas, shopping centers, and art galleries, mainly concentrated in the central area, leading to a smaller range of the standard deviational ellipse. In the medical and health category, elderly care institutions (such as nursing homes, hospices, care facilities, etc.) have the highest number of AEDs, accounting for more than half (51 units), in addition to 25 AEDs distributed across community health centers.
Transportation areas and sports areas have certain peculiarities. AEDs in transportation areas are primarily equipped in subway stations, and Nanjing has achieved full coverage of AEDs in subway stations, placing it at the forefront nationwide. The sports area category has the fewest AEDs, with only 11 units.
Based on the above analysis, the current spatial configuration of AEDs in Nanjing’s primarily urban area exhibits the following characteristics:
(1)
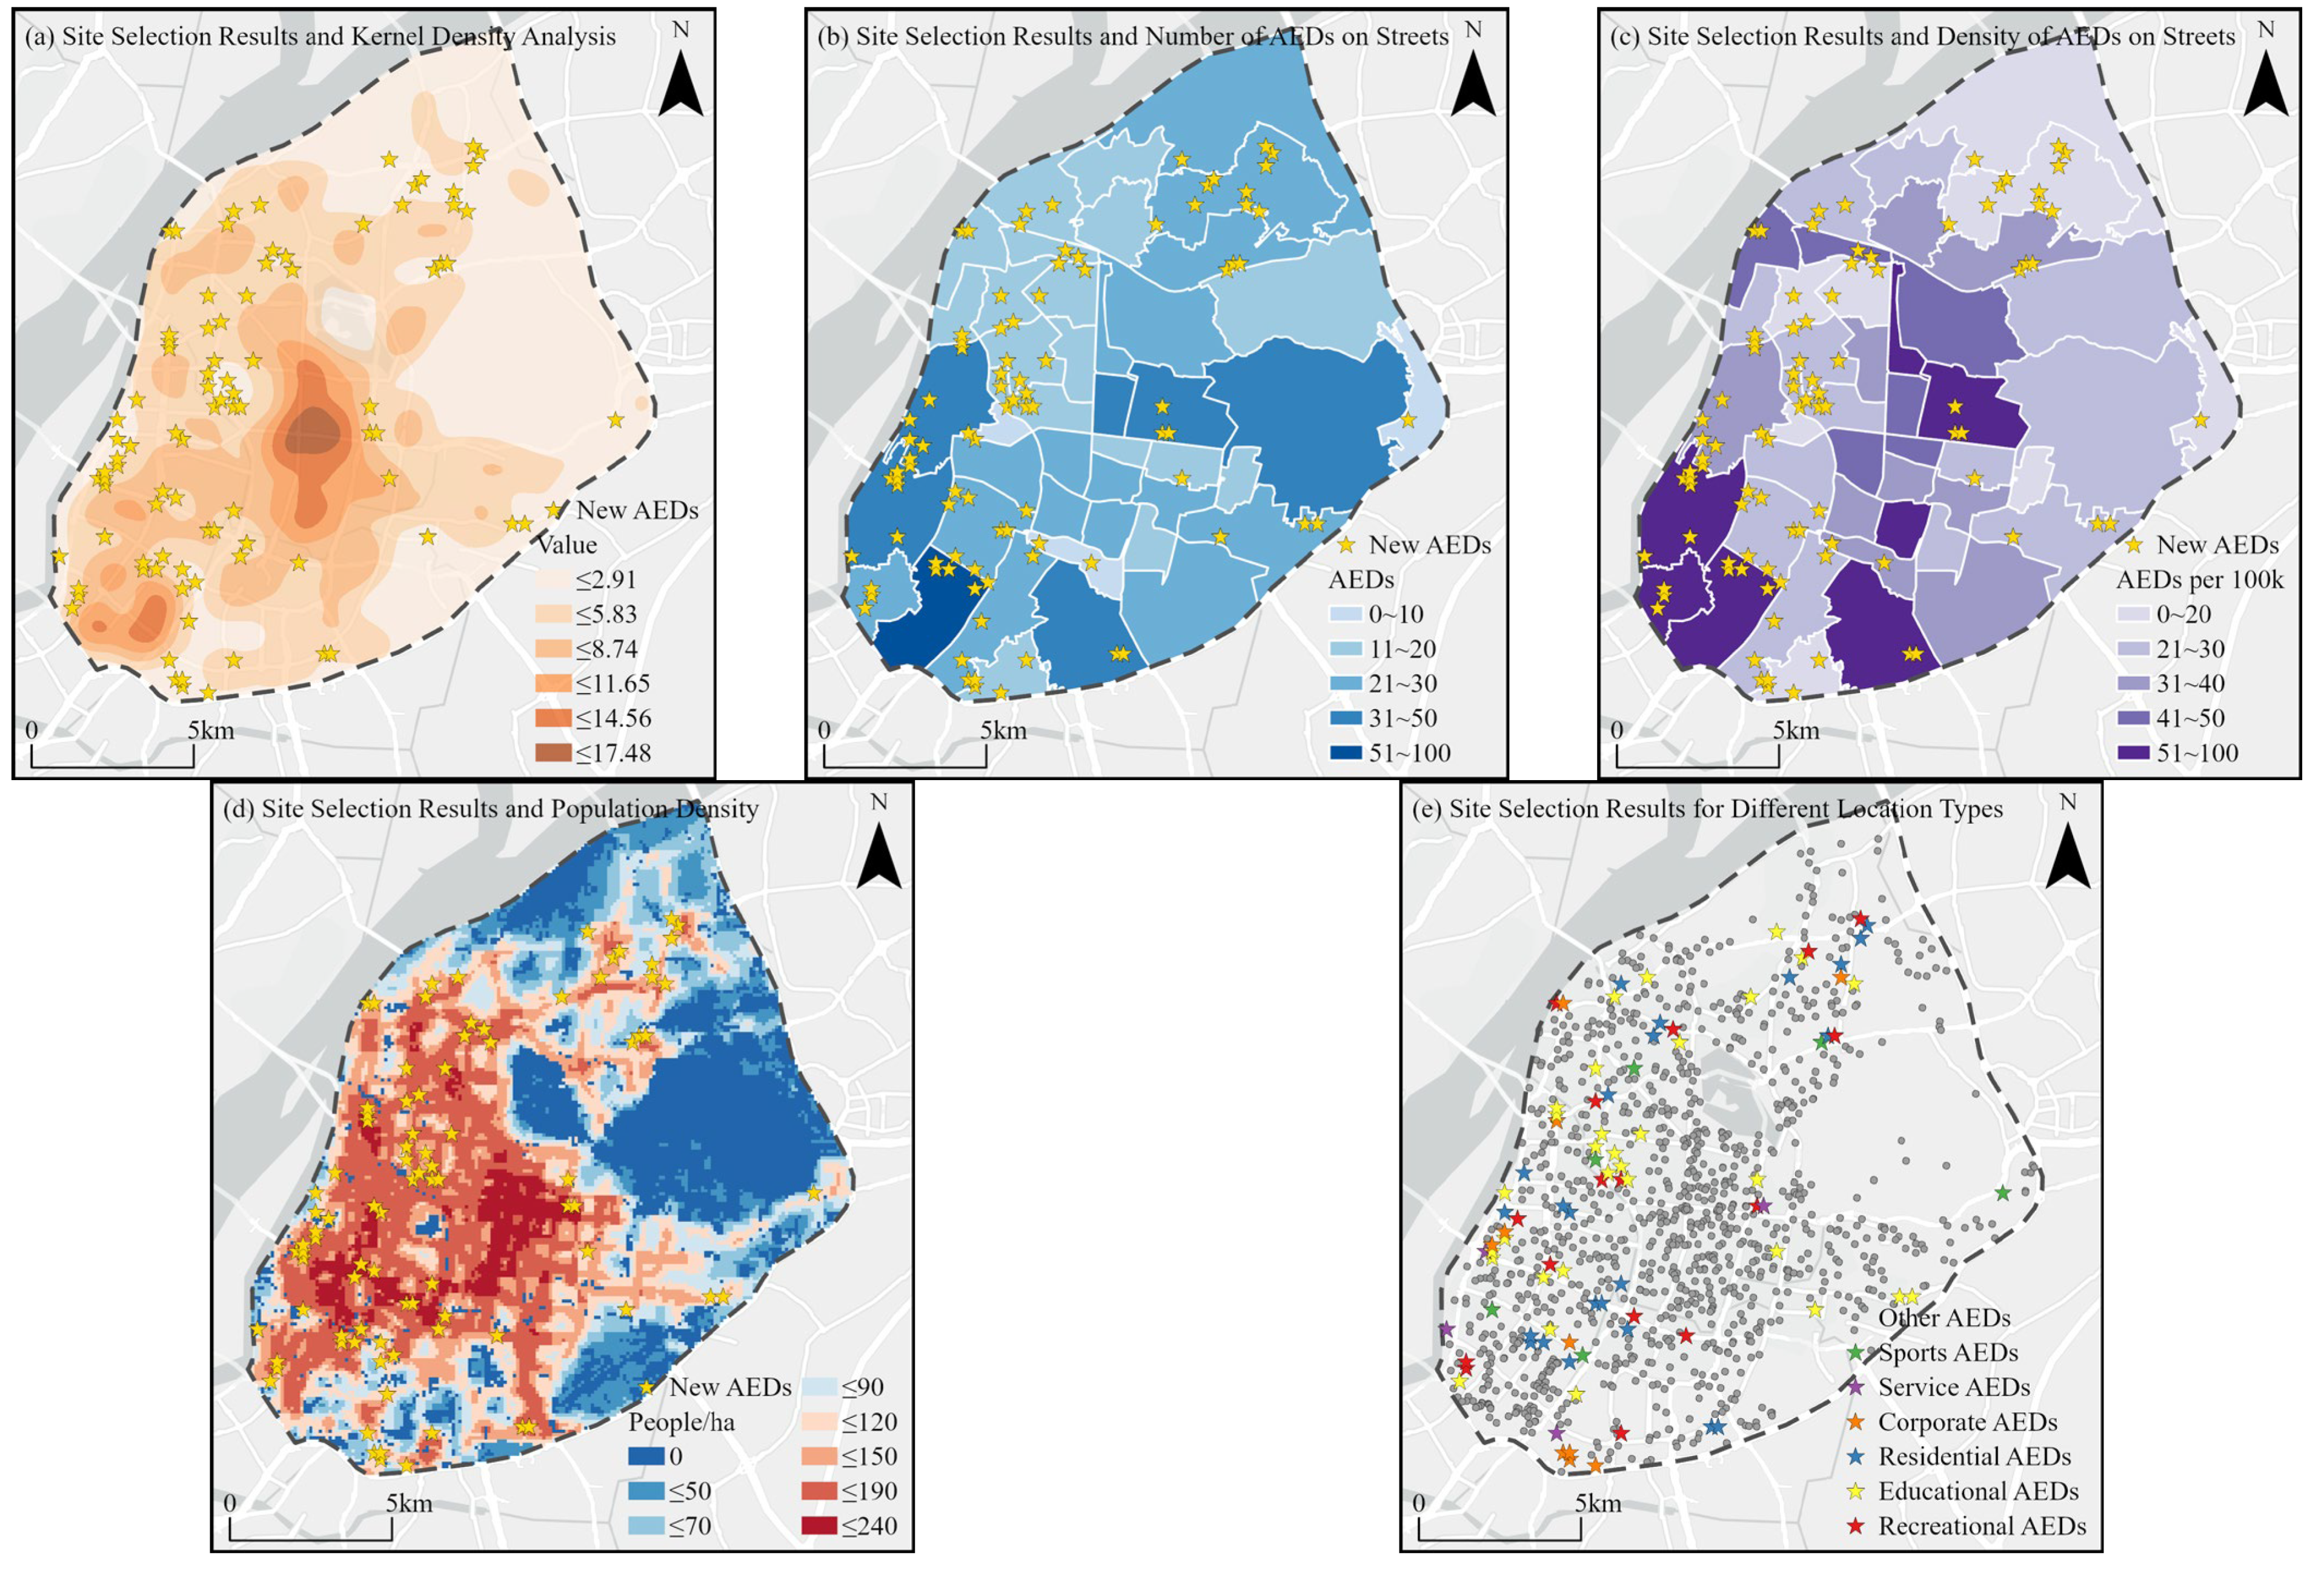
Spatial distribution: AEDs demonstrate a clustered distribution, radiating outward from the central area, with better distribution on the southwest side compared to the northeast. At the street level, distribution balance is poor, with a generally low number of AEDs and significant density differences. This pattern reflects differences in urban functional zones and population density, indicating that certain areas, especially in the northeast, have an insufficient number of devices.
(2)
Coverage capacity: The overall coverage of AEDs, in terms of both area and population, is relatively consistent, with a coverage rate of around 90% within a 400 m range. However, the coverage rates within 200 m and 100 m ranges are only 50% and 20%, respectively, indicating substantial room for improvement, particularly in emergency response times. This is especially relevant for areas with high population density and high-risk zones, where increasing the density of AEDs is crucial to ensuring timely access to life-saving equipment.
(3)
Venue types: AEDs in residential areas and public service facilities account for more than half of the distribution. AEDs in corporate and educational institutions are concentrated in specific areas, with a bias towards the southwest and southeast sides, respectively. Leisure and entertainment AEDs are centralized in the central region, while AEDs in medical and health facilities are primarily located in communities with higher elderly populations. While transportation hubs are adequately equipped, AEDs in sports venues are scarce, and their availability needs to be significantly increased to address potential high-risk sports scenarios associated with sporting activities.

3.2. Optimization Strategy for the Distribution of AEDs

3.2.1. Analysis of Parameter Settings

This study adopts the average population number, the number of newly covered people, and the average service capacity as site selection indicators. For detailed processing and calculation methods, the parameter settings for the algorithm in this study are as follows: population size 100, number of iterations 100, crossover probability 0.5, mutation probability 0.1, demand grid count 5287, candidate grid count 964, and coverage radius of 0, 1, and 2 levels.
To determine the most appropriate number of sites, this study first conducts preliminary experiments, setting the number of sites between 10 and 120, and comparing the differences in indicators under different numbers of sites. The experimental results are shown in Table 3. In terms of the rate of increase in fitness, when the number of sites increases to 100, the rate of increase in fitness drops below 5%. Considering the coverage rate within a 400 m radius, the rate of increase stabilizes at around 3% after the number of sites exceeds 80. Regarding the coverage rate within a 200 m radius, the rate of increase drops to around 10% when the number of sites reaches 90 and then tends to stabilize. Therefore, this study ultimately sets the numbers of AEDs sites at 90 to meet the needs of city residents for AEDs and to achieve efficient use of resources.

3.2.2. Analysis of Site Selection Results

After multiple repeated experiments, the final site selection results indicate the following findings (Table 4): For the average population size, over 50% of the selected sites in the results have a population scale higher than the mean, and 20% of the selected sites have a population exceeding 700, reaching the level of the top 10% of population density in the main urban area. For the number of newly covered grids, the site selection results have added coverage to 718 grids, with 381 new covered grids under the 200 m coverage radius, correspondingly increasing the coverage rate by 7.21%, which is a significant improvement. For the average service capacity, the AEDs’ service capability in the site selection results is relatively weak, with 64 (over 70%) selected sites having a service capacity below the average level, and about 25% (23 sites) having a service capacity of less than 1.0. Overall, the site selection results are essentially located in areas where AED supply is insufficient but demand is high, and the coverage rate improvement under the 200 m radius is evident. Compared with the current spatial configuration of AEDs, the site selection results show significant improvements on multiple levels and can effectively enhance the level of AED equipment and optimize the layout structure of AEDs. The specific analysis is as follows.
In terms of spatial distribution, the site selection results did not alter the current distribution type of AEDs but complemented the existing gaps in AED coverage. As shown in Figure 10a, the 90 site selection points are all located in the low-density areas surrounding the medium-to-high-density areas of AEDs, effectively filling the AED vacancies in multiple regions. At the street level (Figure 10b,c), the site selection results prioritized streets with insufficient AED distribution, with 44 site selection points located in streets with lower facility density levels and 59 site selection points in streets with medium-to-low facility quantity levels. After the site selection, the facility quantity level of eleven streets was upgraded, and the facility density level of seven streets was improved, indicating that the site selection results were effective in enhancing the distribution of AEDs at the street level.
In terms of coverage capability, the AEDs after site selection have seen an increase in both coverage area and served population within the 200 m and 100 m ranges. As shown in Table 5 and Figure 10d, within the 200 m range, the spatial coverage rate increased by 5.02%, with an average additional coverage area of about 1 km2 per site selection point, and the population coverage rate increased by 5.26%, with an average of about 1300 additional people served per site selection point. Within the 100 m range, the spatial coverage rate increased by 1.56%, with an average additional coverage area of about 300 m2 per site selection point, and the population coverage rate increased by 2.17%, with an average of about 530 additional people served per site selection point. With the number of site selections accounting for only about 8% of the total AEDs, the coverage area and served population within the 100 m and 200 m ranges have been enhanced by approximately 2% and 5%, respectively, achieving a satisfactory optimization effect.
In terms of venue types, 90 site locations were considered for the placement of appropriate AEDs. The results are depicted in Figure 10e: thirty-one sites are categorized under educational institutions, which include primary schools, secondary schools, and higher education establishments; sixteen sites are designated for leisure and entertainment venues, encompassing various scenic spots, shopping malls, and shopping centers; ten sites are located within corporate enterprises; six sites are situated in professional sports facilities; four sites are allocated to public service venues such as public security and administrative authorities; and twenty-three sites are positioned within communities, where they can be installed in community service halls, party–mass service centers, and community health centers, among others.
Regarding educational areas, in accordance with the aforementioned planning, eighteen schools in the northern part of the main urban area and nine schools in the southwestern part will be newly equipped with AEDs. This not only increases the number of AEDs in educational institutions but also balances the distribution of AEDs in educational institutions within the main urban area, safeguarding the lives of students during their time on campus.
For residential and medical areas, the site selection experiment in this paper focuses on the emergency medical needs of residents at the community and street levels. Therefore, approximately one-fourth of the newly added AEDs are set up in public institutions within communities (service centers, health centers) to enhance community emergency medical standards and serve more community residents.
As for sports-related areas, among the new sites, six AEDs are installed in large sports venues, which essentially achieves AED coverage in the large sports venues within the main urban area. However, many smaller sports venues still face a significant shortage of AEDs, such as small basketball courts, football fields, standalone gyms, swimming pools, boxing gyms, etc., within communities. Due to their scattered distribution and small size, adding a small number of AEDs is insufficient to meet their needs, while the cost pressure of adding a large number of AEDs is considerable, making it very challenging to achieve full AED coverage in small sports venues.
In conclusion, the site selection outcomes exhibit satisfactory performance across various selection metrics, thereby achieving an optimal effect. Relative to the current configuration, the spatial distribution of the selected sites has effectively addressed the AED coverage deficits within the main urban areas, thereby enhancing the quantity and density of AEDs across numerous streets. With respect to coverage capacity, the outcomes of the site selection have significantly improved the coverage area and the number of people served within the 100 m and 200 m radii. In terms of venue types, the site selection has compensated for the current insufficiencies in AED distribution within educational institutions, increased the number of AEDs in communities, and optimized the layout of AEDs in large sports facilities.

4. Discussion

4.1. Characteristics of Spatial Optimization Research

This study systematically assessed the spatial configuration of AEDs in Nanjing’s main urban area and optimized their layout by constructing a coverage location model. The findings reveal significant deficiencies in current AEDs layout concerning spatial distribution, coverage capacity, and venue types [65]. To address these issues, the study used a genetic algorithm for site optimization experiments, effectively enhancing the city’s emergency medical service capabilities. The optimization results indicate that the site selection has performed well in filling gaps, improving coverage rates, and improving the configuration of AEDs in key venues, fully demonstrating the effectiveness of the genetic algorithm in solving the spatial optimization of public medical facilities [66]. The main findings are reflected in the following three aspects.
Firstly, the effectiveness of the optimization algorithm was validated. This study utilized a site selection method based on a genetic algorithm, with parameters including population size, iteration count, crossover probability, and mutation probability, etc. Systematic experiments were conducted with varying site selection numbers, identifying 90 as the optimal number of locations. Unlike traditional fixed or simplified methods, this study dynamically adjusted parameters and conducted multiple experiments to find the optimal site selection number for the best optimization results. This method has higher adaptability and precision, which can better meet the needs of AEDs and achieve efficient use of resources in practical applications [67]. Currently, AEDs in the main urban area of Nanjing show a clear clustered distribution, mainly concentrated in the central area and radiating outward. Particularly in core commercial areas such as Gulou, Xinjiekou, and Confucious Temple, as well as financial service areas like Hexi CBD, significant AED hotspots have formed. In contrast, the northeastern Zhongshan Scenic Area and Muyan Binjiang Scenic Area have less demand and a sparser distribution of AED facilities. The new site selection scheme effectively fills the gaps in AED equipment in the main urban area of Nanjing, especially in areas with medium and low density and insufficient AED distribution. This optimization not only maintains the clustered distribution pattern of AEDs but also significantly improves the coverage in urban fringe areas, enhancing the balance of AED configuration between different areas.
Secondly, a significant enhancement in coverage capacity was achieved. While the coverage of existing AEDs is relatively sufficient within a 400 m range, it decreases sharply within smaller ranges (200 m and 100 m) [67,68]. This indicates that in critical emergency situations, especially in high-density population areas, the current number and distribution of AEDs are insufficient to meet the requirements for efficient emergency medical services. Although the layout of AEDs generally aligns with population distribution, there remains considerable room for optimization in densely populated areas, necessitating an expansion of both the breadth and depth of coverage to achieve a higher level of emergency medical services. The research results show that optimized site selection led to a 7.21% increase in spatial coverage within a 200 m range, with each new site providing an average additional coverage area of approximately 1 km2. The population coverage rate also increased by 5.26%. Compared with traditional static distribution models, this study significantly improved coverage capacity and served the population by dynamically adjusting the location of site selection points, indicating that the optimization algorithm can effectively enhance the coverage effect of emergency resources [68].
Lastly, a multi-level, targeted approach was employed to address the complex distribution challenges of AEDs across different venue types. Significant disparities exist in AED distribution, with educational institutions concentrated in the southeast, while the northwest remains underserved, and sports venues face a severe shortage of AEDs [65]. The new site selection optimization not only focuses on the overall coverage rate and service capacity but also refines specific coverage radii (100 m, 200 m, 400 m), different venue types (educational institutions, leisure and entertainment venues, sports venues, etc.), and street-level distributions. Forty-four new site selection points were added to streets with lower facility density, improving the facility density of seven streets [66]. This multi-level analysis method makes the research more comprehensive, allowing for tailored optimization based on specific scenario requirements and adjusting configurations accordingly. It better addresses real-world needs and application scenarios, enhancing both the rationality and effectiveness of site selection. In contrast, traditional system theory often focuses on overall distribution optimization and may not fully consider the complexity of different fields, potentially overlooking specific demand differences.

4.2. Planning Policy Recommendation

Based on the study of the existing distribution characteristics of AEDs and the site selection optimization in the main urban area, in order to enhance the efficiency of urban AEDs emergency facilities, this paper proposes the following three policy recommendations:
(1) Reduce regional disparities and balance facility distribution. The study’s results indicate that there are significant differences in the density of AEDs across various streets. In densely populated areas, despite a higher number of facilities, they still struggle to meet actual needs; in contrast, in sparsely populated areas, the number of facilities is significantly insufficient. According to the “Requirements for the Placement of Automatic External Defibrillators in Public Places”, the facility density should reach 100–200 units per 100,000 people. Although the current level of AED deployment has not yet met the standards, the optimization plan proposed in this paper can effectively enhance the AED configuration in several areas of the main urban district of Nanjing, thereby meeting the emergency medical needs of a broader population. Therefore, it is suggested that relevant departments develop a more refined AED allocation plan based on the population size, mobility, and emergency medical needs of each area, particularly focusing on areas with low AEDs density, to ensure that all citizens can receive emergency medical services in a timely manner [69].
(2) Enhance coverage and strengthen emergency medical services. The study results show that while the main urban area has essentially achieved full coverage within a 400 m range, the coverage capacity within 100 m and 200 m ranges is still insufficient. Relevant studies point out that it is necessary to reasonably control the distance between AEDs and the coverage range of facilities to reduce patients’ waiting time and maximize the use of emergency medical resources. Therefore, it is recommended that relevant departments enhance the coverage capacity within 100 m and 200 m ranges of AEDs, enabling more areas to receive emergency medical services within a shorter time frame and thereby enhancing the overall emergency response capacity of the city.
(3) Prioritize key venues and optimize spatial configuration. The research indicates that in public places, especially sports venues (such as community basketball courts, gyms, etc.) and educational institutions, entertainment venues still have an insufficient configuration of AEDs. The “Nanjing Pre-hospital Medical Emergency Regulations” specify that schools and sports venues, as densely populated places, should be equipped with necessary emergency medical devices to safeguard the health rights of citizens. Therefore, optimizing the AED configuration layout in key public places in the city is of great significance for building an urban emergency protection system.

4.3. Study Limitations and Future Work

This study analyzed the current spatial configuration of AEDs in the main urban area of Nanjing and used a genetic algorithm to optimize their layout. However, there are still some shortcomings. The AED data used in this study are limited, as some mobile AEDs and those not open to the public were not included, leading to a certain deviation between the AED data and the actual situation. In the site selection optimization study, the opening hours of AED were not taken into account. Since the opening hours of the venues where AEDs are located can limit the usability of AEDs, this means that the service level of AEDs at night should differ from that during the day. Future research should consider the dynamic distribution of AEDs, combining spatial and temporal changes of AEDs to study their layout and optimization issues.

5. Conclusions

In this study, various spatial analysis methods were employed to examine the current spatial distribution of AEDs in the main urban area of Nanjing. A genetic algorithm was utilized to construct a coverage location model aimed at optimizing the placement of AEDs in the city. The primary conclusions are as follows.
This study evaluates the current spatial configuration of AEDs in the main urban area of Nanjing by analyzing their spatial distribution, coverage capacity, and the types of venues where they are located. The findings indicate the following characteristics: (1) Uneven spatial distribution: The current distribution of AEDs is clustered, showing a pattern of “radiating from the center to the periphery, with better distribution on the southwest”. Several “vacuum” areas, where AEDs are lacking, are evident. At the street level, there is an imbalance, with a low overall number of AEDs and significant density variations across different streets. (2) Insufficient coverage capacity: The spatial and population coverage of AEDs reaches 90% within a 400 m range, but coverage within 100 m and 200 m ranges remains inadequate. Future optimization efforts should focus on improving coverage at these shorter distances to ensure more efficient emergency response times. (3) Significant differences in venue types: There are notable disparities in the types of venues where AEDs are installed, indicating poor distribution equity. Certain types of venues, such as sports and recreational facilities, are particularly underserved, revealing a pressing need to address this shortage and improve the overall distribution of AEDs.
Based on the current distribution of AEDs, this study constructs a multi-objective decision-making coverage location model, using the maximum coverage model as a prototype, and employs a genetic algorithm to simulate site selection experiments, thereby optimizing the layout of AEDs in the main urban area of Nanjing. The site selection optimization study concludes as follows: (1) Optimized spatial layout: Spatially, by setting 90 site selection points, the study effectively filled the AED deficiency areas, improves the quantity and density of AEDs across various streets, and enhances the overall spatial layout in the urban area. (2) Enhanced coverage capacity: There is a significant improvement in spatial and population coverage rates within the 100 m and 200 m ranges, ensuring more comprehensive emergency coverage. (3) Improved venue distribution: The study addressed the shortage of AEDs in educational institutions, increased AED deployment in communities, and optimized their layout in sports venues.
In conclusion, this research demonstrates a clear advantage over traditional systemic theory in distribution optimization by optimizing the site selection algorithm, refining coverage analysis, targeting venue configurations, and improving the street-level placement of AEDs. The limitations of traditional systemic approaches, such as their lack of adaptability to dynamic demands and specific scenarios, are addressed in this study through systematic experimentation and dynamic adjustments, providing more accurate and practical solutions.

Author Contributions

Conceptualization, G.S.; methodology, G.S., J.L. and J.Z.; data processing, J.L.; writing—original draft, G.S., C.C. and J.Z.; investigation, J.N.; writing—review and editing, C.C., J.X., W.C., J.N. and Y.C. All authors have read and agreed to the published version of the manuscripts.

Funding

This research was funded by the 2024 Philosophy and Social Science Research in Colleges and Universities Program in Jiangsu Province (No. 2024SJYB0167); the 2023 Nanjing Tech University Talent Introduction and Development Program (No. YPJH2023-03); China Ministry of Education Humanities and Social Science Project (22YJCZH130).

Data Availability Statement

Data available in a publicly accessible repository. The original data presented in the study are openly available in Yangtze River Delta Science Data Center, National Science and Technology Infrastructure of China, and National Earth System Science Data Sharing Infrastructure at http://nnu.geodata.cn (accessed on 10 May 2024).

Acknowledgments

Acknowledgement for the data support from “National Earth System Science Data Center, National Science & Technology Infrastructure of China. (http://www.geodata.cn accessed on 30 January 2024)”. Acknowledgement for the policy consulting support from Institute for Emergency Governance and Policy in Nanjing Tech University.

Conflicts of Interest

The authors declare no conflicts of interest.

References

  1. Stokes, N.A.; Scapigliati, A.; Trammell, A.R.; Parish, D.C. The effect of the AED and AED programs on survival of individuals, groups and populations. Prehosp. Disaster Med. 2012, 27, 419–424. [Google Scholar] [CrossRef]
  2. Lin, B.C.; Chen, C.W.; Chen, C.C.; Kuo, C.L.; Fan, I.C.; Ho, C.K.; Liu, I.; Chan, T.C. Spatial decision on allocating automated external defibrillators (AED) in communities by multi-criterion two-step floating catchment area (MC2SFCA). Int. J. Health Geogr. 2016, 15, 17. [Google Scholar] [CrossRef] [PubMed]
  3. Chen, G.; Widener, M.J.; Zhu, M.; Wang, C.C. Identification of priority areas for public-access automated external defibrillators (AEDs) in metropolitan areas: A case study in Hangzhou, China. Appl. Geogr. 2023, 154, 102922. [Google Scholar] [CrossRef]
  4. Zhou, Z.; Zhang, J.; Zhao, X.; Niu, Y.; Zhang, J.; Feng, B.; Ge, P.; Liu, X.; Zhou, L.-S.; Wu, Y. Current status of support for automated external defibrillators (AEDs) in public places and factors influencing their sse in China: A cross-sectional study. J. Public Health 2023, 32, 2105–2120. [Google Scholar] [CrossRef]
  5. Knox, P.; Pinch, S. Urban Social Geography: An Introduction; Routledge: London, UK, 2014. [Google Scholar]
  6. Chan, T.C.; Li, H.; Lebovic, G.; Tang, S.K.; Chan, J.Y.; Cheng, H.C.; Morrison, L.J.; Brooks, S.C. Identifying locations for public access defibrillators using mathematical optimization. Circulation 2013, 127, 1801–1809. [Google Scholar] [CrossRef] [PubMed]
  7. Chan, T.C.; Demirtas, D.; Kwon, R.H. Optimizing the deployment of public access defibrillators. Manag. Sci. 2016, 62, 3617–3635. [Google Scholar] [CrossRef]
  8. Chen, C.; Tao, G.; Shi, J.; Shen, M.; Zhu, Z.H. A lithium-ion battery degradation prediction model with uncertainty quantification for its predictive maintenance. IEEE Trans. Ind. Electron. 2024, 71, 3650–3659. [Google Scholar] [CrossRef]
  9. Wei, W.; Ren, X.; Guo, S. Evaluation of public service facilities in 19 large cities in China from the perspective of supply and demand. Land 2022, 11, 149. [Google Scholar] [CrossRef]
  10. Liu, M.; Yan, J.; Dai, T. A multi-scale approach mapping spatial equality of urban public facilities for urban design. Heliyon 2023, 9, E18281. [Google Scholar] [PubMed]
  11. Fu, S.; Liu, Y.; Fang, Y. Measuring the differences of public health service facilities and their influencing factors. Land 2021, 10, 1225. [Google Scholar] [CrossRef]
  12. Chang, M.; Huang, L.; Zhai, T.; Zhu, J.; Ma, Y.; Li, L.; Zhao, C. A challenge of sustainable urbanization: Mapping the equity of urban public facilities in multiple dimensions in Zhengzhou, China. Land 2023, 12, 1545. [Google Scholar] [CrossRef]
  13. Huang, C.; Feng, Y.; Wei, Y.; Sun, D.; Li, X.; Zhong, F. Assessing regional public service facility accessibility using multisource geospatial data: A case study of underdeveloped areas in China. Remote Sens. 2024, 16, 409. [Google Scholar] [CrossRef]
  14. Tan, X.; Guo, C.; Sun, P. Study on rationality of public fitness service facilities in Beijing based on GIS. Sustainability 2023, 15, 1496. [Google Scholar] [CrossRef]
  15. Ding, L.; Xu, Z.; You, L.; Wu, Z. Assessing equal rights in obtaining urban public primary school services with case studies of Hangzhou in China. Habitat Int. 2022, 119, 102474. [Google Scholar] [CrossRef]
  16. Vadrevu, L.; Kanjilal, B. Measuring spatial equity and access to maternal health services using enhanced two step floating catchment area method (E2SFCA)—A case study of the Indian Sundarbans. Int. J. Equity Health 2016, 15, 87. [Google Scholar] [CrossRef] [PubMed]
  17. Li, Y.; Ran, Q.; Yao, S.; Ding, L. Evaluation and optimization of the layout of community public service facilities for the elderly: A case study of Hangzhou. Land 2023, 12, 629. [Google Scholar] [CrossRef]
  18. Liu, Z.; Li, S.; Zhao, X.; Wang, Z.; Chen, Y. Examining accessibility to medical resources for urban older adults with common diseases using multisource data: A case study of Beijing. J. Urban Plann. Dev. 2023, 149, 05023031. [Google Scholar] [CrossRef]
  19. Li, Y.; Lin, Y.; Geertman, S.; Hooimeijer, P.; Xu, W. Accessibility-based equity of public facilities: A case study in Xiamen, China. Appl. Spat. Anal. Policy 2021, 14, 947–968. [Google Scholar] [CrossRef]
  20. Ferguson, M.; Roberts, H.E.; McEachan, R.R.C.; Dallimer, M. Contrasting distributions of urban green infrastructure across social and ethno-racial groups. Landsc. Urban Plan. 2018, 175, 136–148. [Google Scholar] [CrossRef]
  21. Tahmasbi, B.; Mansourianfar, M.H.; Haghshenas, H.; Kim, I. Multimodal accessibility-based equity assessment of urban public facilities distribution. Sustain. Cities Soc. 2019, 49, 101633. [Google Scholar] [CrossRef]
  22. Liu, D.; Kwan, M.-P.; Kan, Z. Analyzing disparities in transit-based healthcare accessibility in the Chicago Metropolitan Area. Can. Geogr. Géographe Can. 2021, 66, 248–262. [Google Scholar] [CrossRef]
  23. Wu, Z.; Liu, C.; Yao, Z.; Zhang, Y. Research on optimizing the location and layout of national emergency material reserve. Sustainability 2022, 14, 15922. [Google Scholar] [CrossRef]
  24. Dang, J.; Wang, X.; Xie, Y.; Fu, Z. The location optimization of urban shared new energy vehicles based on P-Median model: The example of Xuzhou City, China. Sustainability 2023, 15, 9553. [Google Scholar] [CrossRef]
  25. Li, M.; Wang, F.; Kwan, M.-P.; Chen, J.; Wang, J. Equalizing the spatial accessibility of emergency medical services in Shanghai: A trade-off perspective. Comput. Environ. Urban Syst. 2022, 92, 101745. [Google Scholar] [CrossRef]
  26. Han, B.; Hu, M.; Zheng, J.; Tang, T. Site selection of fire stations in large cities based on actual spatiotemporal demands: A case study of Nanjing City. ISPRS Int. J. Geo-Inf. 2021, 10, 542. [Google Scholar] [CrossRef]
  27. Huang, Y.; Wang, X.; Chen, H. Location selection for regional logistics center based on particle swarm optimization. Sustainability 2022, 14, 16409. [Google Scholar] [CrossRef]
  28. Chen, Y.; Lai, Z.; Huang, C. Optimizing spatial location and service capacity of new schools toward maximum equity in the distribution of educational resources. J. Urban Plann. Dev. 2023, 149, 04023027. [Google Scholar] [CrossRef]
  29. Aydin, N. Decision-dependent multiobjective multiperiod stochastic model for parking location analysis in sustainable cities: Evidence from a real case. J. Urban Plan. Dev. 2022, 148, 05021052. [Google Scholar] [CrossRef]
  30. Jiang, Y.; Guo, B.; Yan, Z. Multi-criterion spatial optimization of future police stations based on urban expansion and criminal behavior characteristics. ISPRS Int. J. Geo-Inf. 2022, 11, 384. [Google Scholar] [CrossRef]
  31. Wang, Y.; Peng, Z.; Chen, Q. Model for public car park layout based on dynamic multiperiodic parking demands. J. Urban Plan. Dev. 2018, 144, 04018031. [Google Scholar] [CrossRef]
  32. Wang, S.; Zuo, Z.; Liu, Y. Study on location of bus stop in subway service area based on residents’ travel accessibility. Sustainability 2023, 15, 4517. [Google Scholar] [CrossRef]
  33. Sun, C.L.; Demirtas, D.; Brooks, S.C.; Morrison, L.J.; Chan, T.C. Overcoming spatial and temporal barriers to public access defibrillators via optimization. J. Am. Coll. Cardiol. 2016, 68, 836–845. [Google Scholar] [CrossRef] [PubMed]
  34. Martín-Fernández, S.; Martínez-Falero, E.; Peribáñez, J.R.; Ezquerra, A. GIS-based simulated annealing algorithm for the optimum location of fire stations in the Madrid region, Spain: Monitoring the Collapse Index. Appl. Sci. 2021, 11, 8414. [Google Scholar] [CrossRef]
  35. Xu, R.; Qin, Q.; Sun, T.; Wang, M.Y.; Liu, Q.L. Comprehensive evaluation model for resettlement site selection in karst areas using multiobjective particle swarm optimization. IEEE Access 2021, 9, 113759–113769. [Google Scholar] [CrossRef]
  36. Lin, C.H.; Chu, K.C.; Lee, J.T.; Kao, C.Y. Optimal deployment of automated external defibrillators in a long and narrow environment. PLoS ONE 2023, 18, e0264098. [Google Scholar] [CrossRef]
  37. Lorenzo, G.; Maria Antonia, B.; Piero Maria, B.; Andrea, P.; Guido Francesco, V.; Enrico Gianluca, C. Development of a novel framework to propose new strategies for automated external defibrillators deployment targeting residential out-of-hospital cardiac arrests: Application to the city of Milan. ISPRS Int. J. Geo-Inf. 2020, 9, 491. [Google Scholar] [CrossRef]
  38. Zhang, J.; Mu, L.; Zhang, D.; Rajbhandari-Thapa, J.; Chen, Z.; Pagán, J.A.; Li, Y.; Son, H.; Liu, J. Spatiotemporal optimization for the placement of automated external defibrillators using mobile phone data. ISPRS Int. J. Geo-Inf. 2023, 12, 91. [Google Scholar] [CrossRef]
  39. Aeby, D.; Staeger, P.; Dami, F. How to improve automated external defibrillator placement for out-of-hospital cardiac arrests: A case study. PLoS ONE 2021, 16, e0250591. [Google Scholar] [CrossRef]
  40. Liao, S.; Gao, F.; Feng, L.; Wu, J.; Wang, Z.; Chen, W. Observed Equity and Driving Factors of Automated External Defibrillators: A Case Study Using WeChat Applet Data. ISPRS Int. J. Geo-Inf. 2023, 12, 444. [Google Scholar] [CrossRef]
  41. Tian, X.; Zhang, Y.; Dou, D. Training Experience Is an Important Factor Affecting Willingness for Bystander CPR and Awareness of AED: A Survey of Residents from a Province in Central China in 2023. Front. Public Health 2024, 12, 1459590. [Google Scholar] [CrossRef]
  42. Chen, K.; Yuan, Q.; Zeng, Q.; Liu, M.; Hu, C. Public Knowledge and Willingness in the Use of Public Access Defibrillation of Hubei Province in China: A Cross-Sectional Study. Medicine 2024, 103, e36928. [Google Scholar] [CrossRef]
  43. Red Cross Society of China. Nanjing Promotes the Construction of AED Safe Community. 2022. Available online: https://www.redcross.org.cn/html/2022-06/86853.html (accessed on 21 November 2024).
  44. The Supreme People’s Procuratorate of the People’s Republic of China. The Representative Committee Called for Enhancing the Legal Provision Utilized by AED Allocation Management. 2024. Available online: https://www.spp.gov.cn/zdgz/202403/t20240305_647438.shtml (accessed on 21 November 2024).
  45. Yangtze River Delta Science Data Center, National Science and Technology Infrastructure of China. National Earth System Science Data Sharing Infrastructure. 2015. Available online: http://nnu.www.geodata.cn (accessed on 10 May 2024).
  46. National Bureau of Statistics of the People’s Republic of China. China Statistical Bureau 2023. Available online: http://www.stats.gov.cn (accessed on 14 June 2024).
  47. Chiu, C.-Y.; Prayoonwong, A.; Liao, Y.-C. Learning to index for nearest neighbor search. IEEE Trans. Pattern Anal. Mach. Intell. 2020, 42, 1942–1956. [Google Scholar] [CrossRef] [PubMed]
  48. Dumais, G.; Ellison, G.; Glaeser, E.L. Geographic concentration as a dynamic process. Rev. Econ. Stat. 2002, 84, 193–204. [Google Scholar] [CrossRef]
  49. Liu, Z. Global and local: Measuring geographical concentration of China’s manufacturing industries. Prof. Geogr. 2014, 66, 284–297. [Google Scholar] [CrossRef]
  50. Zhao, Y.; Wu, Q.; Wei, P.; Zhao, H.; Zhang, X.; Pang, C. Explore the mitigation mechanism of urban thermal environment by integrating geographic detector and standard deviation ellipse (SDE). Remote Sens. 2022, 14, 3411. [Google Scholar] [CrossRef]
  51. Shi, G.; Shan, J.; Ding, L.; Ye, P.; Li, Y.; Jiang, N. Urban road network expansion and its driving variables: A case study of Nanjing City. Int. J. Environ. Res. Public Health 2019, 16, 2318. [Google Scholar] [CrossRef] [PubMed]
  52. Ma, M.; Wu, Y.; Luo, W.; Chen, L.; Li, J.; Jing, N. HiBuffer: Buffer analysis of 10-million-scale spatial data in real time. ISPRS Int. J. Geo-Inf. 2018, 7, 467. [Google Scholar] [CrossRef]
  53. Church, R.; Revelle, C. The maximal covering location problem. Pap. Reg. Sci. 1974, 32, 101–118. [Google Scholar] [CrossRef]
  54. Pulver, A.; Wei, R.; Mann, C. Locating AED enabled medical drones to enhance cardiac arrest response times. Prehosp. Emerg. Care 2016, 20, 378–389. [Google Scholar] [CrossRef] [PubMed]
  55. Church, R.L. The planar maximal covering location problem. J. Reg. Sci. 1984, 24, 185–201. [Google Scholar] [CrossRef]
  56. Silva, A.M.C.B.; da Cunha, J.R.R.; da Silva, J.P.C. Estimation of pedestrian walking speeds on footways. Proc. Inst. Civil Eng. Munic. Eng. 2014, 167, 32–43. [Google Scholar] [CrossRef]
  57. Jin, S.; Shen, L.; Liu, M.; Ma, D. Modelling speed–flow relationships for bicycle traffic flow. Proc. Inst. Civ. Eng. Transp. 2017, 170, 194–204. [Google Scholar] [CrossRef]
  58. Jonsson, M.; Berglund, E.; Djärv, T.; Nordberg, P.; Claesson, A.; Forsberg, S.; Nord, A.; Tan, H.L.; Ringh, M. A Brisk Walk—Real-Life Travelling Speed of Lay Responders in out-of-Hospital Cardiac Arrest. Resuscitation 2020, 151, 197–204. [Google Scholar] [CrossRef] [PubMed]
  59. Valenzuela, T.D.; Roe, D.J.; Cretin, S.; Spaite, D.W.; Larsen, M.P. Estimating Effectiveness of Cardiac Arrest Interventions. Circulation 1997, 96, 3308–3313. [Google Scholar] [CrossRef] [PubMed]
  60. Larsen, M.P.; Eisenberg, M.S.; Cummins, R.O.; Hallstrom, A. Predicting Survival from Out-of-Hospital Cardiac Arrest: A Graphic Model. Ann. Emerg. Med. 1993, 22, 1652–1658. [Google Scholar] [CrossRef] [PubMed]
  61. Goldenberg, D.E. Genetic Algorithms in Search, Optimization and Machine Learning; Addison Wesley: Reading, MA, USA, 1989. [Google Scholar]
  62. Gao, F.; Lu, S.; Liao, S.; Chen, W.; Chen, X.; Wu, J.; Wu, Y.; Li, G.; Han, X. AED Inequity among Social Groups in Guangzhou. ISPRS Int. J. Geo-Inf. 2024, 13, 140. [Google Scholar] [CrossRef]
  63. Liu, J.; Li, Y.; Li, Y.; Zibo, C.; Lian, X.; Zhang, Y. Location Optimization of Emergency Medical Facilities for Public Health Emergencies in Megacities Based on Genetic Algorithm. Eng. Constr. Archit. Manag. 2023, 30, 3330–3356. [Google Scholar] [CrossRef]
  64. Bonnet, B.; Gama Dessavre, D.; Kraus, K.; Ramirez-Marquez, J.E. Optimal placement of public-access AEDs in urban environments. Comput. Ind. Eng. 2015, 90, 269–280. [Google Scholar] [CrossRef]
  65. Salami, A.; Afshar-Nadjafi, B.; Amiri, M. A Two-Stage Optimization Approach for Healthcare Facility Location- Allocation Problems with Service Delivering Based on Genetic Algorithm. Int. J. Public Health 2023, 68, 1605015. [Google Scholar] [CrossRef] [PubMed]
  66. Wang, C.; Wang, Z.; Tian, Y.; Zhang, X.; Xiao, J. A Dual-Population Based Evolutionary Algorithm for Multi-Objective Location Problem under Uncertainty of Facilities. IEEE Trans. Intell. Transp. Syst. 2022, 23, 7692–7707. [Google Scholar] [CrossRef]
  67. Rico, E.; Rabajante, J.; Tubay, J.; Lapitan, A.; Madrid, V.R. A Multi-Objective Site Selection Model for Evacuation Centers in Taguig City, Philippines. Nat. Hazards 2024, 120, 8303–8321. [Google Scholar] [CrossRef]
  68. Feng, Z.; Li, G.; Wang, W.; Zhang, L.; Xiang, W.; He, X.; Zhang, M.; Wei, N. Emergency logistics centers site selection by multi-criteria decision-making and GIS. Int. J. Disaster Risk Reduct. 2023, 96, 103921. [Google Scholar] [CrossRef]
  69. Sun, C.L.F.; Karlsson, L.; Torp-Pedersen, C.; Morrison, L.J.; Folke, F.; Chan, T.C.Y. Spatiotemporal AED optimization is generalizable. Resuscitation 2018, 131, 101–107. [Google Scholar] [CrossRef] [PubMed]
Figure 1. Research framework.
Systems 13 00064 g001
Figure 2. Study area: (a) Jiangsu province; (b) Nanjing city; (c) main urban area and distribution of AEDs.
Systems 13 00064 g002
Figure 3. Multi-ring buffer area of points.
Systems 13 00064 g003
Figure 4. Demand network and candidate network.
Systems 13 00064 g004
Figure 5. Coverage radius.
Systems 13 00064 g005
Figure 6. Algorithm process.
Systems 13 00064 g006
Figure 7. Distribution of AEDs in main urban area of Nanjing: (a) kernel density analysis of AEDs; (b) number of AEDs on street level; (c) density of AEDs on street level.
Systems 13 00064 g007
Figure 8. Relationship between AED buffer zones and population: (a) AEDs multiple-ring buffer zones; (b) population density.
Systems 13 00064 g008
Figure 9. Distribution of AEDs in different types of location: (a) distribution in residential areas; (b) distribution in public services; (c) distribution in companies and enterprises; (d) distribution in educational institutions; (e) distribution in leisure and entertainment; (f) distribution in medical and health facilities; (g) distribution in transportation; (h) distribution in sports areas.
Systems 13 00064 g009
Figure 10. Distribution of site selection and the influencing elements: (a) kernel density estimation of site selection; (b) site selection result and number of AEDs on street level; (c) site selection result and density of AEDs on street level; (d) site selection result and population density; (e) site selection result for different location types.
Systems 13 00064 g010
Table 1. Statistics of AEDs quantity and density at the street level.
AEDs QuantityQuantity at Street LevelDensity of AEDs
(per 100,000 People)
Quantity of Street
0~1030~208
11~201721~3013
21~301631~409
31~50641~506
51~100151~1007
Table 2. Statistics of AED quantities in different types of distribution locations.
TypeQuantityPercentage/%Rank
Residential area35033.981
Public services17316.802
Companies and enterprises12311.943
Educational institutions11210.874
Leisure and entertainment939.035
Medical and health facilities898.646
Transportation797.677
Sports area111.078
Table 3. Optimization experiment result.
Number of Newly Add AEDsAdaptationNewly Add Quantity/UnitChange of Coverage Rate/%
200 m400 m200 m400 m
10117.4750800.951.51
20298.09991381.872.61
30403.841471722.783.25
40468.561891843.573.48
50537.992322034.393.84
60593.942752185.204.12
70639.753112275.884.29
80687.873282516.204.75
90734.283812477.214.67
100771.084062527.684.77
110793.654392618.304.94
120827.344812629.104.96
Table 4. Optimization site selection result.
Newly Add QuantityAdaptationNewly Add Coverage/UnitChange of Coverage Rate/%
100 m200 m400 m100 m200 m400 m
90734.28903812471.707.214.67
Table 5. Effect on coverage rate of optimization using 900 AED locations.
Spatial Coverage Rate/%Population Coverage Rate/%
100 m200 m400 m100 m200 m400 m
Before optimization15.9648.6590.2217.4050.7787.95
After optimization17.5253.6795.6019.5756.0392.81
Disclaimer/Publisher’s Note: The statements, opinions and data contained in all publications are solely those of the individual author(s) and contributor(s) and not of MDPI and/or the editor(s). MDPI and/or the editor(s) disclaim responsibility for any injury to people or property resulting from any ideas, methods, instructions or products referred to in the content.

