

Operational Risk Assessment of Commercial Banks’ Supply Chain Finance

Abstract
:1. Introduction
- (1)
- We develop an enhanced LDA model, integrating copula functions to account for nonlinear dependencies between operational risk cells in SCF.
- (2)
- A structured operational risk loss database for SCF is constructed, providing empirical data to improve model accuracy and reliability.
- (3)
- Backtesting is conducted to ensure the robustness and applicability of the proposed model.
2. Literature Review
2.1. Overview of Supply Chain Finance
2.2. Risks Associated with Supply Chain Finance
2.3. Operational Risks Measurement and Supply Chain Finance
2.4. Operational Risks Measurement Models
3. Materials and Methods
3.1. General Data Collection
3.2. Methods
4. Results
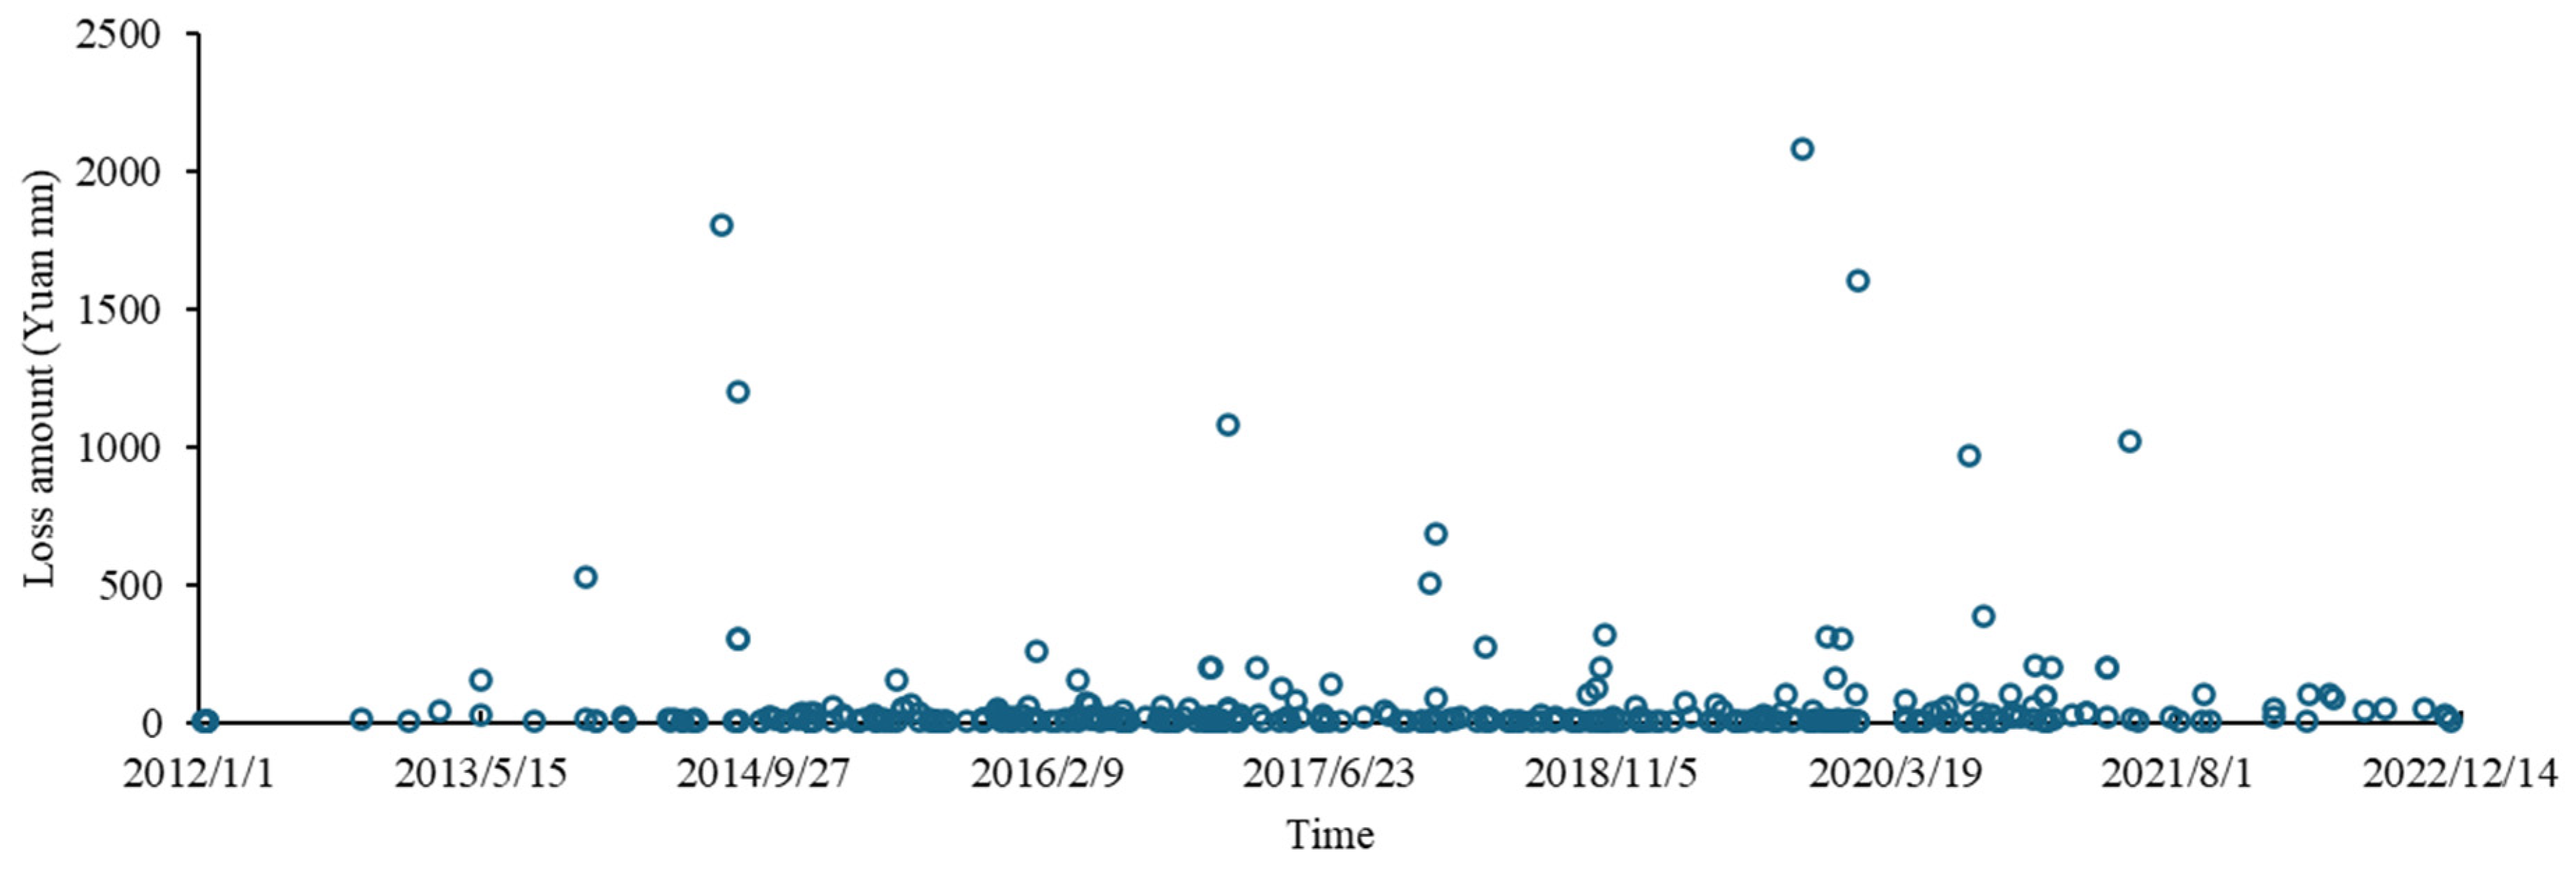
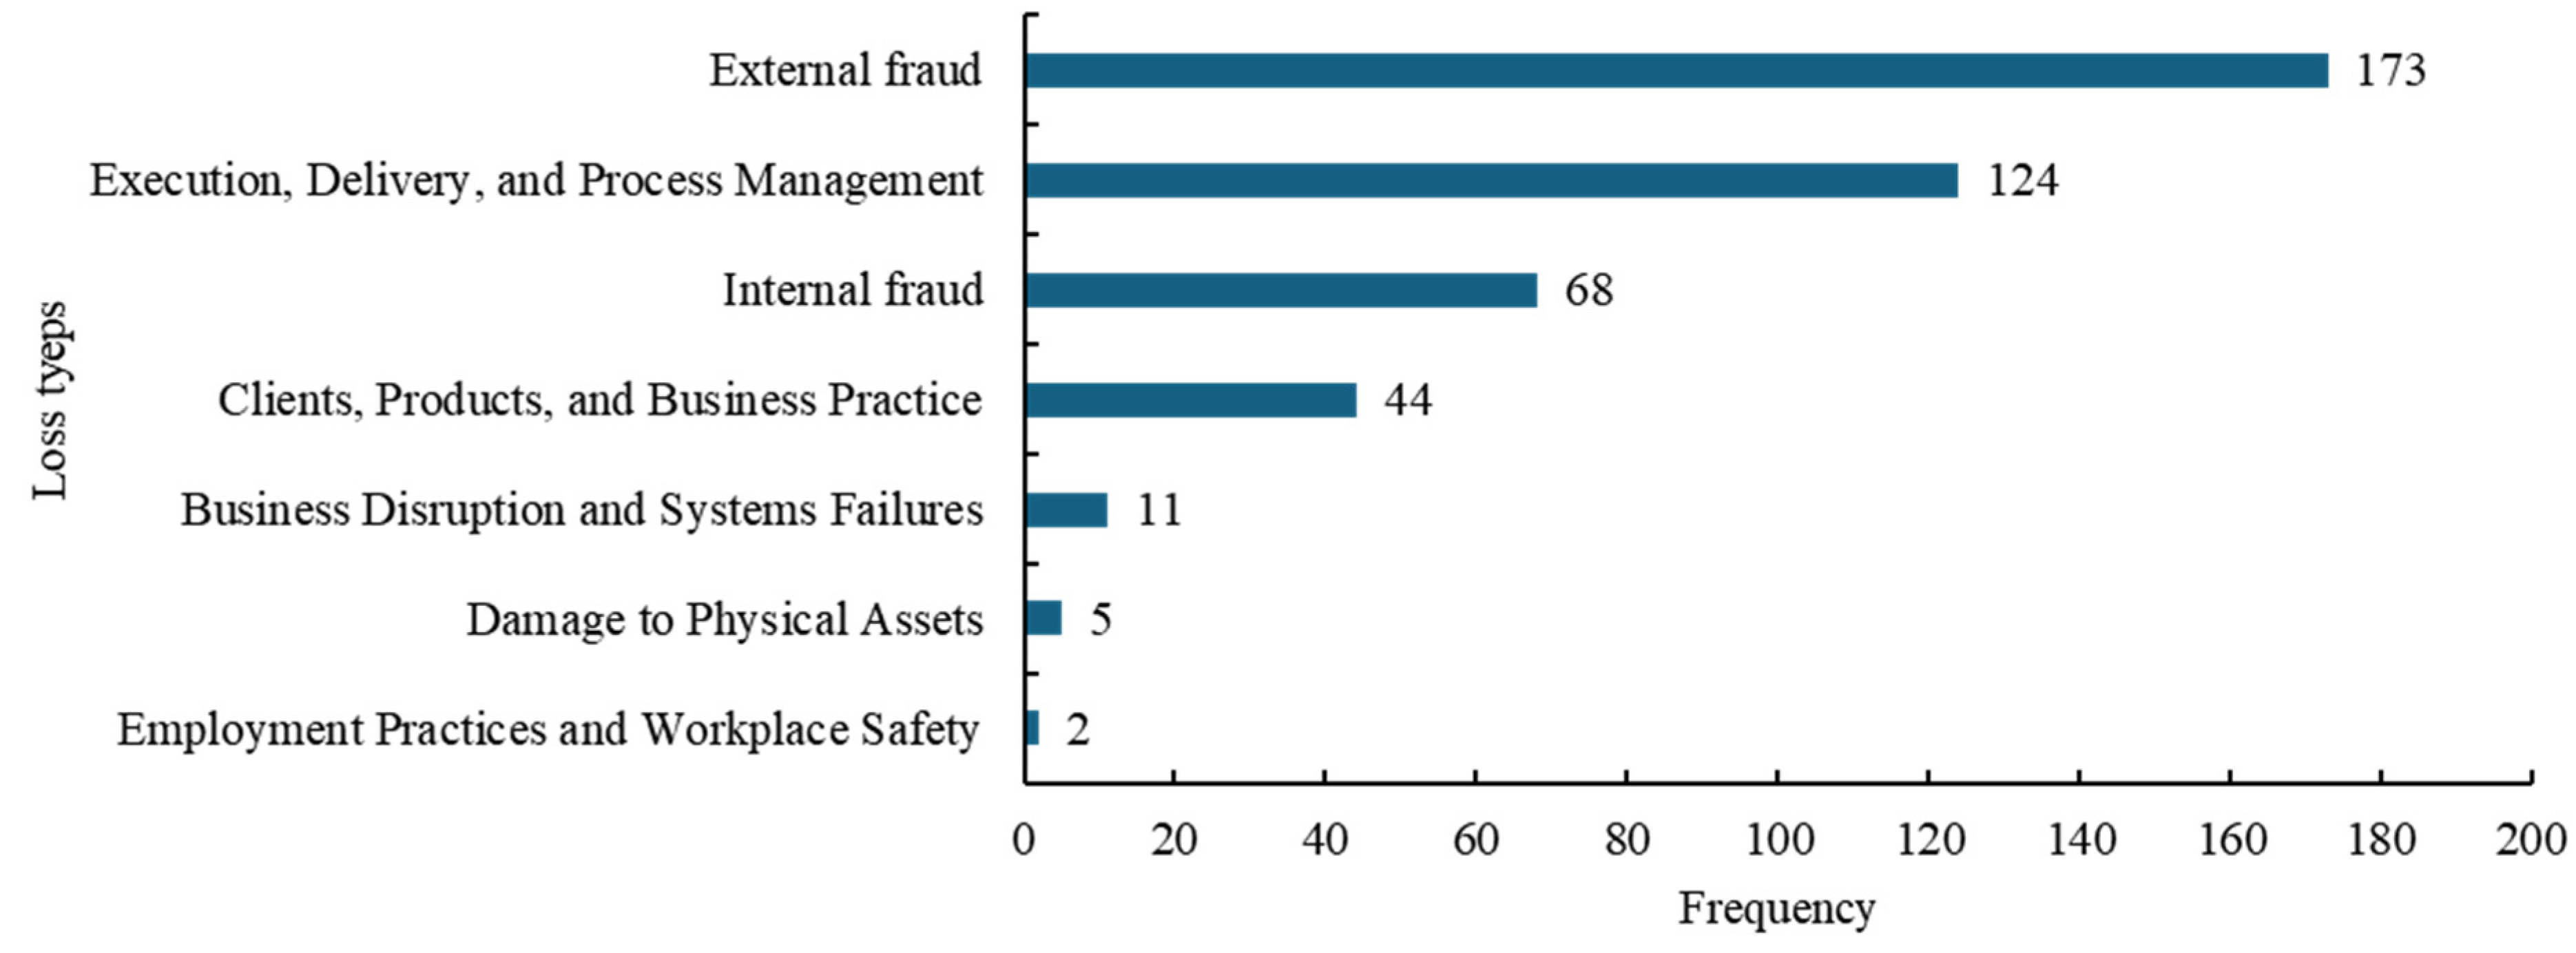
4.1. Data Analysis
4.2. Data Division by Risk Cells
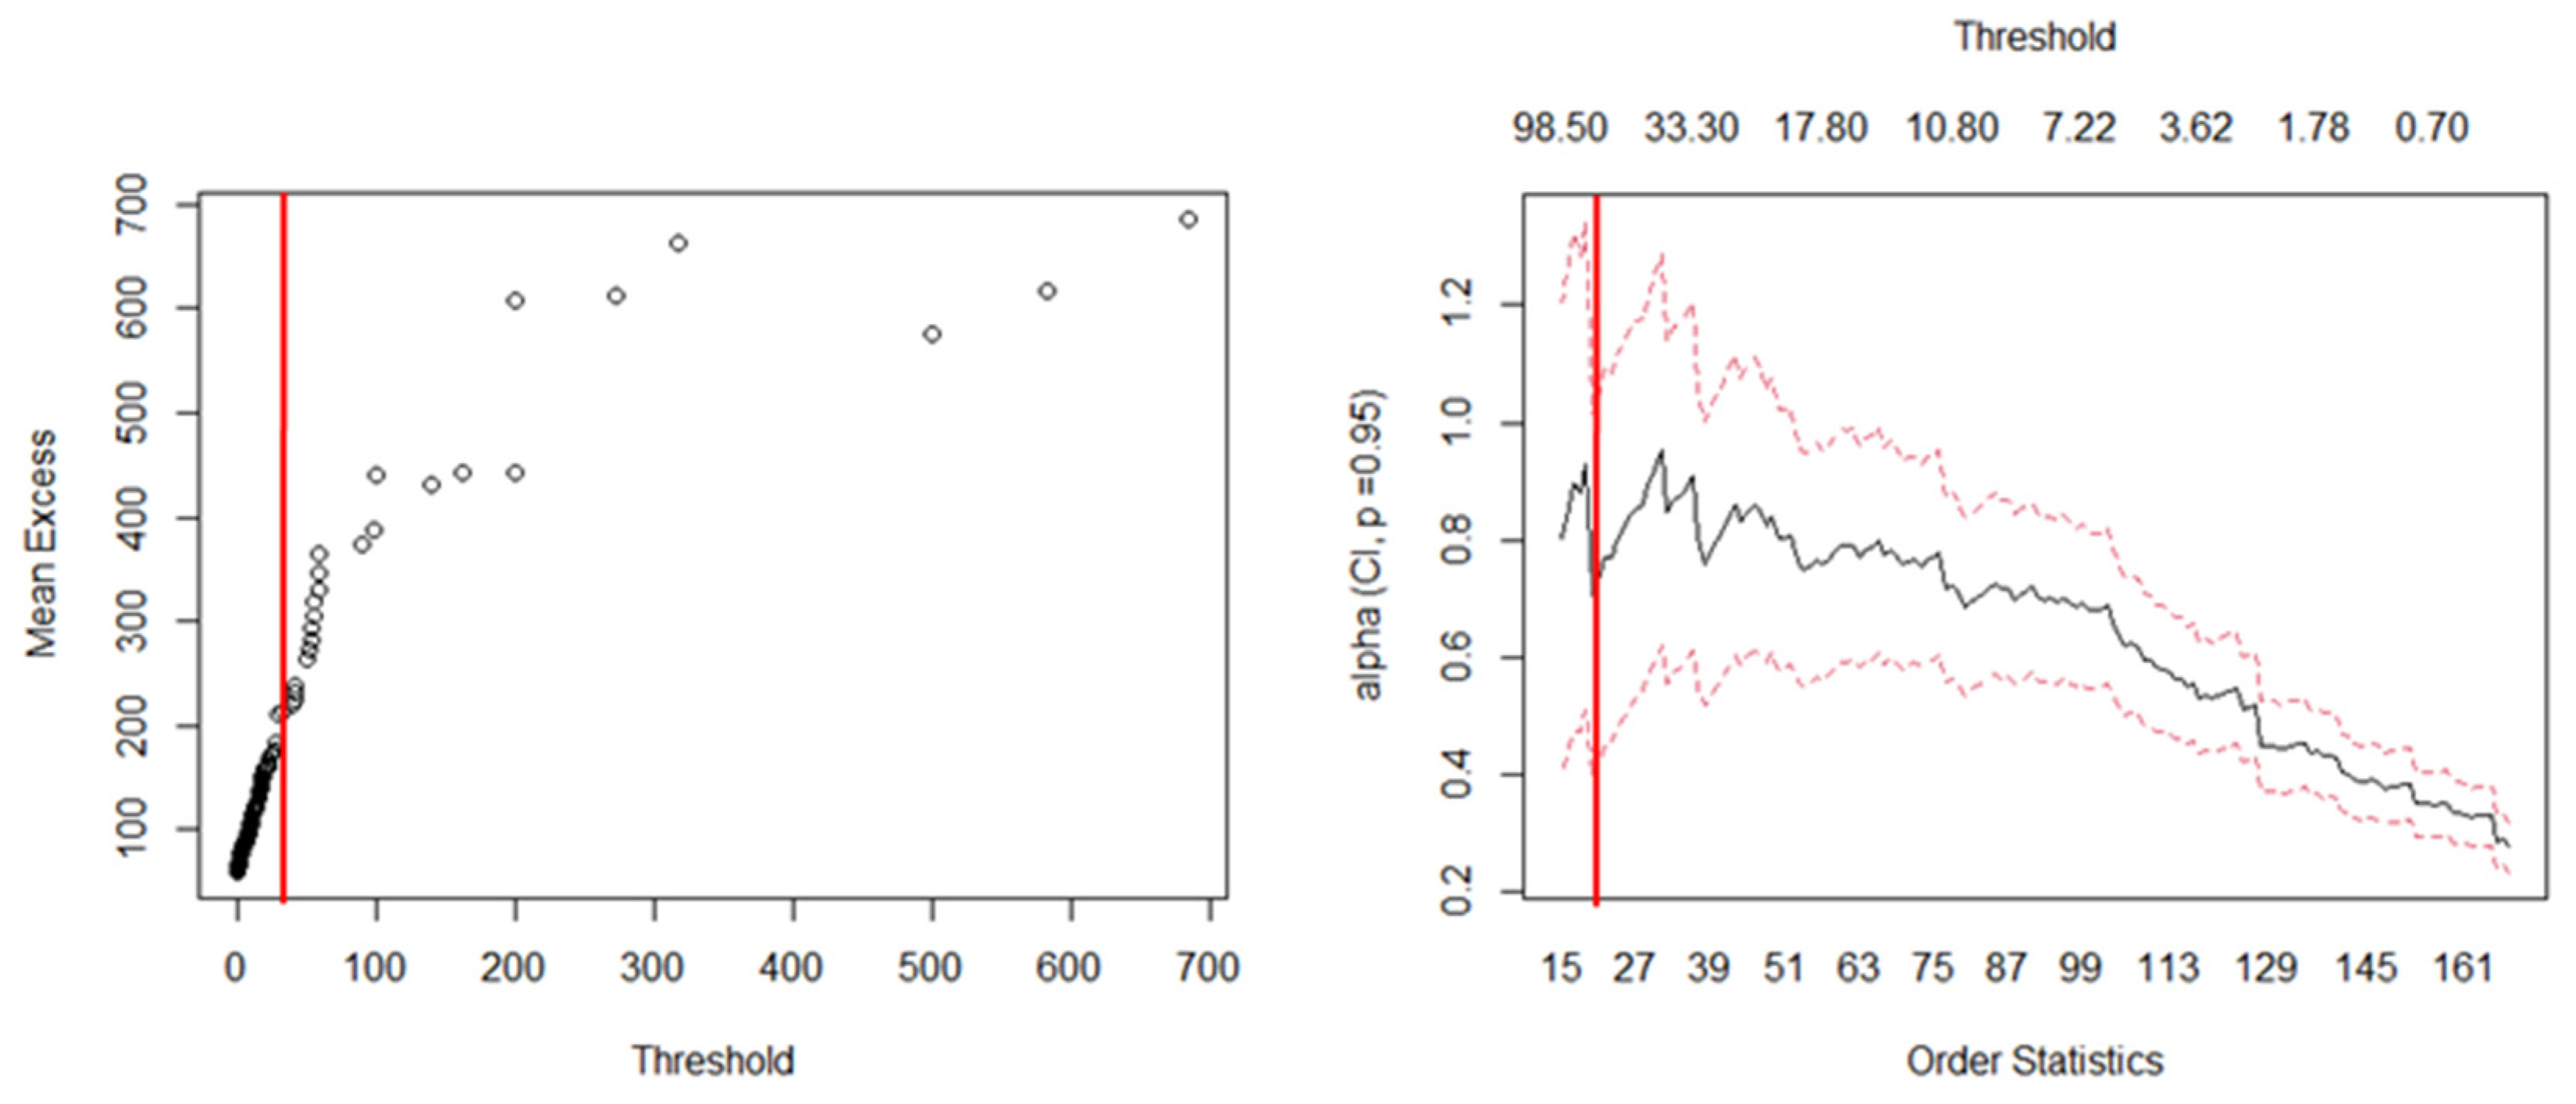
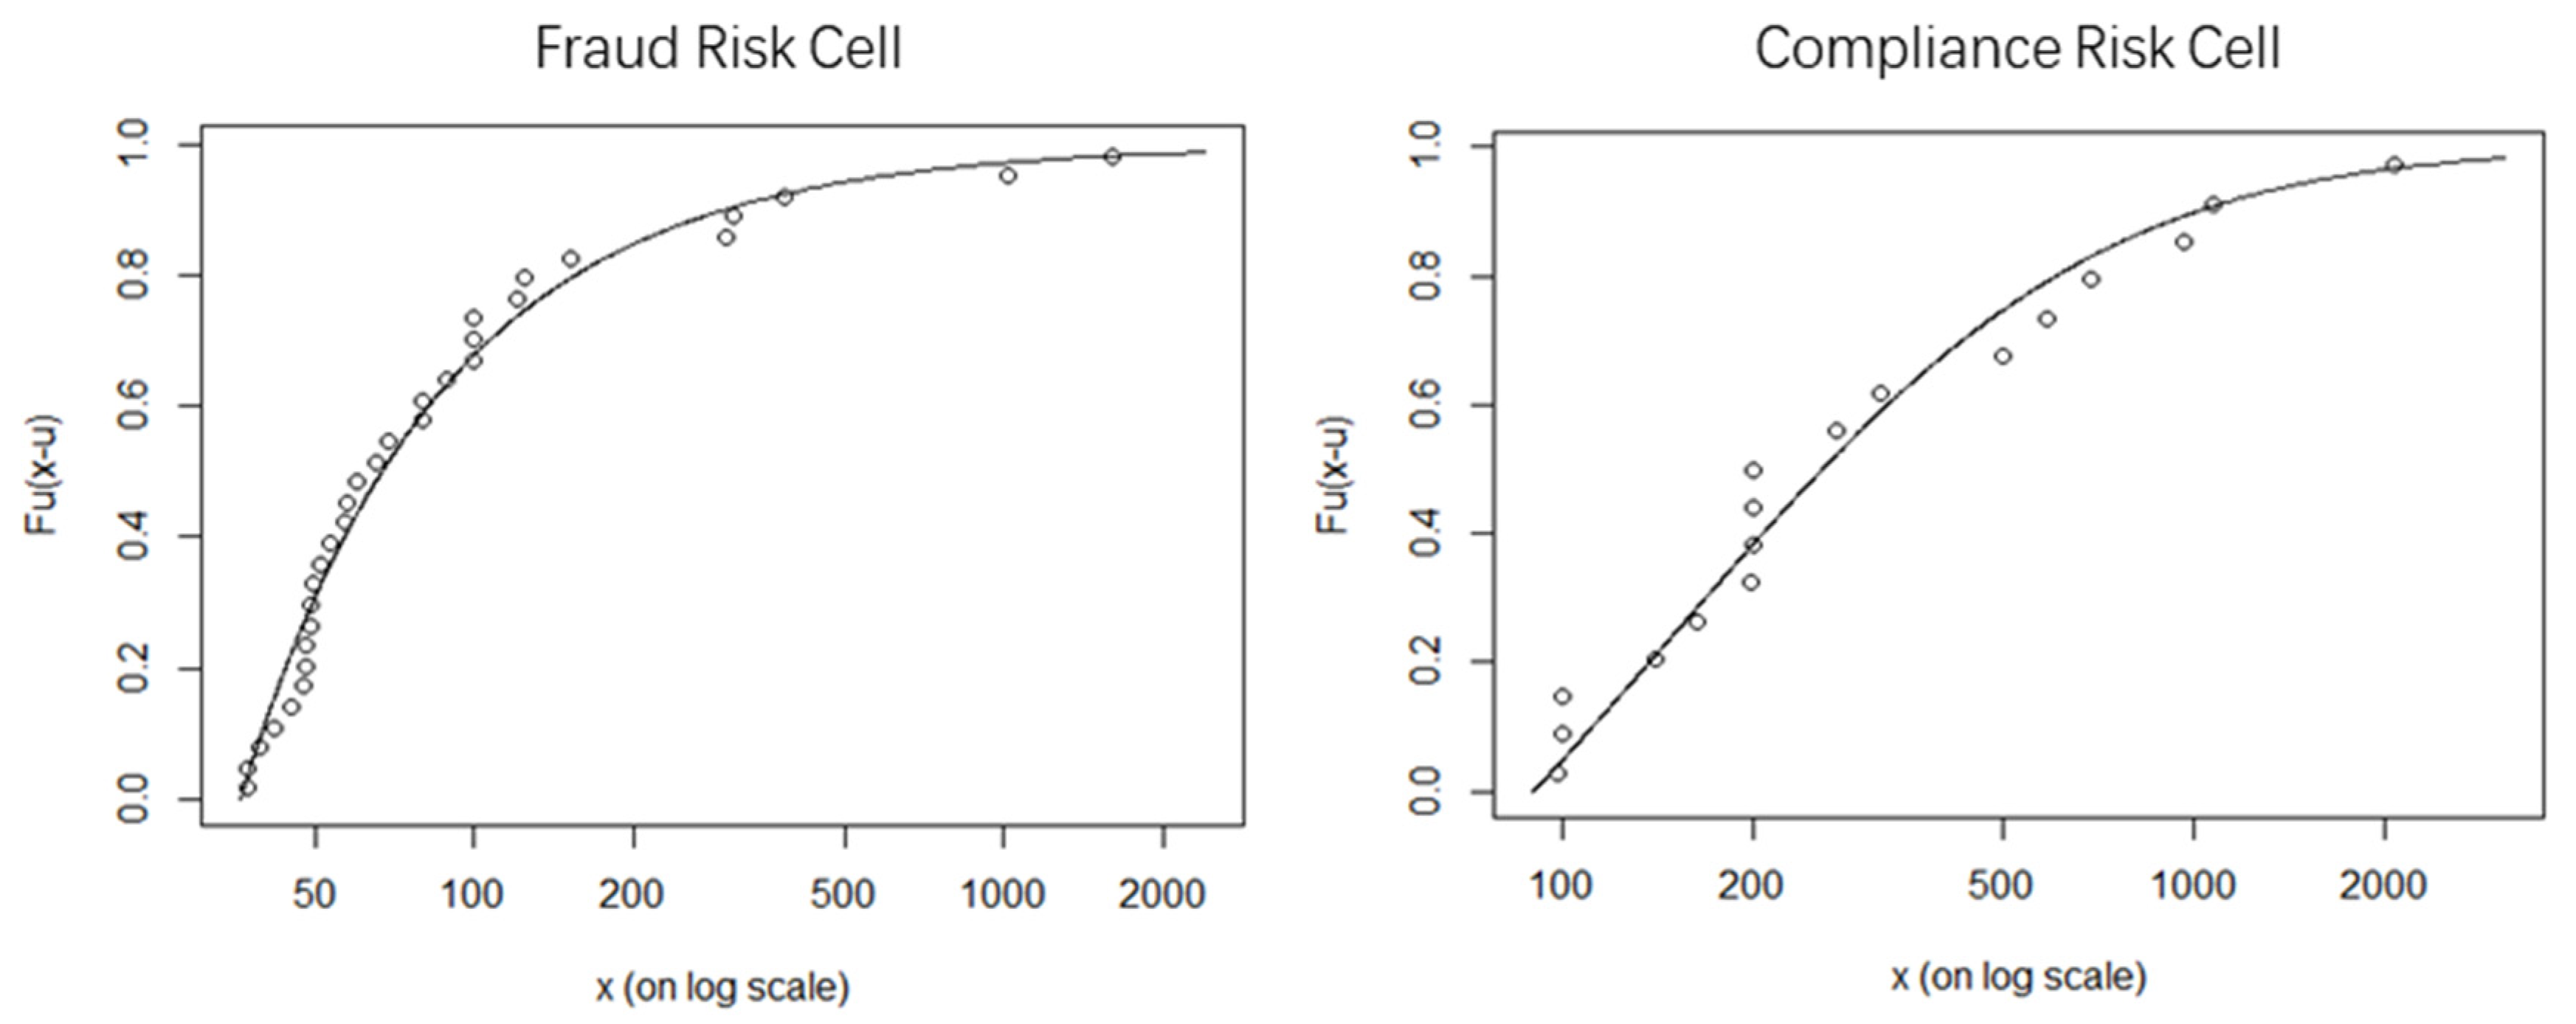
4.3. Segmented Marginal Distribution Goodness-of-Fit Test
4.4. Risk Measurement of Risk Cells
4.5. Backtesting
5. Discussion
6. Conclusions
6.1. Theoretical Implications
6.2. Policy Implications
- The collaboration between the government, banks, and enterprises involved in supply chain finance should aim to establish a data-driven regulatory framework for managing operational risks. This study proposes a method for assessing risk that relies on a comprehensive database of risk events and the organization of risk cells. It is advisable for all parties involved to utilize advanced technologies such as blockchain and big data to gather data from multiple sources, establish a database of supply chain finance operational risk events, and effectively monitor and report on various risk occurrences. In addition, it is advisable to employ supply chain finance operational risk assessment methodologies to accurately identify both typical risk categories and atypical occurrences within the business. This will aid organizations in reducing the financial impact of risks, enhancing their ability to adhere to compliance requirements and regulatory standards, and enhancing the proactivity and predictive capabilities of their risk management. Similarly, this data-centric approach enables regulatory authorities to formulate rules grounded in scientific evidence and practical reasoning, ensuring their effectiveness and enforceability. This enhances the efficiency and clarity of the regulatory system.
- According to this study, the most common operational risks in the commercial bank supply chain financing industry are fraud and non-compliance. Legislation, industry associations, and governments should work together to develop a comprehensive system for controlling supply chain financial risks. Enhance and refine supply chain financing legislation and regulations. Use LegalTech to improve legal supervision and reduce risk. One example is the use of blockchain technology to improve the transparency and immutability of contracts, hence reducing the vulnerability to contract fraud. Industry associations should provide benchmarks and operating recommendations for supply chain finance. This would streamline all organizational processes while reducing operational risks and non-compliant behaviors. The government advocates for supply chain financing legislation and ensures that rules and regulations are continually updated and improved to meet the needs of growing businesses. Laws provide fundamental safeguards and assure their enforcement. Industry associations set norms and encourage self-regulation, while the government enforces them through legislation and regulations. Working together as a trio to generate unique solutions can effectively mitigate and resolve fraudulent activities and non-compliant operating risks in supply chain finance. This will encourage the financial market’s robust and sustainable growth.
- The operational risk value estimated in the SCF market of Chinese commercial banks in this study can serve as an indicator of market warning, as it helps meet the risk control criteria of regulatory bodies and ensures efficient capital usage. We require enhanced information disclosure and sharing mechanisms to facilitate the sharing of operational risk information, along with improved methods for gathering operational loss data, to drive further progress. The comprehensive and constantly improving internet information system, along with the increasingly effective information disclosure method, aids in collecting data for this study. This research framework utilizes strategies for promoting information transparency and gathering feedback. A new way of judging operational risks in the supply chain can help businesses, financial institutions, and government agencies share information and use knowledge from many fields to better understand the different types and traits of operational risks.
6.3. Limitations
6.4. Future Research
Author Contributions
Funding
Data Availability Statement
Conflicts of Interest
References
- Ma, H.-L.; Wang, Z.; Chan, F.T. How important are supply chain collaborative factors in supply chain finance? A view of financial service providers in China. Int. J. Prod. Econ. 2020, 219, 341–346. [Google Scholar] [CrossRef]
- Popa, V. The financial supply chain management: A new solution for supply chain resilience. Amfiteatru Econ. 2013, 15, 140–153. [Google Scholar]
- Juhász, P.; Felföldi-Szűcs, N. Financing cooperative supply chain members—The bank’s perspective. Risks 2022, 10, 139. [Google Scholar] [CrossRef]
- Lu, Y.; Sun, S.; Zhang, M.; Yang, Z. Moving towards sustainable development: Can supply chain finance promote corporate green innovation. J. Knowl. Econ. 2023, 15, 13001–13026. [Google Scholar] [CrossRef]
- Basel Committee on Banking Supervision. Basel II: International Convergence of Capital Measurement and Capital Standards: A Revised Framework. Bank for International Settlements. 2006. Available online: https://www.bis.org/publ/bcbs128.pdf (accessed on 25 March 2024).
- Babich, V.; Kouvelis, P. Introduction to the special issue on research at the interface of finance, operations, and risk management (iFORM): Recent contributions and future directions. Manuf. Serv. Oper. Manag. 2018, 20, 1–18. [Google Scholar] [CrossRef]
- Belhadi, A.; Kamble, S.S.; Mani, V.; Benkhati, I.; Touriki, F.E. An ensemble machine learning approach for forecasting credit risk of agricultural SMEs’ investments in agriculture 4.0 through supply chain finance. Ann. Oper. Res. 2021, 9, 1–29. [Google Scholar] [CrossRef]
- Li, Y.; Stasinakis, C.; Yeo, W.M. A hybrid XGBoost-MLP model for credit risk assessment on digital supply chain finance. Forecasting 2022, 4, 184–207. [Google Scholar] [CrossRef]
- He, J.; Jiang, X.; Wang, J.; Zhu, D.; Zhen, L. Var methods for the dynamic impawn rate of steel in inventory financing under autocorrelative return. Eur. J. Oper. Res. 2012, 223, 106–115. [Google Scholar] [CrossRef]
- Zhi, B.; Wang, X.; Xu, F. Managing inventory financing in a volatile market: A novel data-driven copula model. Transp. Res. Part E Logist. Transp. Rev. 2022, 165, 102854. [Google Scholar] [CrossRef]
- Song, H.; Yu, K.; Lu, Q. Financial service providers and banks’ role in helping SMEs to access finance. Int. J. Phys. Distrib. Logist. Manag. 2018, 48, 69–92. [Google Scholar] [CrossRef]
- Han, K.-M.; Park, S.-W.; Lee, S. Anti-fraud in international supply chain finance: Focusing on moneual case. J. Korea Trade 2020, 24, 59–81. [Google Scholar] [CrossRef]
- Ioannou, I.; Demirel, G. Blockchain and supply chain finance: A critical literature review at the intersection of operations, finance and law. J. Bank. Financ. Technol. 2022, 6, 83–107. [Google Scholar] [CrossRef]
- Edunjobi, T.E. Sustainable supply chain financing models: Integrating banking for enhanced sustainability. Int. J. Multidiscip. Res. Updates 2024, 7, 001–011. [Google Scholar] [CrossRef]
- Bonet, I.; Peña, A.; Lochmuller, C.; Patiño, H.A.; Chiclana, F.; Góngora, M. Applying fuzzy scenarios for the measurement of operational risk. Appl. Soft Comput. 2021, 112, 107785. [Google Scholar] [CrossRef]
- Akbari, M.; Yazdanian, A. Machine learning in estimating operational risk coverage capital of banks with a loss distribution approach. J. Financ. Manag. Perspect. 2023, 13, 9–34. [Google Scholar] [CrossRef]
- Frachot, A.; Georges, P.; Roncalli, T. Loss Distribution Approach for Operational Risk; Working Paper; Groupe de Recherche Opérationnelle, Crédit Lyonnais: Paris, France, 2004. [Google Scholar]
- Li, J.; Feng, J.; Chen, J. A piecewise-defined severity distribution-based loss distribution approach to estimate operational risk: Evidence from chinese national commercial banks. Int. J. Inf. Technol. Decis. Mak. 2009, 8, 727–747. [Google Scholar] [CrossRef]
- Wang, Z.; Wang, W.; Chen, X.; Jin, Y.; Zhou, Y. Using BS-PSD-LDA approach to measure operational risk of Chinese commercial banks. Econ. Model. 2012, 29, 2095–2103. [Google Scholar] [CrossRef]
- Zhou, X.; Durfee, A.V.; Fabozzi, F.J. On stability of operational risk estimates by LDA: From causes to approaches. J. Bank. Financ. 2016, 68, 266–278. [Google Scholar] [CrossRef]
- Rosenberg, J.V.; Schuermann, T. A general approach to integrated risk management with skewed, fat-tailed risks. J. Financ. Econ. 2006, 79, 569–614. [Google Scholar] [CrossRef]
- Xu, C.; Zheng, C.; Wang, D.; Ji, J.; Wang, N. Double correlation model for operational risk: Evidence from Chinese commercial banks. Phys. A Stat. Mech. Its Appl. 2019, 516, 327–339. [Google Scholar] [CrossRef]
- Chapelle, A.; Crama, Y.; Hübner, G.; Peters, J.-P. Practical methods for measuring and managing operational risk in the financial sector: A clinical study. J. Bank. Financ. 2008, 32, 1049–1061. [Google Scholar] [CrossRef]
- Abdymomunov, A.; Ergen, I. Tail dependence and systemic risk in operational losses of the US banking industry. Int. Rev. Financ. 2017, 17, 177–204. [Google Scholar] [CrossRef]
- Chen, Q.; Liang, L.-j. Operational risk aggregation measurement of banks based on PSD-LDA and Copula Function. Oper. Res. Manag. Sci. 2019, 28, 174–181. (In Chinese) [Google Scholar]
- Cornwell, N.; Bilson, C.; Gepp, A.; Stern, S.; Vanstone, B.J. The role of data analytics within operational risk management: A systematic review from the financial services and energy sectors. J. Oper. Res. Soc. 2023, 74, 374–402. [Google Scholar] [CrossRef]
- Ali, Z.; Gongbing, B.; Mehreen, A. Does supply chain finance improve SMEs performance? The moderating role of trade digitization. Bus. Process Manag. J. 2020, 26, 150–167. [Google Scholar] [CrossRef]
- Lou, Z.; Xie, Q.; Shen, J.H.; Lee, C.-C. Does supply chain finance (SCF) alleviate funding constraints of SMEs? Evidence from China. Res. Int. Bus. Financ. 2024, 67, 102157. [Google Scholar] [CrossRef]
- Bals, C. Toward a supply chain finance (SCF) ecosystem–Proposing a framework and agenda for future research. J. Purch. Supply Manag. 2019, 25, 105–117. [Google Scholar] [CrossRef]
- Gelsomino, L.M.; Mangiaracina, R.; Perego, A.; Tumino, A. Supply chain finance: A literature review. Int. J. Phys. Distrib. Logist. Manag. 2016, 46, 348–366. [Google Scholar] [CrossRef]
- Wetzel, P.; Hofmann, E. Supply chain finance, financial constraints and corporate performance: An explorative network analysis and future research agenda. Int. J. Prod. Econ. 2019, 216, 364–383. [Google Scholar] [CrossRef]
- Zhou, L.; Chen, M.; Lee, H. Supply Chain Finance: A Research Review and Prospects Based on a Systematic Literature Analysis from a Financial Ecology Perspective. Sustainability 2022, 14, 14452. [Google Scholar] [CrossRef]
- Jia, F.; Zhang, T.; Chen, L. Sustainable supply chain Finance: Towards a research agenda. J. Clean. Prod. 2020, 243, 118680. [Google Scholar] [CrossRef]
- Lam, H.K.; Zhan, Y.; Zhang, M.; Wang, Y.; Lyons, A. The effect of supply chain finance initiatives on the market value of service providers. Int. J. Prod. Econ. 2019, 216, 227–238. [Google Scholar] [CrossRef]
- Rajaguru, R.; Matanda, M.J.; Zhang, W. Supply chain finance in enhancing supply-oriented and demand-oriented performance capabilities–moderating role of perceived partner opportunism. J. Bus. Ind. Mark. 2022, 37, 2396–2413. [Google Scholar] [CrossRef]
- Li, S.; Chen, X. The role of supply chain finance in third-party logistics industry: A case study from China. Int. J. Logist. Res. Appl. 2019, 22, 154–171. [Google Scholar] [CrossRef]
- Lu, Q.; Gu, J.; Huang, J. Supply chain finance with partial credit guarantee provided by a third-party or a supplier. Comput. Ind. Eng. 2019, 135, 440–455. [Google Scholar] [CrossRef]
- Zhao, L.; Huchzermeier, A. Managing supplier financial distress with advance payment discount and purchase order financing. Omega 2019, 88, 77–90. [Google Scholar] [CrossRef]
- Kouvelis, P.; Xu, F. A supply chain theory of factoring and reverse factoring. Manag. Sci. 2021, 67, 6071–6088. [Google Scholar] [CrossRef]
- Lin, Q.; Su, X.; Peng, Y. Supply chain coordination in confirming warehouse financing. Comput. Ind. Eng. 2018, 118, 104–111. [Google Scholar] [CrossRef]
- Hofmann, E. Inventory financing in supply chains: A logistics service provider-approach. Int. J. Phys. Distrib. Logist. Manag. 2009, 39, 716–740. [Google Scholar] [CrossRef]
- Huo, X.; Jasimuddin, S.M.; Zheng, K.; Zhang, Z. Exploring the Risks of International Supply Chain Financial Warehouse Receipts Pledge Model: A Structural Equation Approach. Supply Chain. Forum Int. J. 2023, 24, 385–396. [Google Scholar] [CrossRef]
- Lee, H.-H.; Zhou, J.; Wang, J. Trade credit financing under competition and its impact on firm performance in supply chains. Manuf. Serv. Oper. Manag. 2018, 20, 36–52. [Google Scholar] [CrossRef]
- Chen, X.; Lu, Q.; Cai, G. Buyer financing in pull supply chains: Zero-interest early payment or in-house factoring? Prod. Oper. Manag. 2020, 29, 2307–2325. [Google Scholar] [CrossRef]
- Fu, H.; Ke, G.Y.; Lian, Z.; Zhang, L. 3PL firm’s equity financing for technology innovation in a platform supply chain. Transp. Res. Part E Logist. Transp. Rev. 2021, 147, 102239. [Google Scholar] [CrossRef]
- Pellegrino, R.; Costantino, N.; Tauro, D. Supply Chain Finance: A supply chain-oriented perspective to mitigate commodity risk and pricing volatility. J. Purch. Supply Manag. 2019, 25, 118–133. [Google Scholar] [CrossRef]
- Moretto, A.; Caniato, F. Can Supply Chain Finance help mitigate the financial disruption brought by COVID-19? J. Purch. Supply Manag. 2021, 27, 100713. [Google Scholar] [CrossRef]
- An, S.; Li, B.; Song, D.; Chen, X. Green credit financing versus trade credit financing in a supply chain with carbon emission limits. Eur. J. Oper. Res. 2021, 292, 125–142. [Google Scholar] [CrossRef]
- Qiao, R.; Zhao, L. Highlight risk management in supply chain finance: Effects of supply chain risk management capabilities on financing performance of small-medium enterprises. Supply Chain. Manag. Int. J. 2023, 28, 843–858. [Google Scholar] [CrossRef]
- Zhu, Y.; Zhou, L.; Xie, C.; Wang, G.-J.; Nguyen, T.V. Forecasting SMEs’ credit risk in supply chain finance with an enhanced hybrid ensemble machine learning approach. Int. J. Prod. Econ. 2019, 211, 22–33. [Google Scholar] [CrossRef]
- Zhang, W.; Yan, S.; Li, J.; Tian, X.; Yoshida, T. Credit risk prediction of SMEs in supply chain finance by fusing demographic and behavioral data. Transp. Res. Part E Logist. Transp. Rev. 2022, 158, 102611. [Google Scholar] [CrossRef]
- Liang, D.; Cao, W.; Wang, M. Credit rating of sustainable agricultural supply chain finance by integrating heterogeneous evaluation information and misclassification risk. Ann. Oper. Res. 2023, 331, 189–219. [Google Scholar] [CrossRef]
- Wang, J.; Zhao, L.; Huchzermeier, A. Operations-finance interface in risk management: Research evolution and opportunities. Prod. Oper. Manag. 2021, 30, 355–389. [Google Scholar] [CrossRef]
- Du, Y.Y.; Bin Zhong, J.; Su, Z.Y.; Yang, X.P.; Yao, Y.L. Risk evaluation and control of supply chain finance. Appl. Econ. Financ. 2019, 6, 21–29. [Google Scholar] [CrossRef]
- Mitra, R.; Goswami, A.; Tiwari, M.K. Financial supply chain analysis with borrower identification in smart lending platform. Expert Syst. Appl. 2022, 208, 118026. [Google Scholar] [CrossRef]
- Wei, L.; Li, J.; Zhu, X. Operational loss data collection: A literature review. Ann. Data Sci. 2018, 5, 313–337. [Google Scholar] [CrossRef]
- Chavez-Demoulin, V.; Embrechts, P.; Hofert, M. An extreme value approach for modeling operational risk losses depending on covariates. J. Risk Insur. 2016, 83, 735–776. [Google Scholar] [CrossRef]
- Yao, Y.; Li, J. Operational risk assessment of third-party payment platforms: A case study of China. Financ. Innov. 2022, 1, 8–19. [Google Scholar] [CrossRef]
- Kim, S.; Song, S. Cyber risk measurement via loss distribution approach and GARCH model. Commun. Stat. Appl. Methods 2023, 30, 75–94. [Google Scholar] [CrossRef]
- Saputra, M.P.A.; Sukono; Chaerani, D. Estimation of maximum potential losses for digital banking transaction risks using the extreme value-at-risks method. Risks 2022, 10, 10. [Google Scholar] [CrossRef]
- Lee, J.; Ahn, Y.; Lee, S. Post-handover defect risk profile of residential buildings using loss distribution approach. J. Manag. Eng. 2020, 36, 04020021. [Google Scholar] [CrossRef]
- Ruiz-Canela López, J. How can enterprise risk management help in evaluating the operational risks for a telecommunications company? J. Risk Financ. Manag. 2021, 14, 139. [Google Scholar] [CrossRef]
- Restrepo, J.A.; Giraldo, E.A.; Vanegas, J.G. Measuring the production performance indicators for metal-mechanic industry: An LDA modeling approach. Int. J. Product. Perform. Manag. 2024, 74, 1–23. [Google Scholar] [CrossRef]
- Frachot, A.; Roncalli, T.; Salomon, E. The Correlation Problem in Operational Risk. Operational Risk’s Newsletter 2004. Available online: https://ssrn.com/abstract=1032594 (accessed on 13 November 2024).
- Li, J.; Zhu, X.; Chen, J.; Gao, L.; Feng, J.; Wu, D.; Sun, X. Operational risk ag-gregation across business lines based on frequency dependence and loss dependence. Math. Probl. Eng. 2014, 1, 404208. [Google Scholar] [CrossRef]
- Li, X. Unveiling portfolio resilience: Harnessing asymmetric copulas for dynamic risk assessment in the knowledge economy. J. Knowl. Econ. 2023, 15, 10200–10226. [Google Scholar] [CrossRef]
- Zhou, H.; Sun, G.; Fu, S.; Fan, X.; Jiang, W.; Hu, S.; Li, L. A distributed approach of big data mining for financial fraud detection in a supply chain. Comput. Mater Contin. 2020, 64, 1091–1105. [Google Scholar] [CrossRef]
- Grima, S.; Kizilkaya, M.; Sood, K.; ErdemDelice, M. The perceived effectiveness of blockchain for digital operational risk resilience in the european union insurance market sector. J. Risk Financ. Manag. 2021, 14, 363. [Google Scholar] [CrossRef]
- Yang, W.; Ziyang, W.; Xiaohao, Z.; Jianming, Y. The optimisation research of Blockchain application in the financial institution-dominated supply chain finance system. Int. J. Prod. Res. 2023, 61, 3735–3755. [Google Scholar] [CrossRef]
- Akhavan, P.; Philsoonhian, M. Improving of supply chain collaboration and performance by using block chain technology as a mediating role and resilience as a moderating variable. J. Knowl. Econ. 2023, 14, 4561–4582. [Google Scholar] [CrossRef]
- Kucukaltan, B.; Kamasak, R.; Yalcinkaya, B.; Irani, Z. Investigating the themes in supply chain finance: The emergence of blockchain as a disruptive technology. Int. J. Prod. Res. 2024, 62, 8173–8192. [Google Scholar] [CrossRef]
- Chen, C.-C.; Ho, K.-C.; Li, H.-M.; Yu, M.-T. Impact of information disclosure ratings on investment efficiency: Evidence from China. Rev. Quant. Financ. Account. 2023, 60, 471–500. [Google Scholar] [CrossRef]
- Yang, D.; Li, M. Evolutionary approaches and the construction of technology-driven regulations. Emerg. Mark. Financ. Trade 2018, 54, 3256–3271. [Google Scholar] [CrossRef]
- Araz, O.M.; Choi, T.-M.; Olson, D.L.; Salman, F.S. Role of analytics for operational risk management in the era of big data. Decis. Sci. 2020, 51, 1320–1346. [Google Scholar] [CrossRef]
- Zhu, X.; Wang, Y.; Li, J. Operational risk measurement: A loss distribution approach with segmented dependence. J. Oper. Risk 2019, 14, 25–44. [Google Scholar] [CrossRef]
- Rijanto, A. Blockchain technology roles to overcome accounting, accountability and assurance barriers in supply chain finance. Asian Rev. Account. 2024, 2, 728–758. [Google Scholar] [CrossRef]
- Jadwani, B.; Parkhi, S.; Mitra, P.K. Operational risk management in banks: A bibliometric analysis and opportunities for future research. J. Risk Financ. Manag. 2024, 17, 95. [Google Scholar] [CrossRef]
- Kojadinovic, I.; Yan, J. Modeling multivariate distributions with continuous margins using the copula R package. J. Stat. Softw. 2010, 34, 1–20. [Google Scholar] [CrossRef]
- Fantazzini, D.; Valle, L.D.; Giudici, P. Copulae and operational risks. Int. J. Risk Assess. Manag. 2008, 9, 238–257. [Google Scholar] [CrossRef]


| Statistics | Mini | Max | Median | Mean | Std | Skewness | Kurtosis |
|---|---|---|---|---|---|---|---|
| 427 | 0.1 | 2172.5 | 9 | 42.76 | 166.58 | 8.32 | 80.99 |
| Risk Cell | Mini | Max | Median | Mean | Std | Skewness | Kurtosis |
|---|---|---|---|---|---|---|---|
| Fraud | 241 | 0.26 | 2173 | 9.98 | 60.23 | 209.4 | 6.88 |
| Compliance | 168 | 0.17 | 2000 | 8 | 30.42 | 127.28 | 10.02 |
| Loss Part | Risk Cell | Distribution | Parameter Value | KS Test | p Value | |
|---|---|---|---|---|---|---|
| HFLS losses | Fraud | Gamma | = 1.044 | = 8.843 | 0.055 | 0.527 |
| Weibull | = 1.039 | = 8.367 | 0.056 | 0.514 | ||
| Lognormal | = 1.661 | = 1.171 | 0.103 | 0.479 | ||
| Compliance | Gamma | = 0.750 | = 18.375 | 0.072 | 0.363 | |
| Weibull | = 0.825 | = 12.426 | 0.069 | 0.426 | ||
| Lognormal | = 1.661 | = 1.397 | 0.093 | 0.357 | ||
| LFHS losses | Fraud | GPD | = 42.5 | = 0.752 | 0.130 | 0.637 |
| Compliance | GPD | = 222 | = 0.431 | 0.150 | 0.784 | |
| Loss Part | Risk Cell | Distribution | Parameter Value | KS Test | ||
|---|---|---|---|---|---|---|
| D-Value | p-Value | |||||
| HFLS losses | Fraud | N. binomial | = 5 | = 0.625 | 0.151 | 0.963 |
| Poisson | = 18.909 | 0.363 | 0.110 | |||
| Compliance | N. binomial | = 2 | = 0.537 | 0.177 | 0.881 | |
| Poisson | = 13.545 | 0.328 | 0.189 | |||
| LFHS losses | Fraud | Poisson | = 3 | 0.229 | 0.828 | |
| Compliance | Poisson | = 1.727 | 0.266 | 0.416 | ||
| Loss Type | Fraud/Lhiability Risk Cell | |
|---|---|---|
| Linear | Global | |
| HFLS | 0.7491 | 0.7606 |
| LFHS | 0.5013 | 0.5639 |
| Holistic | 0.6550 | 0.6944 |
| Copula | LossType | HFLS_F | HFLS_L | LFHS_F | LFHS_L | p Value |
|---|---|---|---|---|---|---|
| t-copula (v = 2, = 0.673) | HFLS_F | 1 | 0.807 ** | 0.506 | 0.123 | 0.769 |
| HFLS_L | 0.807 ** | 1 | 0.771 * | 0.503 | ||
| LFHS_F | 0.506 | 0.771 * | 1 | 0.682 * | ||
| LFHS_L | 0.123 | 0.503 | 0.682 * | 1 | ||
| Gaussian-copula ( = 0.373) | HFLS_F | 1 | 0.720 | 0.429 | −0.056 | 0.341 |
| HFLS_L | 0.720 | 1 | 0.797 | 0.406 | ||
| LFHS_F | 0.429 | 0.797 | 1 | 0.523 | ||
| LFHS_L | −0.056 | 0.406 | 0.523 | 1 |
| Value at Risk (VaR) | Fraud | Compliance | Expected Shortfall (ES) | Fraud | Compliance |
|---|---|---|---|---|---|
| VaR90% | 127.065 | 73.309 | ES90% | 276.575 | 189.215 |
| VaR95% | 211.628 | 137.763 | ES95% | 389.875 | 277.584 |
| VaR99% | 476.052 | 343.448 | ES99% | 744.158 | 559.588 |
| VaR99.9% | 1101.866 | 847.201 | ES99.9% | 1582.643 | 1250.26 |
| VaR99.99% | 2224.098 | 1786.601 | ES99.99% | 3086.244 | 2538.225 |
| Value at Risk (VaR) | With Dependence | Without Dependence | Expected Shortfall (ES) | With Dependence | Without Dependence |
|---|---|---|---|---|---|
| VaR90% | 178.334 | 200.375 | ES90% | 409.894 | 465.789 |
| VaR95% | 303.970 | 349.391 | ES95% | 574.015 | 667.459 |
| VaR99% | 737.549 | 819.499 | ES99% | 1047.296 | 1303.746 |
| VaR99.9% | 1793.142 | 1949.067 | ES99.9% | 2049.613 | 2832.903 |
| VaR99.99% | 3449.736 | 4010.699 | ES99.99% | 4218.777 | 5624.469 |
| Risk Value | VaR99% | ES99% | VaR99.9% | ES99.9% |
|---|---|---|---|---|
| Failure number | 5 | 2 | 1 | 1 |
| LR | 1.100 | 1.944 | 1.355 | 1.355 |
Disclaimer/Publisher’s Note: The statements, opinions and data contained in all publications are solely those of the individual author(s) and contributor(s) and not of MDPI and/or the editor(s). MDPI and/or the editor(s) disclaim responsibility for any injury to people or property resulting from any ideas, methods, instructions or products referred to in the content. |
© 2025 by the authors. Licensee MDPI, Basel, Switzerland. This article is an open access article distributed under the terms and conditions of the Creative Commons Attribution (CC BY) license (https://creativecommons.org/licenses/by/4.0/).
Share and Cite
Xie, W.; He, J.; Huang, F.; Ren, J. Operational Risk Assessment of Commercial Banks’ Supply Chain Finance. Systems 2025, 13, 76. https://doi.org/10.3390/systems13020076
Xie W, He J, Huang F, Ren J. Operational Risk Assessment of Commercial Banks’ Supply Chain Finance. Systems. 2025; 13(2):76. https://doi.org/10.3390/systems13020076
Chicago/Turabian StyleXie, Wenying, Juan He, Fuyou Huang, and Jun Ren. 2025. "Operational Risk Assessment of Commercial Banks’ Supply Chain Finance" Systems 13, no. 2: 76. https://doi.org/10.3390/systems13020076
APA StyleXie, W., He, J., Huang, F., & Ren, J. (2025). Operational Risk Assessment of Commercial Banks’ Supply Chain Finance. Systems, 13(2), 76. https://doi.org/10.3390/systems13020076