
Effects of AI Virtual Anchors on Brand Image and Loyalty: Insights from Perceived Value Theory and SEM-ANN Analysis


Abstract
:1. Introduction
2. Theoretical Framework
2.1. AI Characterization
2.2. Perceived Value Theory
2.3. Brand Image and Brand Loyalty
3. Methods
3.1. Participants and Procedures
3.2. Measures
4. Results
4.1. Common Method Bias (CMB)
4.2. Multivariate Statistical Assumptions
4.3. Measurement Model
4.4. Structural Model
4.5. Significance Test for Mediating Effects
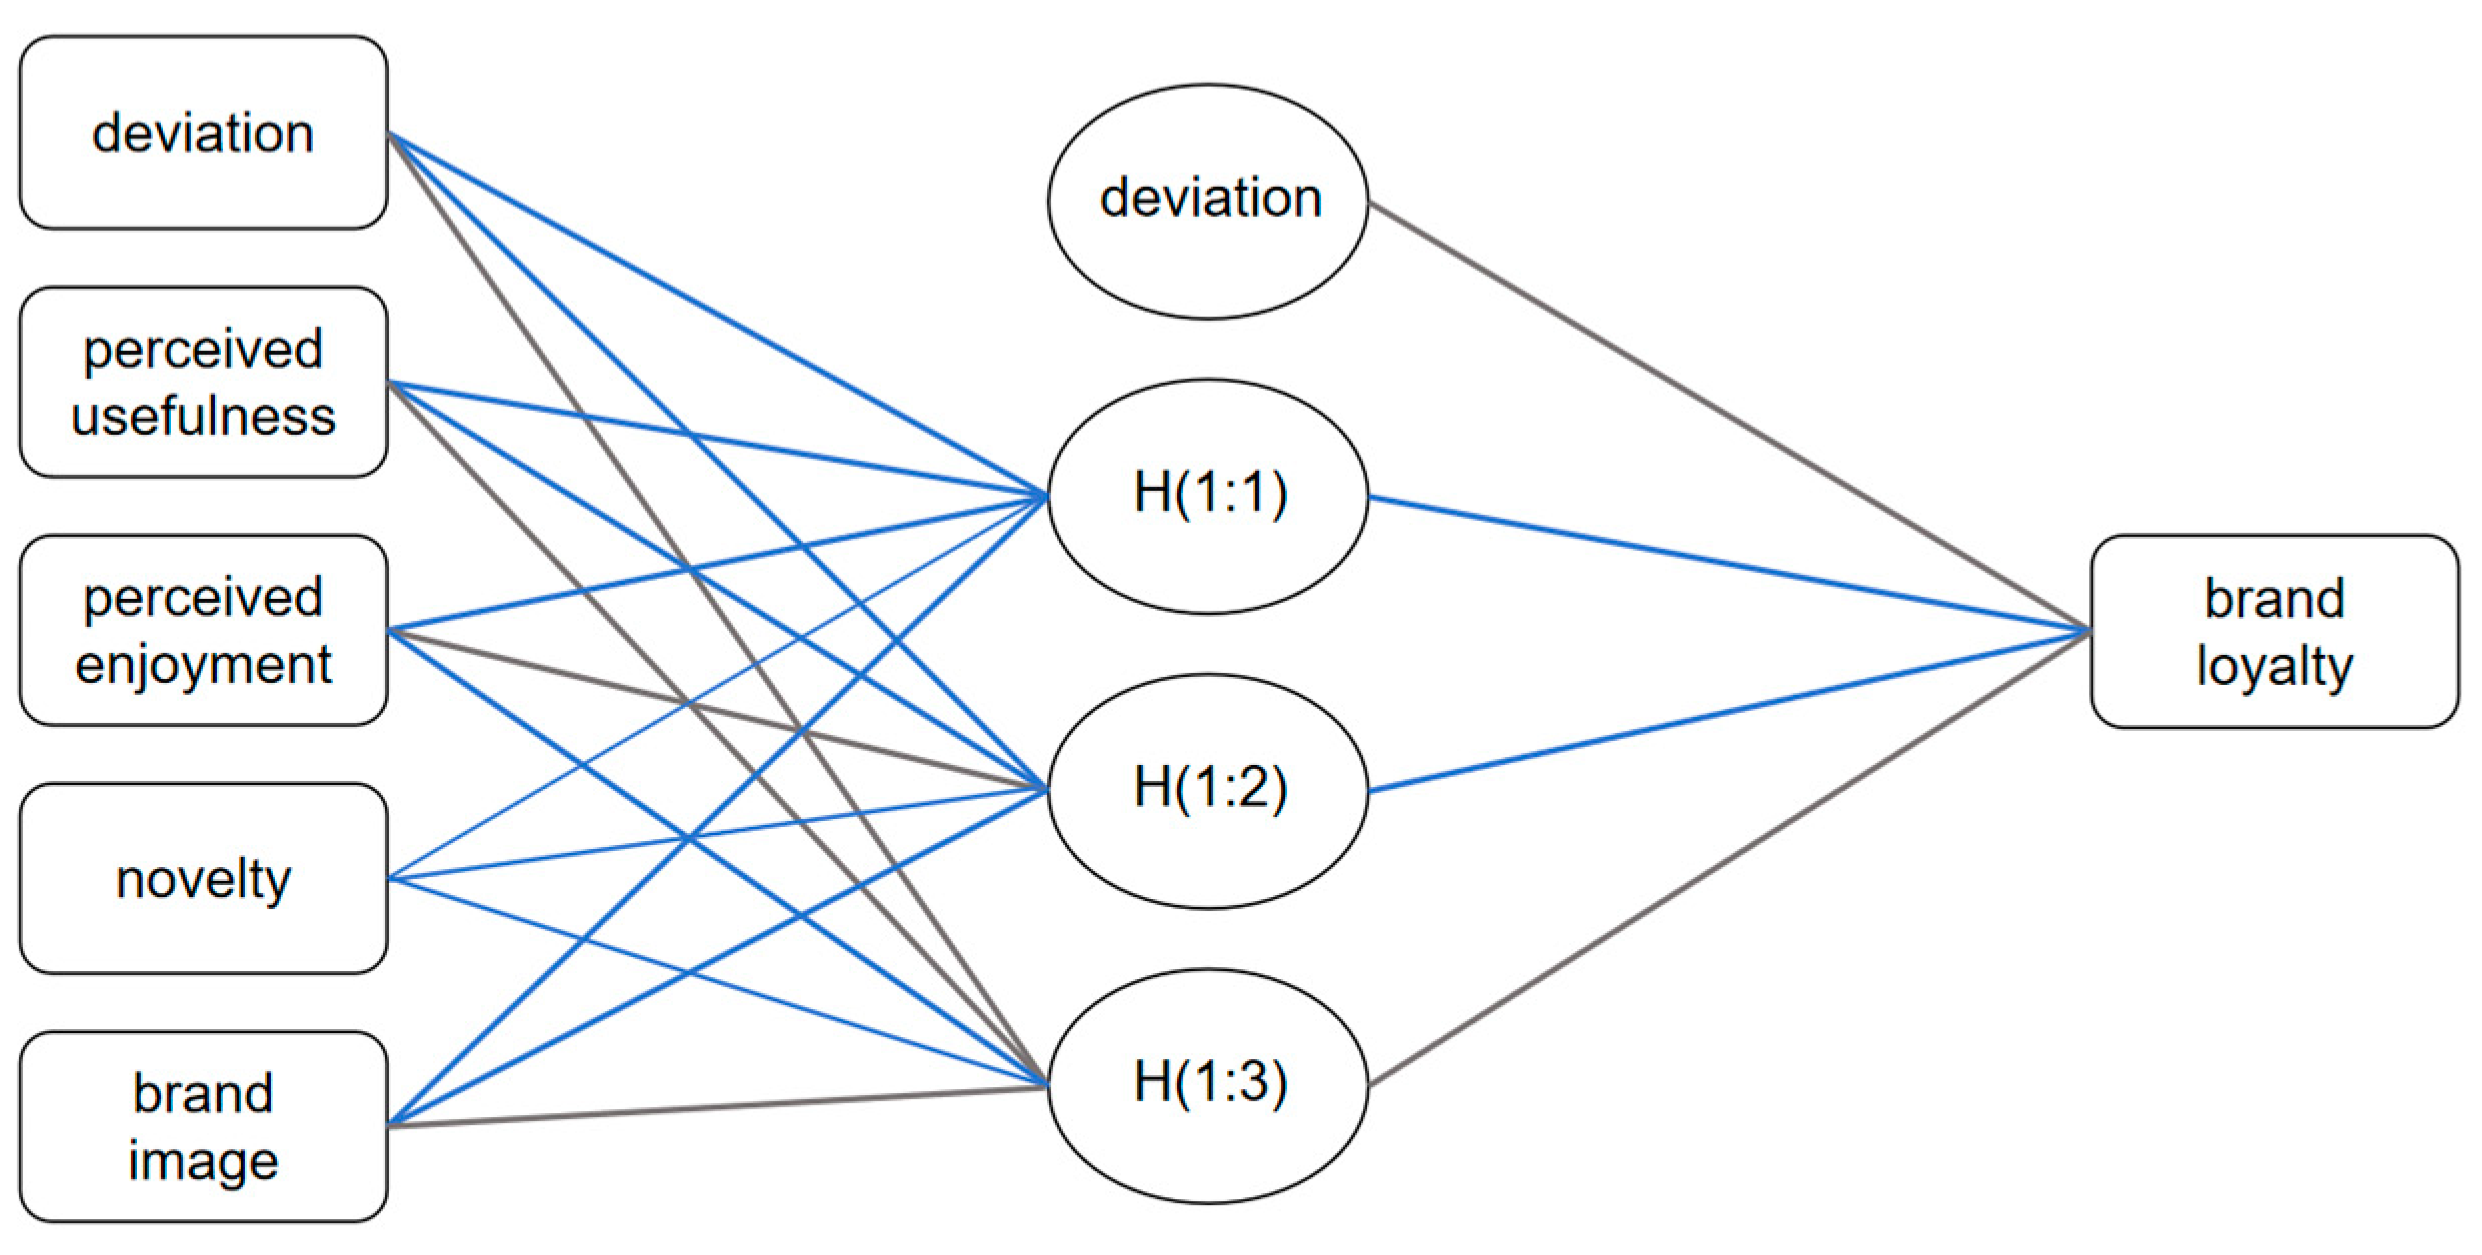
4.6. Neural Network Analysis
5. Discussion and Conclusions
5.1. Theoretical Contributions
5.2. Practical Contributions
5.3. Limitation and Future Direction
Author Contributions
Funding
Institutional Review Board Statement
Informed Consent Statement
Data Availability Statement
Conflicts of Interest
References
- Sun, Y.; Shao, X.; Li, X.; Guo, Y.; Nie, K. A 2020 perspective on “How live streaming influences purchase intentions in social commerce: An IT affordance perspective”. Electron. Commer. Res. Appl. 2020, 40, 100958. [Google Scholar] [CrossRef]
- Chen, C.-D.; Zhao, Q.; Wang, J.-L. How livestreaming increases product sales: Role of trust transfer and elaboration likelihood model. Behav. Inf. Technol. 2022, 41, 558–573. [Google Scholar] [CrossRef]
- Guo, L.; Hu, X.; Lu, J.; Ma, L. Effects of customer trust on engagement in live streaming commerce: Mediating role of swift guanxi. Internet Res. 2021, 31, 1718–1744. [Google Scholar] [CrossRef]
- Huang, M.-H.; Rust, R.T. Artificial intelligence in service. J. Serv. Res. 2018, 21, 155–172. [Google Scholar] [CrossRef]
- Liu, Q.; Ma, N.; Zhang, X. Can AI-virtual anchors replace human internet celebrities for live streaming sales of products? An emotion theory perspective. J. Retail. Consum. Serv. 2025, 82, 104107. [Google Scholar] [CrossRef]
- Gao, W.; Jiang, N.; Guo, Q. How do virtual streamers affect purchase intention in the live streaming context? A presence perspective. J. Retail. Consum. Serv. 2023, 73, 103356. [Google Scholar] [CrossRef]
- Zhang, X.; Shi, Y.; Li, T.; Guan, Y.; Cui, X. How do virtual ai streamers influence viewers’ livestream shopping behavior? The effects of persuasive factors and the mediating role of arousal. Inf. Syst. Front. 2023, 26, 1803–1834. [Google Scholar] [CrossRef]
- Yuan, C.; Wang, S.; Liu, Y. AI service impacts on brand image and customer equity: Empirical evidence from China. J. Brand Manag. 2023, 30, 61–76. [Google Scholar] [CrossRef]
- Cheng, Y.; Jiang, H. Customer–brand relationship in the era of artificial intelligence: Understanding the role of chatbot marketing efforts. J. Prod. Brand Manag. 2022, 31, 252–264. [Google Scholar] [CrossRef]
- Zhang, Y.; Wang, S. The influence of anthropomorphic appearance of artificial intelligence products on consumer behavior and brand evaluation under different product types. J. Retail. Consum. Serv. 2023, 74, 103432. [Google Scholar] [CrossRef]
- Brüns, J.D.; Meißner, M. Do you create your content yourself? Using generative artificial intelligence for social media content creation diminishes perceived brand authenticity. J. Retail. Consum. Serv. 2024, 79, 103790. [Google Scholar] [CrossRef]
- Gutiérrez-Caneda, B.; Vázquez-Herrero, J.; López-García, X. AI application in journalism: ChatGPT and the uses and risks of an emergent technology. Anu. Thinkepi 2023, 32, 1–13. [Google Scholar] [CrossRef]
- Huh, J.; Kim, H.-Y.; Lee, G. “Oh, happy day!” Examining the role of AI-powered voice assistants as a positive technology in the formation of brand loyalty. J. Res. Interact. Mark. 2023, 17, 794–812. [Google Scholar] [CrossRef]
- Liu, Y.; Wang, X.; Qin, H. When cool hospitality brand meets AI: Exploring the matching effect of service agents and brand images on brand attitude. Int. J. Contemp. Hosp. Manag. 2024, 36, 2367–2384. [Google Scholar] [CrossRef]
- West, A.; Clifford, J.; Atkinson, D. ”Alexa, Build Me a Brand”—An Investigation into the impact of Artificial Intelligence on Branding. Bus. Manag. Rev. 2018, 9, 321–330. [Google Scholar] [CrossRef]
- Marinchak, C.M.; Forrest, E.; Hoanca, B. Artificial intelligence: Redefining marketing management and the customer experience. Int. J. E-Entrep. Innov. 2018, 8, 14–24. [Google Scholar] [CrossRef]
- Wang, Z.; Li, M.; Lu, J.; Cheng, X. Business Innovation based on artificial intelligence and Blockchain technology. Inf. Process. Manag. 2022, 59, 102759. [Google Scholar] [CrossRef]
- Amershi, B. Culture, the process of knowledge, perception of the world and emergence of AI. AI Soc. 2020, 35, 417–430. [Google Scholar] [CrossRef]
- Davenport, T.H.; Ronanki, R. Artificial intelligence for the real world. Harv. Bus. Rev. 2018, 96, 108–116. [Google Scholar]
- Varsha, P.S.; Akter, S.; Kumar, A.; Gochhait, S.; Deemed; Patagundi, B. The impact of artificial intelligence on branding: A bibliometric analysis (1982–2019). J. Glob. Inf. Manag. 2021, 29, 221–246. [Google Scholar] [CrossRef]
- Zeithaml, V.A. Consumer perceptions of price, quality, and value: A means-end model and synthesis of evidence. J. Mark. 1988, 52, 2–22. [Google Scholar] [CrossRef]
- Baek, W.Y.; Kim, K.; Kim, D.H.; Byon, K.K. The impacts of the perceived golf course brand globalness on customer loyalty through multidimensional perceived values. Sustainability. 2020, 12, 978. [Google Scholar] [CrossRef]
- Huang, A.; Ozturk, A.B.; Zhang, T.; de la Mora Velasco, E.; Haney, A. Unpacking AI for hospitality and tourism services: Exploring the role of perceived enjoyment on future use intentions. Int. J. Hosp. Manag. 2024, 119, 103693. [Google Scholar] [CrossRef]
- Cheng, C.-F.; Huang, C.-C.; Lin, M.-C.; Chen, T.-C. Exploring Effectiveness of Relationship Marketing on Artificial Intelligence Adopting Intention. SAGE Open 2023, 13, 21582440231222760. [Google Scholar] [CrossRef]
- Prentice, C.; Nguyen, M. Engaging and retaining customers with AI and employee service. J. Retail. Consum. Serv. 2020, 56, 102186. [Google Scholar] [CrossRef]
- Liu, Y.; Shrum, L.J. What is Interactivity and is it Always Such a Good Thing? Implications of Definition, Person, and Situation for the Influence of Interactivity on Advertising Effectiveness. J. Advert. 2002, 31, 53–64. [Google Scholar] [CrossRef]
- Pan, R.; Feng, J.; Zhao, Z. Fly with the wings of live-stream selling—Channel strategies with/without switching demand. Prod. Oper. Manag. 2022, 31, 3387–3399. [Google Scholar] [CrossRef]
- Wongkitrungrueng, A.; Assarut, N. The role of live streaming in building consumer trust and engagement with social commerce sellers. J. Bus. Res. 2020, 117, 543–556. [Google Scholar] [CrossRef]
- El-Adly, M.I. Modelling the relationship between hotel perceived value, customer satisfaction, and customer loyalty. J. Retail. Consum. Serv. 2019, 50, 322–332. [Google Scholar] [CrossRef]
- Molinillo, S.; Aguilar-Illescas, R.; Anaya-Sánchez, R.; Liébana-Cabanillas, F. Social commerce website design, perceived value and loyalty behavior intentions: The moderating roles of gender, age and frequency of use. J. Retail. Consum. Serv. 2021, 63, 102404. [Google Scholar] [CrossRef]
- Lee, J.; Kim, J.; Choi, J.Y. The adoption of virtual reality devices: The technology acceptance model integrating enjoyment, social interaction, and strength of the social ties. Telemat. Inform. 2019, 39, 37–48. [Google Scholar] [CrossRef]
- Bonnin, G. The roles of perceived risk, attractiveness of the online store and familiarity with AR in the influence of AR on patronage intention. J. Retail. Consum. Serv. 2020, 52, 101938. [Google Scholar] [CrossRef]
- Sundar, S.S. Rise of machine agency: A framework for studying the psychology of human–ai interaction (HAII). J. Comput. Commun. 2020, 25, 74–88. [Google Scholar] [CrossRef]
- Pavlou, P.A.; Gefen, D. Building effective online marketplaces with institution-based trust. Inf. Syst. Res. 2004, 15, 37–59. [Google Scholar] [CrossRef]
- Longoni, C.; Cian, L. Artificial intelligence in utilitarian vs. hedonic contexts: The “word-of-machine” effect. J. Mark. 2022, 86, 91–108. [Google Scholar] [CrossRef]
- Yuan, C.; Zhang, C.; Wang, S. Social anxiety as a moderator in consumer willingness to accept AI assistants based on utilitarian and hedonic values. J. Retail. Consum. Serv. 2022, 65, 102878. [Google Scholar] [CrossRef]
- Martínez-Sala, A.-M.; Monserrat-Gauchi, J.; Quiles-Soler, C. Corporate social responsibility and millennial consumer loyalty: Exploring their relationship regarding healthy eating in the fast food sector. Anu. Thinkepi 2023, 32, 1–12. [Google Scholar] [CrossRef]
- Leone, R.P.; Rao, V.R.; Keller, K.L.; Luo, A.M.; McAlister, L.; Srivastava, R. Linking brand equity to customer equity. J. Serv. Res. 2006, 9, 125–138. [Google Scholar] [CrossRef]
- Aaker, D.A. Measuring brand equity across products and markets. Calif. Manag. Rev. 1996, 38, 102–120. [Google Scholar] [CrossRef]
- Chaudhuri, A. Does brand loyalty mediate brand equity outcomes? J. Mark. Theory Pr. 1999, 7, 136–146. [Google Scholar] [CrossRef]
- Keller, K.L. Conceptualizing, measuring, and managing customer-based brand equity. J. Mark. 1993, 57, 1–22. [Google Scholar] [CrossRef]
- Roy, D.; Banerjee, S. CARE-ing strategy for integration of brand identity with brand image. Int. J. Commer. Manag. 2007, 17, 140–148. [Google Scholar] [CrossRef]
- Hsieh, M.-H.; Pan, S.-L.; Setiono, R. Product-, corporate-, and country-image dimensions and purchase behavior: A multicountry analysis. J. Acad. Mark. Sci. 2004, 32, 251–270. [Google Scholar] [CrossRef]
- Dick, A.S.; Basu, K. Customer loyalty: Toward an integrated conceptual framework. J. Acad. Mark. Sci. 1994, 22, 99–113. [Google Scholar] [CrossRef]
- Oliver, R.L. Whence Consumer Loyalty? J. Mark. 1999, 63, 33–44. [Google Scholar] [CrossRef]
- Hasan, R.; Shams, R.; Rahman, M. Consumer trust and perceived risk for voice-controlled artificial intelligence: The case of Siri. J. Bus. Res. 2021, 131, 591–597. [Google Scholar] [CrossRef]
- Coelho, A.; Bairrada, C.; Peres, F. Brand communities’ relational outcomes, through brand love. J. Prod. Brand Manag. 2019, 28, 154–165. [Google Scholar] [CrossRef]
- Khamitov, M.; Wang, X.; Thomson, M. How well do consumer-brand relationships drive customer brand loyalty? Generalizations from a meta-analysis of brand relationship elasticities. J. Consum. Res. 2019, 46, 435–459. [Google Scholar] [CrossRef]
- Brunner, T.A.; Stöcklin, M.; Opwis, K. Satisfaction, image and loyalty: New versus experienced customers. Eur. J. Mark. 2008, 42, 1095–1105. [Google Scholar] [CrossRef]
- Jung, J.; Kim, S.J.; Kim, K.H. Sustainable marketing activities of traditional fashion market and brand loyalty. J. Bus. Res. 2020, 120, 294–301. [Google Scholar] [CrossRef]
- Namkung, Y.; Jang, S. Effects of restaurant green practices on brand equity formation: Do green practices really matter? Int. J. Hosp. Manag. 2013, 33, 85–95. [Google Scholar] [CrossRef]
- Hair, J.F. Multivariate Data Analysis; Pearson: London, UK, 2009. [Google Scholar]
- Diefenbach, M.A.; Weinstein, N.D.; O’reilly, J. Scales for assessing perceptions of health hazard susceptibility. Health Educ. Res. 1993, 8, 181–192. [Google Scholar] [CrossRef] [PubMed]
- Siddike, A.K.; Spohrer, J.; Demirkan, H.; Kohda, Y. People’s interactions with cognitive assistants for enhanced performances. In Proceedings of the Hawaii International Conference on System Sciences, Waikoloa, HI, USA, 3–6 January 2018. [Google Scholar]
- Davis, F.D. Perceived usefulness, perceived ease of use, and user acceptance of information technology. MIS Q. 1989, 13, 319–340. [Google Scholar] [CrossRef]
- Sweeney, J.C.; Soutar, G.N. Consumer perceived value: The development of a multiple item scale. J. Retail. 2001, 77, 203–220. [Google Scholar] [CrossRef]
- Venkatesh, V. Determinants of perceived ease of use: Integrating control, intrinsic motivation, and emotion into the technology acceptance model. Inf. Syst. Res. 2000, 11, 342–365. [Google Scholar] [CrossRef]
- Prebensen, N.K.; Xie, J. Efficacy of co-creation and mastering on perceived value and satisfaction in tourists’ consumption. Tour. Manag. 2017, 60, 166–176. [Google Scholar] [CrossRef]
- Zhou, T. The impact of privacy concern on user adoption of location-based services. Ind. Manag. Data Syst. 2011, 111, 212–226. [Google Scholar] [CrossRef]
- Jacoby, J.; Chestnut, R.W.; Fisher, W.A. A behavioral process approach to information acquisition in nondurable purchasing. J. Mark. Res. 1978, 15, 532–544. [Google Scholar] [CrossRef]
- Khan, A.U.; Jan, S.U.; Khan, M.N.; Aziz, F.; Sohu, J.M.; Ali, J.; Khan, M.; Chohan, S.R. Based on the S–O–R theory adoption intention of blockchain technology in libraries: A two-stage analysis SEM–PLS and ANN. Libr. Hi Tech, 2024; ahead-of-publication. [Google Scholar] [CrossRef]
- Wong, C.-H.; Tan, G.W.-H.; Tan, B.-I.; Ooi, K.-B. Mobile advertising: The changing landscape of the advertising industry. Telemat. Inform. 2015, 32, 720–734. [Google Scholar] [CrossRef]
- Schultz, É.; Touzani, R.; Mancini, J.; Ward, J.K. From contact tracing to COVID-19 pass holder; the tortured journey of the French TousAntiCovid contact tracing app. Public Health 2022, 206, 5–7. [Google Scholar] [CrossRef]
- Haeussling Loewgren, B.; Weigert, J.; Esche, E.; Repke, J.U. Uncertainty analysis for data-driven chance-constrained optimization. Sustainability 2020, 12, 2450. [Google Scholar] [CrossRef]
- Hew, T.-S.; Kadir, S.L.S.A. Predicting instructional effectiveness of cloud-based virtual learning environment. Ind. Manag. Data Syst. 2016, 116, 1557–1584. [Google Scholar] [CrossRef]
- Kenett, R.S.; Zacks, S.; Gedeck, P. Modern Statistics: A Computer-Based Approach with Python; Springer Nature: Berlin/Heidelberg, Germany, 2022. [Google Scholar]
- Ringle, C.M.; Wende, S.; Becker, J.M. SmartPLS 4. Oststeinbek: SmartPLS. 2022. Available online: https://www.smartpls.com (accessed on 25 January 2024).
- Hair, J.; Hollingsworth, C.L.; Randolph, A.B.; Chong, A.Y.L. An updated and expanded assessment of PLS-SEM in information systems research. Ind. Manag. Data Syst. 2017, 117, 442–458. [Google Scholar] [CrossRef]
- Gefen, D.; Straub, D.; Boudreau, M.-C. Structural equation modeling and regression: Guidelines for research practice. Commun. Assoc. Inf. Syst. 2000, 4, 1–70. [Google Scholar] [CrossRef]
- Leong, L.Y.; Jaafar, N.I.; Ainin, S. Understanding Facebook commerce (f-commerce) actual purchase from an artificial neural network perspective. J. Electron. Commer. Res. 2018, 19, 75–103. [Google Scholar]
- Nordman, E.R.; Tolstoy, D. The impact of opportunity connectedness on innovation in SMEs’ foreign-market relationships. Technovation 2016, 57, 47–57. [Google Scholar] [CrossRef]
- Henseler, J.; Ringle, C.M.; Sarstedt, M. A new criterion for assessing discriminant validity in variance-based structural equation modeling. J. Acad. Mark. Sci. 2015, 43, 115–135. [Google Scholar] [CrossRef]
- Segarra-Moliner, J.R.; Moliner-Tena, M. Customer equity and CLV in Spanish telecommunication services. J. Bus. Res. 2016, 69, 4694–4705. [Google Scholar] [CrossRef]
- Wetzels, M.; Odekerken-Schröeder, G.; Van Oppen, C. Using PLS path modeling for assessing hierarchical construct models: Guidelines and empirical illustration. MIS Q. 2009, 33, 177–195. [Google Scholar] [CrossRef]
- Yang, H.; Yu, J.; Zo, H.; Choi, M. User acceptance of wearable devices: An extended perspective of perceived value. Telemat. Inform. 2016, 33, 256–269. [Google Scholar] [CrossRef]
- Wong, A.; Haque, M. Understanding the brand and website effects of online loyalty: A mediation perspective. J. Mark. Manag. 2022, 38, 333–368. [Google Scholar] [CrossRef]
- Watson, A.; Perrigot, R.; Dada, O. The effects of green brand image on brand loyalty: The case of mainstream fast food brands. Bus. Strat. Environ. 2023, 33, 806–819. [Google Scholar] [CrossRef]
- Mehta, A.M.; Tariq, M. How brand image and perceived service quality affect customer loyalty through customer satisfaction. Acad. Mark. Stud. J. 2020, 24, 1–10. [Google Scholar]
- Manhas, P.S.; Tukamushaba, E.K. Understanding service experience and its impact on brand image in hospitality sector. Int. J. Hosp. Manag. 2015, 45, 77–87. [Google Scholar] [CrossRef]
- Li, Y.; Shang, H. Service quality, perceived value, and citizens’ continuous-use intention regarding e-government: Empirical evidence from China. Inf. Manag. 2020, 57, e103197. [Google Scholar] [CrossRef]
- Tan, G.W.-H.; Ooi, K.-B.; Leong, L.-Y.; Lin, B. Predicting the drivers of behavioral intention to use mobile learning: A hybrid SEM-Neural Networks approach. Comput. Hum. Behav. 2014, 36, 198–213. [Google Scholar] [CrossRef]
- Sim, J.-J.; Tan, G.W.-H.; Wong, J.C.; Ooi, K.-B.; Hew, T.-S. Understanding and predicting the motivators of mobile music acceptance—A multi-stage MRA-artificial neural network approach. Telemat. Inform. 2014, 31, 569–584. [Google Scholar] [CrossRef]
- Leong, L.-Y.; Hew, T.-S.; Lee, V.-H.; Ooi, K.-B. An SEM–artificial-neural-network analysis of the relationships between SERVPERF, customer satisfaction and loyalty among low-cost and full-service airline. Expert Syst. Appl. 2015, 42, 6620–6634. [Google Scholar] [CrossRef]
- Liébana-Cabanillas, F.; Marinkovic, V.; De Luna, I.R.; Kalinic, Z. Predicting the determinants of mobile payment acceptance: A hybrid SEM-neural network approach. Technol. Forecast. Soc. Chang. 2018, 129, 117–130. [Google Scholar] [CrossRef]
- Chong, A.Y.-L. Predicting m-commerce adoption determinants: A neural network approach. Expert Syst. Appl. 2013, 40, 523–530. [Google Scholar] [CrossRef]
- Chong, A.Y.-L.; Liu, M.J.; Luo, J.; Keng-Boon, O. Predicting RFID adoption in healthcare supply chain from the perspectives of users. Int. J. Prod. Econ. 2015, 159, 66–75. [Google Scholar] [CrossRef]
- Sharma, S.K.; Sharma, M. Examining the role of trust and quality dimensions in the actual usage of mobile banking services: An empirical investigation. Int. J. Inf. Manag. 2019, 44, 65–75. [Google Scholar] [CrossRef]
- Leong, L.Y.; Hew, T.S.; Ooi, K.B.; Chong, A.Y.L. Predicting the antecedents of trust in social commerce–A hybrid structural equation modeling with neural network approach. J. Bus. Res. 2020, 110, 24–40. [Google Scholar] [CrossRef]
- Ooi, K.-B.; Tan, G.W.-H. Mobile technology acceptance model: An investigation using mobile users to explore smartphone credit card. Expert Syst. Appl. 2016, 59, 33–46. [Google Scholar] [CrossRef]
- Nie, Q.; Zeng, Q. Impact of brand image on the brand experience of consumers in China: Brand loyalty as a mediator. Soc. Behav. Pers. Int. J. 2024, 52, 1–8. [Google Scholar] [CrossRef]
- Chung, M.; Ko, E.; Joung, H.; Kim, S.J. Chatbot e-service and customer satisfaction regarding luxury brands. J. Bus. Res. 2020, 117, 587–595. [Google Scholar] [CrossRef]
- Wang, C.; Teo, T.S.; Janssen, M. Public and private value creation using artificial intelligence: An empirical study of AI voice robot users in Chinese public sector. Int. J. Inf. Manag. 2021, 61, e102401. [Google Scholar] [CrossRef]


| Division | Frequency | Percent (%) | |
|---|---|---|---|
| Gender | Male | 139 | 41.4 |
| Female | 197 | 58.6 | |
| Total | 336 | 100 | |
| Age | Under 18 | 4 | 1.2 |
| 18–25 | 170 | 50.6 | |
| 26–30 | 67 | 19.9 | |
| 31–40 | 56 | 16.7 | |
| 41–50 | 26 | 7.7 | |
| 51–60 | 9 | 2.7 | |
| Older than 60 | 4 | 1.2 | |
| Average monthly income | Under 2000 | 125 | 37.2 |
| 2001–5000 | 95 | 28.3 | |
| 5001–8000 | 63 | 18.8 | |
| 8001–10,000 | 46 | 13.7 | |
| More than 10,000 | 7 | 2.1 | |
| Education level | High school/technical secondary school and below | 26 | 7.7 |
| Junior college | 59 | 17.6 | |
| undergraduate | 181 | 53.9 | |
| Master | 67 | 19.9 | |
| Doctor | 3 | 0.9 | |
| Your daily platform for watching AI virtual anchors sell goods live streaming | Taobao | 131 | 39.0 |
| TikTok | 230 | 68.5 | |
| Kuai Shou | 90 | 26.8 | |
| Xiongs | 71 | 21.1 | |
| Pendulous | 58 | 17.3 | |
| Jindong | 99 | 29.5 | |
| Bilabial | 126 | 37.5 | |
| Other | 6 | 1.8 | |
| How often you shop at AI virtual anchor livestreams | Once a week or less | 141 | 42.0 |
| 2–3 times a week | 70 | 20.8 | |
| More than 4 times a week | 35 | 10.4 | |
| Not sure | 90 | 26.8 |
| Construct | Item | Measurement Items | References |
|---|---|---|---|
| Accuracy (AC) | AC1 | The virtual anchor was able to answer my questions accurately. | [8] |
| AC2 | The virtual anchor can provide adequate service. | ||
| AC3 | The virtual anchor can provide a complete service. | ||
| AC4 | The virtual anchor can provide a credible service. | ||
| Interactivity (IC) | IC1 | I can easily interact with the virtual anchor. | [54] |
| IC2 | I can easily talk to the virtual anchor. | ||
| IC3 | I can easily chat with the virtual anchor. | ||
| Problem-solving ability (PSA) | PSA1 | The virtual anchor was able to answer the questions I asked. | [8] |
| PSA2 | The virtual anchor was able to provide me with useful answers. | ||
| PSA3 | Overall, the virtual anchor is qualified and competent. | ||
| Novelty (NV) | NV1 | Seeing a virtual anchor on a live stream is a unique experience. | [58] |
| NV2 | Seeing a virtual anchor on the air satisfied my curiosity. | ||
| NV3 | Using a virtual anchor in a live room provides a realistic experience. | ||
| Perceived usefulness (PU) | PU1 | The virtual anchor has been very useful in my life. | [55] |
| PU2 | The virtual anchor has provided me with very useful services and information. | ||
| PU3 | The virtual anchor has increased the efficiency of my purchases. | ||
| Perceived enjoyment (PE) | PE1 | Virtual anchors are really fun. | [56,57] |
| PE2 | Virtual anchors bring me joy. | ||
| PE3 | Virtual anchors make me feel good. | ||
| Perceived privacy risks (PPR) | PPR1 | Providing personal information to a virtual anchor is risky. | [59] |
| PPR2 | Providing personal information to a virtual anchor comes with a lot of uncertainty. | ||
| PPR3 | There are many potential losses associated with providing personal information to a virtual anchor. | ||
| Brand image (BI) | BI1 | The brand is attractive (branding means applying the brand of the virtual anchor in the live stream, below). | [8] |
| BI2 | This brand is reliable. | ||
| BI3 | This brand has a great reputation. | ||
| Brand loyalty (BL) | BL1 | I will continue to use this brand because I am happy with it (brand means the brand that applies the virtual anchor in the live stream, below). | [60] |
| BL2 | I’ll use the brand, regardless of the competitor’s deal. | ||
| BL3 | I will be purchasing more products and services from this brand. |
| Sum of Squares | df | Mean Square | F | Sig. | ||
|---|---|---|---|---|---|---|
| AC * BL | (Combined) | 302.478 | 22 | 13.749 | 18.611 | 0.000 |
| Linearity | 283.781 | 1 | 283.781 | 384.124 | 0.000 | |
| Deviation from Linearity | 18.698 | 21 | 0.890 | 1.205 | 0.244 | |
| IC * BL | (Combined) | 259.338 | 18 | 14.408 | 16.646 | 0.000 |
| Linearity | 209.974 | 1 | 209.974 | 242.594 | 0.000 | |
| Deviation from Linearity | 49.364 | 17 | 2.904 | 3.355 | 0.000 | |
| PSA * BL | (Combined) | 320.978 | 18 | 17.832 | 26.572 | 0.000 |
| Linearity | 285.301 | 1 | 285.301 | 425.131 | 0.000 | |
| Deviation from Linearity | 35.677 | 17 | 2.099 | 3.127 | 0.000 | |
| PU * BL | (Combined) | 352.810 | 18 | 19.601 | 34.346 | 0.000 |
| Linearity | 339.487 | 1 | 339.487 | 594.887 | 0.000 | |
| Deviation from Linearity | 13.324 | 17 | 0.784 | 1.373 | 0.147 | |
| PE * PL | (Combined) | 309.105 | 18 | 17.172 | 24.236 | 0.000 |
| Linearity | 289.690 | 1 | 289.690 | 408.852 | 0.000 | |
| Deviation from Linearity | 19.415 | 17 | 1.142 | 1.612 | 0.060 | |
| NV * PL | (Combined) | 309.185 | 18 | 17.177 | 24.251 | 0.000 |
| Linearity | 297.086 | 1 | 297.086 | 419.439 | 0.000 | |
| Deviation from Linearity | 12.099 | 17 | 0.712 | 1.005 | 0.452 | |
| PPR * PL | (Combined) | 174.812 | 17 | 10.283 | 9.111 | 0.000 |
| Linearity | 94.735 | 1 | 94.735 | 83.938 | 0.000 | |
| Deviation from Linearity | 80.077 | 16 | 5.005 | 4.434 | 0.000 | |
| BI * BL | (Combined) | 396.342 | 18 | 22.019 | 50.811 | 0.000 |
| Linearity | 382.455 | 1 | 382.455 | 882.556 | 0.000 | |
| Deviation from Linearity | 13.887 | 17 | 0.817 | 1.885 | 0.019 | |
| N | Normal Parameters, a | Most Extreme Differences | Kolmogorov-Smirnov Z | Asymp. Sig. (2-Tailed) | ||||
|---|---|---|---|---|---|---|---|---|
| Mean | Std. Deviation | Absolute | Positive | Negative | ||||
| AC1 | 336 | 5.03 | 1.363 | 0.230 | 0.131 | −0.230 | 0.947 | 0.000 |
| AC2 | 336 | 5.02 | 1.246 | 0.198 | 0.133 | −0.198 | 0.968 | 0.000 |
| AC3 | 336 | 5.01 | 1.383 | 0.177 | 0.110 | −0.177 | 0.962 | 0.000 |
| AC4 | 336 | 4.91 | 1.465 | 0.172 | 0.095 | −0.172 | 0.953 | 0.000 |
| IC1 | 336 | 5.06 | 1.318 | 0.218 | 0.157 | −0.218 | 0.956 | 0.000 |
| IC2 | 336 | 5.08 | 1.400 | 0.182 | 0.107 | −0.182 | 0.959 | 0.000 |
| IC3 | 336 | 4.99 | 1.369 | 0.191 | 0.120 | −0.191 | 0.959 | 0.000 |
| PSA1 | 336 | 5.05 | 1.278 | 0.218 | 0.128 | −0.218 | 0.962 | 0.000 |
| PSA2 | 336 | 4.93 | 1.408 | 0.217 | 0.155 | −0.217 | 0.947 | 0.000 |
| PSA3 | 336 | 5.01 | 1.371 | 0.198 | 0.165 | −0.198 | 0.954 | 0.000 |
| PU1 | 336 | 4.79 | 1.440 | 0.169 | 0.101 | −0.169 | 0.953 | 0.000 |
| PU2 | 336 | 4.90 | 1.411 | 0.184 | 0.125 | −0.184 | 0.959 | 0.000 |
| PU3 | 336 | 4.78 | 1.501 | 0.197 | 0.097 | −0.197 | 0.947 | 0.000 |
| PE1 | 336 | 4.95 | 1.363 | 0.199 | 0.116 | −0.199 | 0.965 | 0.000 |
| PE2 | 336 | 5.01 | 1.499 | 0.179 | 0.093 | −0.179 | 0.965 | 0.000 |
| PE3 | 336 | 4.99 | 1.359 | 0.214 | 0.140 | −0.214 | 0.968 | 0.000 |
| NV1 | 336 | 5.49 | 1.378 | 0.222 | 0.136 | −0.222 | 0.965 | 0.000 |
| NV2 | 336 | 5.36 | 1.418 | 0.239 | 0.124 | −0.239 | 0.965 | 0.000 |
| NV3 | 336 | 4.93 | 1.490 | 0.164 | 0.095 | −0.164 | 0.956 | 0.000 |
| PPR1 | 336 | 5.33 | 1.284 | 0.201 | 0.123 | −0.201 | 0.968 | 0.000 |
| PPR2 | 336 | 5.28 | 1.311 | 0.206 | 0.131 | −0.206 | 0.956 | 0.000 |
| PPR3 | 336 | 5.29 | 1.423 | 0.219 | 0.120 | −0.219 | 0.953 | 0.000 |
| BI1 | 336 | 5.10 | 1.304 | 0.214 | 0.132 | −0.214 | 0.959 | 0.000 |
| BI2 | 336 | 4.91 | 1.425 | 0.188 | 0.107 | −0.188 | 0.950 | 0.000 |
| BI3 | 336 | 5.02 | 1.441 | 0.199 | 0.109 | −0.199 | 0.959 | 0.000 |
| BL1 | 336 | 5.07 | 1.443 | 0.182 | 0.106 | −0.182 | 0.950 | 0.000 |
| BL2 | 336 | 4.80 | 1.413 | 0.162 | 0.108 | −0.162 | 0.965 | 0.000 |
| BL3 | 336 | 4.86 | 1.364 | 0.188 | 0.115 | −0.188 | 0.959 | 0.000 |
| Construct | CR | Cronbach’s Alpha | AVE |
|---|---|---|---|
| Accuracy (AC) | 0.874 | 0.870 | 0.720 |
| Interactivity (IC) | 0.905 | 0.905 | 0.840 |
| Problem-solving ability (PSA) | 0.857 | 0.857 | 0.777 |
| Perceived usefulness (PU) | 0.876 | 0.876 | 0.801 |
| Perceived enjoyment (PE) | 0.892 | 0.892 | 0.822 |
| Novelty (NV) | 0.831 | 0.831 | 0.748 |
| Perceived privacy risks (PPR) | 0.850 | 0.850 | 0.768 |
| Brand image (BI) | 0.886 | 0.886 | 0.815 |
| Brand loyalty (BL) | 0.879 | 0.879 | 0.806 |
| AC | BI | BL | IC | NV | PE | PPR | PSA | PU | |
|---|---|---|---|---|---|---|---|---|---|
| AC | 0.849 | ||||||||
| BI | 0.747 | 0.903 | |||||||
| BL | 0.735 | 0.848 | 0.898 | ||||||
| IC | 0.71 | 0.641 | 0.628 | 0.917 | |||||
| NV | 0.709 | 0.776 | 0.748 | 0.68 | 0.865 | ||||
| PE | 0.722 | 0.757 | 0.743 | 0.705 | 0.786 | 0.907 | |||
| PPR | 0.486 | 0.421 | 0.429 | 0.423 | 0.574 | 0.456 | 0.876 | ||
| PSA | 0.813 | 0.739 | 0.733 | 0.725 | 0.727 | 0.733 | 0.436 | 0.882 | |
| PU | 0.82 | 0.809 | 0.798 | 0.649 | 0.727 | 0.746 | 0.406 | 0.775 | 0.895 |
| AC | BI | BL | IC | NV | PE | PPR | PSA | |
|---|---|---|---|---|---|---|---|---|
| AC | ||||||||
| BI | 0.848 | |||||||
| BL | 0.836 | 0.958 | ||||||
| IC | 0.799 | 0.716 | 0.702 | |||||
| NV | 0.827 | 0.902 | 0.869 | 0.784 | ||||
| PE | 0.815 | 0.849 | 0.833 | 0.783 | 0.91 | |||
| PPR | 0.555 | 0.48 | 0.484 | 0.483 | 0.685 | 0.52 | ||
| PSA | 0.942 | 0.848 | 0.842 | 0.823 | 0.858 | 0.837 | 0.507 | |
| PU | 0.939 | 0.917 | 0.908 | 0.729 | 0.847 | 0.842 | 0.462 | 0.895 |
| Original Sample (O) | Sample Mean (M) | 2.50% | 97.50% | Sample Mean (M) | Bias | 2.50% | 97.50% | |
|---|---|---|---|---|---|---|---|---|
| BI <-> AC | 0.848 | 0.848 | 0.78 | 0.91 | 0.848 | 0 | 0.778 | 0.908 |
| BL <-> AC | 0.836 | 0.835 | 0.774 | 0.889 | 0.835 | 0 | 0.771 | 0.887 |
| BL <-> BI | 0.958 | 0.958 | 0.922 | 0.993 | 0.958 | 0 | 0.922 | 0.993 |
| IC <-> AC | 0.799 | 0.799 | 0.717 | 0.868 | 0.799 | 0 | 0.711 | 0.863 |
| IC <-> BI | 0.716 | 0.716 | 0.616 | 0.806 | 0.716 | 0 | 0.614 | 0.804 |
| IC <-> BL | 0.702 | 0.702 | 0.593 | 0.792 | 0.702 | 0 | 0.586 | 0.789 |
| NV <-> AC | 0.827 | 0.827 | 0.745 | 0.898 | 0.827 | 0 | 0.744 | 0.897 |
| NV <-> BI | 0.902 | 0.902 | 0.83 | 0.959 | 0.902 | −0.001 | 0.827 | 0.956 |
| NV <-> BL | 0.869 | 0.869 | 0.809 | 0.924 | 0.869 | 0 | 0.807 | 0.923 |
| NV <-> IC | 0.784 | 0.784 | 0.689 | 0.865 | 0.784 | 0 | 0.684 | 0.861 |
| PE <-> AC | 0.815 | 0.815 | 0.737 | 0.88 | 0.815 | 0 | 0.732 | 0.878 |
| PE <-> BI | 0.849 | 0.849 | 0.78 | 0.909 | 0.849 | 0 | 0.777 | 0.907 |
| PE <-> BL | 0.833 | 0.832 | 0.769 | 0.889 | 0.832 | 0 | 0.766 | 0.889 |
| PE <-> IC | 0.783 | 0.783 | 0.687 | 0.863 | 0.783 | 0 | 0.68 | 0.858 |
| PE <-> NV | 0.91 | 0.91 | 0.85 | 0.962 | 0.91 | 0 | 0.848 | 0.961 |
| PPR <-> AC | 0.555 | 0.554 | 0.416 | 0.678 | 0.554 | −0.001 | 0.41 | 0.673 |
| PPR <-> BI | 0.48 | 0.48 | 0.312 | 0.636 | 0.48 | 0 | 0.31 | 0.634 |
| PPR <-> BL | 0.484 | 0.484 | 0.333 | 0.628 | 0.484 | 0 | 0.328 | 0.623 |
| PPR <-> IC | 0.483 | 0.483 | 0.334 | 0.615 | 0.483 | 0 | 0.333 | 0.614 |
| PPR <-> NV | 0.685 | 0.685 | 0.548 | 0.806 | 0.685 | 0 | 0.538 | 0.8 |
| PPR <-> PE | 0.52 | 0.519 | 0.381 | 0.65 | 0.519 | −0.001 | 0.379 | 0.648 |
| PSA <-> AC | 0.942 | 0.943 | 0.889 | 0.99 | 0.943 | 0.001 | 0.885 | 0.987 |
| PSA <-> BI | 0.848 | 0.848 | 0.753 | 0.925 | 0.848 | 0 | 0.745 | 0.92 |
| PSA <-> BL | 0.842 | 0.843 | 0.741 | 0.918 | 0.843 | 0.001 | 0.722 | 0.911 |
| PSA <-> IC | 0.823 | 0.823 | 0.742 | 0.891 | 0.823 | −0.001 | 0.739 | 0.89 |
| PSA <-> NV | 0.858 | 0.859 | 0.764 | 0.936 | 0.859 | 0.001 | 0.754 | 0.93 |
| PSA <-> PE | 0.837 | 0.838 | 0.752 | 0.907 | 0.838 | 0 | 0.741 | 0.902 |
| PSA <-> PPR | 0.507 | 0.508 | 0.341 | 0.667 | 0.508 | 0.001 | 0.333 | 0.661 |
| PU <-> AC | 0.939 | 0.94 | 0.902 | 0.975 | 0.94 | 0.001 | 0.9 | 0.973 |
| PU <-> BI | 0.917 | 0.917 | 0.869 | 0.96 | 0.917 | 0 | 0.868 | 0.959 |
| PU <-> BL | 0.908 | 0.908 | 0.865 | 0.946 | 0.908 | 0 | 0.864 | 0.946 |
| PU <-> IC | 0.729 | 0.729 | 0.618 | 0.82 | 0.729 | 0 | 0.609 | 0.814 |
| PU <-> NV | 0.847 | 0.847 | 0.779 | 0.907 | 0.847 | 0 | 0.775 | 0.904 |
| PU <-> PE | 0.842 | 0.842 | 0.768 | 0.909 | 0.842 | 0 | 0.764 | 0.905 |
| PU <-> PPR | 0.462 | 0.462 | 0.309 | 0.607 | 0.462 | 0 | 0.306 | 0.603 |
| PU <-> PSA | 0.895 | 0.896 | 0.792 | 0.97 | 0.896 | 0.001 | 0.778 | 0.963 |
| Hypotheses | Path | β | T Statistics | p Values | Remark |
|---|---|---|---|---|---|
| H1 | AC -> BI | 0.083 | 1.278 | 0.101 ns | Not supported |
| H2 | IC -> BI | −0.011 | 0.187 | 0.426 ns | Not supported |
| H3 | PSA -> BI | 0.082 | 1.3 | 0.097 ns | Not supported |
| H4 | PU -> BI | 0.369 | 5.806 | 0.000 ** | Supported |
| H5 | PE -> BI | 0.15 | 1.745 | 0.041 * | Supported |
| H6 | NV -> BI | 0.304 | 3.547 | 0.000 ** | Supported |
| H7 | PPR -> BI | −0.043 | 1.028 | 0.152 ns | Not supported |
| H8 | BI -> BL | 0.848 | 48.331 | 0.000 ** | Supported |
| Original Sample (O) | T Statistics | p Values | |
|---|---|---|---|
| AC -> BI -> BL | 0.07 ns | 1.283 | 0.100 |
| IC -> BI -> BL | −0.009 ns | 0.187 | 0.426 |
| NV -> BI -> BL | 0.258 ** | 3.574 | 0.000 |
| PE -> BI -> BL | 0.127 * | 1.75 | 0.040 |
| PPR -> BI -> BL | −0.036 ns | 1.034 | 0.151 |
| PSA -> BI -> BL | 0.07 ns | 1.287 | 0.099 |
| PU -> BI -> BL | 0.313 ** | 5.769 | 0.000 |
| Network | Training | Testing |
|---|---|---|
| 1 | 0.574 | 0.580 |
| 2 | 0.567 | 0.682 |
| 3 | 0.572 | 0.628 |
| 4 | 0.559 | 0.713 |
| 5 | 0.561 | 0.747 |
| 6 | 0.584 | 0.521 |
| 7 | 0.591 | 0.492 |
| 8 | 0.575 | 0.630 |
| 9 | 0.570 | 0.712 |
| 10 | 0.588 | 0.590 |
| Average | 0.574 | 0.629 |
| Standard deviation | 0.010 | 0.081 |
| Constructs | Importance | Normalized Importance |
|---|---|---|
| Perceived usefulness | 0.152 | 21.0% |
| Perceived enjoyment | 0.037 | 11.6% |
| Novelty | 0.108 | 12.9% |
| Brand image | 0.606 | 65.1% |
Disclaimer/Publisher’s Note: The statements, opinions and data contained in all publications are solely those of the individual author(s) and contributor(s) and not of MDPI and/or the editor(s). MDPI and/or the editor(s) disclaim responsibility for any injury to people or property resulting from any ideas, methods, instructions or products referred to in the content. |
© 2025 by the authors. Licensee MDPI, Basel, Switzerland. This article is an open access article distributed under the terms and conditions of the Creative Commons Attribution (CC BY) license (https://creativecommons.org/licenses/by/4.0/).
Share and Cite
Zhu, Y.-P.; Xin, L.; Wang, H.; Park, H.-W. Effects of AI Virtual Anchors on Brand Image and Loyalty: Insights from Perceived Value Theory and SEM-ANN Analysis. Systems 2025, 13, 79. https://doi.org/10.3390/systems13020079
Zhu Y-P, Xin L, Wang H, Park H-W. Effects of AI Virtual Anchors on Brand Image and Loyalty: Insights from Perceived Value Theory and SEM-ANN Analysis. Systems. 2025; 13(2):79. https://doi.org/10.3390/systems13020079
Chicago/Turabian StyleZhu, Yu-Peng, Lina Xin, Huimin Wang, and Han-Woo Park. 2025. "Effects of AI Virtual Anchors on Brand Image and Loyalty: Insights from Perceived Value Theory and SEM-ANN Analysis" Systems 13, no. 2: 79. https://doi.org/10.3390/systems13020079
APA StyleZhu, Y.-P., Xin, L., Wang, H., & Park, H.-W. (2025). Effects of AI Virtual Anchors on Brand Image and Loyalty: Insights from Perceived Value Theory and SEM-ANN Analysis. Systems, 13(2), 79. https://doi.org/10.3390/systems13020079