Abstract
Given the deficiencies in the definition of connotation, the construction of index systems, and the coordination of targets within the research on sustainable development in the manufacturing industry, an evaluation index system for sustainable development has been established. This system includes economic benefits, social benefits, resource management, and environmental goals and is built upon a clear definition of the concept’s connotation. The CRITIC–entropy–TOPSIS–CCDM approach is employed for the computation of the coordinated development level of the manufacturing industry. To identify the main factors influencing the coupling coordination degree (CCD) from a mechanistic and compositional point of view, a logarithmic mean divisia index (LMDI) is used. Furthermore, the obstacle degree model analyzes the factors that restrict subsystem development. The results show the following. (1) The coordinated development level of the Chinese manufacturing industry has been maintained at 0.6–0.7, while the CCD of Hainan, Qinghai, and Xinjiang remains to be enhanced. (2) The key factor affecting the CCD is the coupling degree. The evaluation value of the economy and employment system determines the trend of coordinated development in the regional manufacturing industry. (3) The economic and employment scenarios in most provinces (cities) led to a significant decrease in the CCD compared to the baseline scenario, with average growth rates of −10.55% and −12.69%. This suggests that policymakers’ priorities significantly influence the CCD. The research presents a theoretical framework for assessing the sustainability of the manufacturing industry, offering valuable insights to guide the industry towards more sustainable practices.
Keywords:
economy–society–resource–environment; CRITIC (criteria importance though intercriteria correlation)–entropy weight; TOPSIS (technique for order preference by similarity to ideal solution); coupling coordination degree model (CCDM); logarithmic mean divisia index (LMDI); obstacle degree model 1. Introduction
The “reindustrialization strategy” of developed nations and the “kinetic energy transformation strategy” of developing nations have articulated the significance of the manufacturing sector’s regaining worldwide prominence in the context of the current technology revolution. China’s economy has grown quickly, and manufacturing has produced amazing outcomes. China’s manufacturing sector saw an increase in added value from CNY 20.9 trillion yuan in 2012 to CNY 33.91 trillion yuan in 2023, which accounted for a global proportion from 22.5% to nearly 30%. Its production scale also placed it at the top of the world for 14 consecutive years [1]. However, the issue of deep-seated development in the manufacturing sector is progressively coming to light due to changes in the circumstances surrounding Chinese and international economic development. The high-input, high-pollution development model causes significant resource waste and contamination of the environment [2]. In 2022, the standard coal consumption of the manufacturing industry reached 30.7086 million tons, accounting for 56.77% of the country’s total energy consumption, and emitted 7804 million tons of carbon dioxide, accounting for 51.94% of the national carbon emissions. China was forced to reassess its objectives in light of the changing circumstances, putting up new demands and forming new agreements in order to realize its objective of developing a sustainable manufacturing sector. In 2017, the Central Economic Work Conference highlighted the need to expedite the establishment of index systems, policy systems, statistical systems, and performance evaluation for high-quality development. It also encouraged China’s economy to continue progressing toward achieving high-quality development. The national 14th Five-Year Plan and the long-term goal outline for 2035 placed emphasis on enhancing the manufacturing industry’s competitive advantage and promoting its high-quality development [3]. The National Conference on Industry and Information Technology in 2023 underscored the importance of promoting the steady growth of the industrial economy and maintaining the fundamental stability of the manufacturing industry’s share.
China has maintained its top position in global manufacturing production for numerous years, but it still faces prominent issues such as “large, but not strong” and “noticeable regional differences” [4]. Furthermore, the proposal of the dual-carbon target necessitates the consideration of both stable economic growth and the reduction of carbon emissions. Therefore, when combining China’s manufacturing industry development characteristics with its objective needs, sustainable development should consider the coordination of economic benefits, social benefits, resource consumption, and carbon emission reduction. In this context, the pressing issue in the academic community is to develop a scientific, logical, and practical evaluation index system for promoting the coordinated development of China’s manufacturing industry. This index system should consider multiple dimensions, such as economy, society, resources, and the environment. Additionally, it should reveal the evolving trends in the industry’s quality of development and supporting structure, as well as the challenges it encounters.
To evaluate the level of coordinated development of the manufacturing industry, this paper develops a five-step model, as shown in Figure 1 (research flowchart). It is aimed at constructing an assessment methodology for coordinated development in the manufacturing industry, as follows. Step 1: Construct a comprehensive assessment framework for the coordinated development of the manufacturing industry in five dimensions: economy, society, energy, water resources, and carbon emissions. Step 2: Calculate the weight of the indicator with the critical-entropy weight method.(Step 3) Use the TOPSIS method to assess the development level of the subsystems within 30 provinces(cities). (Step 4) Evaluate the interaction between subsystems using the CCDM method. (Step 5) Identify the primary obstacles that impede the coordinated development of the manufacturing industry in different regions using the LMDI method and obstacle degree model.

Figure 1.
Research flowchart.
2. Literature Review
To date, research on high-quality development in the manufacturing industry has mainly elaborated on three aspects: index design, measurement methods, and identification of influencing factors.
The indicator of design for the manufacturing industry’s high-quality development is categorized into two methods: a single-index technique and a comprehensive index approach. The value-added rate [5], total factor productivity (TFP) [6,7], and green total factor productivity [8,9,10] are used in the first method to judge the quality of economic growth. However, the manufacturing industry’s high-quality advancement involves numerous aspects, making the evaluation method of constructing the index system more reasonable and effective than the single-index method [11,12,13]. The existing research on index systems primarily adopts a fundamental framework based on five key development concepts: innovation, coordination, green, openness, and sharing. However, it should be noted that the development concept is the forerunner of economic development, not its essential connotation. Innovation and openness are the ways and means of economic development. Measuring high-quality development must include many fields. The selection of indicators should focus on indicators reflecting quality and results [14].
Regarding high-quality development evaluation methods, the research can be mainly divided into subjective weighting approaches and objective weighting approaches. The former is obtained by experts’ subjective judgments based on experience, which contains common methods like the Delphi method, the analytic hierarchy process (AHP) [15,16], and the equal-weight method [17], and there is inevitably randomness and subjective uncertainty among evaluation experts in the application process. The objective weighting approach calculates the weight of each index based on its coefficient of variation or correlation, such as gray correlation analysis [18,19], the TOPSIS method [20,21], principal component analysis [6,22], the entropy method [23,24], and data envelopment analysis [25]. The objective weighting approach calculates the weight of each factor based on its contribution rate, in contrast to the subjective weighting method. This approach overcomes the defect of subjective uncertainty and makes the evaluation results more objective and reasonable.
When examining the factors that affect the high-quality growth of the manufacturing sector, the academic discussion is mainly focused on the digital economy [26,27], technological innovation [28,29], R&D investment [30,31], environmental regulation [32], foreign direct investment [2], institutional environment [33], and industrial agglomeration [34]. The digital economy facilitates manufacturing agglomeration by decreasing transaction costs, expanding market potential, and improving knowledge spillover [35]. According to Guo et al., the utilization of industrial robots has a substantial impact on promoting high-quality advancement in the manufacturing sector [36]. According to Chen et al., the unequal growth of the regional service industry hampers the productivity of industrial businesses. Nevertheless, as the manufacturing service level advances, the progress of regional service stimulates the enhancement of productivity in manufacturing firms [6].
In summary, in recent years, academics have conducted certain research on the advancement of the manufacturing industry. However, the relevant research still has the following limitations. (1) The precise definition of sustainable development in the manufacturing sector remains ambiguous. (2) When it comes to measuring the level of sustainable development, the majority of evaluation indicator systems in the existing research utilize the five development principles of innovation, coordination, green practices, openness, and sharing as their fundamental framework. However, they fail to distinguish between process indicators and outcome indicators. (3) Normally, researchers use the entropy weight approach or the entropy–TOPSIS approach to evaluate the sustainable development level of the manufacturing industry, but they have not quantified the interaction between different objectives.
The key contributions of this paper are as follows. (1) This paper aims to enrich the connotation of the sustainable development theory. This study defines the connotation of sustainable development of the manufacturing industry and constructs an evaluation index system for the coordinated development level of the manufacturing industry. The indicator system is founded on five dimensions of outcome indicators: economy, employment, energy, water, and carbon emissions. This solves the problem of previous studies getting process indicators and outcome indicators mixed up. (2) Expand research methods. In terms of methodology, the GIS–CRITIC–entropy–TOPSIS–CCDM approach is employed for the computation of the coordinated development level of the manufacturing industry. On this basis, the CCDM method is combined with the LMDI approach to find important factors that affect the level of coupling coordination from the mechanism and composition points of view. This is a valuable endeavor to precisely capture the trends in coordination-level changes, as well as the internal mechanisms that influence them. The TOPSIS method is then combined with the obstacle degree model to identify the obstacles restricting the development of the manufacturing subsystem from the internal system point of view. The combination of methods can be applied across a broad spectrum of similar studies. (3) Create a guide for future research on the sustainable development of manufacturing industries in different Chinese provinces and cities by changing the parameters that control the contributions of the subsystems and simulating the variational CCD when government priorities change in different situations.
3. Data and Methodology
3.1. Data Source and Preprocessing
This study focused on analyzing 30 provinces in China, excluding Tibet, Taiwan, Hong Kong, and Macau, from 2003 to 2020. In view of the differences in regional economic structures, resource endowments, institutional environments, and regional development strategies [37,38], the 30 provinces are classified into four regions: eastern, northeastern, central, and western (Figure 2).
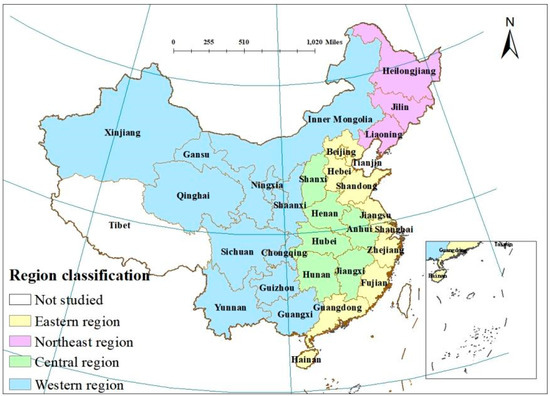
Figure 2.
Study area.
Data from 30 provinces (cities) were gathered from the online editions of the China Statistical Yearbook (2003–2020), the China Energy Statistical Yearbook (2003–2020), the China Industrial Statistics Yearbook (2003–2020), and the provincial statistical yearbooks (2003–2020). The interpolation method was employed to handle missing data.
The original data were adjusted due to variations in the size and magnitude of each selected indicator [39]. After technical adjustment, all index values fell within the range of 0 to 1.
Positive indicator:
Negative indicator:
where is the initial value of the j-th indicator in the i-th province (city); and respect the maximum and minimum values of the j-th indicator in all of the provinces; and represents the normalized values.
3.2. Evaluation Indicator System Construction
Coordination is one of the basic principles of sustainable development, and its core connotation is to emphasize the sustainable and coordinated development of economy, society, resources, and environment in the process of economic development [40]. The growth of the manufacturing industry is a complex system of multi-industry, multi-regional, and multi-layered intertwining. Thus, the advancement of the manufacturing industry is a multifaceted issue. The sustainable development of the manufacturing industry is an intrinsic unity of the level of development, the level of sustainability, and the level of coordination. It should consider multiple aspects, such as society, economy, resources, energy, and the environment. At the same time, the index system should distinguish between process indicators and result indicators. A single indicator cannot comprehensively measure the high-quality growth level of manufacturing, and selecting too many indicators will ignore their importance and practicability. Guided by the theory of sustainability of the manufacturing sector, this study develops an assessment framework for measuring the sustainability of the manufacturing industry, which includes five first-level indicators of economy, employment, energy, water, and carbon emissions, and a total of 23 secondary-level indicators. The selection of the secondary indicators considers both the total amount and strength indicators, as presented in Table 1.

Table 1.
Indicator system for coordinated development of manufacturing.
According to the IPCC method, nine energy sources were selected when calculating the total carbon emissions. Table A1 displays the carbon emission coefficients of various energy sources. The computation formula is as stated:
where represent the total carbon dioxide emissions; represent the CO2 emissions of the i-th energy; represents the use of the i-th energy; and represents the emission factor of carbon dioxide for the i-th energy source.
3.3. Research Methodology
3.3.1. CRITIC–Entropy Weight Method
Diakoulaki [53] introduced the CRITIC (criteria importance though intercriteria correlation) approach, an objective weight approach. This strategy can consider the comparative strength and discordance among indicators. Through comparing several objective weighting methods, Tao et al. discovered that the CRITIC approach is more comprehensive and objective [54]. However, scholars have found that the CRITIC method does not consider the dispersion between indicators, whereas the entropy weight approach calculates the weights of indicators based on the degree of dispersion between them [55]. The simultaneous application of the CRITIC approach and the entropy weight method allows for a more accurate and unbiased assessment of indicator weights. This study combines the two weighting methods to realize the complementary advantages between the objective weighting methods. It presupposes that both approaches hold equal significance.
The steps for determining the weight according to the improved CRITIC approach are as follows.
Determine the amount of information encompassed in the j-th indicator:
where and are the standard deviation and average value of the j-th index, respectively; and is the correlation coefficient between the i-th and the j-th index.
Calculate the weight of the j-th index:
According to the entropy weight approach, the process of weight determination involves the following steps.
Determine the ratio of the j-th index of the i-th evaluation item:
Determine the entropy of the indicator j:
Time variables were considered when calculating the information entropy of indicators. m (m = 30) represents 30 provinces (cities); T (T = 18) represents all statistical years.
Determine the entropy weight of indicator j:
Calculate the combined weight of indicator j:
where and represent the weight calculated by the CRITIC weight method and entropy method, respectively.
3.3.2. Weighted TOPSIS Model
The TOPSIS approach is a technique used for making decisions that involve multiple factors. The TOPSIS method has found extensive application in diverse domains, including engineering [56], management [50], and environmental sciences [57]. Decision-makers can use it to evaluate and make decisions on complex problems influenced by multiple factors, while also receiving scientific and quantitative support. The weighted TOPSIS approach takes into account the relative significance of each index, in contrast to the conventional TOPSIS method.
Construct weighted decision matrix:
where is the weighted normalized decision matrix; is the combined weight the of j-th indicator; and represents the values that have been standardized.
Calculate the ideal solutions for positive and negative indicators:
where is the positive ideal solution; denotes the negative ideal solution; and and represent the positive indicator sets and negative indicator set, respectively.
Determine the Euclidean distance for each indicator value in relation to both the positive ideal solution and the negative ideal solution:
where and represent the distances between the value of a sample province (city) and the ideal value.
Calculate closeness degree:
where is the closeness degree of each scheme to the optimal scheme and is between 0 and 1. A higher value indicates a superior evaluation object.
3.3.3. The Coupling Coordination Degree Model
Coupling degree is a quantitative measure that captures the level of interaction and interdependence between two or more systems, indicating the extent to which these systems mutually influence and restrict each other [58]. The CCD is a measure of the level of positive coupling in a coupling relationship that indicates the level of coordination quality. The coupling coordination degree model has been widely applied in the fields of economy and ecological environment [59,60]. Thus, this study employed the CCDM to evaluate the coordinated development level of the manufacturing industry.
Here, n = 5, indicating 5 subsystems; D denotes the CCD; and C is the coupling degree, denoting the interaction intensity among subsystems. A higher C value indicates a stronger interaction between systems. T is the comprehensive coordination index, denoting the coordination level. represents the evaluation value of the economy, employment, energy, water, and carbon subsystems. stand for the contribution coefficients of the subsystems. The five subsystems were determined to be of equal importance, and the coefficient was established as [11,46].
The value of D is (0,1]. As the D value increases, the CCD also increases. By considering the value of D and referring to previous studies [24,47,49], the CCD was classified into ten types (Table 2).
Table 2.
The development type of coupling coordinated degree.
3.3.4. Logarithmic Mean Divisia Index Method
This article adopted the LMDI to identify the primary factor influencing the CCD. The LMDI is considered an ideal method for decomposition due to its strong theoretical basis, practicality, broad applicability, and ease of interpretation. Additionally, it allows for the handling of zero and negative values during the decomposition process [61,62]. The LMDI is widely used in energy and environmental [63] and socioeconomic fields [64] and aims to exploit the impact of various factors on the overall indicators, provide scientific basis and decision support for decision-makers, optimize resource allocation, and improve efficiency. The factors affecting CCD were first decomposed using the Kaya identity, and then the contribution of each factor was analyzed using the LMD approach [61,65]. Firstly, the effects and contributions of coupling degree and integrated coordination index on CCD were studied from the perspective of mechanism, and then the effects and contributions of economic, employment, energy, water, and carbon systems on CCD were studied from the perspective of composition. Based on Equation (14), the Kaya identity is decomposed to obtain Equation (17).
According to the LMDI method:
For a comprehensive explanation of the decomposition method, refer to [61]. The decomposition is as outlined below:
where t represents the reporting period; 0 denotes the base period; represents the logarithmic mean weight function; and and denote the impact of coupling degree and coordination level on CCD, respectively.
The development level of the subsystem is crucial to determining the CCD. Therefore, the influence of the evaluation value of the subsystem on the CCD is decomposed. Equation (14) had to be converted to Equation (20) to achieve decomposition, as follows:
Based on the LMDI method, Equations (21) and (22) are derived:
where represent the influence of the economic system, employment system, energy system, water system, and carbon emission system on the coupling coordination degree, respectively.
3.3.5. Obstacle Degree Model
Multiple indicators are adopted when evaluating the coordinated development of the manufacturing industry; however, the development of subsystems is restricted to different indicators in different regions. This study used an obstacle index analysis to better understand the main things that are stopping the development of subsystems in different areas and come up with workable solutions. The obstacle index is calculated as follows [66,67]:
where represents the obstacle degree, and the larger is, the stronger the restrictions. represents the indicator deviation degree, which is the gap between individual indicators and the optimal value; is the weight of index j; and represents the normalized value.
4. Results
4.1. Development Characteristics of Subsystems
4.1.1. Temporal Trend of Subsystems
The variation trend of subsystem development level is shown in Figure 3A. The average annual score of the economic system was less than 0.45, which is relatively low. The variation in growth rate of economic system development level in the eastern, northeastern, central, and western regions was 239.77%, 42.58%, 240.42%, and 159.57% from 2003 to 2020. At the national level, the development of the economic system exhibited a volatile rising trajectory. However, when considering subregions, the overall changes in each area differ significantly. From 2003 to 2010, the economic system in the northeastern region exhibited a higher level of development compared to the central and western regions. From 2011 to 2017, the development level of the economic system in the eastern region was lower than in the central region, but higher than in the western region. Since 2018, the economic system development level in the northeastern region has been at the bottom among the four major regions. During the study period, the development of economic systems in the eastern region always held a leading position. The economic system in the central region has a post-development advantage. After 2017, the development of the economic system in the central region began to exceed the national average.

Figure 3.
The development level of subsystems in four regions over the years. (A) Economic subsystem; (B) employment subsystem; (C) energy subsystem; (D) water subsystem; (E) carbon emission subsystem.
Figure 3B illustrates a clear upward trend in the development level of the employment system. The highest mean value was observed in the eastern region, followed by the central, northeastern, and western regions. The employment level in the northeastern region was higher than in the central region in 2003–2007. The overall growth rate of the employment system in the 30 provinces (cities) was only 24.25% from 2003 to 2009, 48.30% from 2009 to 2015, and 8.89% from 2015 to 2020. This means that the second phase grew twice as fast as the first and five times as fast as the third. The evaluation value of the employment system in the northeastern region had a short downward trend from 2014 to 2016. Throughout the research period, the employment level in the western region exhibited a consistent and continuous increase.
Figure 3C shows that the mean values of the energy system first increased and then decreased in the study period’s eastern, central, and western areas. The northeastern region experienced a volatile decline. Early on in the research, the northeastern region had the highest average value, then the eastern, western, and central regions. Under the dominant role of the energy structure, the energy system score in the central region decreased first and then increased in 2003–2007. From 2007 to 2017, the energy system’s average value in the central region was the greatest, followed by the northeastern, eastern, and west regions. After 2017, under the leading role of total energy usage, the energy system score in the eastern region was the lowest among the four regions.
Figure 3D illustrates a consistent and positive growth in the development of water systems across the four regions over the duration of the study. The average values of water systems in the eastern, northeastern, central, and western regions increased from 0.7497, 0.7857, 0.6367, and 0.7044 in 2003 to 0.8706, 0.9747, 0.8508, and 0.9518 in 2020, with growth rates of 16.13%, 20.57%, 33.62%, and 35.12%, respectively. Under the leading role of total industrial water usage and industrial water consumption intensity, during the research period, the water system score in the northeastern region was the highest, followed by the western region, then the eastern region, and finally the central region. Between 2008 and 2020, the central area consistently had the lowest total industrial water use and industrial water consumption intensity compared to the other three regions. This indicates that while the central region is vigorously developing the manufacturing sector, there is a need to increase the introduction of technology and improve the ability of water-related innovation to promote the efficiency of industrial water use [68].
Figure 3E demonstrates that the evaluated value of the carbon system in the four regions shows a decreasing trend over the research period. The average values of the eastern, northeastern, central, and western areas decreased from 0.8781, 0.9090, 0.8961, and 0.8231 in 2003 to 0.7099, 0.8381, 0.8066, and 0.6686 in 2020, with rates of decline of 19.16%, 7.80%, 9.99%, and 18.76%, respectively. From 2003 to 2020, the carbon system exhibited the greatest average in the northeastern region, with the central region ranking second. Under the effect of total carbon emissions, the eastern region’s carbon system score from 2007 to 2012 was the lowest among the four regions. Despite the western region having lower total carbon emissions compared to the eastern and central regions, it has higher carbon emissions per unit of industrial added value and per capita industrial carbon emissions. As a result, the carbon system score in the western region was consistently the lowest from 2013 to 2020. As the industrial sector in China’s eastern region upgrades and undergoes economic transformation, some high-energy-consuming industries are beginning to shift to the western region. These industries often operate on a foundation of fossil fuels, leading to an increase in carbon emissions. Although the western region benefits from economic development by absorbing these industry transfers, this also leads to an increase in carbon emissions.
4.1.2. Spatial Pattern of Subsystems
Figure 4A–D illustrate the spatial distribution of the economic subsystem’s development level. In 2003, Guangdong, Shanghai, Jiangsu, Zhejiang, and Shandong scored 0.1679, 0.1640, 0.1621, 0.1611, and 0.1473, significantly higher than other provinces (cities). Hainan had the lowest score of 0.0420, at the bottom of the 30 provinces. In 2009, this feature was maintained. In addition, Tianjin, Hebei, Liaoning, Fujian, and Henan showed higher scores. In 2015, the spatial disparities in the development level of the economic subsystem among provinces widened even further. This could be attributed to the rapid manufacturing development in some provinces (cities) in eastern and central China. Tianjin, Hebei, Inner Mongolia, Liaoning, Jilin, Heilongjiang, Shandong, Henan, and Qinghai scored lower in 2020 than in 2015.

Figure 4.
Spatial distribution of subsystem development levels: ((A) economic subsystem in 2003; (B) economic subsystem in 2009; (C):economic subsystem in 2015; (D) economic subsystem in 2020; (E) employment system in 2003; (F) employment system in 2009; (G) employment system in 2015; (H) employment system in 2020; (I) energy subsystem in 2003; (J) energy subsystem in 2009; (K) energy subsystem in 2015; (L) energy subsystem in 2020; (M) water subsystem in 2003; (N) water subsystem in 2009; (O) water subsystem in 2015; (P) water subsystem in 2020; (Q) carbon subsystem in 2003; (R) carbon subsystem in 2009; (S) carbon subsystem in 2015; (T) carbon subsystem in 2020).
Figure 4E–H present the spatial differentiation of the level of the employment subsystem in the years 2003, 2009, 2015, and 2020. In 2003, Guangdong scored the highest, Shandong was second, Jiangsu was third, and most western provinces scored very low. In 2009, the spatial differences in employment levels between Guangdong and other provinces widened further. The employment scores of 15 provinces (cities), including Liaoning, Shanghai, Jiangsu, Zhejiang, Fujian, Jiangxi, Yunnan, and Xinjiang, obviously improved, with more than 20% growth rates. In 2015, except in Liaoning, Zhejiang, Fujian, and Shandong, the growth rate of employment scores in other provinces exceeded that in the previous period. In 2020, the growth rate of employment scores in all provinces during this period was lower than in the second stage. Jiangsu, Fujian, Shandong, Henan, and Hubei scored even lower than in 2015. One probable explanation is that China is currently undergoing a crucial shift from a stage of rapid development to a stage of high-quality development.
The spatial distribution of the comprehensive level of the energy subsystem is shown in Figure 4I–L. In 2003, Guangxi and Zhejiang scored 0.6579 and 0.6736, respectively, lower than other provinces. In 2009, the energy system scores of 16 provinces (cities), including Beijing, Tianjin, and Hebei, declined, while other provinces’ scores improved. In 2015, the energy scores of most provinces continued to decline, and the difference in energy scores among provinces was further widened. From 2009 to 2015, only Inner Mongolia, Guangdong, and Guangxi increased their energy scores. In 2020, the spatial differences among provinces were still present. Sichuan, Xinjiang, Shandong, and Jiangsu scored 0.5252, 0.5612, 0.5638, and 0.5938, significantly lower than other provinces (cities). Ten provinces (cities), including Beijing, Jilin, Heilongjiang, Shanghai, and Hainan, improved their energy scores to varying degrees.
Figure 4M–P present the spatial differentiation of the water subsystem’s score. In 2003, differences in water system scores between provinces were minimized. In 2009, Beijing and Tianjin showed high scores of 0.9794 and 0.9898, respectively. The water subsystem of Jiangsu had the lowest score of 0.5072. In 2015, the scores of Jiangsu, Shandong, and Shanxi showed a downward trend, decreasing by 8.62%, 1.39%, and 0.71%. Other provinces demonstrated varying degrees of improvement. The scores of Guizhou and Heilongjiang improved compared with 2009, increasing by 26.43% and 18.33%, respectively. In 2020, all provinces (cities) improved their water system scores. Overall, spatial differences in the water subsystem are lower than those in the economy, employment, energy, and carbon subsystems.
The spatial distribution of the scores for the carbon subsystem is presented in Figure 4Q–T. In 2003, Ningxia and Qinghai scored 0.6069 and 0.6637, respectively, lower than other provinces. In 2009, Hebei, Jiangsu, Zhejiang, Fujian, Shandong, Guangdong, and Henan presented different degrees of decline. Jiangsu experienced the largest decline, at −18.68%. In 2015, the carbon scores of most provinces continued to decline, and the difference in carbon scores among provinces was further widened. From 2009 to 2015, only Beijing and Guizhou increased their energy scores. In 2020, Inner Mongolia, Ningxia, Xinjiang, and Shandong scored lower. Inner Mongolia serves as a prominent hub for energy and heavy chemical production, supplying coal and electricity to the entire nation. Consequently, this results in significant levels of carbon emissions [69]. Shandong possesses a highly advanced industrial infrastructure and stands as a major province in terms of energy consumption and carbon emissions [70].
4.2. Coupling Coordinated Analysis
4.2.1. Temporal Analysis of CCD
The temporal trend of the CCD is illustrated in Figure 5. In 2003, 2009, 2015, and 2020, the average coupling coordination degrees of 30 provinces were 0.5871, 0.6400, 0.6830, and 0.6900, respectively, indicating a gradual improvement from basic coordination to moderate coordination. Throughout the research period, the CCD among the subsystems in the eastern, central, and western areas demonstrated an upward trajectory. The CCD in the northeastern region exhibited a greater value compared to the central region throughout the period spanning from 2003 to 2010. From 2013 to 2020, the CCD in the northeastern region presented a decreasing–increasing trend. In the process of economic restructuring, the challenges of transformation and the impact of population outflow have resulted in diminished economic and employment benefits for the manufacturing sector in northeastern China. After 2009, the central region’s CCD surpassed the national average. During the study period, the eastern region’s CCD significantly outperformed the other four regions. The eastern coastal provinces (and cities) possess a relative scarcity of natural resources, yet they have advantageous locations, favorable technical conditions, abundant human resources, and notable advantages in openness and business environments compared to the central and western regions. These factors collectively contribute to a high level of coordinated development in their manufacturing industries. The CCD of the western region has consistently lagged behind the other four regions. The potential cause is that the growth of manufacturing in the western region primarily depends on the output of resources.
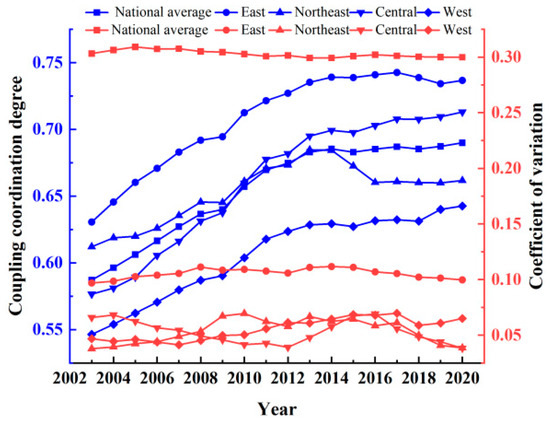
Figure 5.
Coupling coordination degree and coefficient of variation of four regions over the years.
The coefficient of variation (CV) indicated a more frequent change in the CCD variation coefficient. The trend of the coefficient of variation in the central regions shows that the disparity in the CCD first narrowed, then increased, and then narrowed. The coefficient of variation of CCD in the northeastern shows a trend of initial growth followed by a subsequent decline, indicating that the difference in CCD first increased and then decreased. The variation coefficient of CCD in the western region shows a slowly rising trend, which indicates that the difference in CCD increased slowly. On the whole, the variation in the coupling coordination level is relatively stable.
4.2.2. Spatial Change of CCD
Between 2003 and 2020, the CCD consistently improved across the majority of provinces. Nevertheless, there were some variations in the CCD between the various provinces (cities). To better understand the distribution characteristics of the CCD in different regions, we analyzed the CCD of four time sections (2003, 2008, 2014, and 2019) and mapped the spatiotemporal evolution of the CCD in 30 provinces and cities by applying ArcGIS 10.8 (Figure 6).
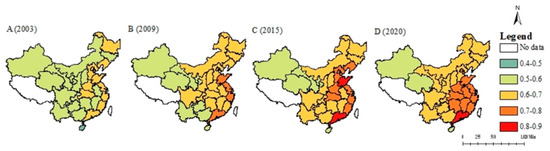
Figure 6.
Spatial distribution of the coupling coordination degree in (A) 2003, (B) 2009, (C) 2015, and (D) 2020.
In 2003, three types of CCD were identified in different provinces (cities): imminent imbalance, near coordination, and primary coordination. Thirteen provinces (cities), including Beijing, Tianjin, Hebei, Shanghai, Jiangsu, and Zhejiang, are in primary coordination. There are 13 provinces (cities) that are primary coordination types, including Beijing, Tianjin, Hebei, Jiangsu, Zhejiang, and Shanghai. Sixteen provinces (cities), such as Shanxi, Inner Mongolia, Jilin, Anhui, and Guangxi, are in near coordination. All provinces (cities) located in the western region belong to this category. It is crucial to emphasize that Hainan exhibits the lowest coupling coordination and is currently experiencing a significant imbalance. Hainan’s economy and employment levels are the lowest in the 30 provinces. The regional distribution of the CCD exhibited high values in the eastern region, followed by the northeastern, central, and western regions.
In 2009, the number of near-coordination provinces (cities) reduced, with the primary coordination type becoming the dominant trend. Nine provinces (cities), including Shanxi, Inner Mongolia, Jilin, and Anhui, shifted their development from near coordination to primary coordination. The CCD of eight provinces (cities), including Guangxi, Hainan, Guizhou, Yunnan, and Gansu, is relatively low and in the near-coordination stage. Among the 30 provinces (cities), the CCD in Zhejiang increased the most, with a growth rate of 16.47%.
In 2015, Shandong and Guangdong jumped to good coordination development. Beijing, Tianjin, Hebei, Liaoning, Shanghai, and the other 10 provinces and cities were in moderate coordination. All other provinces (cities), with the exception of Henan and Hubei, were located in the eastern region. The provinces (cities) that were near coordinated development were primarily centered in the eastern region, resulting in a highly imbalanced state overall with a widening disparity between the high and low CCD values.
As of 2020, only Guangdong was in the stage of good coordination. It is important to highlight that the CCD in Shandong in 2020 was lower than in 2015. The reason for this is that the development level of the five subsystems in Shandong was lower than in 2015. During the research period, the CCD in Guangdong surpassed that of other provinces (cities). From 2015 to 2020, the CCD in Fujian, Henan, and Hubei started to surpass those of other provinces (cities).
Figure 6A–D demonstrate that from 2009 to 2020, the coordination levels in Tianjin, Liaoning, Shanghai, Jiangsu, Zhejiang, Fujian, and Guangdong began to surpass those of other provinces (cities). Guangdong, Jiangsu, Zhejiang, Shanghai, and Shandong have high industrial technological innovation capabilities, a relatively high proportion of high-end manufacturing, a developed digital economy, a relatively high degree of integration between manufacturing and informatization, remarkable achievements in the transformation and upgrading of manufacturing, and a relatively high level of coordinated development in manufacturing. Gansu, Ningxia, Qinghai, and Xinjiang mainly rely on the development of energy–chemical, non-ferrous metal, and ferrous metal industries. All these industries are high-pollution and high-energy-consumption sectors, characterized by short industrial chains and extensive development models. Therefore, the level of coordinated manufacturing development is low. Hainan’s industrial development lags behind, as both the scale and quality of industrial development are relatively low, and the level of coordinated development in manufacturing consistently ranks at the bottom during the four observation periods. Hainan’s CCD has consistently been at the lower end of the country, with its economic and employment system development levels ranking at the bottom of all four observation periods. Throughout the study period, the CCD in Jiangxi changed the most, from 0.5328 in 2003 to 0.7112 in 2020, with a growth rate of 33.48%. Followed by Hunan and Anhui, the growth rates of CCD were 30.61% and 29.11%, respectively. In general, provinces (cities) with a higher CCD demonstrated higher economic and employment levels.
4.3. Coupling Coordination Degree Influencing Factor Analysis
4.3.1. The LMDI Decomposition Results
This article utilizes the CCDM in conjunction with the LMDI approach to ascertain the primary factors that influence the CCD in the manufacturing industry.
From the mechanism perspective (Figure 7A), the impact of coupling degree in most provinces (cities) exceeds the comprehensive coordination level. The increasing coupling degree in all 30 provinces and cities leads to an increase in CCD, which indicates that the interaction intensity between subsystems is the key factor affecting it. In Heilongjiang, Fujian, Guangdong, Guangxi, Gansu, and Guizhou, the influence of the comprehensive coordination index is stronger than that of the coupling degree. The results are more prominent in Heilongjiang, Guangdong, and Guangxi. The variation in the comprehensive coordination index leads to an increase of 0.0139 in the CCD in Heilongjiang, accounting for 88.60% of the CCD, followed by Guangdong (0.1170, 62.95%) and Guangxi (0.0785, 60.60%). In certain provinces like Shandong, Xinjiang, and Inner Mongolia, the growth of manufacturing, accompanied by excessive energy consumption and carbon emissions, has resulted in a decrease in the comprehensive coordination index among subsystems. In general, the influence of the comprehensive coordination index on the CCD is weaker than that of the coupling degree. Science and technological advancements are necessary to enhance energy efficiency and carbon emission efficiency in manufacturing, ultimately lowering reliance on coal usage and promoting high-quality growth.
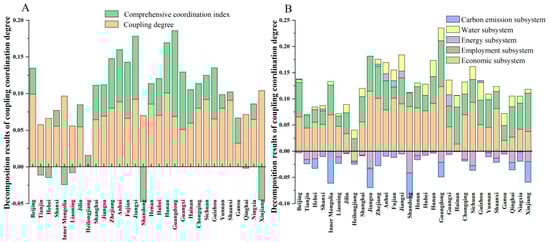
Figure 7.
Decomposition of the coupling coordination degree: (A) from the mechanistic perspective; (B) from the composition perspective.
From the perspective of composition (Figure 7B), the increase in the development level of the economic system has had various beneficial effects on the CCD of the other 29 provinces (cities). However, the CCD of the Heilongjiang province is inhibited, which may be related to industrial structure transfer in China in recent years. The employment system development in all provinces (cities) has positively impacted the CCD, which is due to the rapid development of the manufacturing industry in China, resulting in plenty of employment and steadily increasing salaries. With the exception of Jiangsu, the CCD of the other 29 provinces (cities) has been positively impacted by the water system evaluation values. The emphasis on technological progress in China’s industrial development has increased water use efficiency in the manufacturing sector. In most regions, the valuation values of the energy and carbon systems have a negative impact on the CCD, which suggests that China’s economic growth was achieved at the expense of significant energy inputs and carbon emissions, leading to a consequence for economic sustainability. Reducing energy usage and carbon emissions can improve the quality of economic development, but regional differences exist in this promotion effect [71].
4.3.2. Obstacle Factor Analysis of Subsystem Development
The sustainable development of the manufacturing sector is associated with economic benefits, employment, energy, water, and carbon emissions. Therefore, all five aspects affect the sustainable development of the manufacturing sector. The obstacle degree model is utilized to further study the impediments that impact and limit the coordinated development of the manufacturing sector. Figure 8 illustrates the cumulative impact of each factor on the development of subsystems from 2003 to 2020. Figure 8 illustrates that different provinces (cities) need to implement distinct measures to enhance the development level of their subsystems. In Figure 8, the x-axis represents 23 secondary indicators, indicating obstruction factor, while the y-axis represents the obstacle index of different indicators to the subsystem from 2003 to 2020.

Figure 8.
Cumulative obstacle index of 30 provinces regarding subsystems.
Specifically, the high-frequency obstacle factors in the economic system include industrial value added (x1), main business income (x4), and total profit (x5). This indicates that x1, x4, and x5 are the most common factors affecting the economic system. In the future, China should develop into a strong manufacturing country, increasing the main income and profits of manufacturing businesses and driving the high-quality growth of the manufacturing sector. In all provinces (cities), the obstacles in the economic system are consistent, and the ranking position among the factors is similar. This means that each province and city can strengthen interconnection and jointly eliminate the restrictive effects of obstacle factors. The higher-frequency obstacle factors in the employment system are the number of employees in the manufacturing sector (x7), total wages (x9), and average wages (x10), which show that more job positions need to be created in the development of the manufacturing industry and the wages of employed people need to be steadily increased. The high-frequency obstacle factors in the energy system are the total energy consumption (x13) and the per capita industrial energy consumption (x15), indicating the need to save energy and enhance energy usage efficiency in the development of the manufacturing sector, signaling the imperative to conserve energy and enhance energy usage efficiency in the advancement of the manufacturing industry. In Anhui, Fujian, Jiangxi, Hunan, Guangxi, and other provinces, the proportion of coal consumption (x16) is also a major constraint on the energy system. In the future, reducing the proportion of coal consumption and increasing the usage rate of renewable energy will be necessary. The water consumption per unit of industrial added value in provinces (cities) such as Heilongjiang, Guangxi, Chongqing, Guizhou, and Yunnan is the main obstacle factor, indicating that the manufacturing water use efficiency in these provinces and cities is relatively low. In Hebei, Jiangsu, Zhejiang, Shandong, Henan, and other manufacturing provinces, the total carbon emissions restrict the development of the carbon system. However, in areas with relatively backward manufacturing development, such as Hainan, Guizhou, Yunnan, and Gansu, the intensity of carbon emissions has become a major obstacle, even though the total carbon emissions are not large. These regions need to increase investment in innovation, introduce and develop new technologies, and improve carbon emission efficiency.
4.4. Coordinated Trends in Different Scenarios
Assuming that all subsystems hold equal importance, the increasing evaluation value of the economic system in most provinces (cities) serves as the main factor in promoting the CCD. In contrast, in some provinces (cities), the evaluation values of the energy and carbon emissions systems have inhibitory effects. However, in reality, the contribution of subsystems to the coordinated development of manufacturing is unlikely to be equal. The contribution coefficient of subjective definition may lead to an inaccurate assessment of the CCD, so it is crucial to analyze the impact of changes in the contribution coefficients of subsystems on the CCD. Based on different development goals, this article simulates changes in CCD in six scenarios. The coefficients of the baseline scenario are set to . The economic-led scenario () is the variation in the coupled coordination level when the economic benefits of manufacturing are emphasized. The employment-led scenario () emphasizes the stable development of society. The energy-led scenario () emphasizes energy security. The water-oriented scenario () underlines water security issues. The carbon emission-dominant scenario () emphasizes climate issues.
Table A2 clearly demonstrates that in comparison to the baseline scenario, the CCD led by economic and employment scenarios in most provinces (cities) decreased significantly, with average growth rates of −10.55% and −12.69%. The CCD led by energy, water, and carbon scenarios increased significantly in most provinces (cities). The CCD under the water resource-led scenario was the highest, with a mean growth rate of 9.90%. The cause is that the comprehensive coordination levels led by economic and employment scenarios are low. In contrast, the comprehensive coordination index led by energy, water, and carbon scenarios is high. The growth of China’s manufacturing industry should prioritize not only economic and social benefits but also address energy security, water security, and carbon emissions in order to accomplish sustainable development goals.
Table A2 shows that in Guangdong and Jiangsu, two developed manufacturing provinces, the CCD led by the employment scenario is higher than the baseline scenario. The coupling coordination level led by the carbon scenario in Jiangsu, Zhejiang, Shandong, and Guangdong is lower than the baseline scenario. This suggests that the development of subsystems relies on regional economic development and resource endowment conditions, which is also confirmed by the spatial distribution of subsystems’ development levels shown in Figure 4. The above analysis results indicate that the differences in the development level of subsystems significantly affect the focus of government policy adjustments. Policy adjustments can effectively improve the coupling coordination level of subsystems in regions with significant differences in the short term. As Dubey pointed out, institutional pressure plays a leading role in enhancing environmental performance and sustainable development capabilities in China’s environmental management [72].
5. Discussion
Economic effect is regarded as the core element of manufacturing development, but ignoring any one element of the economy, employment, energy, water, and carbon emissions can affect the sustainable development of the manufacturing industry. A comprehensive analysis of the evaluation value of subsystems and CCD shows that China’s manufacturing industry is in an important stage of transformation. From 2003 to 2013, the development of China’s manufacturing industry focused on economic benefits, even with serious waste of resources and ecological pollution. With the concept of high-quality and sustainable development, the government has proposed the corresponding development plans for the manufacturing industry. For example, the 14th Five-Year Plan and 2035 Vision Target Outline regarded the manufacturing industry as a vital component of the modern industrial system, pointing out the need to improve the competitive advantage of the manufacturing sector and further support the high-quality growth of this sector.
Although there are significant differences in CCD among the 30 provinces (cities), there has been an overall improvement in general. The CCD has significant spatial distribution characteristics. During the study period, the eastern region had the highest level of coupling coordination, which is consistent with the results of previous studies [45,73]. Guangdong leads the way in promoting the sustainable development of the manufacturing industry, ranking first nationwide in terms of both economic and social benefits. Following reform and opening up, Guangdong has emerged as a gateway for the introduction of the Western economy and technology. Jiangsu, the origin of modern domestic industry, has consistently played a crucial role in economic growth. To hasten the creation of a sophisticated manufacturing hub that can compete globally, the province is aggressively advancing its strategic emerging and high-tech sectors. As the nation’s capital, Beijing is superior in its efforts to combat pollution and promote energy efficiency. The CCD in the northeastern region peaked in 2013. It began to decline after that, which may have been caused by the industrial transfer from the northeastern to the central and western regions of the country and the restructuring of industries under the new normal [74,75]. Compared with the other three regions, the CCD in the western region needs to be further improved. The possible cause is the different impact of regional development strategies on policy support and resource utilization in the later period [76].
In certain provinces like Shandong, Xinjiang, and Inner Mongolia, the growth of manufacturing, accompanied by excessive energy consumption and carbon emissions, has resulted in a decrease in the comprehensive coordination index among subsystems. Xinjiang boasts abundant natural resources. At present, the petroleum refining industry serves as the cornerstone of Xinjiang’s economy; nonetheless, it is characterized by high energy consumption and significant environmental pollution. Consequently, there is an imperative to refine the industrial and product mix, to lengthen the value chain of the petroleum sector, to elevate the proportion of refined petroleum products and downstream derivatives, to diversify the portfolio of resource-extraction products, to augment the added value of products, and to realize the optimized and efficient utilization of resources. This can be achieved through the intensification of upstream exploration and downstream processing capabilities, the adoption of advanced refining technologies, and the implementation of sustainable development practices to mitigate environmental impacts. Currently, the manufacturing sector in Inner Mongolia has yet to establish a cohesive industrial ecosystem that aligns with advancements in technological innovation, modern financial services, and human capital development. The industrial distribution is characterized by decentralization and agglomeration economies. The region faces challenges such as insufficient capacity for innovation support, a sluggish transition in manufacturing, delayed industrial progression, and a slow pace of adoption in emerging sectors. Additionally, there is a notable deficit in R&D investment, a lack of integrated supply chain networks, and a deficiency in high-skilled labor to drive industrial upgrading and transformation.
Previous evaluations of the high-quality development of the manufacturing sector primarily focused on the results, not the analysis of the evaluation process [77,78]. The countermeasures for the coordinated development of manufacturing should not only regulate the economy but also contain such factors as employment, energy, water, and carbon emissions, as well as the state of the composite system composed of these aspects. This gives us a solid base for making scientific and reasonable plans for the coordinated development of the manufacturing industry. Decomposition analysis and obstacle index analysis are carried out to calculate the limiting effect of each indicator on the development level of different provincial subsystems and formulate targeted strategies to optimize the development of each subsystem. The five-step evaluation model in this article is a further extension of the traditional evaluation method of the manufacturing industry. The evaluation method of coordinated development of manufacturing proposed in this study not only provides a global perspective on the sustainable development of manufacturing but also provides a clearer understanding of the state of the subsystems that affect the coordinated development of manufacturing. There are quantitative evaluation methods for the coordinated development of the manufacturing industry in this study.
6. Conclusions and Policy Implications
This article considers the coordination of economic benefits, social benefits, resource consumption, and carbon emission reduction goals in the sustainable development of the manufacturing industry. Through the GIS–CRITIC–entropy–TOPSIS–CCDM method, the coordination level of the manufacturing industry under the goal of economy–society–resources–environment was measured. The CCDM and LMDI methods are combined to decompose the influencing factors of CCD from the perspective of mechanism and composition. Furthermore, considering that the government plays a vital role in the economy, employment, energy conservation, and carbon reduction, the role of change in government priority with respect to the CCD is analyzed by adjusting the model parameters. The five-step model constructed in this study can comprehensively evaluate the development level of the manufacturing industry and make up for the deficiencies of the existing research in analyzing the evaluation process. The primary findings can be summarized as follows.
- (1)
- On the whole, the evaluation value of the economy and employment system is consistently increasing and presents the spatial characteristics of highest in the east and lowest in the west. The evaluation values of energy and carbon emissions have decreased, indicating a trend of high levels in the central areas and low levels in the east and west.
- (2)
- The overall coordination development level of the manufacturing industry in 30 provinces (cities) is at a primary coordinated level. Provinces exhibit variations in CCD due to disparities in economic development and resource allocation across different regions. While the majority of provinces have already achieved primary coordination, Qinghai and Xinjiang still require improvements in their CCD.
- (3)
- The LMDI decomposition results show that compared with the comprehensive coordination index, the coupling degree of the subsystem is the key to improving the level of coupling coordination. The evaluation values of economy, employment, and water have a positive impact on the coupling coordination level of most provinces.
- (4)
- Compared with the economy and employment, the CCD led by energy, water, and carbon is higher. This indicates that while advocating the sustainable development of the manufacturing industry, it is imperative to increase economic and social benefits, but it should not be at the expense of energy and water security or carbon emissions.
According to the research findings, some recommendations are suggested, as follows.
- (1)
- Strengthen the capacity for income distribution policy reform and enhance the employment attraction of the manufacturing industry. Economic and employment evaluations have a positive impact on the CCD. This is due to the rapid expansion of China’s manufacturing sector, which in turn increases the demand for workers. Therefore, it is necessary to improve the employment environment of workers in manufacturing enterprises, raise the wages of front-line workers, and boost the attractiveness of the manufacturing industry among the younger generation. It is essential to elevate residents’ labor income levels. Concurrently, regulate the income distribution process, establish a mechanism for tracking personal income and assets, and strengthen the safeguarding of citizens’ lawful property rights and interests.
- (2)
- Enhancing and enforcing legislation and benchmarks related to energy efficiency and carbon emissions is essential to preserve the ecological environment through robust institutional frameworks. The CCD is negatively impacted by the evaluation values of energy and carbon systems, indicating that the growth of manufacturing at the expense of significant energy inputs and carbon emissions has resulted in a decrease in economic sustainability. Develop and enforce public policies aimed at fostering environmental conservation, and encourage governmental agencies, manufacturing firms, and individuals to engage proactively in environmental protection efforts through these policies. It is necessary to actively develop clean energy technologies, to strengthen research and development in energy conservation and emission reduction technologies, and to utilize advanced emission reduction technologies to improve energy efficiency. We aim to enhance the development of environmental infrastructure, offer environmental public services, boost the availability of superior ecological products, and fulfill the public’s needs for high-quality ecological offerings.
- (3)
- Promote the growth of regionally advantageous industrial clusters and explore differentiated regional development strategies. The research results indicate that the evaluation values of subsystems in different regions have varying effects on the CCD. Consequently, different provinces or cities should implement different measures to improve the development level of their respective subsystems. Therefore, emphasizing advantageous industries is crucial for the sustainable development of the regional manufacturing industry. The eastern coastal areas should actively play a radiation-driven and diffusion-driven role. The central provinces (cities) should continue to open up domestically and internationally, gradually establishing a comprehensive, multi-layered, and extensive opening pattern. They should develop inland open economic zones and expedite the realization of the Central Plains’ rise. The western regions should accelerate the formation of a modern industrial layout and develop new business formats and tools like cloud computing, big data, and artificial intelligence. The northeastern regions should accelerate the process of upgrading and transforming the declining industries within the old industrial bases and increase investment in innovation to realize the transition from old to new driving forces in the manufacturing industry.
- (4)
- Strengthen regional cooperation to promote the spatial balance of sustainable development in the manufacturing industry. Significant disparities exist in the evaluation values of the subsystems and CCD across the four regions. There are significant disparities in the evaluation values of the subsystems and CCD of the four regions. It is essential to eliminate institutional barriers that impede the flow of production factors, get rid of barriers to regional markets, facilitate the mobility of innovation-driven elements and resources within the manufacturing sector, and enhance the efficiency of production factor allocation across various regions. Develop a regional transmission mechanism that facilitates the sustainable development of the manufacturing sector across the eastern coastal regions and their central and western counterparts, delve into collaborative and developmental frameworks between different regions, and foster the collective advancement of both prosperous and less developed areas.
Although this study provides sufficient guidance for the sustainable development of the manufacturing industry, it also has limitations that require further research. Firstly, owing to data-gathering limitations, the sample period of this study spans from 2003 to 2020. Had there been further data, this study would have produced more robust results. Secondly, the evaluation index system of the coordinated development of the manufacturing industry does not include the degree of openness, the level of innovation, or other process indicators, so the impact of opening up and technological innovation on the coordinated development of the manufacturing industry should be considered in the future. Thirdly, the study shows the interaction of subsystems (economic, social, environmental), but does not deeply analyze how these interactions evolve over time or how external shocks (like economic crises and environmental events) might affect them. We will consider studying these topics in the future.
Author Contributions
Conceptualization, Y.H.; methodology, J.Y.; software, Y.H.; validation, J.Y.; formal analysis, J.Y.; investigation, X.L.; resources, J.Y.; data curation, Y.H.; writing—original draft preparation, J.Y.; writing—review and editing, T.W., M.Z. and X.L.; visualization, J.Y.; supervision, T.W., M.Z. and X.L.; project administration, T.W.; funding acquisition, T.W., Y.H. and J.Y. All authors have read and agreed to the published version of the manuscript.
Funding
This research was financially supported by National Natural Science Foundation of China (grant 72464007), the National Natural Science Foundation of China (grant 72104062), the Humanities and Social Science Research Youth Fund project of the Ministry of Education (grant (21YJC630041), and a Guizhou Provincial Department of Education Fund Project (grant YJSKYJJ (2021) 017).
Data Availability Statement
Data will be made available on request.
Conflicts of Interest
The authors declare no conflicts of interest.
Appendix A
Table A1.
Conversion factors from physical units to coal equivalent and carbon emission factor.
Table A1.
Conversion factors from physical units to coal equivalent and carbon emission factor.
| Energy Type | Conversion Factor (tec/t) | Carbon Emission Coefficient | Energy Type | Conversion Factor (tec/t) | Carbon Emission Coefficient |
|---|---|---|---|---|---|
| Raw Coal | 0.7143 | 1.900 (CO2/t) | Diesel Oil | 1.4571 | 3.096 (CO2/t) |
| Coke | 0.9714 | 2.860 (CO2/t) | Fuel Oil | 1.4286 | 3.17 (CO2/t) |
| Crude Oil | 1.4286 | 3.020 (CO2/t) | Natural Gas | 1.3300 | 1.790 (CO2/m3) |
| Gasoline | 1.4714 | 2.925 (CO2/t) | Electricity | 0.123 | 2.213 (kw·h) |
| Kerosene | 1.4714 | 3.018 (CO2/t) |
Table A2.
Coupling coordination degree under six scenarios.
Table A2.
Coupling coordination degree under six scenarios.
| Region | Coupling Degree | Coupling Coordination Degree | |||||
|---|---|---|---|---|---|---|---|
| Base Scenario | Economy-Led Scenario | Employment-Led Scenario | Energy-Led Scenario | Water-Led Scenario | Carbon-Led Scenario | ||
| Beijing | 0.8101 | 0.7363 | 0.6328 | 0.6465 | 0.7891 | 0.8008 | 0.7926 |
| Tianjin | 0.8201 | 0.7014 | 0.6161 | 0.6074 | 0.7399 | 0.7823 | 0.7426 |
| Hebei | 0.8310 | 0.6892 | 0.6181 | 0.5930 | 0.7350 | 0.7702 | 0.7126 |
| Shanxi | 0.7682 | 0.6640 | 0.5795 | 0.5615 | 0.7239 | 0.7442 | 0.6897 |
| Inner Mongolia | 0.7859 | 0.6107 | 0.5462 | 0.5255 | 0.6681 | 0.7184 | 0.5726 |
| Liaoning | 0.8107 | 0.6807 | 0.5970 | 0.5869 | 0.7261 | 0.7611 | 0.7138 |
| Jilin | 0.7266 | 0.6717 | 0.5660 | 0.5713 | 0.7310 | 0.7383 | 0.7277 |
| Heilongjiang | 0.6773 | 0.6326 | 0.5255 | 0.5332 | 0.6939 | 0.6962 | 0.6886 |
| Shanghai | 0.9066 | 0.7654 | 0.7005 | 0.6849 | 0.8146 | 0.8051 | 0.8111 |
| Jiangsu | 0.9828 | 0.7612 | 0.8122 | 0.7525 | 0.7622 | 0.7334 | 0.7431 |
| Zhejiang | 0.9640 | 0.7876 | 0.7734 | 0.7285 | 0.8094 | 0.8450 | 0.7769 |
| Anhui | 0.8537 | 0.7092 | 0.6391 | 0.6156 | 0.7725 | 0.7487 | 0.7549 |
| Fujian | 0.8996 | 0.7600 | 0.7174 | 0.6651 | 0.8057 | 0.8123 | 0.7885 |
| Jiangxi | 0.8186 | 0.7112 | 0.6340 | 0.6082 | 0.7760 | 0.7597 | 0.7601 |
| Shandong | 0.9434 | 0.7217 | 0.7075 | 0.6634 | 0.7246 | 0.8054 | 0.6999 |
| Henan | 0.8853 | 0.7456 | 0.6855 | 0.6539 | 0.7915 | 0.8044 | 0.7803 |
| Hubei | 0.8594 | 0.7259 | 0.6647 | 0.6270 | 0.7887 | 0.7625 | 0.7723 |
| Hunan | 0.8326 | 0.7223 | 0.6496 | 0.6195 | 0.7847 | 0.7659 | 0.7747 |
| Guangdong | 0.9918 | 0.8632 | 0.8811 | 0.8782 | 0.8593 | 0.8704 | 0.8258 |
| Guangxi | 0.7268 | 0.6525 | 0.5531 | 0.5518 | 0.7248 | 0.7120 | 0.6970 |
| Hainan | 0.6174 | 0.5809 | 0.4731 | 0.4917 | 0.6075 | 0.6610 | 0.6449 |
| Chongqing | 0.7988 | 0.6810 | 0.5988 | 0.5823 | 0.7031 | 0.7581 | 0.7429 |
| Sichuan | 0.8717 | 0.6970 | 0.6442 | 0.6095 | 0.6897 | 0.7807 | 0.7465 |
| Guizhou | 0.7334 | 0.6683 | 0.5677 | 0.5660 | 0.7383 | 0.7328 | 0.7130 |
| Yunnan | 0.7366 | 0.6612 | 0.5629 | 0.5599 | 0.7286 | 0.7318 | 0.6992 |
| Shaanxi | 0.8103 | 0.6959 | 0.6198 | 0.5934 | 0.7375 | 0.7734 | 0.7369 |
| Gansu | 0.6733 | 0.6245 | 0.5178 | 0.5275 | 0.6944 | 0.6998 | 0.6574 |
| Qinghai | 0.7231 | 0.5850 | 0.4930 | 0.5010 | 0.6191 | 0.6913 | 0.5965 |
| Ningxia | 0.7393 | 0.6046 | 0.5176 | 0.5159 | 0.6660 | 0.7051 | 0.5941 |
| Xinjiang | 0.7645 | 0.5880 | 0.5064 | 0.5072 | 0.6140 | 0.7016 | 0.5881 |
References
- China. 2024. Available online: https://www.163.com/dy/article/J6B37IEL051492T3.html (accessed on 16 January 2025).
- Wang, H.; Li, B. Environmental regulations, capacity utilization, and high-quality development of manufacturing: An analysis based on Chinese provincial panel data. Sci. Rep. 2021, 11, 19566. [Google Scholar] [CrossRef]
- China. The 14th Five-Year Plan for National Economic and Social Development of the People’s Republic of China and the Outline of the Long-Range Goals for 2035. 2021. Available online: https://www.gov.cn/xinwen/2021-03/13/content_5592681.htm (accessed on 16 January 2025).
- Lin, C.; Qiao, W. Statistical Measurements and Club Effects of High-Quality Development in Chinese Manufacturing. Int. J. Environ. Res. Public Health 2022, 19, 16228. [Google Scholar] [CrossRef] [PubMed]
- Wang, H.; Cao, W.; Wang, F. Digital Transformation and Manufacturing Firm Performance: Evidence from China. Sustainability 2022, 14, 10212. [Google Scholar] [CrossRef]
- Chen, S.; Yu, L.; Zhang, C.; Wu, F.; Li, T. Environmental impact assessment of multi-source solid waste based on a life cycle assessment, principal component analysis, and random forest algorithm. J. Environ. Manag. 2023, 339, 117942. [Google Scholar] [CrossRef]
- Rehman, N.U.; Nunziante, G. The effect of the digital economy on total factor productivity in European regions. Telecommun. Policy 2023, 47, 102650. [Google Scholar] [CrossRef]
- Cook, D.; Davíðsdóttir, B. An appraisal of interlinkages between macro-economic indicators of economic well-being and the sustainable development goals. Ecol. Econ. 2021, 184, 106996. [Google Scholar] [CrossRef]
- Huang, Y.; Chen, Z.; Yin, S. Spatial spillover effects of the digital economy on the green total factor productivity of China’s manufacturing industry. Environ. Impact Assess. Rev. 2024, 6, 065006. [Google Scholar] [CrossRef]
- Kuosmanen, N.; Maczulskij, T. Going green while getting lean: Decomposing carbon and green total factor productivity. J. Environ. Manag. 2024, 352, 120046. [Google Scholar] [CrossRef]
- Sun, K.; Han, J.; Wu, Q.; Xie, W.; He, W.; Yang, Z.; Wang, Y.; Liu, J.; Shi, E. The coupling coordination and spatiotemporal evolution of industrial water-energy-CO2 in the Yellow River Basin. Sci. Total Environ. 2024, 912, 169012. [Google Scholar] [CrossRef] [PubMed]
- Gonella, J.D.L.; Godinho, M.; Ganga, G.M.D.; Lizarelli, F.L. From awareness to action: Understanding the relationship between circular economy and favourable evaluation towards sustainable development. Bus. Strategy Environ. 2024, 33, 8679–8694. [Google Scholar] [CrossRef]
- Mackay, B.R.; Shaker, R.R. A Megacities Review: Comparing Indicator-Based Evaluations ofSustainable Development and Urban Resilience. Sustainability 2024, 16, 8067. [Google Scholar] [CrossRef]
- Zhang, J.; Hou, Y.; Liu, P.; He, J.; Zhuo, X. The goal requirements and strategic path of high-quality development. J. Manag. World 2019, 35, 1–7. [Google Scholar]
- Mansour, F.; Al-Hindi, M.; Yasine, A.; Najjar, E. Multi-criteria approach for the selection of water, energy, food nexus assessment tools and a case study application. J. Environ. Manag. 2022, 322, 116139. [Google Scholar] [CrossRef] [PubMed]
- Mhana, K.; Awad, H. An ideal location selection of electric vehicle charging stations: Employment of integrated analytical hierarchy process with geographical information system. Sustain. Cities Soc. 2024, 107, 105456. [Google Scholar] [CrossRef]
- Yang, Z.; Tuo, Y.; Yang, J.; Wu, Y.; Gong, Z.; Feng, G. Integrated prediction of summer precipitation in China based on multi dynamic-statistic methods. Chin. J. Geophys.-Chin. Ed. 2024, 67, 982–996. [Google Scholar]
- Sun, Y.; Zhao, T.; Xia, L. Spatial-temporal differentiation of carbon efficiency and coupling coordination degree of Chinese county territory and obstacles analysis. Sustain. Cities Soc. 2022, 76, 103429. [Google Scholar] [CrossRef]
- Song, Q.; Wang, Z.; Wu, T. Risk analysis and assessment of water resource carrying capacity based on weighted gray model with improved entropy weighting method in the central plains region of China. Ecol. Indic. 2024, 160, 111907. [Google Scholar] [CrossRef]
- Cheba, K.; Bak, I.; Szopik-Depczynska, K.; loppolo, G. Directions of green transformation of the European Union countries. Ecol. Indic. 2022, 136, 108601. [Google Scholar] [CrossRef]
- Mathew, M.; Chakrabortty, R.; Ryan, M. Selection of an Optimal Maintenance Strategy Under Uncertain Conditions: An Interval Type-2 Fuzzy AHP-TOPSIS Method. IEEE Trans. Eng. Manag. 2022, 69, 1121–1134. [Google Scholar] [CrossRef]
- Boori, M.; Choudhary, K.; Paringer, R.; Kupriyanov, A. Spatiotemporal ecological vulnerability analysis with statistical correlation based on satellite remote sensing in Samara, Russia. J. Environ. Manag. 2021, 285, 112138. [Google Scholar] [CrossRef]
- Zhang, Y.; Zhu, T.; Guo, H.; Yang, X. Analysis of the coupling coordination degree of the Society-Economy-Resource-Environment system in urban areas: Case study of the Jingjinji urban agglomeration, China. Ecol. Indic. 2023, 146, 109851. [Google Scholar] [CrossRef]
- Wu, X.; Hao, C.; Li, Y.; Ge, C.; Duan, X.; Ren, J.; Han, C. Spatio-temporal coupling coordination analysis between localgovernments’ environmental performance and listed companies’ ESG performance. Environ. Impact Assess. Rev. 2025, 110, 107655. [Google Scholar] [CrossRef]
- Caglar, M.; Nisel, S. Efficiency measurement of fintech companies: A two-stage DEA approach. Electron. Commer. Res. 2024, 24, 1335–1366. [Google Scholar] [CrossRef]
- Wang, L.; Shao, J. Can Digitalization Improve the High-quality Development of Manufacturing? An Analysis Based on Chinese Provincial Panel Data. J. Knowl. Econ. 2023, 15, 2010–2036. [Google Scholar] [CrossRef]
- Wang, S.; Xue, Z. How Does the Digital Economy Empower the High-Quality Development of Manufacturing Industry?—Based on the Test of Mediation Effect and Threshold Effect. J. Knowl. Econ. 2024. [Google Scholar] [CrossRef]
- Dou, Z.; Wu, B.; Sun, Y.; Wang, T. The Competitiveness of Manufacturing and Its Driving Factors: A Case Study of G20 Participating Countries. Sustainability 2021, 13, 1143. [Google Scholar] [CrossRef]
- Shen, Q.; Zhu, J.; Qi, M.; Tao, X. Can environmental, social, and governance performance improve the high-quality development of equipment manufacturing companies? Transform. Bus. Econ. 2023, 22, 625–652. [Google Scholar]
- Zhong, J.; Tang, Y. Empirical Analysis of R&D Investment, Industrial Structure Transformation and Development of High-tech Industry in Guangdong Province—Based on Time Series Data from 2003–2018. IOP Conf. Ser. Earth Environ. Sci. 2019, 358, 032048. [Google Scholar]
- Hu, J.; Xue, H.; Yu, Z. Study on the Effect of R&D Investment on Technical progress of Manufacture in China. J. Knowl. Econ. 2023, 15, 9899. [Google Scholar]
- Wang, L.; Wang, Z.; Ma, Y. Does environmental regulation promote the high-quality development of manufacturing? A quasi-natural experiment based on China’s carbon emission trading pilot scheme. Socio-Econ. Plan. Sci. 2022, 81, 101216. [Google Scholar] [CrossRef]
- Han, D. The Growth of Service Sectors, Institutional Environment and Quality Development in China’s Manufacturing. Systems 2023, 11, 128. [Google Scholar] [CrossRef]
- Liu, Y.; He, Z. Synergistic industrial agglomeration, new quality productive forces andhigh-quality development of the manufacturing industry. Int. Rev. Econ. Financ. 2024, 94, 103373. [Google Scholar] [CrossRef]
- Wang, M.; Zhang, M.; Chen, H.; Yu, D. How Does Digital Economy Promote the Geographical Agglomeration of Manufacturing Industry? Sustainability 2023, 15, 1727. [Google Scholar] [CrossRef]
- Guo, Q.; Su, Z. The Application of Industrial Robot and the High-Quality Development of Manufacturing Industry: From a Sustainability Perspective. Sustainability 2023, 15, 12621. [Google Scholar] [CrossRef]
- Zhang, Z.; Shi, K.; Tang, L.; Su, K.; Zhu, Z.; Yang, Q. Exploring the spatiotemporal evolution and coordination of agricultural green efficiency and food security in China using ESTDA and CCD models. J. Clean. Prod. 2022, 374, 133976. [Google Scholar] [CrossRef]
- Guan, X.; Wei, H.; Lu, S.; Su, H. Mismatch distribution of population and industry in China: Pattern, problems and driving factors. Appl. Geogr. 2018, 97, 61–74. [Google Scholar] [CrossRef]
- Duan, H.; Sun, X.; Song, J.; Xing, J.; Yang, W. Peaking carbon emissions under a coupled socioeconomic-energy system: Evidence from typical developed countries. Resour. Constr. Recycl. 2022, 187, 106641. [Google Scholar] [CrossRef]
- Zhang, X. Theory of Sustainable Development:Concept Evolution, Dimension and Prospect. Bull. Chin. Acad. Sci. 2018, 33, 10–19. [Google Scholar]
- Sun, X.; Shao, H.; Liang, S.; Zhou, Y.; Dai, X.; Liu, M.; Tao, R.; Guo, Z.; Xin, Q. Tracking sustainable development in mining towns: A novel framework integrating socioeconomic and eco-environmental perspectives through coupling coordination degree. Environ. Impact Assess. Rev. 2024, 109, 107641. [Google Scholar] [CrossRef]
- Lin, Y.; Chen, P.; Zhang, M. Conflict or synergy? Analysis of economic-social- infrastructure-ecological resilience and their coupling coordination in the Yangtze River economic Belt, China. Ecol. Indic. 2022, 142, 109194. [Google Scholar] [CrossRef]
- Su, Y. Research on the Evaluation of High-quality Development of Manufacturing Industry in the Central Region of China: Analysis based on the Data from 2007 to 2018. Econ. Probl. 2020, 9, 85–91. [Google Scholar]
- Han, Z.; Liu, Y.; Guo, X.; Xu, J. Regional differences of high-quality development level for manufacturing industry in China. Math. Biosci. Eng. 2022, 19, 4368–4395. [Google Scholar] [CrossRef]
- Su, Y.; Shi, J.; Zhang, M. Research on the Construction and Measurement of the HQDMI Evaluation Index System—A Case Study of China. Sustainability 2022, 14, 15364. [Google Scholar] [CrossRef]
- Zhang, C.; Zhao, L.; Song, X.; Zhang, Q.; Zhang, X. Spatial-temporal coupling characteristics and interaction effects of 78 cities in the Yellow River Basineconomic resilience and people’s livelihoods and well-being: An analysis of 78 cities in the Yellow River Basin. Sustain. Cities Soc. 2024, 112, 105638. [Google Scholar] [CrossRef]
- Wang, Y.; Song, J.; Sun, H. Coupling interactions and spatial equilibrium analysis of water-energy-food in the Yellow River Basin, China. Sustain. Cities Soc. 2023, 88, 104293. [Google Scholar] [CrossRef]
- Zhang, X.; Jie, X.; Ning, S.; Wang, K.; Li, X. Coupling and coordinated development of urban land use economic efficiency and green manufacturing systems in the Chengdu-Chongqing Economic Circle. Sustain. Cities Soc. 2022, 85, 104012. [Google Scholar] [CrossRef]
- Feng, M.; Chen, Y.; Duan, W.; Zhu, Z.; Wang, C.; Hu, Y. Water-energy-carbon emissions nexus analysis of crop production in the Tarim river basin, Northwest China. J. Clean. Prod. 2023, 396, 136566. [Google Scholar] [CrossRef]
- Zhang, J.; Dong, Z. Assessment of coupling coordination degree and water resources carrying capacity of Hebei Province (China) based on WRESP2D2P framework and GTWR approach. Sustain. Cities Soc. 2022, 82, 103862. [Google Scholar] [CrossRef]
- Jiang, J.; Zhu, S.; Wang, W.; Li, Y.; Li, N. Coupling coordination between new urbanisation and carbon emissions in China. Sci. Total Environ. 2022, 850, 158076. [Google Scholar] [CrossRef]
- Shen, L.; Huang, Y.; Huang, Z.; Lou, Y.; Ye, G.; Wong, S. Improved coupling analysis on the coordination between socio-economy and carbon emission. Ecol. Indic. 2018, 94, 357–366. [Google Scholar] [CrossRef]
- Diakoulaki, D.; Mavrotas, G.; Papayannakis, L. Determining objective weights in multiple criteria problems: The CRITIC method. Comput. Oper. Res. 1995, 22, 763–770. [Google Scholar] [CrossRef]
- Tao, C.; Chen, W.; Lin, L. An Empirical Analysis on the Synergy Degree of Industrial Organization Evolution in China:Taking the IT Industry in China under the Background of Enterprise Integration as an Example. J. Manag. World 2007, 12, 67–72. [Google Scholar]
- Wu, Z.; Guan, J.; He, J. An Empirical Study on the Calculation of Minimum Wage Standard-Dynamic Combination Calculation Based on Objective Weight of CRITIC-Entropy Weight Method. Mod. Econ. Sci. 2019, 41, 103–117. [Google Scholar]
- Hooshangi, N.; Gharakhanlou, N.M.; Razin, S.R.G. Evaluation of potential sites in Iran to localize solar farms using a GIS-based Fermatean Fuzzy Topsis. J. Clean. Prod. 2023, 384, 135481. [Google Scholar] [CrossRef]
- Zhang, Q.; Tang, X.; Xiao, Y.; Xiang, X.; Huang, H. Coordination of industrial structure and eco-efficiency in ecologically fragile areas: A case study of the Loess Plateau, China. J. Environ. Manag. 2023, 331, 117237. [Google Scholar] [CrossRef] [PubMed]
- Tang, F.; Wang, L.; Guo, Y.; Fu, M.; Huang, N.; Duan, W.; Luo, M.; Zhang, J.; Li, W.; Song, W. Spatio-temporal variation and coupling coordination relationship between urbanisation and habitat quality in the Grand Canal, China. Land Use Policy 2022, 117, 106119. [Google Scholar] [CrossRef]
- Hou, M.; Cui, X.; Xie, Y.; Lu, W.; Xi, Z. Synergistic emission reduction effect of pollution and carbon in China’s agricultural sector: Regional differences, dominant factors, and their spatial-temporal heterogeneity. Environ. Impact Assess. Rev. 2024, 106, 107543. [Google Scholar] [CrossRef]
- Fan, X. Research on the coupling of ecological environment and socio-economic development in resource-based cities: Based on scenario simulation method. Sustain. Cities Soc. 2024, 114, 105810. [Google Scholar] [CrossRef]
- Ang, B. The LMDI approach to decomposition analysis: A practical guide. Energy Policy 2005, 33, 867–871. [Google Scholar] [CrossRef]
- Ang, B.; Liu, N. Negative-value problems of the logarithmic mean divisia index decomposition approach. Energy Policy 2007, 35, 739–742. [Google Scholar] [CrossRef]
- Raza, M.; Lin, B. The impact of the productive sectors on CO2 emissions in Pakistan. Environ. Impact Assess. Rev. 2025, 110, 107643. [Google Scholar] [CrossRef]
- Rivera-Niquepa, J.D.; Jesus, P.M.D.; Yusta, J.M. Trend-based multi-period decomposition and decoupling methodology for energy-related carbon dioxide emissions: A case study of Portugal. Util. Policy 2025, 93, 101863. [Google Scholar] [CrossRef]
- Zhang, J.; Yan, Z.; Bi, W.; Ni, P.; Lei, F.; Yao, S.; Lang, J. Prediction and scenario simulation of the carbon emissions of public buildings in the operation stage based on an energy audit in Xi’an, China. Energy Policy 2023, 173, 113396. [Google Scholar] [CrossRef]
- Xu, X.; Zhang, Z.; Long, T.; Sun, S.; Gao, J. Mega-city region sustainability assessment and obstacles identification with GIS-entropy—TOPSIS model: A case in Yangtze River Delta urban agglomeration, China. J. Clean. Prod. 2021, 294, 126147. [Google Scholar] [CrossRef]
- Bian, D.; Yang, X.; Xiang, W.; Sun, B.; Chen, Y.; Babuna, P.; Li, M.; Yuan, Z. A new model to evaluate water resource spatial equilibrium based on the game theory coupling weight method and the coupling coordination degree. J. Clean. Prod. 2022, 366, 132907. [Google Scholar] [CrossRef]
- Ji, Z.; Yu, W. Spatial differences and driving mechanism of industrial water use efficiency in China. J. Ind. Technol. Econ. 2022, 41, 86–93. [Google Scholar]
- Ye, B.; Jiang, J.; Li, C.; Miao, L.; Tang, J. Quantifification and driving force analysis of provincial-level carbon emissions in China. Appl. Energy 2017, 198, 223–238. [Google Scholar] [CrossRef]
- Ren, L.; Wang, W.; Wang, J.; Liu, R. Analysis of energy consumption and carbon emission during the urbanization of Shandong Province, China. J. Clean Prod. 2015, 103, 534–541. [Google Scholar] [CrossRef]
- Wang, Q.; Jiang, R. Is China’s economic growth decoupled from carbon emissions? J. Clean Prod. 2019, 225, 1195–1208. [Google Scholar] [CrossRef]
- Dubey, R.; Gunasekaran, A.; Ali, S. Exploring the relationship between leadership, operational practices, institutional pressures and environmental performance: A framework for green supply chain. Int. J. Prod. Econ. 2015, 160, 120–132. [Google Scholar] [CrossRef]
- Xue, R.; Zhang, J.; Liu, H.; Li, K.; Baron, C. How does outward foreign direct investment influence manufacturing industry sustainable growth in China? Appl. Econ. 2024, 56, 2752–2768. [Google Scholar] [CrossRef]
- Liu, H.; Wang, Y.; Ji, L. Characteristics, mechanism and pattern of inter-regional industrial transfers in China. Econ. Geogr. 2021, 34, 102–107. [Google Scholar]
- Li, F.; Xu, X.; Li, Z.; Du, P.; Ye, J. Can low-carbon technological innovation truly improve enterprise performance? The case of Chinese manufacturing companies. J. Clean Prod. 2021, 293, 125949. [Google Scholar] [CrossRef]
- Zhou, L.; Tian, L.; Gao, Y.; Ling, Y.; Fan, C.; Hou, D.; Shen, T. How did industrial land supply respond to transitions in state strategy? An analysis of prefecture-level cities in China from 2007 to 2016. Land Use Policy 2019, 87, 104009. [Google Scholar] [CrossRef]
- Xiang, L. Evaluation of the dynamics of manufacturing development and its high quality development level in western China. Stat. Decis. 2023, 39, 120–124. [Google Scholar]
- Zhang, L.; Zhu, N. Research on evaluation of high-quality development of manufacturing industry in central region of China based on entropy value method. J. Xiangtan Univ. (Philos. Soc. Sci.) 2022, 46, 46–51. [Google Scholar]
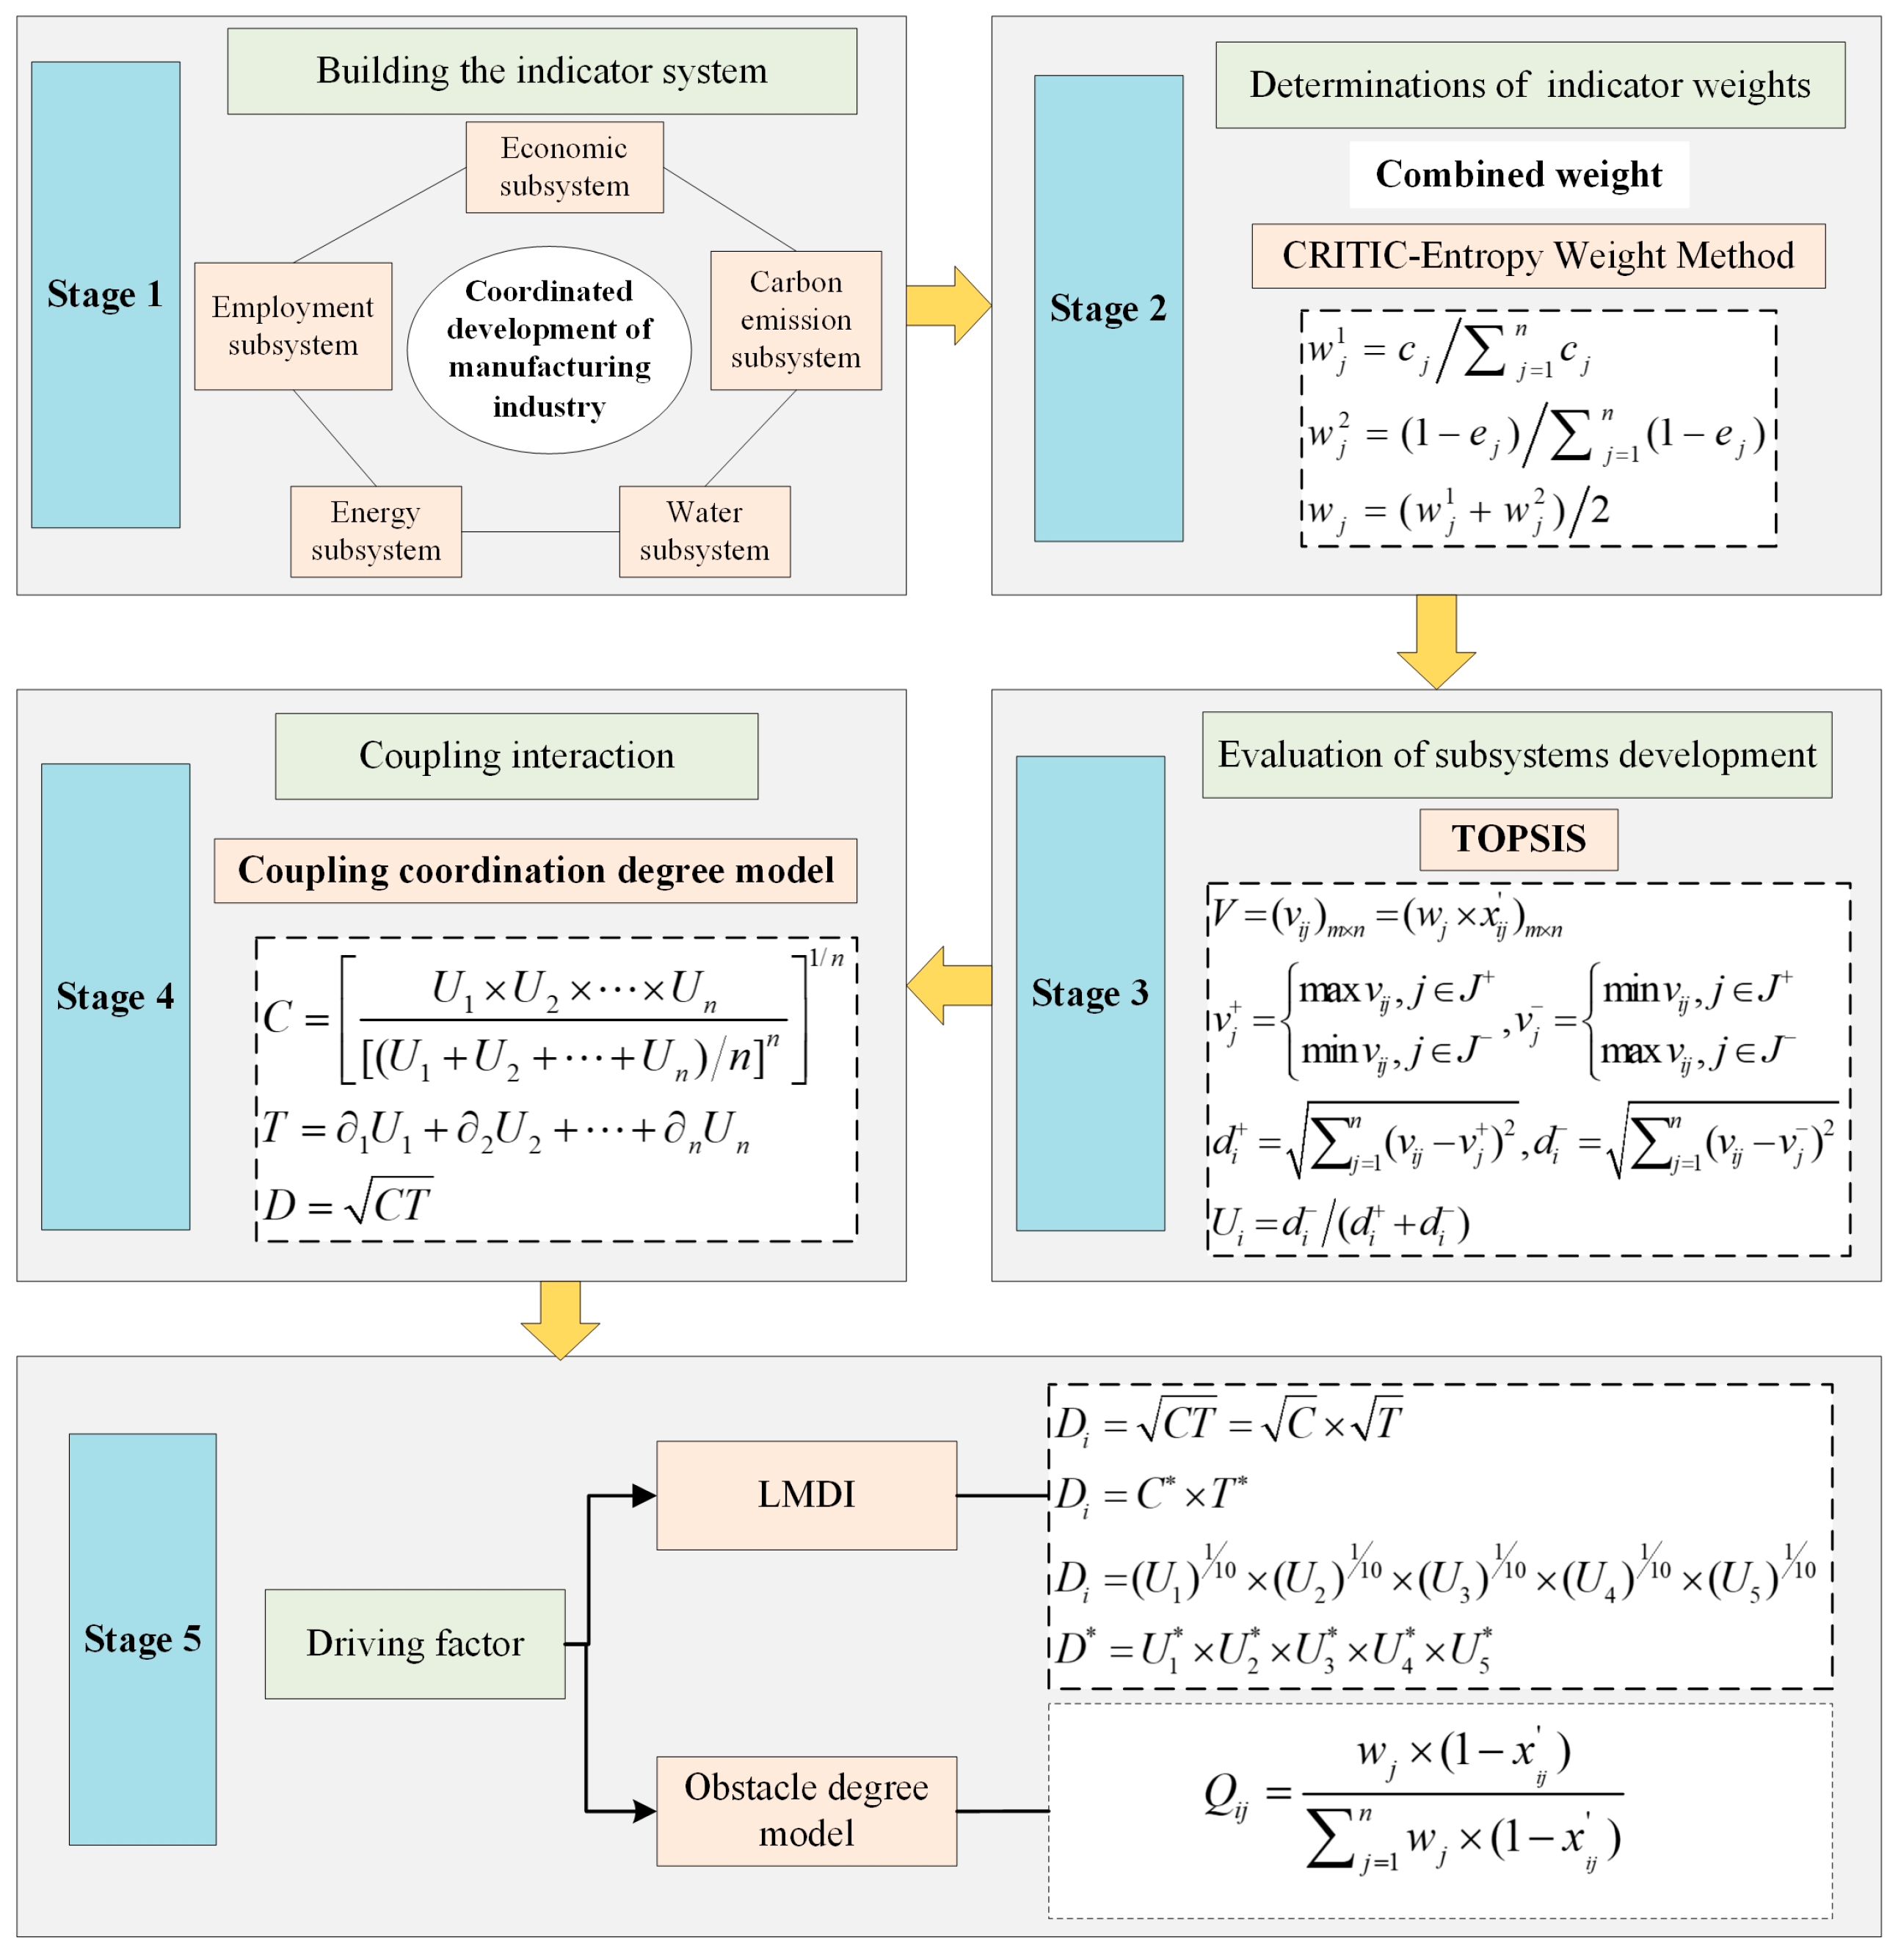
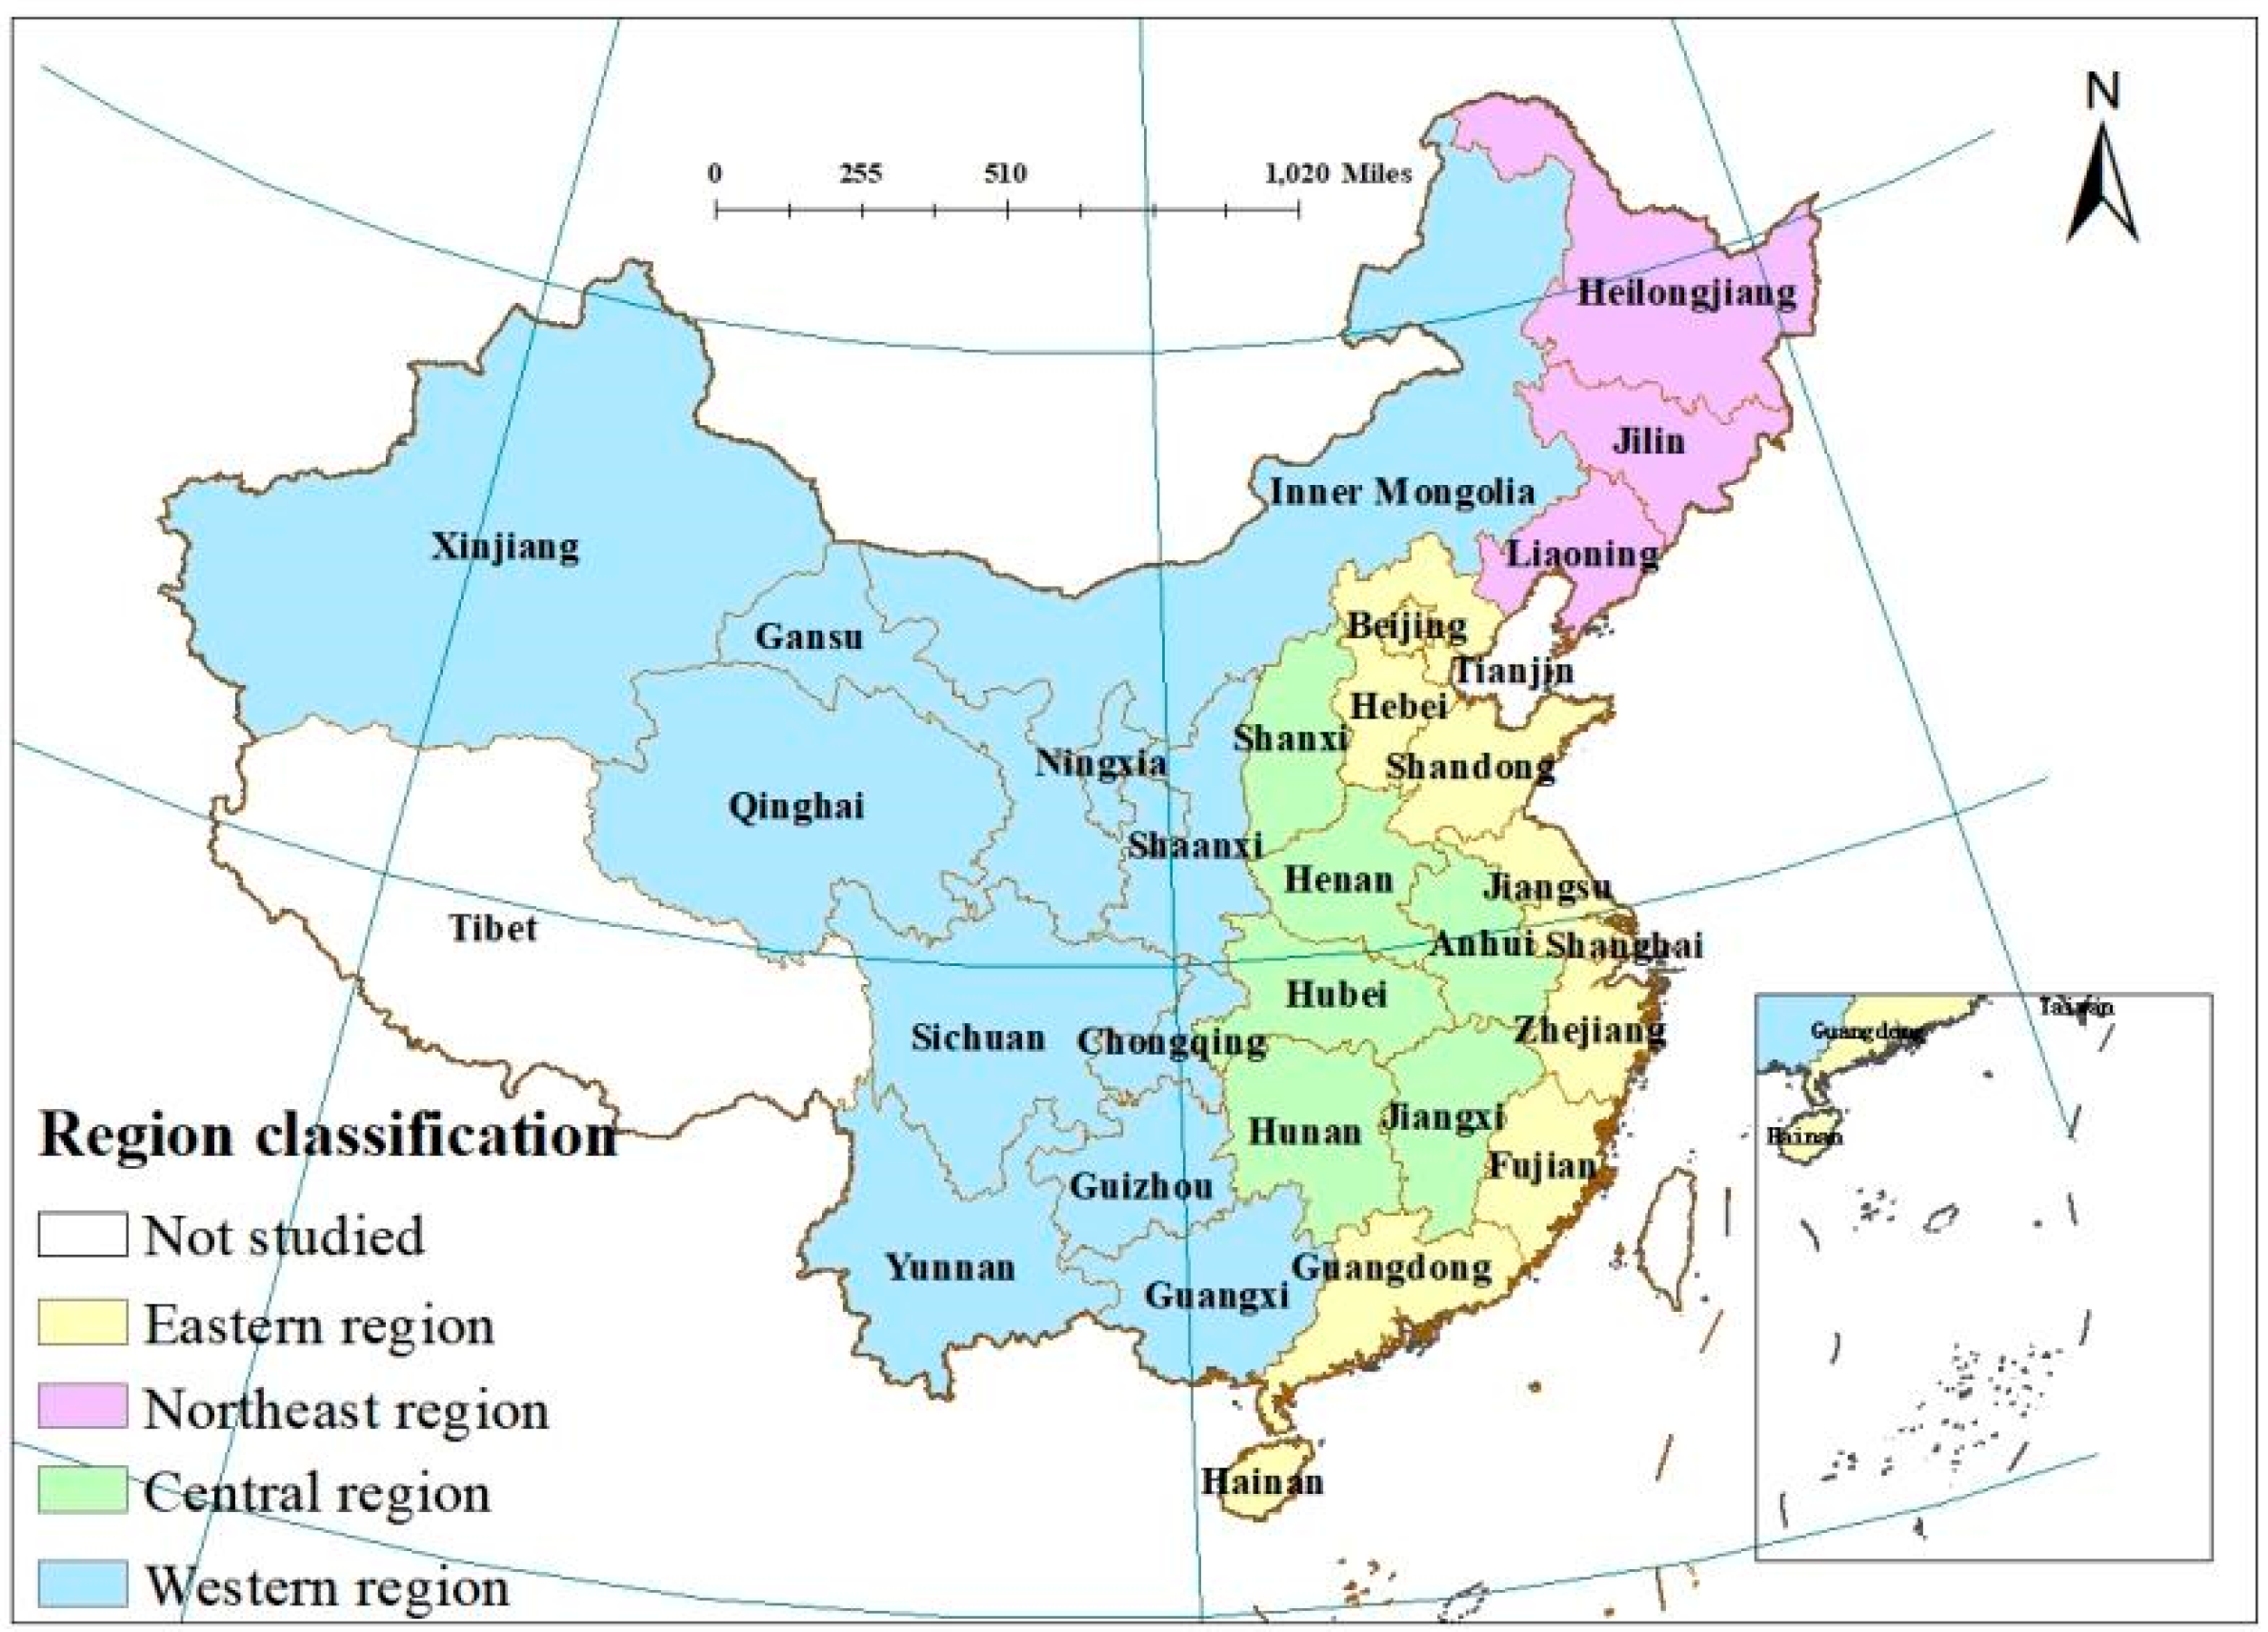
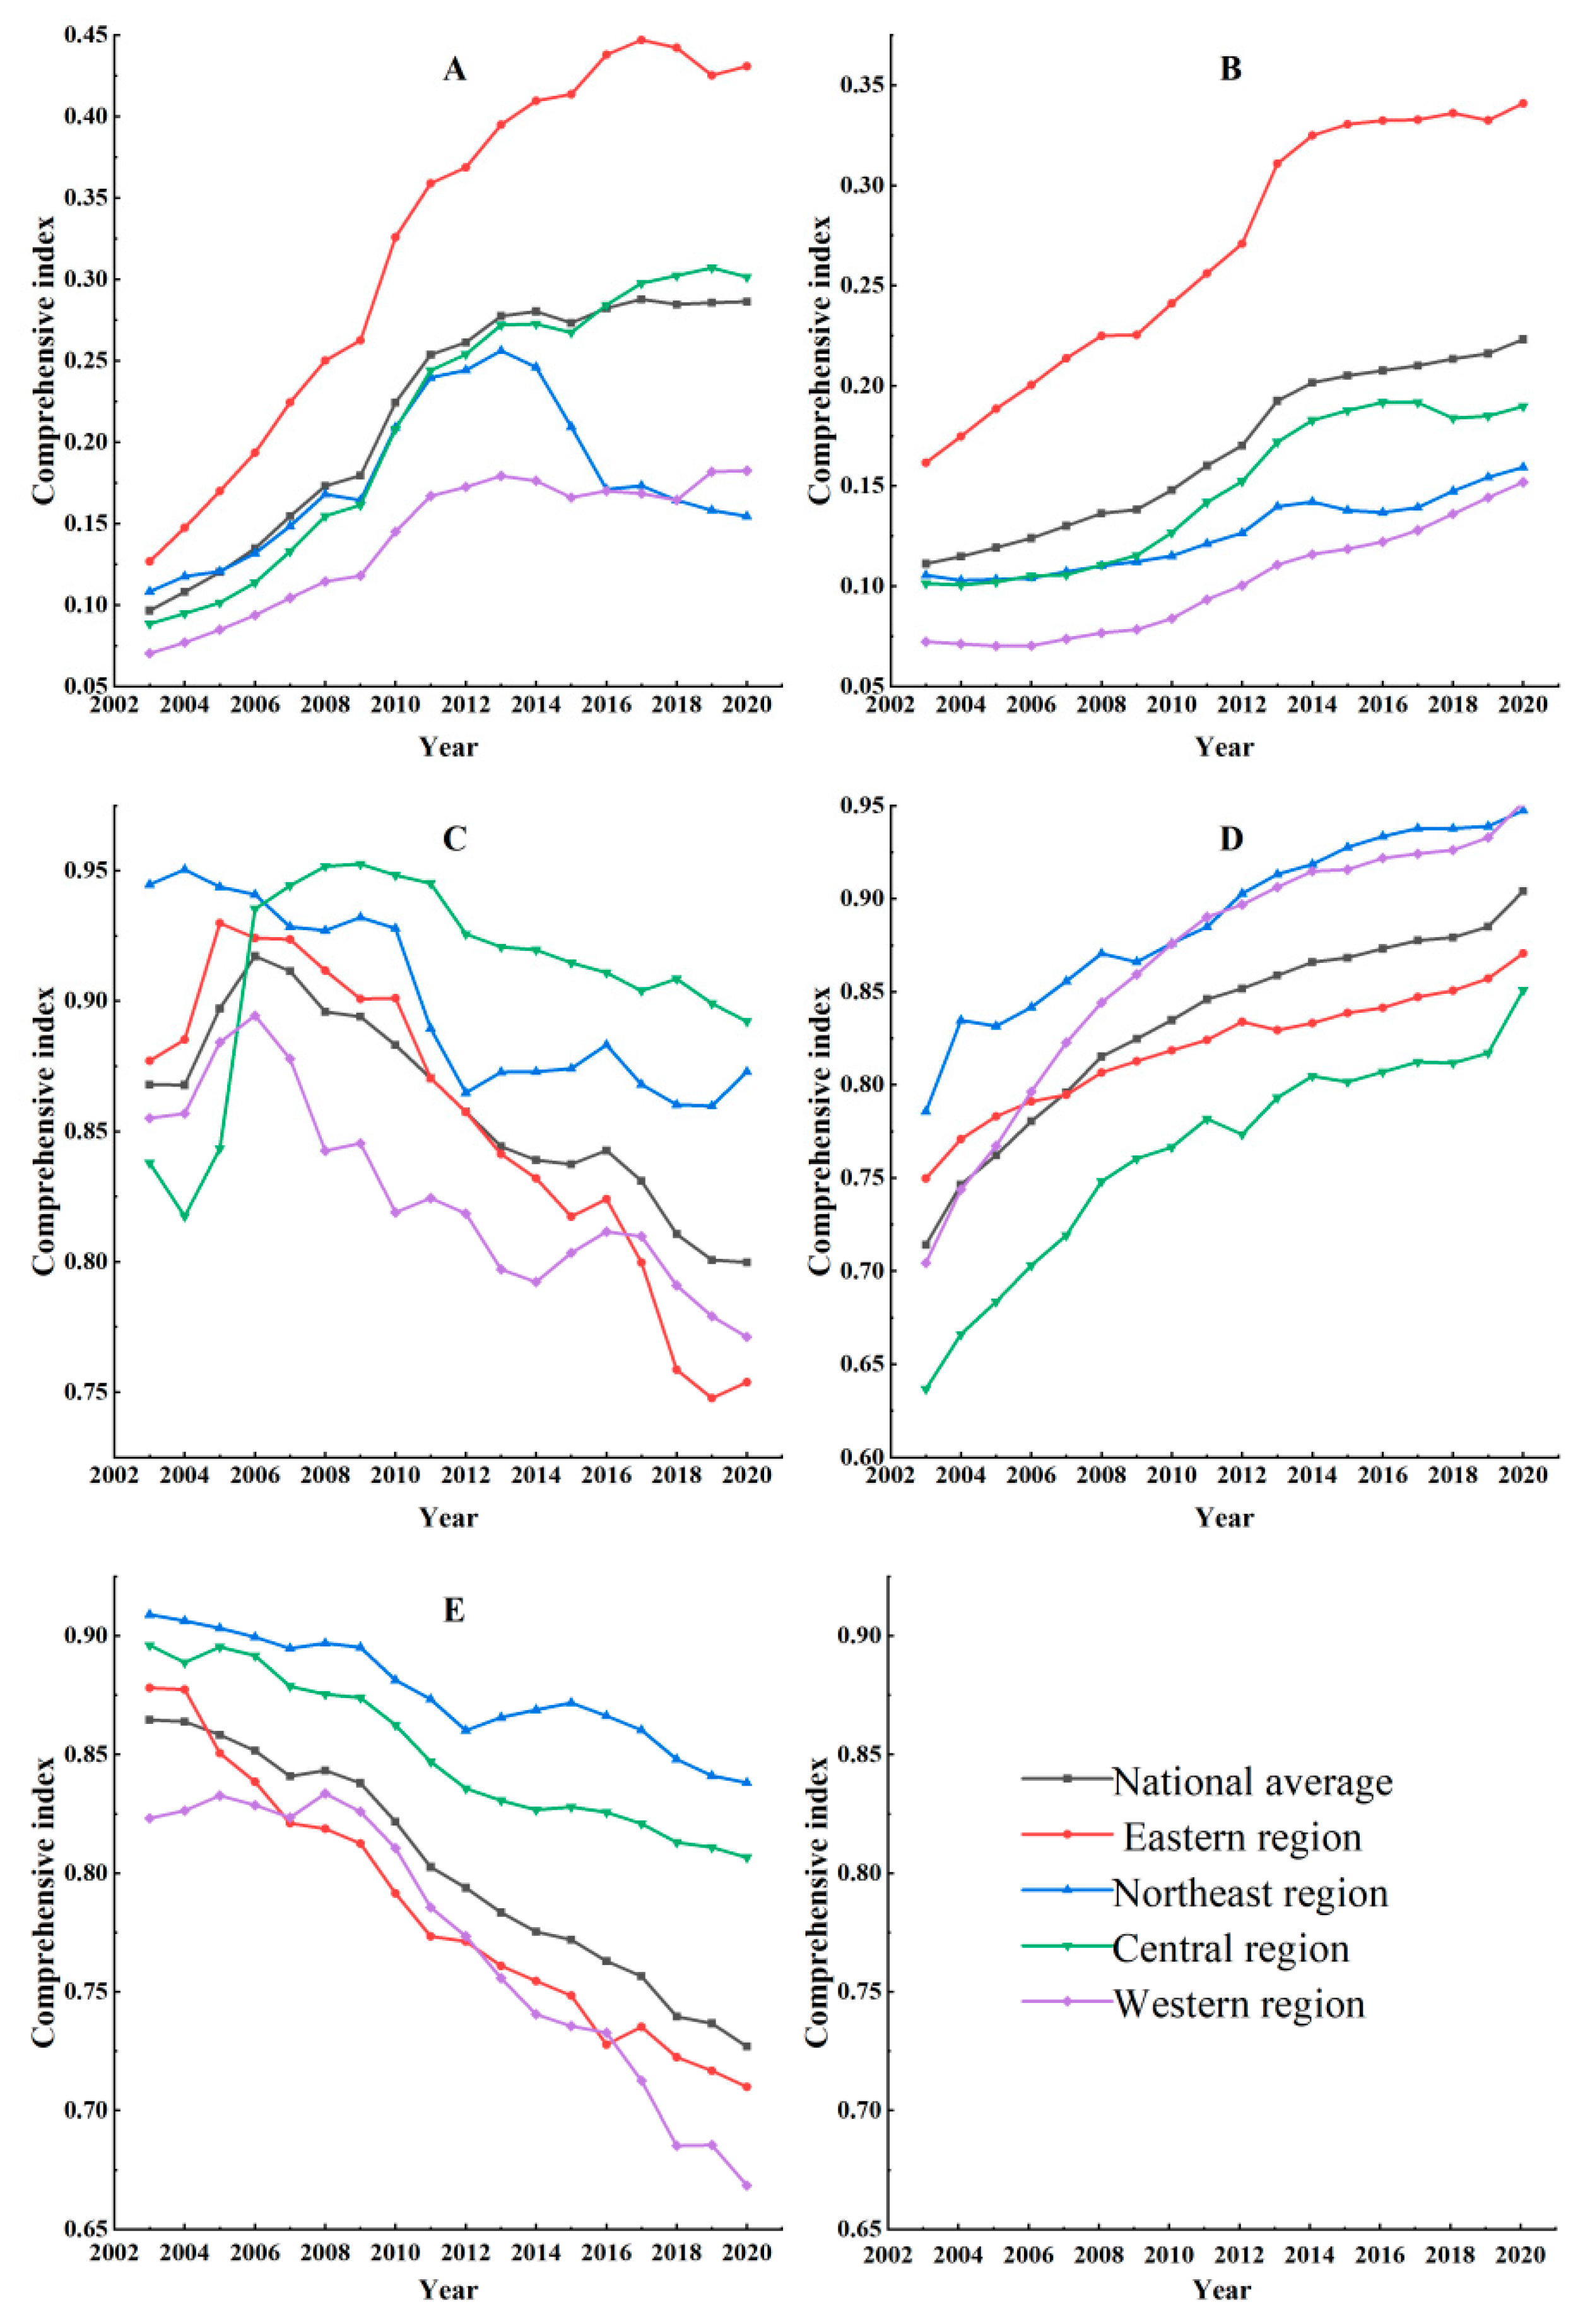
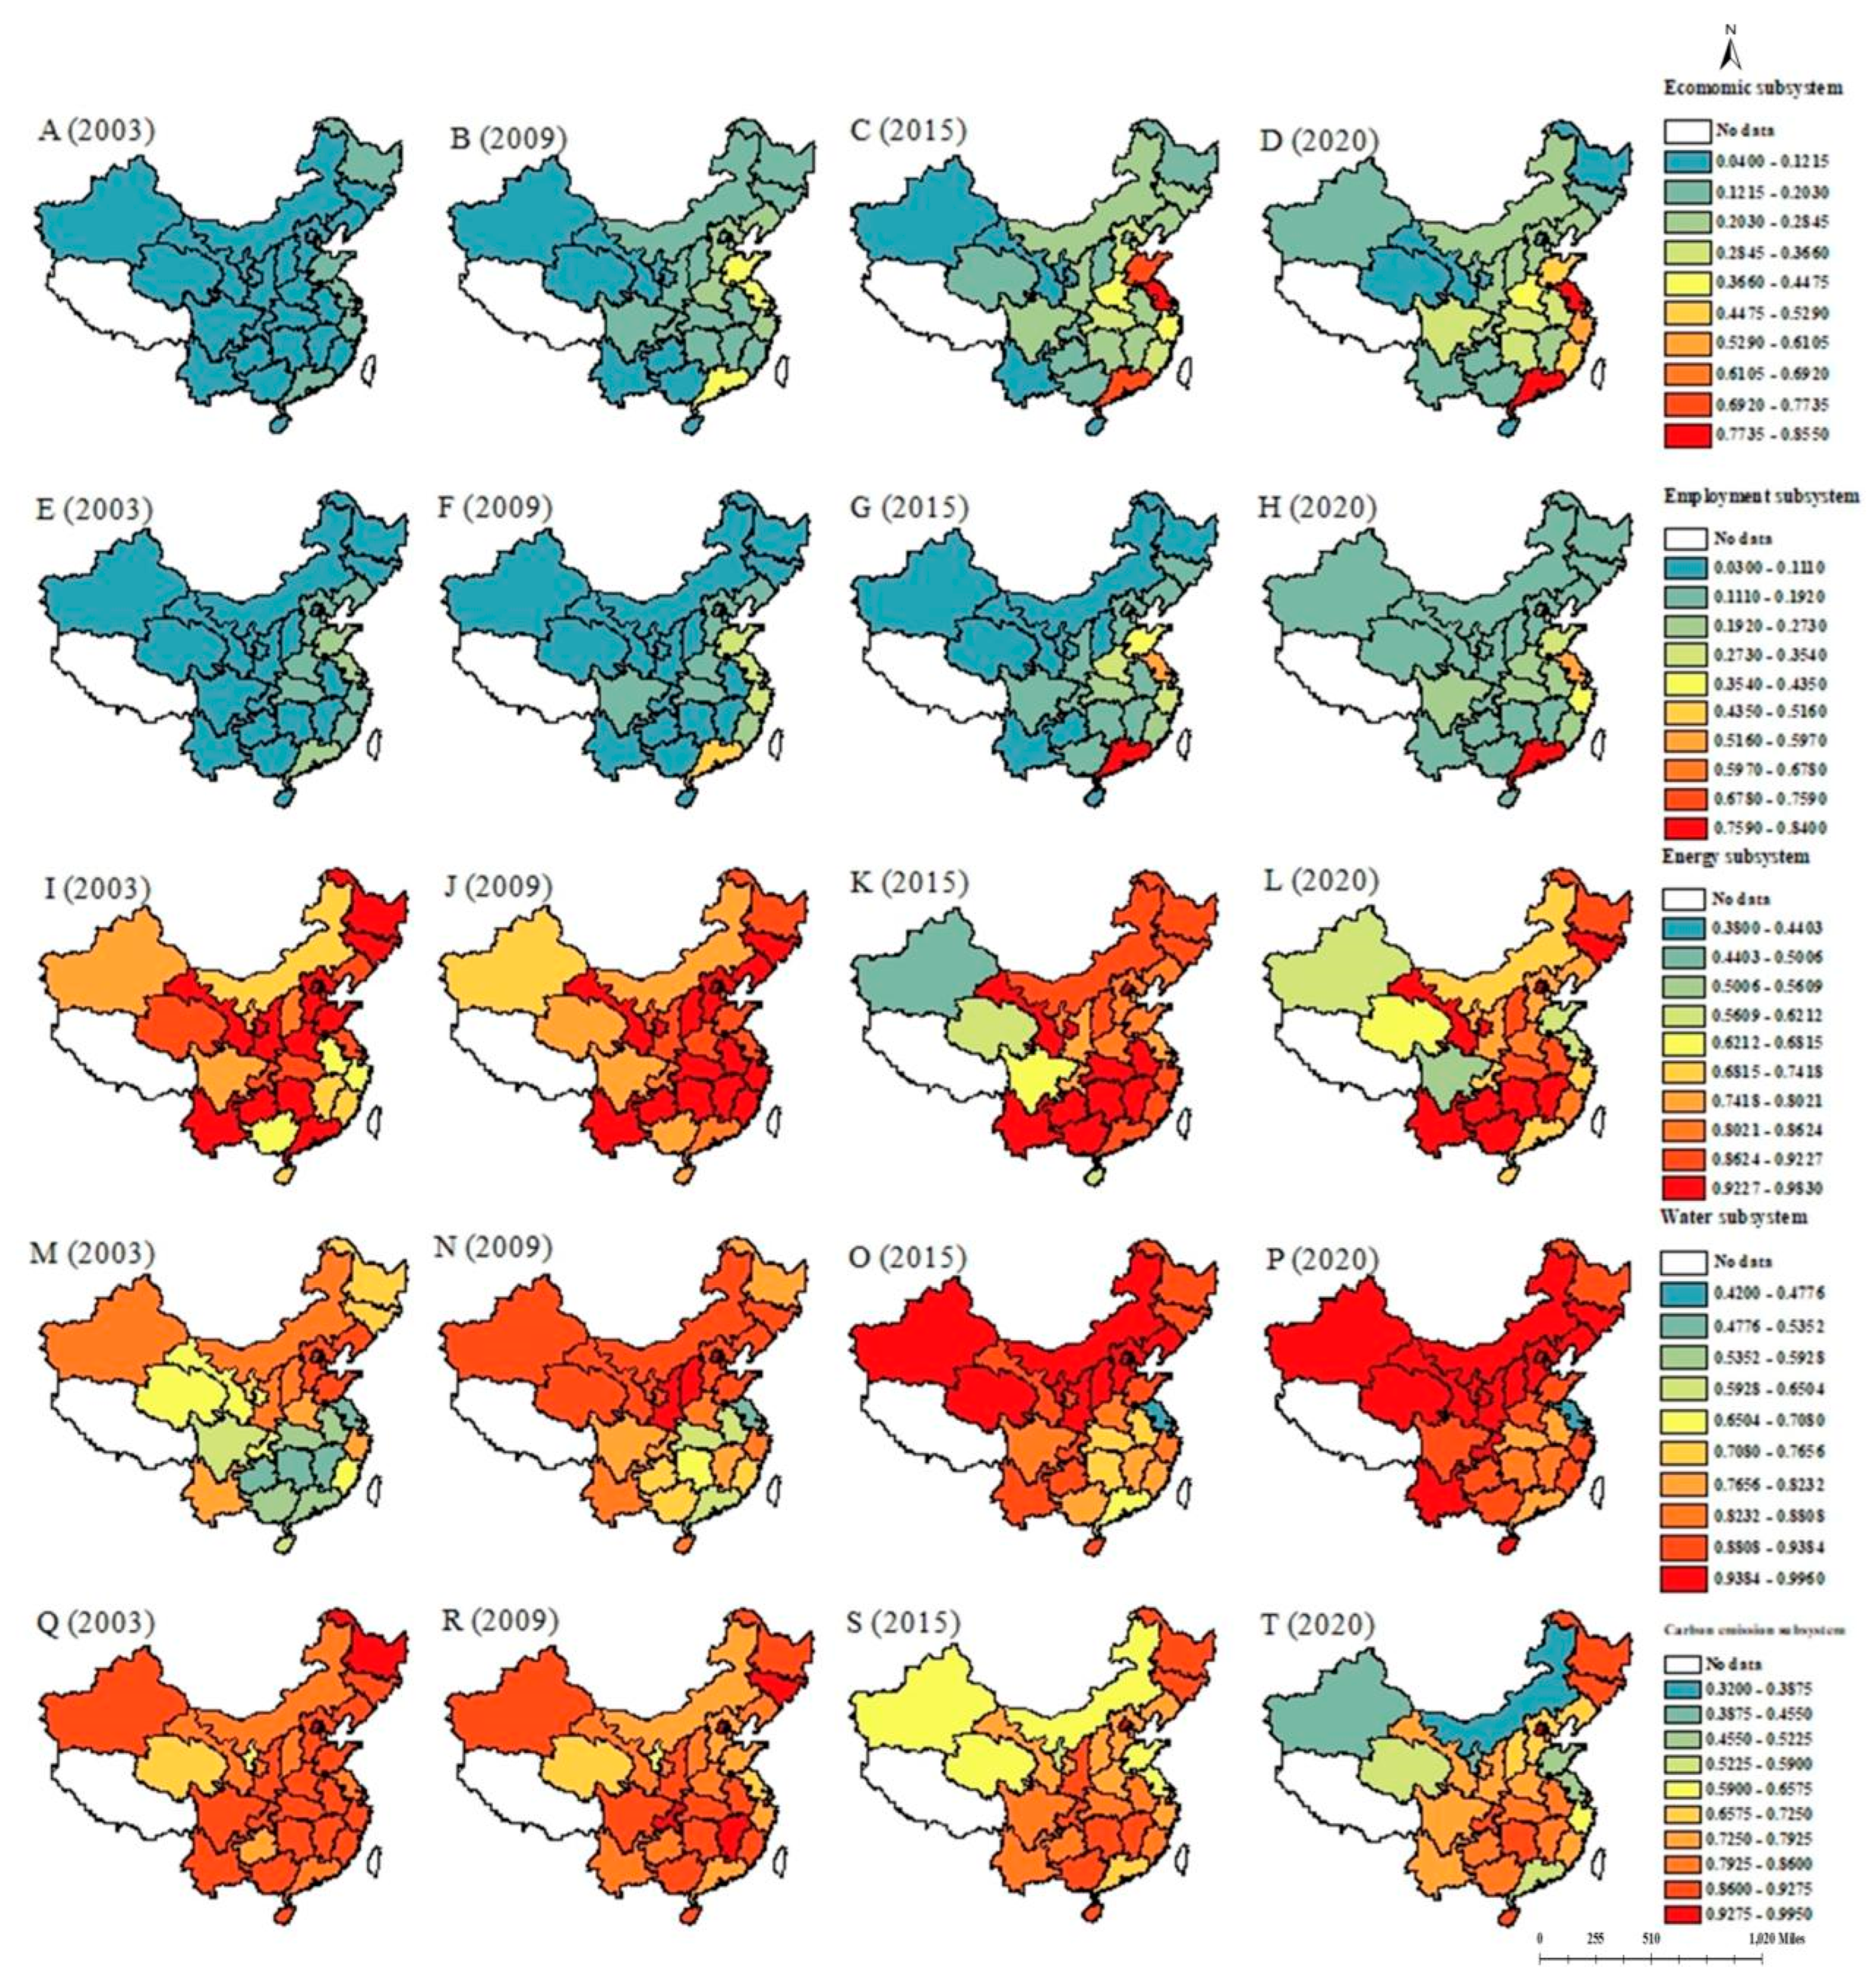

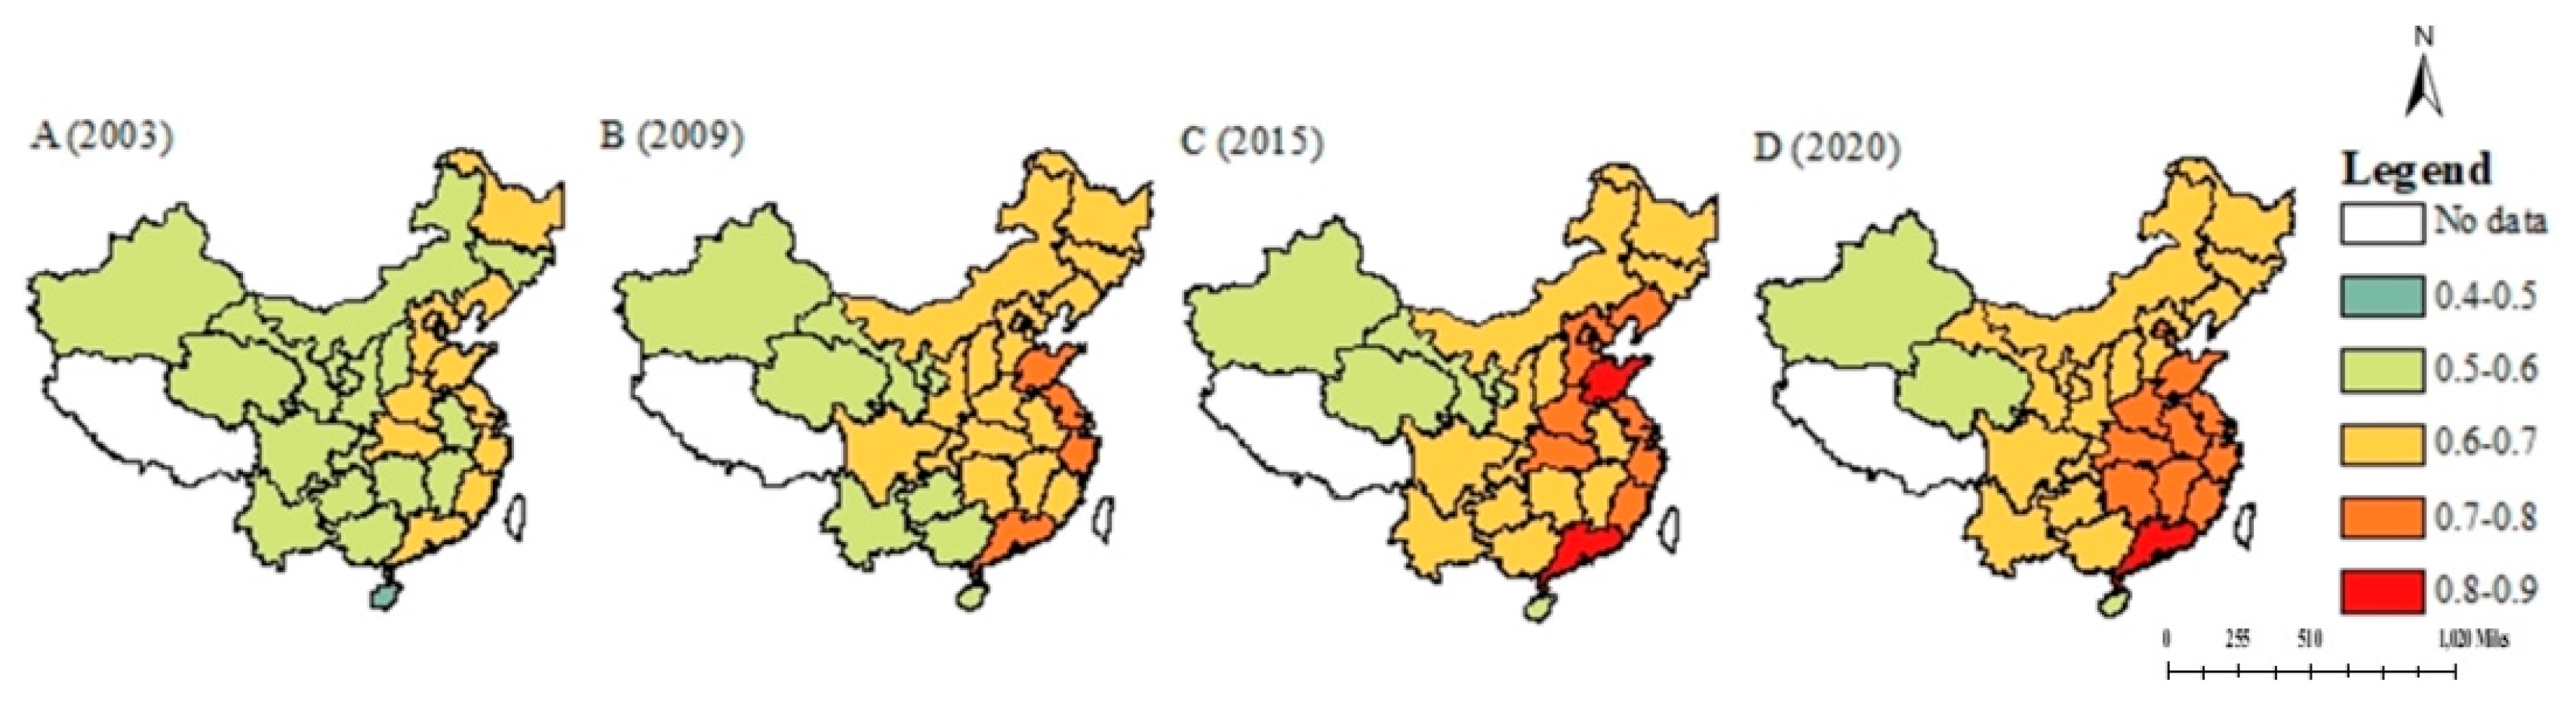
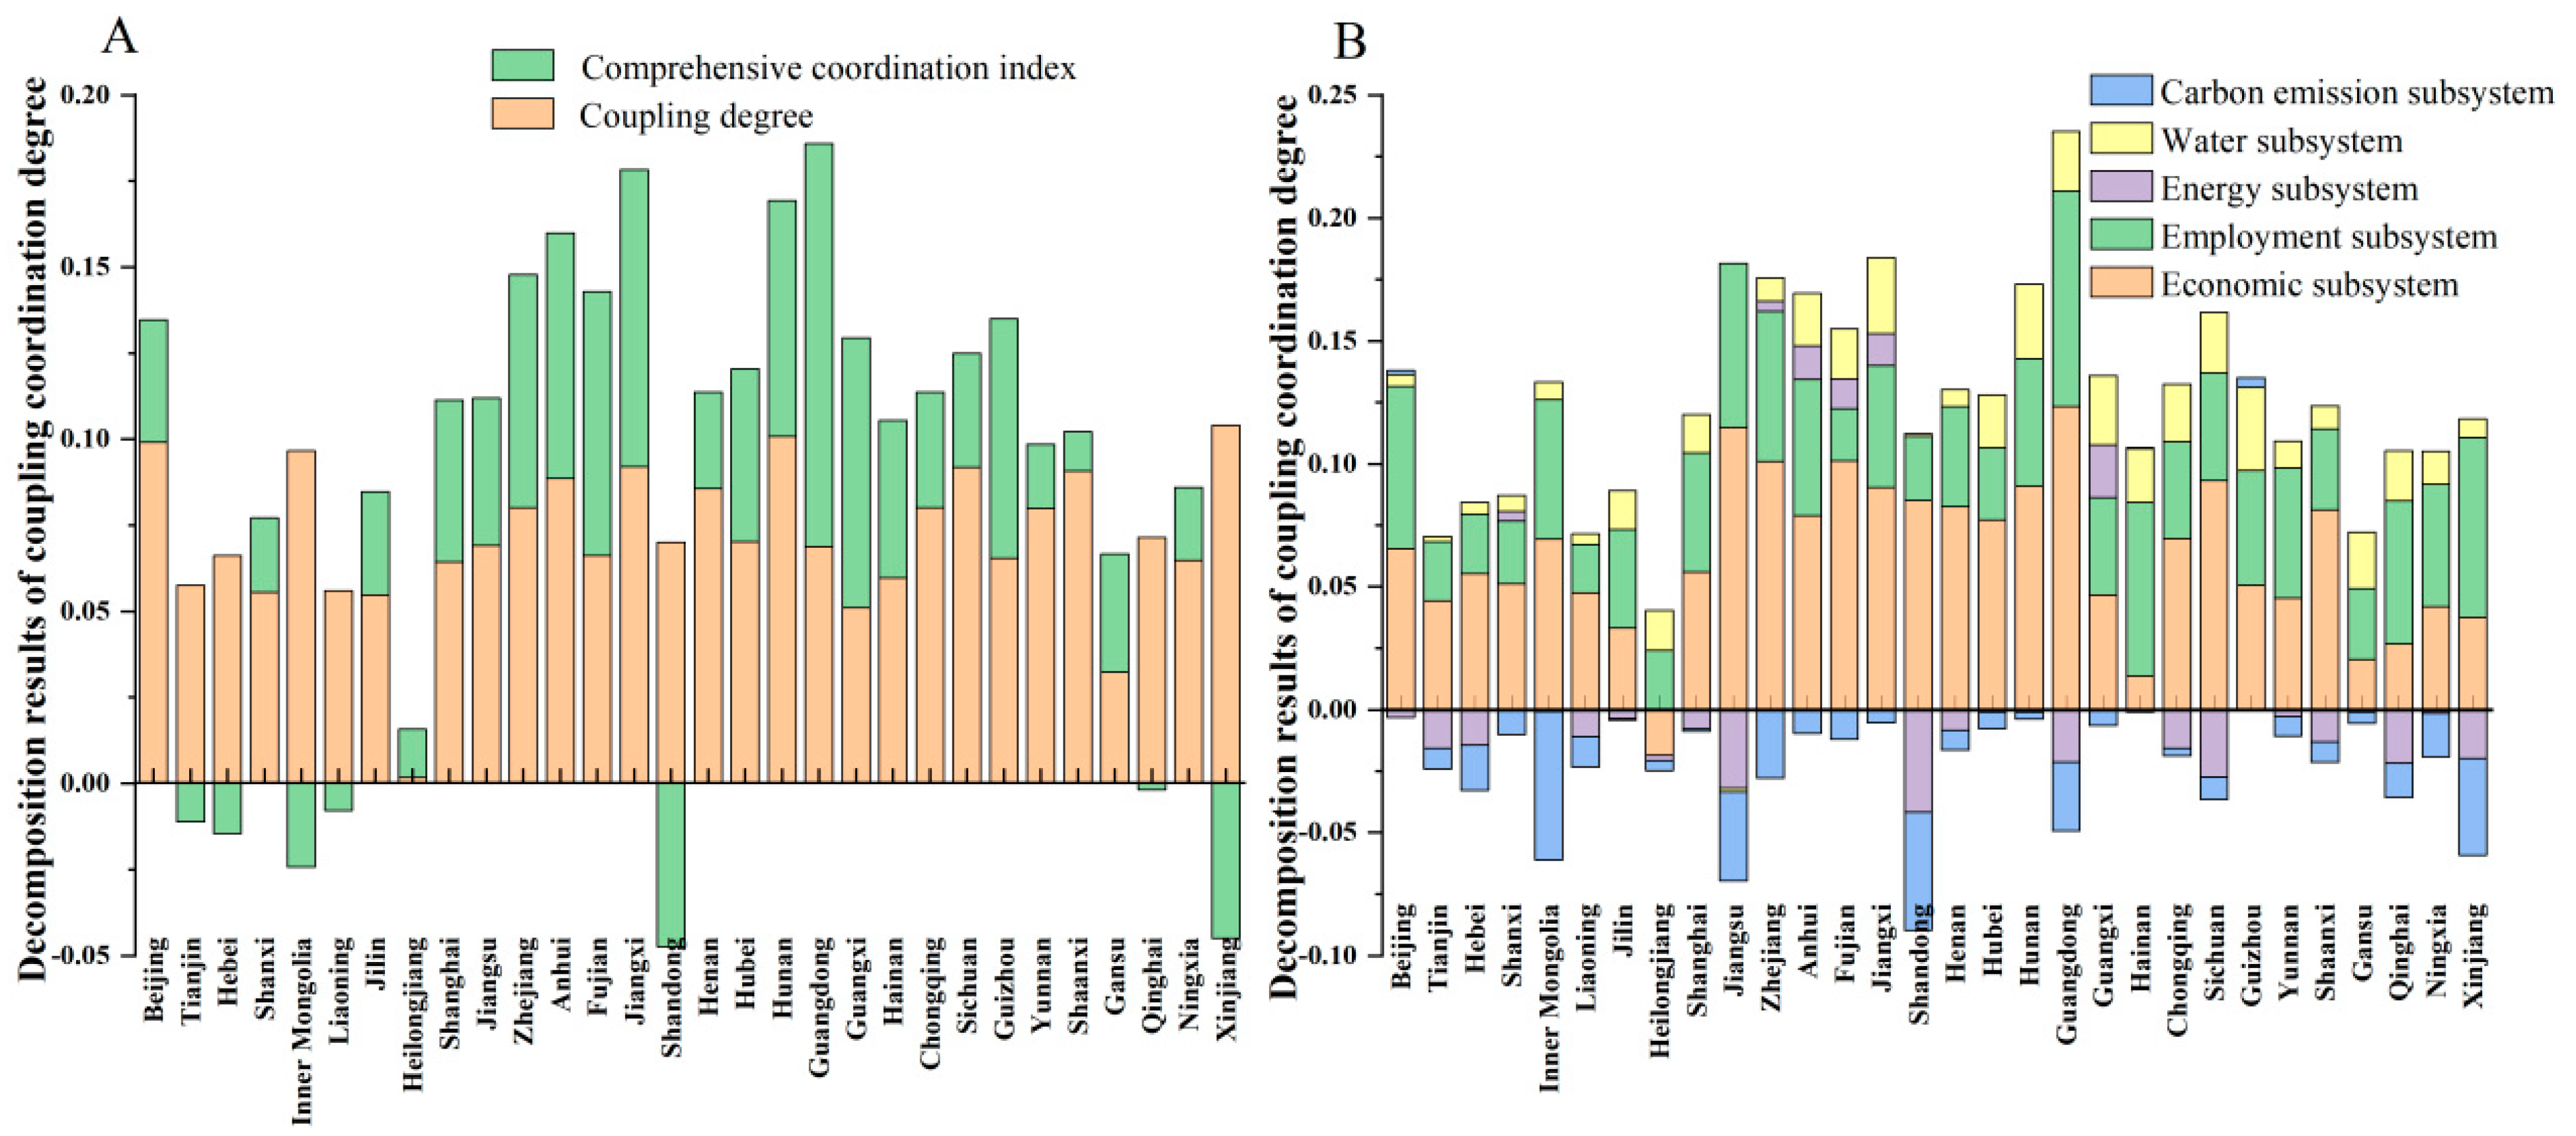
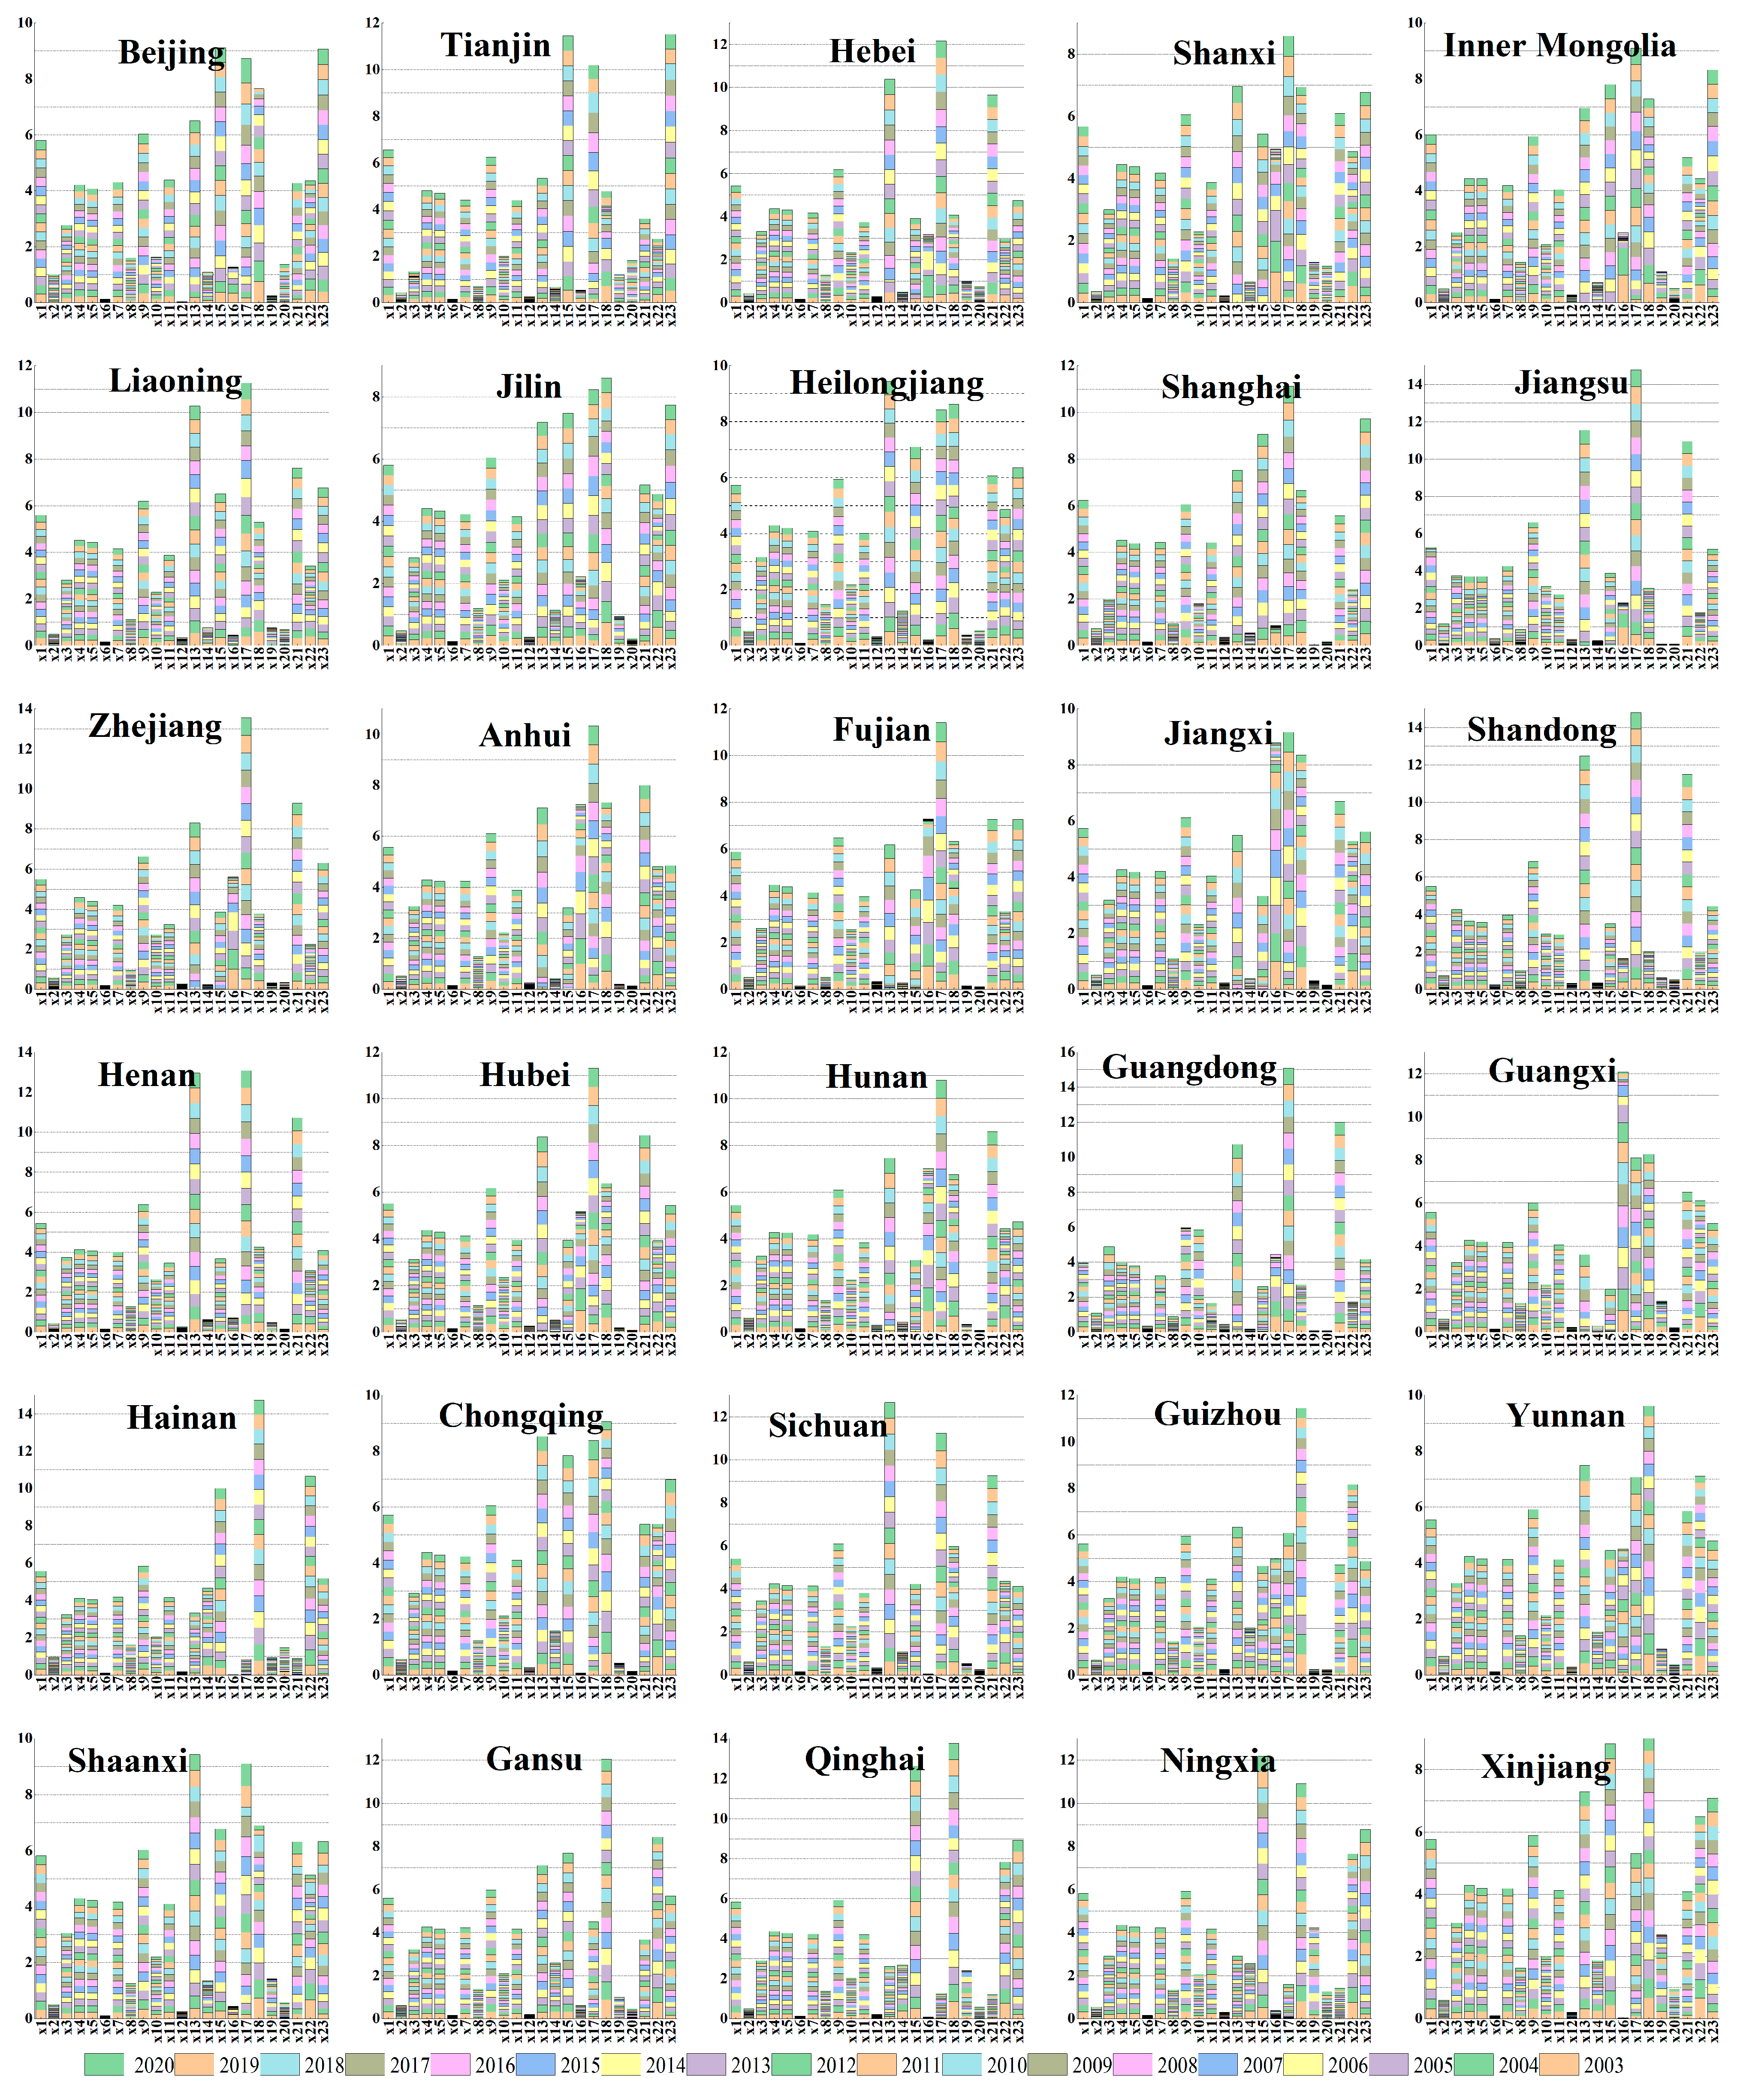
Disclaimer/Publisher’s Note: The statements, opinions and data contained in all publications are solely those of the individual author(s) and contributor(s) and not of MDPI and/or the editor(s). MDPI and/or the editor(s) disclaim responsibility for any injury to people or property resulting from any ideas, methods, instructions or products referred to in the content. |
© 2025 by the authors. Licensee MDPI, Basel, Switzerland. This article is an open access article distributed under the terms and conditions of the Creative Commons Attribution (CC BY) license (https://creativecommons.org/licenses/by/4.0/).