Abstract
Shore power represents one of the principal solutions for the green transformation within the port industry. It significantly aids in the reduction in carbon emissions from vessels while they are berthed in port, yet often necessitates an effective promotional strategy to foster its installation and utilization. Stakeholders including port authorities, ship operators, and local governments all play a crucial role in achieving this objective. This paper employs a tripartite evolutionary game model in conjunction with a system dynamics model to investigate the evolutionary responses of stakeholders when policy tools are applied, and consequently, to elucidate the dynamics of strategy effectiveness. In this context, six business scenarios are developed to ascertain the potential impacts of implementing subsidies and carbon taxes. The findings demonstrate that any singular strategy, whether a subsidy or a carbon tax, is inadequate for the successful advancement of shore power; on the contrary, a government-led, integrated, and dynamic reward–punishment strategy aids in stabilizing the inherent fluctuations within this game process. Moreover, the initial willingness of ship operators exerts a considerably greater influence than that of the other two stakeholders.
1. Introduction
Empirical evidence suggests that approximately 70 percent of maritime emissions are concentrated in port areas, thereby impacting both the climate and public health within the port vicinity as well as in adjacent urban regions. Vessels berthed at ports contribute significantly to these emissions due to their reliance on auxiliary engines for electrical power generation necessary for onboard functions. Shore power, which provides electricity to ships as an alternative, emerges as a viable solution to mitigate the environmental impact of these vessels. The structure of the shore power supply system is illustrated in Figure 1. As per the U.S. Environmental Protection Agency, the utilization of shore power has the potential to reduce emissions of carbon dioxide and other pollutants by up to 98% from vessels at berth [1]. Consequently, many ports across Europe, North America, and Asia have commenced the implementation of shore power technologies to reduce emissions and enhance air quality in the surrounding territories [2].
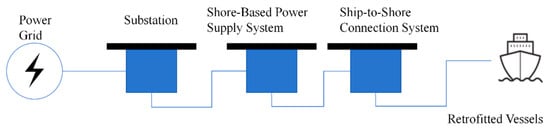
Figure 1.
Schematic diagram of shore power system.
Despite the considerable environmental advantages that shore power provides in reducing maritime emissions, its development continues to encounter numerous obstacles across different countries and regions, predominantly due to the financial burdens incurred [3]. First of all, the financial investment required for the establishment of shore power infrastructure is considerable. Port authorities are obligated to cover not only the expenses of constructing and upgrading berths and facilities but also the enduring operational expenditures. These substantial costs have hindered the widespread adoption of shore power in areas lacking sufficient financial credit [4]. Ship operators are also subject to substantial modification costs in adhering to the requirements established by the International Maritime Organization (IMO) for shore power connections [5]. On the other hand, the government sector functions as a pivotal agent in advancing the utilization of shore power, motivated by the persistent imperatives of the green transition. Its supportive policies predominantly depend on subsidies. For instance, since the commencement of the first pilot implementation of shore power supply in Chinese ports in 2009, the Chinese government has initiated a series of supportive policies and significant subsidies for port authorities and ship operators [6]. The UK’s Maritime 2050 Strategy, released in 2019, also articulated the government’s plans to contemplate subsidies and investments to enhance the adoption of shore power in ports and ships [7]. Similarly, South Korea and the United States government provide analogous subsidy policies to ships registered under their flags or to state-owned ship operators [8]. Unfortunately, the outcomes of these policies have thus far been disappointing. For example, according to Clean Air Asia, the average utilization rate across five selected sample ports was 17%, which is considerably below the Ministry of Transport’s goal of promoting the normalization of shore power usage. Similarly, the UK is one of the countries actively promoting shore power technology; however, the deployment progress has been very slow so far [9]. Scholars assert that the primary reasons for this are either a lack of long-term sustainability in the current subsidy policies or the ambiguity surrounding the subsidy mechanisms [10].
In recent years, the carbon tax has been demonstrated as an effective policy tool in mitigating carbon emissions and may serve as an additional alternative to foster the utilization of shore power [11]. According to the World Bank, over 46 countries and 32 regions globally have implemented or are in the process of enacting 30 policies related to carbon taxation [12]. The Swedish carbon tax achieved a reduction in CO2 emissions from the transportation sector by an average of 6% between 1990 and 2005 [13]. Implementing a carbon tax priced at USD 40 per ton of CO2 emissions, which covers 30% of emissions across 15 EU countries, results in a cumulative reduction in carbon emissions ranging from 4% to 6% [14]. Consequently, the imposition of a carbon tax on port authorities and ship operators could constitute an additional strategy to facilitate the implementation and adoption of shore power systems. In other words, subsidies and carbon taxes represent two principal approaches by which governments might steer the development of shore power. Nevertheless, due to the intricate nature of promoting shore power, which encompasses a complex system with multiple stakeholders’ involvement, assessing the relative efficacy of these policies and formulating effective mechanisms continues to pose a substantial challenge [15].
This study aims to formulate a tripartite system dynamics (SD) evolutionary game model, encompassing three principal stakeholders: the government, port authority, and ship operators. The intention is to investigate the feedback mechanisms and interactions among these stakeholders within the framework subjected to dual policy measures of subsidies and carbon taxes. Furthermore, it evaluates the likelihood of strategic decisions among the trio of entities and examines the repercussions of subsidies and carbon taxes on the evolution of the system. System dynamics is employed to model intricate nonlinear behavioral dynamics and to address challenges related to protracted industry cycles and ambiguous data. The decision-making processes of the three stakeholders are replicated using the replicator dynamic equations. The principal contributions of this paper are delineated as follows:
- (1)
- By developing an evolutionary game model that integrates subsidy and carbon tax policies and coupling it with a system dynamics framework, this study investigates dynamic decision-making processes in shore power systems to identify critical factors and optimization pathways.
- (2)
- This study presents an examination of a dynamic reward–penalty mechanism, analyzing the impact of six distinct reward–penalty strategies on prompting shore power utilization. The results elucidate the optimal strategies for advancing shore power development, taking into account the involvement of multiple stakeholders, thereby offering a scientific foundation for policy formulation in the context of shore power advancement.
The organization of the remainder of this paper is as follows: Section 2 offers a comprehensive review of the pertinent literature. Section 3 delineates the problem and associated assumptions, thereby formulating an SD evolutionary game model in the context of subsidy and carbon tax policies. Section 4 conducts the numerical simulation utilizing Vensim PLE 7.3.5 software, investigating the evolutionary trajectories under various mechanisms. Section 5 and Section 6 present the research findings and conclusions, respectively.
2. Literature Review
2.1. Shore Power Development and Benefits
High-voltage shore power technology was firstly applied at the Gothenburg ferry terminal in Sweden in the year 2000. Following this, the adoption of the technology expanded globally to include countries such as China, Japan, Norway, France, Italy, Spain, Latvia, Estonia, and Belgium, among others. Empirical applications have since illustrated its considerable potential for environmental protection, while researchers have been attracted to investigate its impact on economies of scale. Tseng and Pilcher [16], for example, performed a comparative analysis utilizing Kaohsiung as a case study, which suggested that the implementation of shore power could lead to a reduction in environmental costs by approximately USD 2.8 million, contingent upon a 60% market share of shore power adoption. Gutierrez-Romero et al. [17] undertook a similar study on the Port of Cartagena in Spain, examining port traffic data from 2010 to 2016. Their findings indicated that the adoption of shore power could result in a reduction of over 10,000 tons of carbon dioxide annually. Extending the scope of analysis beyond a singular port, Winkel et al. [18] evaluated the economic and environmental impacts attributable to shore power utilization in European ports, arriving at a similar conclusion that its utilization could potentially lower carbon emissions by up to 800,000 tons of CO2 across EU ports by 2020. On a global scale, Hall [19] employed electricity supply and atmospheric emission data from the International Energy Agency (IEA) to appraise the decrease in carbon dioxide emissions following the adoption of shore power. His conclusion posits that the adoption of shore power can substantially diminish CO2 emissions in numerous major maritime nations, with Norway achieving the most significant reduction, achieving a decrease in carbon dioxide emissions by 99.5%.
Beyond the environmental advantages of shore power, scholars have investigated its benefits from other perspectives as well. For example, Spengler et al. [20] estimated the overall external costs associated with pollutant emissions from ships docked within the Spanish port system, taking into account their effects on both local and global environments. Their findings suggest that the implementation of shore power at the Port of Barcelona could result in a reduction in external costs by EUR 84.4 million. Merkel et al. [21] evaluate the potential socio-economic effects of public investment in shore power by utilizing an investment appraisal model. The outcomes of this study signify that investing in shore power can be beneficial and enhance welfare, particularly when targeted towards nonlinear (tramp) shipping segments. Furthermore, Ballini and Bozzo [22] performed a cost–benefit analysis from a societal perspective, employing the External Valuation of Air Pollution Model (EVA) to assess the introduction of shore power at Copenhagen’s new cruise terminal. The study concludes that the implementation of shore power at Copenhagen’s terminals is highly cost-effective from a socioeconomic standpoint, with the external health costs anticipated to offset the infrastructure’s construction costs within 12–13 years.
2.2. Prompting the Adoption of Shore Power
Government agencies have been recognized as the principal advocates in promoting the adoption of shore power [23], with subsidies frequently employed as the primary strategy in this endeavor [24,25,26]. The efficacy of subsidy policy in facilitating a green transition has been demonstrated by numerous studies, particularly with respect to reducing carbon emissions [27], promoting green technology innovation [28], and augmenting corporate environmental awareness [29,30,31].
With respect to the specific issue of subsidies in shore power adoption, for instance, Sheng et al. [32] and Zhao et al. [33] utilized evolutionary game models to examine the influence of subsidies on the interactions among governments, port authorities, and ship operators, as well as the interactions between governments and dual ports, respectively, within the scope of shore power promotion. Both investigations elucidated the crucial role of subsidies in facilitating stakeholder collaboration. Wang et al. [34] focused on distinct subsidy schemes and utilized a stochastic optimization model to analyze the development of policies for shore power usage subsidies. However, this study disregards the consideration of subsidies at the port level and the strategies associated with such subsidies. Subsequently, Wang et al. [35] employed the Stackelberg game framework to examine the intricacies of governmental subsidy design and selection, in addition to the investment and pricing strategies adopted by ports. The findings indicate that it would be prudent for the government to initially augment subsidies for the development of shore power infrastructure, subsequently followed by an enhancement of subsidies for the operational aspects of shore power systems.
While subsidy policies have demonstrated beneficial impacts, these studies tend to neglect the inherent limitations associated with such subsidies. For example, Song et al. [36] formulated a Nash game model to analyze the decision-making processes concerning shore power usage by two ship operators. Their findings reveal that, although governmental intervention through subsidies can effectively alleviate the prisoner’s dilemma experienced by these companies, it also incurs a substantial financial burden on the government. In a comparable vein, Chen et al. [37] and Xu et al. [38] integrated the government, port authorities, and power companies, as well as the government, port authorities, and ship operators into their respective game frameworks. Employing evolutionary game theory, both investigations illustrated a tendency for governmental bodies to progressively diminish fiscal outlays (e.g., subsidy reductions or market withdrawal) concomitant with the maturation of the shore power system. Unfortunately, these scholars, despite acknowledging the limitations of subsidy policies, have not put forward concrete solutions to mitigate these issues.
2.3. Carbon Taxation as a Potential Policy Supplement
Taxes are frequently regarded as a policy instrument that influences environmentally sustainable decision-making [39,40,41]. A substantial body of literature exists on environmental taxes broadly, and more recently, with particular emphasis on carbon taxes [42,43,44,45]. Utilizing the case of Finland as an exemplar, Mideksa [46] employed the Synthetic Control Approach to estimate that the imposition of the Finnish carbon tax resulted in a reduction in CO2 emissions by 16% in 1995, 25% in 2000, and 31% in 2005, in comparison to scenarios without the tax. The deployment of a carbon tax has demonstrably yielded substantial outcomes in terms of emission reduction.
As a result, numerous scholars associate the imposition of a carbon tax with economic sectors that are heavily reliant on energy, typically including the transportation industry. Zhou et al. [47] employed a CGE model to examine the potential impact of carbon pricing on China’s transportation industry. Their findings demonstrate that a finely tuned carbon tax can substantially mitigate carbon emissions within this sector. Furthermore, they propose the implementation of differentiated carbon tax rates across various transportation modalities and energy types. Regarding the maritime sector, the Marine Environment Protection Committee (MEPC) of the International Maritime Organization (IMO) endorsed the establishment of a prolonged carbon tax applied to ports [48]. Zhen et al. [49] claimed that carbon tax policies, except for berth priority incentives, might be more effective than subsidy schemes in their deployment of shore power systems study. Nevertheless, the implementation of carbon tax policies frequently encounters considerable opposition, and it is judicious to integrate them with compensatory measures [50]. Therefore, in the future promotion of shore power, how to effectively combine subsidy policies with carbon tax policies to develop a reasonable policy framework is a key issue. Moreover, the variance in carbon tax rates among various nations is considerable, with rates extending from a minimum of USD 0.08 per metric ton of carbon dioxide in Poland to a maximum of USD 129.89 per metric ton in Sweden. This disparity often arises from a complex balance involving elements such as economic conditions, energy considerations, policy frameworks, and international relations unique to each nation.
Despite the considerable advantages of shore power technology, analysis of the existing scholarly literature reveals that a singular policy approach, whether it be a subsidy or carbon tax, may prove effective in reducing carbon emissions; however, such approaches face challenges in their short- or long-term implementation. Therefore, the issue of effectively integrating subsidy policies with carbon tax policies to formulate a policy framework that incorporates both incentives and punishments, as well as sustainability, has become a pivotal concern for the progress of shore power promotions.
3. Problem Description and Research Methodology
3.1. Problem Description
With respect to the utilization of shore power, the contributions of port authorities and ship operators are significantly influenced by governmental policies. Consequently, active governmental involvement is imperative, utilizing either supportive policies such as subsidies or punitive measures such as carbon taxes, or a combination of both. Nevertheless, the divergent interests of governments, port authorities, and ship operators result in intricate strategic interactions among these entities, as illustrated in Figure 2. Consequently, this paper develops an evolutionary game model among these three stakeholders to enhance the understanding of the evolutionary dynamics impacting their strategic decision-making processes.
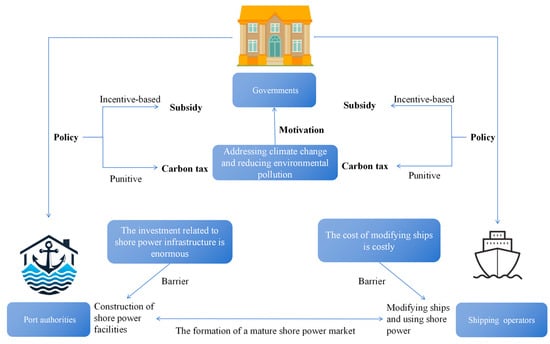
Figure 2.
Group logic diagram of the tripartite game.
3.2. Game Model
Traditional game theory assumes complete rationality and perfect information among participants [51], focusing on rational decision-making and equilibrium analysis. However, evolutionary game theory replaces the perfect rationality assumption with a dynamic framework, achieving equilibrium through iterative strategy adjustment and learning. This theory provides unique advantages in addressing long-term equilibrium challenges in economics, management, social sciences, and engineering [52].
3.2.1. Assumptions and Parameters
- (1)
- At the onset of the game, the likelihood of governments selecting the “to promote” strategy is denoted by , while the probability of choosing the “not to promote” strategy is represented by . Similarly, the probabilities of port authorities opting for “to construct” and “not to construct” strategies are and , respectively. Likewise, the probabilities of ship operators selecting the “to use” and “not to use” strategies are and . These probabilities are constrained within the range , , and .
- (2)
- The government’s fundamental benefit is represented as . An expenditure related to the policy implementation of occurs when the government adopts the strategy of “promotion”. The successful utilization of shore power results in an additional benefit of for the government. In contrast, when the government opts for the strategy of “not to promote”, the effective utilization of shore power results in a diminished additional benefit of , with > reflecting the typically greater benefits of government incentive policies. Should the government prove ineffective in promoting shore power, it results in a diminution of social and environmental benefits and consequently incurs a loss denoted as . Throughout the policy implementation phase, the government provides financial assistance to port authorities engaged in the development of shore power infrastructure. These subsidies, designated as and , pertain to the support of infrastructure construction projects and the coverage of operation and maintenance expenditures for shore power facilities, respectively. Moreover, the financial subsidy for shipping enterprises, identified as , pertains to the compensation for the differential in electricity pricing associated with shore power.
- (3)
- For port authorities, the foundational advantage of opting not to establish shore power is denoted as . Selecting the strategic course to “construct” entails incurring the expenditures related to the implementation of shore power, represented by , in addition to the expenses associated with the operation and maintenance of shore power facilities, depicted as . The adoption of shore power by ship operators confers a benefit to the port authorities, identified as . Furthermore, the port authorities receive financial support from the government in the form of a construction subsidy, , and an operational subsidy, . Conversely, if the port authorities elect the strategy “not to construct”, the local government will implement a carbon tax, T.
- (4)
- The fundamental benefits afforded to ship operators are . Upon selecting the strategy “to use”, ship operators incur ship modification costs denoted as . They also face expenses associated with utilizing shore power, represented by . Additionally, ship operators benefit from government-provided subsidies on shore power electricity pricing, noted as . Given that the majority of vessels docking at the port are registered outside the local jurisdiction, it poses a challenge to accurately assess the subsidy associated with the modification of ship reception equipment within the government’s revenue framework. Consequently, this paper considers the subsidy for the modification of ship reception equipment, , as an exogenous variable, appearing exclusively in the revenue function of ship operators. In instances where ship operators opt for the strategy “not to use”, the expense incurred for utilizing auxiliary engine power generation is denoted as , and the local government imposes a carbon tax, .
Table 1 presents the model variables alongside their corresponding explanations.

Table 1.
Model variables and the explanations.
3.2.2. Model Solution
Utilizing the aforementioned assumptions and model parameters, this study develops the payoff matrices pertinent to the tripartite game involving the government, port authorities, and ship operators, as illustrated in Table 2 and Table 3.
Table 2.
The revenue matrix in the case of government promotion.
Table 3.
The revenue matrix in the case without government promotion.
First of all, the anticipated return for the government when opting for the “to promote” strategy is represented as , whereas the expected return for selecting the “not to promote” strategy is . The government’s average revenue is denoted by , and the associated replication dynamic equation is expressed as :
The average anticipated return to the government can be expressed as follows:
The formulation of the government’s replication dynamics is articulated as follows:
In subsequent analysis, the anticipated return for port authorities opting for the “to construct” strategy is represented by , whereas the anticipated return for selecting the “not to construct” strategy is denoted as . The average profit of port authorities is given by , and the replication dynamic equation is represented as :
The anticipated average return for port authorities can be articulated as the following expression:
The mathematical representation delineating the replication dynamics within port authorities is articulated as follows:
Ultimately, the anticipated return for ship operators opting for the “to use” strategy is denoted as , whereas the expected return for selecting the “not to use” strategy is represented as . The mean profit for ship operators is indicated by , and the replication dynamic equation is expressed as :
The average expected return to ship operators can be written as follows:
The equation for the replication dynamics of ship operators is expressed as follows:
Under the assumption that the dynamic equation of replication is set to zero, there are eight distinct special equilibrium solutions and one general equilibrium solution obtained as follows: , , , , , , , , and
As proposed by Friedman [53], in the context of replicated dynamical systems, it is imperative to focus exclusively on the asymptotic stability of the initial eight special equilibrium points. The remaining equilibrium points exhibit a non-asymptotic stability and are therefore not detailed in this analysis. The aforementioned eight special equilibrium points are incorporated into Jacobi’s Equation (13), and the eigenvalues for each equilibrium point are subsequently computed.
As posited by Khalil [54] in the stability theorem, an equilibrium point is characterized as unstable if all eigenvalues corresponding to the equilibrium points within the matrix are positive. When the eigenvalues exhibit a mixture of positive and negative signs, the equilibrium point is referred to as a saddle point, which similarly denotes instability. Conversely, when all eigenvalues are negative, the equilibrium point represents an evolutionary stable strategy (ESS), as demonstrated in Table 4.
Table 4.
Eigenvalues of Jacobi matrix.
3.3. System Dynamics Model Construction
The system dynamics model serves as an efficacious framework for the analysis of core determinants affecting strategic decision-making among stakeholders, and it was found that it was well suited to strategic issues and could provide a useful tool for supporting policy analysis and decision-making in the transport field [55]. Furthermore, when amalgamated with evolutionary game theory, this integration illustrates considerable theoretical benefits, facilitating enhanced visualization and comprehensive examination of system development trajectories. In reaction to the government’s proactive advocacy for the implementation and advancement of shore power technology, port authorities and ship operators are anticipated to revise and enhance their strategic approaches in accordance with governmental incentive policies.
Figure 3 illustrates the application of the Vensim PLE 7.3.5 software to implement the tripartite evolutionary game SD model, employing the variables of level, rate, intermediate, and external, quantified as 3, 3, 6, and 19, respectively. The probabilities of all stakeholders’ positive attitudes are indicated by the level variables in this model at the rate (i.e., rate variable) of , , and respectively. Furthermore, within the tripartite evolutionary game SD model, the functional interrelations among level, rate, intermediate, and external variables are fundamentally derived from the preceding analysis of the tripartite game and the replicated dynamic equations.
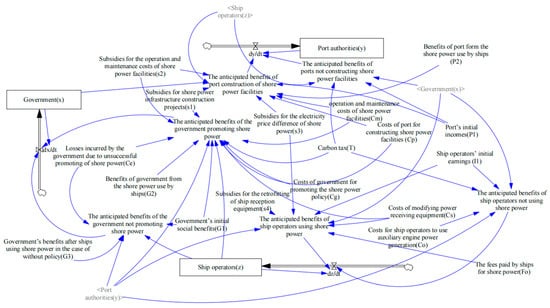
Figure 3.
System dynamics model.
4. Model Simulation Analysis
4.1. Data Source
This empirical analysis is conducted through a case study of China, which has committed to reducing carbon emissions through various means and is actively advocating for the implementation of shore power systems. According to Qu [56], a survey conducted at 13 selected Chinese ports indicates that the shore power system installations have achieved a market share of 73%, despite the average utilization rate being only 17%. Consequently, it is deemed appropriate to establish the initial propensities of the three designated stakeholders toward the advocacy of shore power promotion as ,, and .
The remaining practical parameters are gathered from the ports of Shanghai and Ningbo [57,58], which rank as the top two busiest ports in China and are considered representative. The shore power system is evaluated using a singular high-voltage shore power system (HVSC) installed at a berth with a capacity of 100,000 tons. A singular HVSC system incurs a typical cost of approximately USD 1.18 million and yields environmental benefits valued at approximately USD 0.42 million [38]. For a berth with a capacity of 100,000 tons, equipped with an HVSC system, and assuming exclusive utilization of shore power by all docked vessels, the peak power consumption may attain up to 14 million kWh. To more accurately reflect plausible scenarios, assuming the power consumption amounts to 10 million kWh, and assessing a shore power usage fee of 0.071 USD/kWh to ship operators, this scenario would culminate in an economic benefit of approximately USD 0.71 million. The current average carbon tax rate is around 37.8 USD/ton [12], and with an auxiliary engine power generation emission factor of 719 g/kWh, the carbon tax payable would be approximately USD 0.272 million. In the following analysis, the parameter units are in million USD. Unless otherwise specified, the input parameter values are the same as those shown in Table 5.
Table 5.
The value of parameters.
4.2. Static and Singular Policy Approach
An analysis through simulation of the evolutionary game model was conducted, which involved the formulation of two scenarios: the first scenario incorporated only the subsidy policy (T = 0), whereas the second scenario integrated solely the carbon tax policy (, , , and ). Concurrently, a sensitivity analysis was executed for both the subsidy policy and the carbon tax policy, with adjustments being implemented at a 10% variation. The investigation assesses the influence of various policies on the three primary stakeholders engaged in the advancement of shore power, as depicted in Figure 4, Figure 5, Figure 6 and Figure 7.
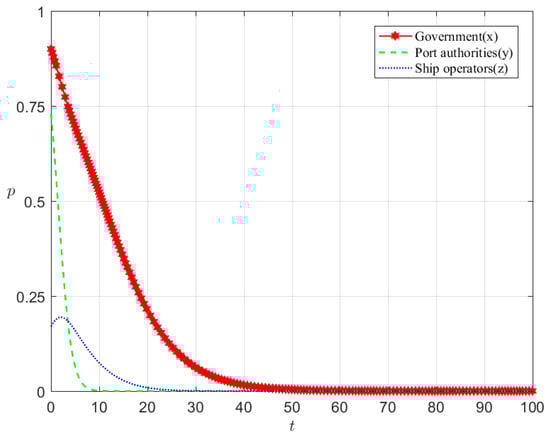
Figure 4.
The single subsidy policy ( = 0).
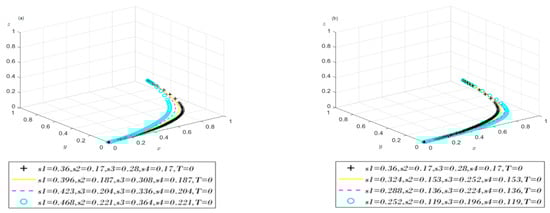
Figure 5.
The evolution of tripartite behavior under static subsidy policy. (a) Increase in subsidy. (b) Reduction in subsidy.
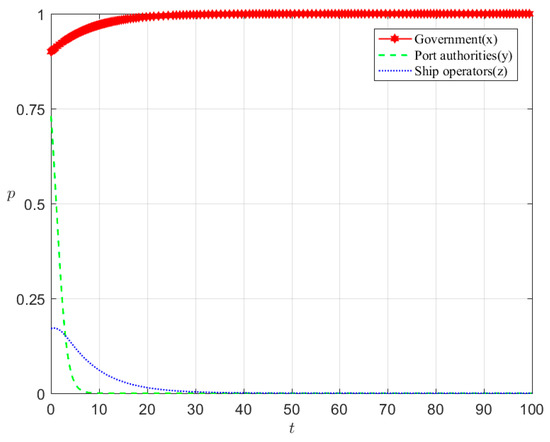
Figure 6.
The single carbon tax policy (, , , and ).
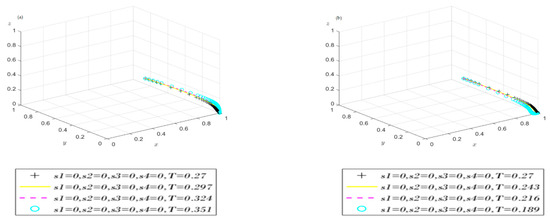
Figure 7.
The evolution of tripartite behavior under static carbon tax policy. (a) Increase in carbon tax. (b) Reduction in carbon tax.
4.2.1. Subsidy-Only Approach
As demonstrated by Figure 4, the evolutionary trajectories of port authorities and ship operators gradually converge and stabilize at zero over time. This implies that all three entities adopt a passive strategy. Consequently, within the singular framework of the subsidy policy, the resulting evolutionarily stable state of the stakeholder game in promoting shore power is suboptimal.
The port authority exhibits the most significant rate of development, contrasting with the government, which evolves at the least rapid pace. The primary reason for this disparity lies in the fact that the port authority bears the majority of expenses related to the development, operation, and maintenance of the infrastructure essential for promoting shore power. Although fixed subsidies initially serve as incentives for the port authority, this financial support ultimately becomes inadequate over time to mitigate the government’s long-term economic responsibilities. Additionally, the profitability of shore power facilities largely depends on the level of engagement by ship operators. This reliance poses challenges for the port authority in maintaining high operational costs in the short term, precipitating a rapid decision to disengage.
For ship operators, the initial significant involvement of the government, alongside the comparatively considerable participation of the port authority in the early stages of subsidy policies, confers beneficial short-term economic gains for the implementation of shore power. Nonetheless, as the provider of shore power infrastructure, the port authority’s reduced participation results in a decline in the quality or availability of shore power services. The governmental subsidies are insufficient to thoroughly offset costs, consequently diminishing the likelihood of ship operators adopting shore power solutions. This elucidates why the developmental trajectory of ship operators showcases an initial rise followed by a subsequent decline. Finally, the financial burden associated with extended subsidization deters the government from continuing the promotion of shore power development. However, given that the government must balance multiple objectives, including environmental protection, fiscal stability, and socio-economic advancement, its decision to disengage is carried out with increased caution. Consequently, the government’s developmental pace is the slowest.
To further substantiate the significance of subsidies, a sensitivity analysis was conducted over an interval of [−30%, +30%]. As depicted in Figure 5, irrespective of whether the subsidy is augmented or reduced, this modification solely influences the evolutionary rates of the three parties without altering the ultimate evolutionary outcome. From a theoretical standpoint, reliance solely on subsidy adjustments is inadequate to achieve the desired effect. An increase in subsidies imposes a fiscal burden on the government, rendering the policy unsustainable, whereas a decrease in subsidies diminishes the incentive effect.
4.2.2. Carbon Tax-Only Approach
Implementing a carbon tax in lieu of subsidies as the promotional strategy, it is evident from Figure 6 that in contrast to the subsidy policy, the government’s evolutionary outcome under the carbon tax policy transitions from 0 to 1. This occurs because the carbon tax policy does not impose any adverse financial burden on the government; rather, it generates fiscal revenue. This positive economic feedback mechanism facilitates the government’s sustained high level of participation over the long term. Furthermore, the evolutionary trajectory of ship operators alters from an initial increase followed by a decline to a consistent decline. This is attributable to the carbon tax amount being comparatively smaller than the subsidy, which fails to significantly increase the cost of utilizing traditional fuel. Consequently, ship operators ultimately opt not to modify their existing strategy, resulting in a downward trend in participation from the outset. For port authorities, although their behavior is directly constrained by the carbon tax, the penalty for not constructing shore power facilities is insufficient to offset the high construction costs, making it difficult to drive their enthusiasm. Moreover, the lack of increased demand for shore power usage from ship operators further weakens the port authorities’ revenue expectations.
Figure 7 illustrates that variations in the carbon tax, whether incremental or decremental, do not modify the evolutionary outcomes for the three entities involved. This observation parallels the sensitivity analysis of the singular subsidy policy, indicating that any single policy framework is insufficient to influence the ultimate evolutionary trajectory of the system.
4.3. Static and Dual Policy Approach
During the phase of shore power development, a singular static incentive policy implemented by the government proves inadequate in harmonizing the interests of port authorities and ship operators. Conversely, a static reward-and-punishment policy is proposed to optimize collective behavior and systematically examine the influence of key factors on group dynamics, as demonstrated in Figure 8 and Figure 9.
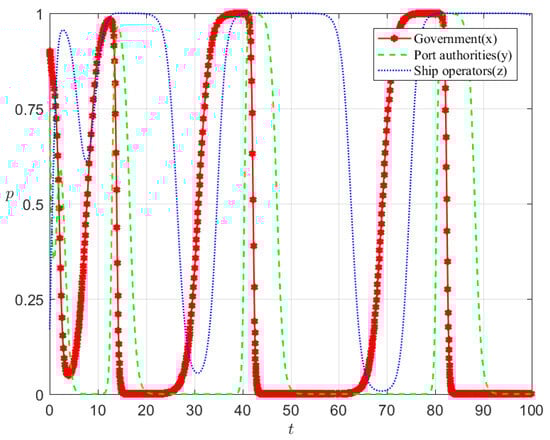
Figure 8.
The static and dual policy.
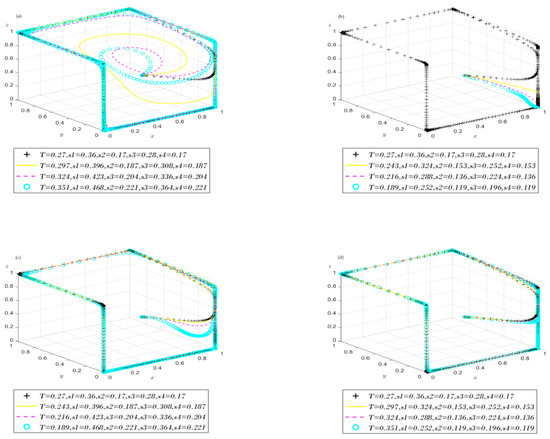
Figure 9.
The evolution of tripartite behavior under static reward-and-penalty policy. (a) Simultaneous increase in subsidy and carbon tax. (b) Simultaneous reduction in subsidy and carbon tax. (c) Increase in subsidy and reduction in carbon tax. (d) Reduction in subsidy and in-crease in carbon tax.
Comparing Figure 4 and Figure 6, Figure 8 demonstrates that the implementation of a combined incentive and punitive policy substantially elevates the likelihood of shore power adoption within the market in the short term. Unfortunately, over the long term, the evolutionary trajectories of port authorities and ship operators exhibit fluctuations in response to alterations in governmental strategies. The rationale is that within a framework of dual policies, the financial disbursements through government subsidies surpass the income derived from carbon taxes, thereby exerting fiscal pressure on the government. This pressure becomes increasingly notable as the expansion in the scale of shore power promotion demands that the government assumes higher subsidy expenditures. Such fiscal stress necessitates periodic adjustments in the government’s promotional endeavors. Port authorities encounter substantial costs associated with infrastructure development, operational procedures, and maintenance, whereas ship operators are obligated to upgrade equipment, incurring further financial burdens. These elements lead to a swift adjustment in the strategic approaches of port authorities and ship operators in reaction to policy modifications. Moreover, market actors generally display a deferred response to policy alterations, necessitating time to discern policy signals. This temporal lag elucidates the inconsistency observed in the fluctuation cycles among the three entities. In essence, under a static and dual policy framework, the three parties are unable to attain an optimal equilibrium strategy through repeated strategic interactions. However, relative to a singular policy, the static reward-and-penalty approach compels port authorities and ship operators to accord greater significance to the shore power promotion initiative prescribed by the government.
Figure 9a illustrates that a concurrent increase in subsidies and carbon taxes alters the evolutionary rates of the three parties; however, the system persists in a fluctuating state, suggesting the absence of an optimal strategy for any party. Figure 9b indicates that when both subsidies and carbon taxes are diminished by 10%, the system shifts from a fluctuating state to a stable state, wherein an optimal mixed strategy (1, 0, 0.23) emerges. A continuous reduction exceeding 20% results in the occurrence of a stable strategy (1, 0, 0). Figure 9c,d reveal that variations, whether subsidies rise while carbon taxes fall or vice versa, exert minimal influence on the system’s evolution.
Thus, under the static reward-and-punishment policy, while a concurrent reduction in subsidies and carbon taxes can transition the system from a fluctuating to a stable state, this stability is predicated on low enthusiasm levels, potentially impeding the promotion and development of shore power. The fundamental reason is that the simultaneous reduction in subsidies and carbon taxes attenuates the strength of policy intervention. Due to insufficient incentives and diminished economic pressure, stakeholders are inclined towards more conservative and stable strategies.
While the static reward-and-penalty policy offers certain incentives for the advancement of shore power systems, the preceding analysis indicates that it either results in considerable system fluctuations across various scenarios or descends into a stable state characterized by minimal enthusiasm due to inadequate incentives. Static policies demonstrate a lack of flexibility and encounter challenges in adapting to the dynamic alterations in stakeholder interests and the long-term developmental requirements of the system. Consequently, it is imperative to reform the policy framework to fine-tune the intensity of subsidies and carbon taxes in response to the evolving behaviors of stakeholders.
4.4. Dynamic and Dual Policy Approach
As outlined in the preceding analysis, it has been established that the government is encountering escalating fiscal pressures. To address this predicament, the present study will posit that subsidies allocated to port authorities and ship operators are characterized by a linear inverse correlation with the likelihood of participants adopting proactive strategies. Furthermore, to alleviate the disproportionate impact of carbon taxes on social welfare, at the same time, augmenting the economic burden associated with the non-utilization of shore power serves to foster a shift towards environmentally sustainable practices. This study will also assert that the carbon taxes imposed on port authorities and ship operators exhibit a linear inverse correlation with the probability of these participants adopting proactive strategies. Referring to previous literature [61,62], we define , , , , , and as auxiliary variables, as detailed below.
The substitution of Equations (14)–(19) into the payoff matrix yields the evolutionary trajectories of the three parties across three distinct dynamic mechanisms of reward and punishment. Additionally, the influence of critical factors on group dynamics is illustrated in Figure 10, Figure 11, Figure 12, Figure 13, Figure 14 and Figure 15.
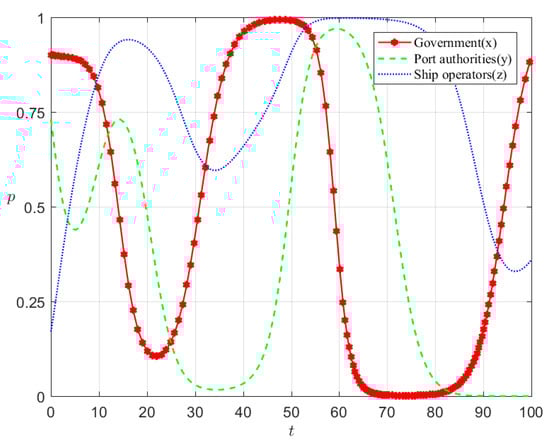
Figure 10.
The static subsidy and dynamic carbon tax policy.
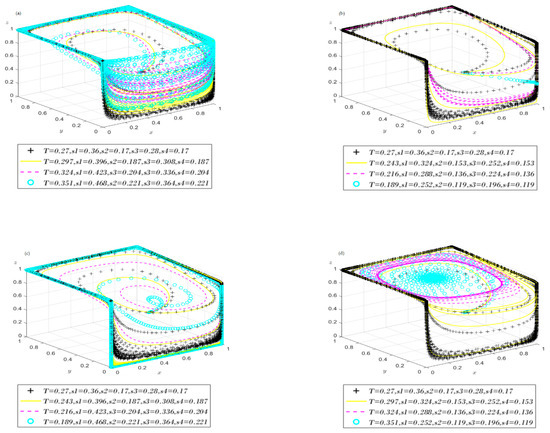
Figure 11.
The evolution of tripartite behavior under the static subsidy and dynamic carbon tax policy. (a) Simultaneous increase in subsidy and carbon tax. (b) Simultaneous reduction in subsidy and carbon tax. (c) Increase in subsidy and reduction in carbon tax. (d) Reduction in subsidy and in-crease in carbon tax.
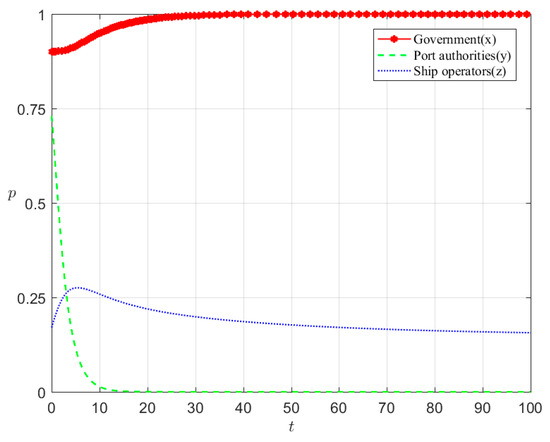
Figure 12.
The dynamic subsidy and static carbon tax policy.
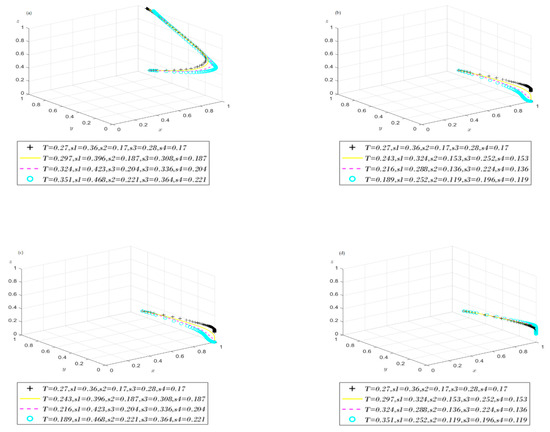
Figure 13.
The evolution of tripartite behavior under the dynamic subsidy and static carbon tax policy. (a) Simultaneous increase in subsidy and carbon tax. (b) Simultaneous reduction in subsidy and carbon tax. (c) Increase in subsidy and reduction in carbon tax. (d) Reduction in subsidy and in-crease in carbon tax.
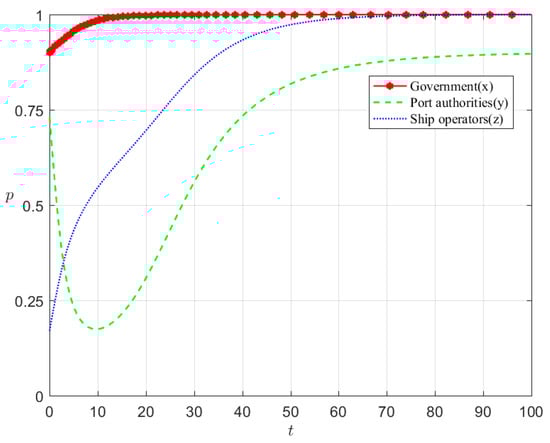
Figure 14.
The dynamic subsidy and dynamic carbon tax policy.
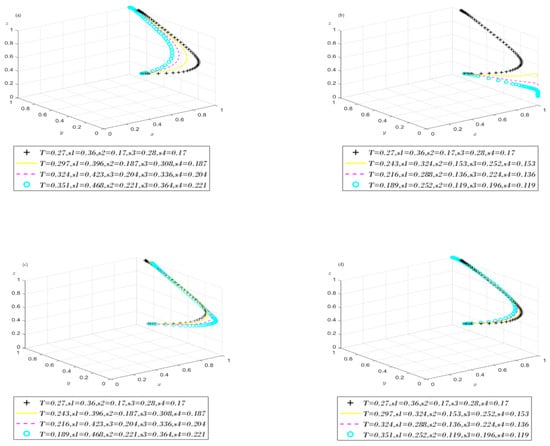
Figure 15.
The evolution of tripartite behavior under the dynamic subsidy and dynamic carbon tax policy. (a) Simultaneous increase in subsidy and carbon tax. (b) Simultaneous reduction in subsidy and carbon tax. (c) Increase in subsidy and reduction in carbon tax. (d) Reduction in subsidy and in-crease in carbon tax.
4.4.1. Static Subsidy and Dynamic Carbon Tax Policy
Figure 10 demonstrates that under the implementation of static subsidies and a dynamic carbon tax policy, the evolutionary trajectory of the system exhibits frequent oscillations between 0 and 1 across various periods. These fluctuations manifest in a sequence involving the government, port authorities, and ship operators. This phenomenon arises because static subsidies exert ongoing financial pressure on local governments, while revenues from the dynamic carbon tax mechanism diminish as port authorities and ship operators adopt proactive measures. Consequently, the financial burden on the government to promote shore power increases, prompting the government to refrain from advocating for shore power when the market performs optimally to minimize costs. Conversely, once promotion ceases, port authorities and ship operators resort to passive strategies attributable to the withdrawal of subsidies and carbon tax exemptions. As the shore power market underperforms, the government reinitiates efforts towards its development, thereby inducing cyclical fluctuations. This pattern parallels the outcomes observed under the antecedent static reward-and-penalty policy. It suggests that the introduction of a dynamic carbon tax policy is insufficient to alter the system’s fluctuating state, entrapping the three entities in a continuous cycle of strategic repetition and uncertainty.
Figure 11 illustrates the dynamics of strategic interactions through sensitivity analysis. In Figure 11a,c, the evolutionary trajectories of the three entities display considerable oscillatory behavior, failing to attain a state of stability. Conversely, in Figure 11b, a 30% reduction in both subsidies and carbon taxes results in the convergence of the three entities to the mixed strategy (1, 0, 0.3). This suggests that the static nature of subsidies and their reduction mitigate the government’s fiscal responsibilities in promoting shore power while sustaining its commitment, consistent with conclusions previously reached. The diminution of both subsidies and carbon taxes diminishes the efficacy of the incentive and sanction frameworks, resulting in a diminished degree of overall participation within the system. In Figure 11d, a 30% reduction in subsidies combined with a 30% increase in carbon taxes leads to the convergence of the parties to the mixed strategy (0.44, 0.49, 0.96). This outcome arises because the static subsidy and dynamic carbon tax approach ensures the government’s initial resolve through subsidy reduction. Concurrently, the augmentation of carbon taxes fortifies the punitive mechanism, markedly improving the engagement of ship operators and exerting particular constraints on port authorities. However, this does not completely rectify the attenuation of the incentive policy. Furthermore, the potency of the carbon tax’s punitive mechanism is contingent upon the strategic decisions of port authorities, ultimately resulting in the mixed strategy (0.44, 0.49, 0.96) after iterative interactions.
4.4.2. Dynamic Subsidy and Static Carbon Tax Approach
As depicted in Figure 12, the implementation of dynamic subsidies coupled with static carbon taxation results in the convergence of the system’s evolutionary trajectory to the coordinates (1, 0, 0.15). This signifies that while dynamic subsidies and static carbon tax measures effectively incentivize governmental promotion of shore power and partially assist ship operators in adopting shore power, their efficacy in stimulating port authorities to construct shore power facilities is considerably constrained. One probable explanation is that port authorities are apprehensive about the substantial investment required for the construction of shore power facilities, particularly due to the uncertainties linked with the dynamic subsidy policy. When a mere minority of ship operators elect to utilize shore power (z = 0.17), the return on investment for the ports becomes protracted or potentially negative. Thus, within the framework of the dynamic subsidy and static carbon tax policy, a proclivity among ship operators to abstain from utilizing shore power results in port authorities encountering construction costs that surpass the government’s carbon tax costs. Consequently, this diminishes their incentive to invest in the development of shore power infrastructure.
In Figure 13c,d, the evolutionary trajectories of the three parties exhibit no significant variance. Conversely, in Figure 13a, a 30% enhancement in both subsidies and carbon taxes leads the three parties to converge towards a pure strategy (1, 1, 1). This implies that, relative to antecedent policies, the dynamic subsidy in conjunction with a static carbon tax policy can facilitate an optimal outcome for system evolution, conditional upon the government’s reward and punitive measures reaching a sufficiently elevated intensity. In Figure 13b, a 10% decrement in both subsidies and carbon taxes results in a transition from a mixed strategy (1, 0, 0.15) to a pure strategy (1, 0, 0). This indicates that the 10% reduction in subsidies and carbon taxes precisely precipitates the critical juncture at which ship operators transition from partial participation (mixed strategy) to full withdrawal (pure strategy).
In conclusion, within the framework of the reward-and-penalty policy, it is observed that a dynamic subsidy policy can efficaciously mitigate the fluctuations in the curves, and when the intensity of rewards and penalties is elevated, an optimal outcome can be realized.
4.4.3. Dynamic Subsidy and Dynamic Carbon Tax Policy
As depicted in Figure 14, the system’s evolutionary trajectory ultimately achieves a state of equilibrium at (1, 0.9, 1), signifying that the implementation of dynamic subsidies and a dynamic carbon tax policy attains the optimal projected outcomes. This is attributable to the capacity of dynamic subsidies to effectively mitigate governmental financial burdens, while the dynamic carbon tax increases the pertinence of carbon taxation to decision-making processes. Consequently, this encourages port authorities and ship operators to exhibit a greater propensity towards the development and utilization of shore power to alleviate tax liabilities. The primary factor contributing to the initial decrease in port authority engagement in the early phases of the game is the insufficient participation by ship operators, which results in a shortfall in the expected returns from port authority investments in shore power infrastructure. Following multiple iterations of strategic interactions, there was a marked increase in the ship operators’ involvement, influenced by the aforementioned policies, thereby enhancing the port authority’s benefits derived from shore power development. As a result, the level of participation by the port authorities also experienced an increase, ultimately stabilizing at 0.9.
Sensitivity analyses conducted within the framework of a dynamic subsidy and carbon tax approach suggest that concurrent increases, or an increase in one measure and a decrease in the other, will exert minimal influence on the stable points of system evolution, as depicted in Figure 15a,c,d. Conversely, a simultaneous decrease will produce outcomes akin to those observed under the previously examined dynamic subsidy and static carbon tax policy, leading the system to transition from an optimal state to a less favorable state, as shown in Figure 15b.
This suggests that the incentives and punishment established by dual policies are pivotal in the evolution of shore power promotion. To attain long-term stability within the shore power system through dynamic adaptations, it is imperative to maintain a foundational level of incentives and punishment in policy formulation, thereby preventing shortcomings in the promotion of shore power.
5. Research Findings and Discussion
Empirical evidence suggests that stakeholders generally act based on their individual interests, leading to differing degrees of enthusiasm for the progression of shore power. The government must assume the mantle of social responsibility and actively engage in addressing global climate challenges. Consequently, the government frequently demonstrates the highest level of initiative and assumes a predominant role in the advocacy of shore power. This is substantiated by the observation that, as depicted in both Figure 4 and Figure 14, the government’s evolution rate towards 0 is the most gradual, whereas its evolution rate towards 1 is the most accelerated.
In contrast to governmental entities, ports and ship operators generally prioritize their economic interests while according less emphasis to environmental advantages. Ports face substantial upfront costs for shore power infrastructure (USD 1.2–7.0 million for HVSC [38,63]), with government subsidies covering only 30–50% of construction [4,57], making short-term profitability challenging). This explains why, as depicted in Figure 4, the rate of evolution for ports is the most accelerated. Within the shipping sector, the retrofitting costs for container ships exceeding 100,000 DWT range from USD 0.3 million to USD 0.75 million [64]. In the absence of electricity price subsidies, shore power (0.15 USD/kWh [24]) demonstrates a negligible cost advantage compared to conventional fuel-based power generation (0.18 USD/kWh [24]). Again, as shown in Figure 4, the ship operator exhibits a faster evolutionary rate than the government.
The developmental trajectories of ports and ship operators, as shown in Figure 4, Figure 12, and Figure 14, do not follow a pattern that is either consistently increasing or decreasing under scenarios characterized by stable strategies. This phenomenon stems from the interdependent economic calculus: the ship operator’s profitability from shore power utilization hinges on port infrastructure deployment, while the port requires sufficient vessel demand to justify infrastructure investments (“chicken-and-egg” dilemma). As previously mentioned, the port tends to develop at a relatively slower rate, as shown in Figure 14, highlighting the necessity to prioritize the involvement of port authorities in the establishment of shore power infrastructure. To address this deadlock, the European Directive 2014/94/EU stipulates that all ports must have designated shore power supply capabilities by 31 December 2025 [65].
Evolutions of policy scenarios suggest that no singular policy framework, neither subsidies nor carbon taxes, will be adequate to effectively promote the extensive adoption of shore power technology. An augmentation of subsidy levels by 30%, as evidenced in Figure 4 and Figure 5b, still fails to modify the evolutionary trajectory of the system, while singular carbon tax policies fail to effectively influence the behavioral strategies of ports and ship operators, as evidenced in Figure 5 and Figure 6. Actually, as noted by Köppl and Schratzenstaller, carbon tax policies should focus on broader policy mixes, integrating various policy interventions such as subsidies [66]. On the other hand, the integrated reward-and-punishment policy framework is rather complicated but demonstrates greater success. Our analysis of Figure 4, Figure 6, and Figure 8 reveals that policies combining subsidies and carbon taxes significantly enhance short-term shore power adoption rates. However, the evolutionary system exhibits long-term instability due to structural fiscal imbalances: government subsidy expenditures consistently exceed carbon tax revenues (), prompting iterative strategy recalibrations.
The introduction of the dynamic approach gradually mitigates the limitations inherent in the static model. Within the framework of a static subsidy and dynamic carbon taxation policy, the dynamic carbon tax mechanism aligns taxation intensity with the strategic behaviors of ports and shipping entities. Notably, increased utilization of shore power is associated with reduced tax rates. This policy facilitates stakeholder participation more efficaciously than static carbon taxation. Nonetheless, similar to the static incentive-and-penalty policy, it intensifies government fiscal obligations, thus perpetuating the instability of the evolutionary system, as depicted in Figure 10. To address this issue, implementing a 30% decrease in baseline subsidies combined with a 30% augmentation of baseline carbon taxes stabilizes the system, achieving participation rates of 49% for port authorities and 96% for ship operators, as illustrated in Figure 11d. In contrast, for the case of dynamic subsidies and a static carbon tax, the dynamic subsidy mechanism proves to be effective in mitigating governmental fiscal burdens and in dampening systemic volatility. However, an improvement in shore power market performance exhibits an inverse correlation with the intensity of subsidies, and favorable market conditions typically lead to a reduction in governmental subsidies. Therefore, it is only when both baseline subsidies and the carbon tax are augmented by 30%, thus sustaining adequate incentive levels, that the participation rates of port authorities and ship operators can reach a stabilization point near 100%, as illustrated in Figure 11a.
Finally, the dynamic subsidy and dynamic carbon tax policy yields superior outcomes, with participation rates of ports and ship operators approaching 100% without modifications to baseline values. This outcome is fundamentally attributed to the improved correlation between policy measures and decision-making behavior within dynamic reward-and-punishment frameworks. Furthermore, as illustrated in Figure 15b, when the baselines for subsidies and carbon tax under dynamic policies are reduced by 10%, there is a noticeable decline in overall system participation. In accordance with the parameters set in this paper, it is imperative that shore power construction subsidies and ship retrofit subsidies are upheld at a minimum of 30% and 60%, respectively, and that the carbon tax rate is maintained at or above the global average of USD 38. This highlights the indispensability of sustaining baseline levels of incentives and penalties to ensure the extensive adoption of shore power.
6. Conclusions
This paper constructs an evolutionary game model among the government, port enterprises, and ship operators based on evolutionary game theory and system dynamics models and combines it with the actual development in China for simulation analysis. The results reveal that each stakeholder typically acts according to their own interests, resulting in varying levels of enthusiasm and explaining the differing evolutionary rates among the three parties. Additionally, the participation rates of ports and ship operators in the shore power market are significantly influenced by economies of scale, exhibiting a nonlinear development trend.
The introduction of static reward–punishment mechanisms perturbs the convergence of populations toward negative strategies to some extent. However, the three parties predominantly exhibit periodic behavioral patterns, failing to achieve stable equilibrium. The research scenario of dynamic mechanisms indicates that adjusting subsidy and tax levels based on stakeholder behavior is critical for long-term success. This finding resonates with Wang et al. [67], extending the impact of reward-and-punishment mechanisms on environmental pollution control to the context of shore power promotion.
However, the practical scenarios pertaining to the promotion of shore power could be more complicated, and this study acknowledges its limitations. Firstly, the selection of initial values constitutes a critical determinant influencing strategic choices and mechanism evaluations, thereby exerting a decisive influence on the outcomes. As the promotion of shore power continues to explore appropriate benchmarks, this paper establishes variable values and performs simulations grounded in diverse policy documents and research studies. The parameter settings unavoidably encompass a degree of subjectivity. Secondly, the stakeholders considered within this study are confined to government entities, port authorities, and ship operators, whereas in reality, additional stakeholders such as power companies and shore power equipment manufacturers also hold substantial influence. Future research might delve into the responsibilities of these supplementary stakeholders from broader perspectives, thus propelling the shore power market towards a more advanced phase.
Author Contributions
Conceptualization, Y.W. and T.K.; methodology, T.Z.; software, T.Z.; validation, C.H., T.K. and Y.W.; formal analysis, C.H. and T.Z.; investigation, C.H. and T.Z.; resources, T.K. and Y.W.; data curation, T.Z.; writing—original draft preparation, T.Z.; writing—review and editing, T.K. and Y.W.; visualization, T.Z.; supervision, T.K. and Y.W.; project administration, C.H.; funding acquisition, Y.W. All authors have read and agreed to the published version of the manuscript.
Funding
This research was funded by the Natural Science Foundation of Ningbo, China (Grant No. 2021J111) and the “Innovation Yongjiang 2035” Key R&D Programme (Grant No. 2024H032).
Data Availability Statement
The data that support the findings of this study are available from the corresponding author upon reasonable request.
Conflicts of Interest
The authors declare no conflict of interest.
References
- EPA. Shore Power Technology Assessment at U.S. Ports. Available online: https://www.epa.gov/sites/default/files/2017-05/documents/420r17004-2017-update.pdf (accessed on 6 October 2024).
- Styhre, L.; Winnes, H.; Black, J.; Lee, J.; Le-Griffin, H. Greenhouse gas emissions from ships in ports—Case studies in four continents. Transp. Res. Part D Transp. Environ. 2017, 54, 212–224. [Google Scholar] [CrossRef]
- Williamsson, J.; Costa, N.; Santén, V.; Rogerson, S. Barriers and drivers to the implementation of onshore power supply—A literature review. Sustainability 2022, 14, 6072. [Google Scholar] [CrossRef]
- Innes, A.; Monios, J. Identifying the unique challenges of installing cold ironing at small and medium ports—The case of Aberdeen. Transp. Res. Part D Transp. Environ. 2018, 62, 298–313. [Google Scholar] [CrossRef]
- Kumar, J.; Kumpulainen, L.; Kauhaniemi, K. Technical design aspects of harbour area grid for shore to ship power: State of the art and future solutions. Int. J. Electr. Power Energy Syst. 2019, 104, 840–852. [Google Scholar] [CrossRef]
- Dai, L.; Hu, H.; Wang, Z. Is Shore Side Electricity greener? An environmental analysis and policy implications. Energy Policy 2020, 137, 111144. [Google Scholar] [CrossRef]
- Wu, L.; Wang, S. The shore power deployment problem for maritime transportation. Transp. Res. Part E Logist. Transp. Rev. 2020, 135, 101883. [Google Scholar] [CrossRef]
- Forum, I.T. Maritime Subsidies: Do They Provide Value for Money? OECD Publishing: Paris, France, 2019. [Google Scholar]
- Bullock, S.; Hoolohan, C.; Larkin, A. Accelerating shipping decarbonisation: A case study on UK shore power. Heliyon 2023, 9, e17475. [Google Scholar] [CrossRef]
- Li, X.; Kuang, H.; Hu, Y. Using system dynamics and game model to estimate optimal subsidy in shore power technology. IEEE Access 2020, 8, 116310–116320. [Google Scholar] [CrossRef]
- Marron, D.B.; Toder, E.J. Tax policy issues in designing a carbon tax. Am. Econ. Rev. 2014, 104, 563–568. [Google Scholar] [CrossRef]
- Bank, W. State and Trends of Carbon Pricing 2022; World Bank: Washington, DC, USA, 2022. [Google Scholar]
- Andersson, J.J. Carbon taxes and CO2 emissions: Sweden as a case study. Am. Econ. J. Econ. Policy 2019, 11, 1–30. [Google Scholar] [CrossRef]
- Metcalf, G.E.; Stock, J.H. The macroeconomic impact of Europe’s carbon taxes. Am. Econ. J. Macroecon. 2023, 15, 265–286. [Google Scholar] [CrossRef]
- Li, H.; Luo, N. Will improvements in transportation infrastructure help reduce urban carbon emissions?—Motor vehicles as transmission channels. Environ. Sci. Pollut. Res. 2022, 29, 38175–38185. [Google Scholar] [CrossRef]
- Tseng, P.-H.; Pilcher, N. A study of the potential of shore power for the port of Kaohsiung, Taiwan: To introduce or not to introduce? Res. Transp. Bus. Manag. 2015, 17, 83–91. [Google Scholar] [CrossRef]
- Gutierrez-Romero, J.E.; Esteve-Pérez, J.; Zamora, B. Implementing Onshore Power Supply from renewable energy sources for requirements of ships at berth. Appl. Energy 2019, 255, 113883. [Google Scholar] [CrossRef]
- Winkel, R.; Weddige, U.; Johnsen, D.; Hoen, V.; Papaefthimiou, S. Shore side electricity in Europe: Potential and environmental benefits. Energy Policy 2016, 88, 584–593. [Google Scholar] [CrossRef]
- Hall, W.J. Assessment of CO2 and priority pollutant reduction by installation of shoreside power. Resour. Conserv. Recycl. 2010, 54, 462–467. [Google Scholar] [CrossRef]
- Spengler, T.; Tovar, B. Potential of cold-ironing for the reduction of externalities from in-port shipping emissions: The state-owned Spanish port system case. J. Environ. Manag. 2021, 279, 111807. [Google Scholar] [CrossRef]
- Merkel, A.; Nyberg, E.; Ek, K.; Sjöstrand, H. Economics of shore power under different access pricing. Res. Transp. Econ. 2023, 101, 101330. [Google Scholar] [CrossRef]
- Ballini, F.; Bozzo, R. Air pollution from ships in ports: The socio-economic benefit of cold-ironing technology. Res. Transp. Bus. Manag. 2015, 17, 92–98. [Google Scholar] [CrossRef]
- Ashrafi, M.; Walker, T.R.; Magnan, G.M.; Adams, M.; Acciaro, M. A review of corporate sustainability drivers in maritime ports: A multi-stakeholder perspective. Marit. Policy Manag. 2020, 47, 1027–1044. [Google Scholar] [CrossRef]
- Yin, M.; Wang, Y.; Zhang, Q. Policy implementation barriers and economic analysis of shore power promotion in China. Transp. Res. Part D Transp. Environ. 2020, 87, 102506. [Google Scholar] [CrossRef]
- Yin, W.; Wu, S.; Zhao, X.; Shu, C.; Xiao, Y.; Ye, G.; Shi, W.; Feng, X. Shore power management for green shipping under international river transportation. Marit. Policy Manag. 2022, 49, 737–754. [Google Scholar] [CrossRef]
- Zhong, Z.; Jin, H.; Sun, Y.; Zhou, Y. Two incentive policies for green shore power system considering multiple objectives. Comput. Ind. Eng. 2024, 194, 110338. [Google Scholar] [CrossRef]
- Andor, M.; Voss, A. Optimal renewable-energy promotion: Capacity subsidies vs. generation subsidies. Resour. Energy Econ. 2016, 45, 144–158. [Google Scholar] [CrossRef]
- Chemama, J.; Cohen, M.C.; Lobel, R.; Perakis, G. Consumer subsidies with a strategic supplier: Commitment vs. flexibility. Manag. Sci. 2019, 65, 681–713. [Google Scholar] [CrossRef]
- Cohen, M.C.; Lobel, R.; Perakis, G. The impact of demand uncertainty on consumer subsidies for green technology adoption. Manag. Sci. 2016, 62, 1235–1258. [Google Scholar] [CrossRef]
- Huang, J.; Leng, M.; Liang, L.; Liu, J. Promoting electric automobiles: Supply chain analysis under a government’s subsidy incentive scheme. IIE Trans. 2013, 45, 826–844. [Google Scholar] [CrossRef]
- Jung, S.H.; Feng, T. Government subsidies for green technology development under uncertainty. Eur. J. Oper. Res. 2020, 286, 726–739. [Google Scholar] [CrossRef]
- Sheng, J.; Tang, L.; Yang, Z.; Yu, M.; Liu, X. Strategies of stakeholders’ selection of shore-to-ship power in China. Transp. Res. Part D Transp. Environ. 2023, 119, 103729. [Google Scholar] [CrossRef]
- Zhao, X.; Liu, L.; Di, Z.; Xu, L. Subsidy or punishment: An analysis of evolutionary game on implementing shore-side electricity. Reg. Stud. Mar. Sci. 2021, 48, 102010. [Google Scholar]
- Wang, S.; Qi, J.; Laporte, G. Optimal subsidy design for shore power usage in ship berthing operations. Nav. Res. Logist. 2022, 69, 566–580. [Google Scholar] [CrossRef]
- Wang, Y.; Ding, W.; Dai, L.; Hu, H.; Jing, D. How would government subsidize the port on shore side electricity usage improvement? J. Clean. Prod. 2021, 278, 123893. [Google Scholar] [CrossRef]
- Song, Z.; Tang, W.; Zhao, R.; Zhang, G. Implications of government subsidies on shipping companies’ shore power usage strategies in port. Transp. Res. Part E Logist. Transp. Rev. 2022, 165, 102840. [Google Scholar] [CrossRef]
- Chen, J.; Xiong, W.; Xu, L.; Di, Z. Evolutionary game analysis on supply side of the implement shore-to-ship electricity. Ocean Coast. Manag. 2021, 215, 105926. [Google Scholar] [CrossRef]
- Xu, L.; Di, Z.; Chen, J.; Shi, J.; Yang, C. Evolutionary game analysis on behavior strategies of multiple stakeholders in maritime shore power system. Ocean Coast. Manag. 2021, 202, 105508. [Google Scholar] [CrossRef]
- Wang, W.; Ferguson, M.E.; Hu, S.; Souza, G.C. Dynamic capacity investment with two competing technologies. Manuf. Serv. Oper. Manag. 2013, 15, 616–629. [Google Scholar] [CrossRef]
- Krass, D.; Nedorezov, T.; Ovchinnikov, A. Environmental taxes and the choice of green technology. Prod. Oper. Manag. 2013, 22, 1035–1055. [Google Scholar] [CrossRef]
- Drake, D.F.; Kleindorfer, P.R.; Van Wassenhove, L.N. Technology choice and capacity portfolios under emissions regulation. Prod. Oper. Manag. 2016, 25, 1006–1025. [Google Scholar] [CrossRef][Green Version]
- Andersen, M.S. Vikings and virtues: A decade of CO2 taxation. Clim. Policy 2004, 4, 13–24. [Google Scholar] [CrossRef]
- Martin, R.; De Preux, L.B.; Wagner, U.J. The impact of a carbon tax on manufacturing: Evidence from microdata. J. Public Econ. 2014, 117, 1–14. [Google Scholar] [CrossRef]
- Calderón, S.; Alvarez, A.C.; Loboguerrero, A.M.; Arango, S.; Calvin, K.; Kober, T.; Daenzer, K.; Fisher-Vanden, K. Achieving CO2 reductions in Colombia: Effects of carbon taxes and abatement targets. Energy Econ. 2016, 56, 575–586. [Google Scholar] [CrossRef]
- Ahmadi, Y.; Yamazaki, A.; Kabore, P. How do carbon taxes affect emissions? Plant-level evidence from manufacturing. Environ. Resour. Econ. 2022, 82, 285–325. [Google Scholar] [CrossRef]
- Mideksa, T.K. Pricing for a cooler planet: An empirical analysis of the effect of taxing carbon. J. Environ. Econ. Manag. 2024, 127, 103034. [Google Scholar] [CrossRef]
- Zhou, Y.; Fang, W.; Li, M.; Liu, W. Exploring the impacts of a low-carbon policy instrument: A case of carbon tax on transportation in China. Resour. Conserv. Recycl. 2018, 139, 307–314. [Google Scholar] [CrossRef]
- Wang, T.; Wang, X.; Meng, Q. Joint berth allocation and quay crane assignment under different carbon taxation policies. Transp. Res. Part B Methodol. 2018, 117, 18–36. [Google Scholar] [CrossRef]
- Zhen, L.; Wang, W.; Lin, S. Analytical comparison on two incentive policies for shore power equipped ships in berthing activities. Transp. Res. Part E Logist. Transp. Rev. 2022, 161, 102686. [Google Scholar] [CrossRef]
- Maestre-Andrés, S.; Drews, S.; Van den Bergh, J. Perceived fairness and public acceptability of carbon pricing: A review of the literature. Clim. Policy 2019, 19, 1186–1204. [Google Scholar] [CrossRef]
- Li, C.; Zhang, F.; Cao, C.; Liu, Y.; Qu, T. Organizational coordination in sustainable humanitarian supply chain: An evolutionary game approach. J. Clean. Prod. 2019, 219, 291–303. [Google Scholar] [CrossRef]
- Cheng, L.; Liu, G.; Huang, H.; Wang, X.; Chen, Y.; Zhang, J.; Meng, A.; Yang, R.; Yu, T. Equilibrium analysis of general N-population multi-strategy games for generation-side long-term bidding: An evolutionary game perspective. J. Clean. Prod. 2020, 276, 124123. [Google Scholar] [CrossRef]
- Friedman, D. Evolutionary games in economics. Econom. J. Econom. Soc. 1991, 59, 637–666. [Google Scholar] [CrossRef]
- Khalil, H. Nonlinear Systems, 3rd ed.; Springer: Berlin/Heidelberg, Germany, 2002. [Google Scholar]
- Shepherd, S. A review of system dynamics models applied in transportation. Transp. B Transp. Dyn. 2014, 2, 83–105. [Google Scholar] [CrossRef]
- Qu, P. To Build Good Shore Power Facilities at Ports is Essential, but Utilizing Them Effectively is Equally Important. Available online: http://paper.people.com.cn/zgnyb/html/2023-04/10/content_25976182.htm (accessed on 24 December 2024).
- Bureau, N.T. Ningbo Port Shore Power Subsidy Policy. Available online: https://www.ningbo.gov.cn/art/2023/5/10/art_1229095998_1773019.html (accessed on 13 October 2024).
- Commission, S.M.T. Yangtze River Economic Belt Ship Shore Power System Electric Facility Retrofit Implementation Plan. Available online: https://jtw.sh.gov.cn/cmsres/c4/c46985893535449982f484ff7b4f6138/0e3b95ba875147eb6d06b409074b6120.pdf (accessed on 13 October 2024).
- Li, L. Why Shore Power is Difficult to Implement on Ships. Available online: http://paper.people.com.cn/zgnyb/html/2019-01/14/content_1904217.htm (accessed on 15 December 2024).
- Cha, R. Shore Power at North Bund Officially Electrified: Green Port Reduces Emissions by 9,607 Tons Annually. Available online: https://www.shanghai.gov.cn/nw4411/20231124/026bcf65bbb84ad3a3865cbcffcda4b8.html (accessed on 24 December 2024).
- Shan, S.-n.; Zhang, Z.-c.; Ji, W.-y.; Wang, H. Analysis of collaborative urban public crisis governance in complex system: A multi-agent stochastic evolutionary game approach. Sustain. Cities Soc. 2023, 91, 104418. [Google Scholar] [CrossRef]
- Shan, S.-n.; Duan, X.; Ji, W.-y.; Zhang, T.-t.; Li, H. Evolutionary game analysis of stakeholder behavior strategies in ‘Not in My Backyard’ conflicts: Effect of the intervention by environmental Non-Governmental Organizations. Sustain. Prod. Consum. 2021, 28, 829–847. [Google Scholar] [CrossRef]
- Li, L. Green Shipping Requires the Promotion of Shore Power. Available online: https://news.bjx.com.cn/html/20180606/903638.shtml (accessed on 16 December 2024).
- GloMEEP. Shore Power. Available online: https://glomeep.imo.org/technology/shore-power (accessed on 27 December 2024).
- Zis, T.P. Prospects of cold ironing as an emissions reduction option. Transp. Res. Part A Policy Pract. 2019, 119, 82–95. [Google Scholar] [CrossRef]
- Köppl, A.; Schratzenstaller, M. Carbon taxation: A review of the empirical literature. J. Econ. Surv. 2023, 37, 1353–1388. [Google Scholar] [CrossRef]
- Wang, H.; Cai, L.; Zeng, W. Research on the evolutionary game of environmental pollution in system dynamics model. J. Exp. Theor. Artif. Intell. 2011, 23, 39–50. [Google Scholar] [CrossRef]


Disclaimer/Publisher’s Note: The statements, opinions and data contained in all publications are solely those of the individual author(s) and contributor(s) and not of MDPI and/or the editor(s). MDPI and/or the editor(s) disclaim responsibility for any injury to people or property resulting from any ideas, methods, instructions or products referred to in the content. |
© 2025 by the authors. Licensee MDPI, Basel, Switzerland. This article is an open access article distributed under the terms and conditions of the Creative Commons Attribution (CC BY) license (https://creativecommons.org/licenses/by/4.0/).