Abstract
As China’s marine economy and green high-quality development strategy both progress, traditional marine crab farming is reaching its capacity limits. In response, the land-based aquaculture farming model for saline–alkali crabs has emerged, offering new opportunities for the industry. Simultaneously, consumer demand for specialty aquatic products is rising, with growing preferences for products of varying quality and distinctive flavors. To remain competitive, developing quality and flavor differentiation strategies that align with market structures is essential. In this paper, a sequential game-theoretic model is constructed to capture supplier behavior under different market conditions while incorporating consumer heterogeneity and cost structures. The paper examines how flavor preference, quality preference, and market segmentation shape supplier strategies, focusing particularly on the interaction between market entry and segmentation under geographic and cultural influences. The model incorporates consumer utility functions, search costs, and quality investment costs, allowing equilibrium strategies to be derived and compared across scenarios. By incorporating information search costs and technology investment, this paper analyzes optimal pricing and quality decisions in order to inform effective market entry strategies. In addition, the paper explores how the timing of entry affects product quality improvements and price competition, highlighting the evolving acceptance of new products by consumers. In coastal markets, suppliers must prioritize consolidating their presence and leveraging brand equity in order to enhance pricing power. In contrast, emerging markets require accelerated penetration through product differentiation and improved information transparency. This paper proposes an integrated approach to optimizing pricing and product strategies, providing firms with precise market encroachment and competitive strategies that can enhance their market share and longterm competitiveness.
1. Introduction
As China’s marine economy and green development advance, traditional crab supplies face capacity limits due to shrinking areas and resource constraints, which require new farming regions in order to boost production [1]. Saline–alkali land farming adopts a land-based aquaculture model, leveraging unique water conditions for artificial breeding and offering new growth opportunities for the crab industry. Inland saline–alkali farming significantly alters the flavor compounds of aquatic products, giving crabs a distinctive quality and flavor [2]. Compared to seawater-farmed crabs, those from saline–alkali land farming exhibit more substantial regional characteristics and enhanced market differentiation. Given this emerging production model, it is crucial to understand how the unique quality and flavor profiles of saline–alkali crabs shape supplier strategies in competitive markets. Inland saline–alkali farming alleviates spatial constraints on marine aquaculture and attracts niche consumer segments due to its eco-friendly approach and unique flavor [3]. The Marine Crab for Saline–Alkali Land team at Ningbo University has developed a comprehensive system covering seedling desalination, intermediate cultivation, transportation, and water quality management [4]. This system has been successfully deployed in Henan, Yanjin, Ningxia, and Inner Mongolia, enabling large-scale saline–alkali crab farming [5,6,7].
Saline–alkali land is typically characterized by harsh ecological conditions and low agricultural productivity. Transforming such land for aquaculture can significantly enhance its economic value, preventing the land from being underutilized or used inefficiently. Improving water quality, regulating salinity, and using adaptive seedling cultivation techniques have effectively addressed the challenges of crab farming in saline–alkali environments. The introduction of advanced aquaculture facilities and techniques has further boosted production capacity, accelerating the industrialization of saline–alkali aquaculture. Crabs and other aquatic products grown in saline–alkali environments demonstrate distinct and recognizable flavor characteristics compared to those farmed in marine conditions. Specifically, aquatic products produced through saline–alkali aquaculture are characterized by higher umami intensity [8,9]. For example, Scylla serrata raised in low-salinity inland waters not only retain a balanced profile of total and essential amino acids but also exhibit slightly enhanced sweetness and umami in their edible tissues [10]. Studies on Trichiurus lepturus have shown that short-term exposure to low salinity conditions alters nonvolatile flavor compounds, with the highest umami intensity observed at a salinity of 8% [11]. Furthermore, research has shown that a dietary cholesterol level of 1.00% increases the concentrations of flavor compounds in Portunus trituberculatus [12]. These findings underscore the potential for flavor differentiation between crabs from saline–alkali and marine environments, providing a sensory basis for consumer preference and market segmentation.
While marine crabs maintain stable quality, saline–alkali farming necessitates stringent water quality management and advanced techniques in order to ensure product consistency [1]. Unlike the relatively stable marine environment, saline–alkali conditions are inherently harsher and less predictable, requiring continuous monitoring and precise adjustment of water parameters. High salinity and alkalinity require precise environmental control to promote healthy growth with elevated levels of protein and fatty acids, including optimized diets and strict environmental management. These challenges make saline–alkali crab farming more technologically demanding, yet also provide greater opportunities for quality differentiation through targeted interventions. Research has demonstrated that crabs cultured in high-salinity conditions possess higher nutritional value than those raised in low-salinity environments [13]. Domestication plays a vital role in quality improvement, with studies indicating that at least one month of acclimatization is necessary for significant enhancement [14]. The ability to manipulate environmental factors in saline–alkali systems allows for more deliberate quality control, offering a feasible path for premium product development. Although saline–alkali farming has progressed, further optimization in water quality management, feed formulation, and disease prevention is still required to realize improved product quality [15].
Saline–alkali aquaculture is not limited to crab farming. In the Hexi Corridor, Yellow River estuary, and Xinjiang, species such as Litopenaeus vannamei, Larimichthys crocea, and salmon have been successfully cultivated, establishing regionally specialized industries [16]. Notably, Eriocheir sinensis from the Yellow River estuary has obtained Agricultural Geographical Indication certification and is among the leading aquatic product brands in China [17]. These examples demonstrate the technological feasibility and market potential of saline–alkali aquaculture, providing new directions for the development of inland aquaculture. In light of these developments, this study introduces a hybrid market scenario to reflect the ongoing integration of coastal and inland markets enabled by advancements in logistics and e-commerce.
Although saline–alkali crab possesses quality and flavor advantages, its market competitiveness is influenced by consumer preferences and supplier strategies. First, consumer demand for quality and flavor directly influences suppliers’ quality decisions, necessitating a balance between production costs and market expectations. Second, pricing strategies vary between saline–alkali and marine crabs. Given the higher production costs and unique farming conditions, saline–alkali crab suppliers need to implement targeted pricing strategies in order to maintain competitiveness. Finally, the market expansion potential of saline–alkali crabs in coastal and inland regions requires further investigation. While seawater crabs benefit from an established coastal supply chain, saline–alkali crabs could possess a competitive advantage in inland markets thanks to their controlled farming environments. To address these practical challenges, this paper develops a game-theoretic model to analyze supplier behavior under consumer preference heterogeneity and varying market structures. By jointly considering product quality, flavor differences, and information search costs, the study reveals how saline–alkali crab suppliers can adapt their pricing and quality strategies to penetrate different market segments. This research contributes to the literature by integrating quality differentiation, flavor preference, and spatial competition in the context of emerging aquaculture sectors. This paper explores differences in quality decisions and pricing strategies between crab suppliers under varying market conditions, focusing on consumer preferences. The following research questions are addressed: (1) How do consumer preferences for quality and flavor influence the quality decisions of saline-alkali crab suppliers? (2) How do saline–alkali and marine crab suppliers formulate pricing strategies to enhance competitiveness? (3) Can saline–alkali crab suppliers achieve a competitive advantage in coastal and inland markets?
The remainder of this article is structured as follows: Section 2 reviews the relevant literature; Section 3 defines the research problem and develops a model to examine the role of product differentiation in market encroachment; Section 4 analyzes equilibrium strategies for suppliers under different market conditions; Section 5 discusses how consumer preferences and technological investment influence pricing and strategic decisions, highlighting both managerial and practical implications; finally, Section 6 concludes the paper and outlines potential directions for future research.
2. Literature Review
2.1. Consumer Behavior
Extensive research has explored the complexity of consumer demand [18,19]. Consumers exhibit heterogeneous preferences considering various factors, including quality, service, and functionality. For instance, some researchers have focused on how quality differences influence consumer selection [20,21]. Lauga and Ofek examined the role of service attributes in shaping consumer utility [19]. Liu et al. highlighted the importance of functionality and performance in driving consumer demand for differentiated products [22]. Self-selection behavior drives consumers to select products that best meet their needs [23,24,25], while flavor preferences play a crucial role in price competition and market positioning. Raimondo et al. found that consumers prioritize flavor and origin over quality in food purchases, highlighting the competitive significance of flavor diversity [26]. This underscores the need for firms to integrate flavor differentiation into product design and marketing. Bohlmann et al. showed that the timing of market entry affects share and pricing, with first-movers benefiting from better alignment with consumer flavor preferences [27]. Customization strategies also shape market competition; Alptekinoglu and Corbett emphasized that mass customization (MC) enables firms to meet diverse flavor preferences through flexible production, enhancing their market competitiveness [28]. Takagoshi et al. suggested that firms should strategically position themselves to capture diverse flavor preferences while minimizing customization costs [29]. Chen and Iyer found that personalized pricing and product offerings in database marketing and direct sales strengthen firms’ competitive positioning by addressing specific flavor preferences [30]. However, Oertel and Schmutzler noted that greater flavor heterogeneity increases market entry barriers [31].
Quality preferences also shape competition, influencing pricing, channel strategies, and consumer choice. Ha et al. showed that quality differentiation does not always benefit manufacturers or retailers in direct manufacturer entry scenarios and that its impact is not necessarily linear [32], suggesting that quality-based competition requires strategic consideration. Dai et al. examined pricing in agency and resale channels, showing that channel competition, commission rates, and cost structures collectively influence the role of quality differentiation [33]. The relationship between quality and market structure has also been explored in dual-channel supply chains. Chen et al. showed that new distribution channels reinforce pricing–quality interactions, which enhance product quality [34]. Chen and Yang developed a product classification strategy incorporating sequential consumer decision-making, emphasizing the synergy between classification and quality differentiation [35]. Li et al. demonstrated that national brand quality significantly influences retailers’ incentives to introduce high-quality products [36]. Overall, consumer preferences extend beyond quality to include flavor, functionality, and service. These factors drive purchasing decisions, in turn shaping firms’ pricing, market positioning, and supply chain strategies.
2.2. Market Encroachment
Consumer preferences play a central role in market encroachment strategies, particularly regarding non-quality factors such as appearance and flavor, which directly influence entry success. Consumer sensitivity to quality and price significantly influences encroachment outcomes. Yang et al. showed that nonlinear pricing can mitigate supplier entry risks by raising direct sales costs and product substitutability, which improves both supplier and retailer profitability [37]. Similarly, Xu et al. found that retail cost differences substantially affect decision-making in dual-channel supply chains, influencing both consumer purchases and market entry strategies [38]. With the rise of online retail platforms, Mou et al. studied how suppliers exploit different distribution channels to invade and encroach upon the online market [39]. In addition to encroachment, firms should consider developing defensive strategies. Liang et al. analyzed manufacturer–retailer dynamics and concluded that strategically designed entry plans can maximize joint profits [40]. Yao et al. suggested that responsive pricing strategies effectively deter encroachment under high signaling costs and limit product differentiation [41], while Cui et al. demonstrated that original equipment manufacturers (OEMs) can counter encroachment through quality improvements when contract manufacturers have limited imitation capabilities [42].
Market encroachment is closely related to market segmentation, especially given heterogeneous consumer preferences. Increasing market fragmentation makes segmentation essential for competitive advantage. Contextual factors beyond product attributes significantly affect consumer purchasing decisions [43]. Geographic and cultural differences further shape preferences [44,45,46], requiring region-specific entry strategies. For instance, coastal and inland market distinctions in seafood sales illustrate the impact of geographic segmentation on encroachment outcomes [47,48]. Successful market encroachment necessitates integrating consumer preference heterogeneity with geographic segmentation. Thus, firms should tailor their strategies across segments by optimizing pricing, distribution, and product positioning in order to strengthen competitiveness and increase market share.
3. Problem Description and Model Development
3.1. Problem Description and Symbols
This paper develops a game-theoretic model with two types of crab suppliers: marine and inland saline–alkali. Drawing on contextual dependence [43] and regional heterogeneity [44,45], the model considers two independent markets: coastal (O) and inland (L), where cross-purchasing is not possible [49].
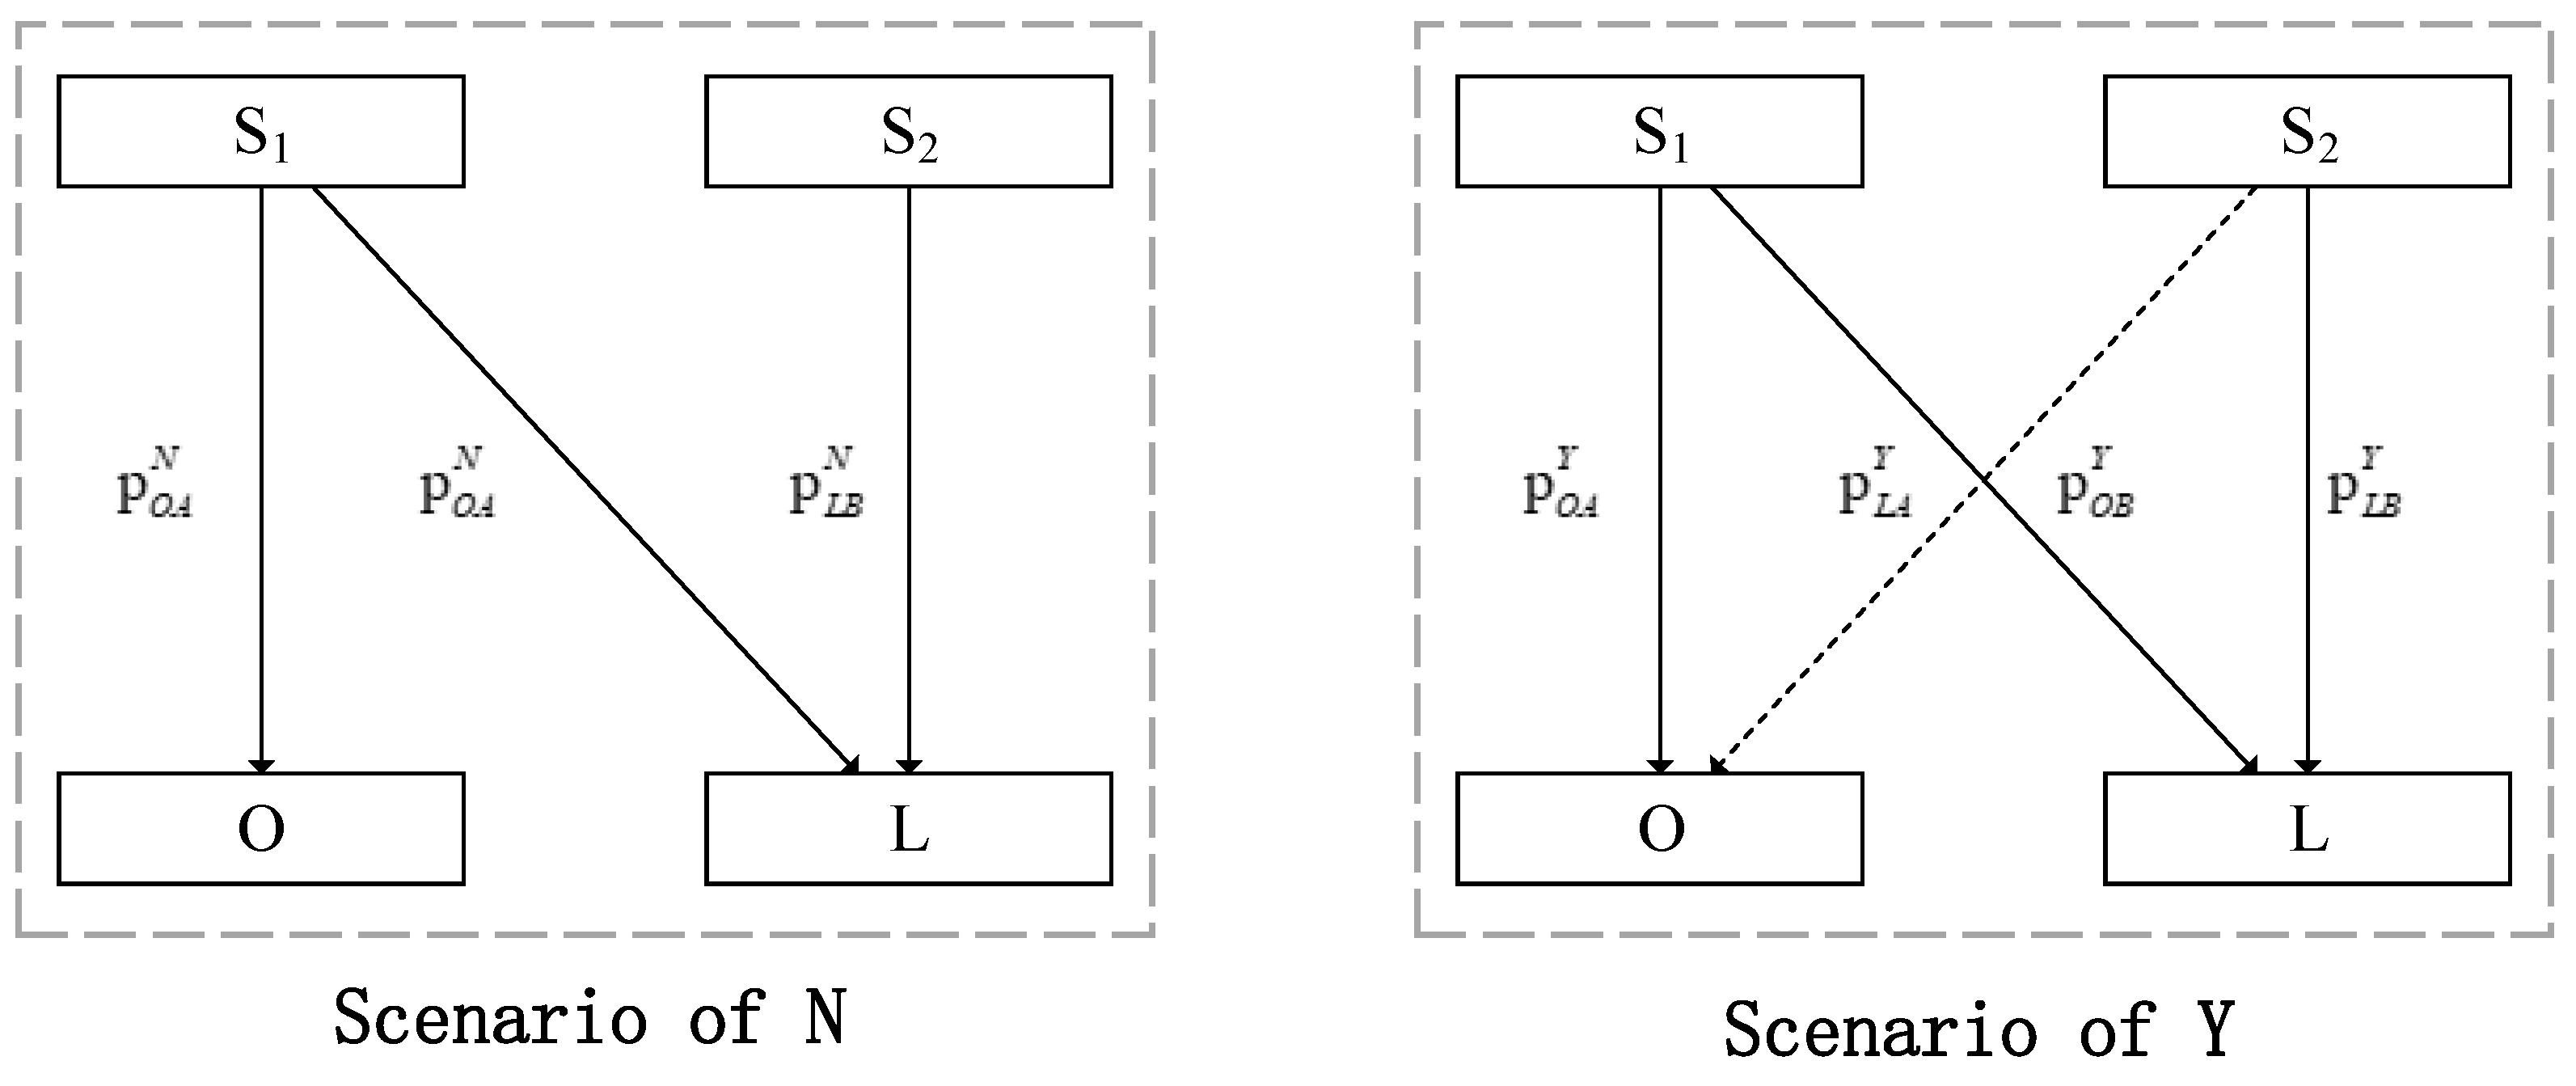
In this model, the marine crab supplier () is the incumbent. It provides marine crabs (A) through established sales channels and enjoys strong consumer recognition in both markets. The saline–alkali crab supplier () is a new entrant that offers saline–alkali crabs (B), a developing product with limited consumer awareness that demands greater information search efforts. This entrant faces the dual challenges of market encroachment and quality improvement, with its expansion decisions directly affecting quality choices and competitive dynamics. As illustrated in Figure 1, the primary strategies include no market encroachment (N scenario) and market encroachment (Y scenario).
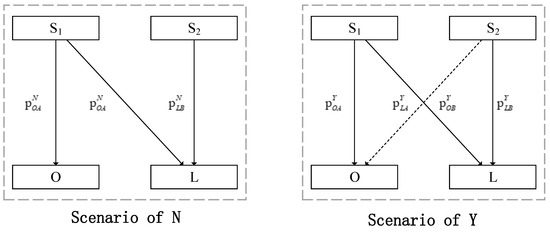
Figure 1.
The product sales model based on market segmentation.
Consumer decisions depend on quality preferences, flavor differences, and information search costs. During market encroachment, supplier bears a cost of E. Both suppliers are risk-neutral and aim to maximize profits. The decision-making process proceeds through three stages. In the first stage, supplier decides whether to expand into the inland market. In the second stage, supplier determines the quality level of inland saline–alkali crabs. In the third stage, suppliers and set prices in their respective markets. As the incumbent, supplier has an established market presence and transparent pricing, enabling supplier to adjust its strategy accordingly. Accordingly, pricing proceeds by a leader–follower dynamic, with supplier setting its prices first and supplier responding. Table 1 summarizes the model’s parameters and variables.

Table 1.
Summary of notation.
3.2. Demand
Consumer valuations vary across products. The base valuation of aquatic products is assumed to follow a uniform distribution and to remain independent of price [50,51]. As the incumbent, supplier benefits from consumer familiarity, resulting in lower search costs and a valuation of v for marine crabs [51]. In contrast, inland saline–alkali crabs are less familiar, incurring a search cost a that reduces their valuation to .
Product quality significantly affects demand [24,27,52] by enhancing consumer utility. Let and represent the quality of marine crabs and inland saline–alkali crabs, respectively; given established aquaculture techniques, is treated as exogenous, whereas is a decision variable for supplier . Regional differences influence consumer preferences for origin and flavor. To capture this heterogeneity, the Hotelling model is employed, with deviations from a consumer’s ideal flavor incurring a travel cost of . Coastal consumers have fixed preferences (), incurring a travel cost of , whereas inland consumers face a cost of . Consumer utility functions are developed on the basis of these assumptions.
3.2.1. Demand of No-Encroachment (N) Scenario
In scenario N, supplier does not expand, making supplier the sole provider in the coastal market. Consumer utility for marine crabs is expressed by (1), whereas inland saline–alkali crabs are unavailable, resulting in .
Consumers choose marine crabs if ; the demand, denoted as , is provided by (2).
Under scenario N in the inland market, supplier and supplier compete. The consumer utility for marine crabs is expressed by (3), whereas that for inland saline–alkali crabs is described by (4).
Under scenario N, consumers in the inland market are indifferent between seawater and inland saline–alkali crabs when . The indifference point is determined by . If , consumers select marine crabs with demand described by (5), while if they choose inland saline–alkali crabs with demand provided by (6).
3.2.2. Demand of Encroachment (Y) Scenario
Under scenario Y, supplier enters both markets, supplying marine and inland saline–alkali crabs. In the coastal market, consumer utility is represented by (7) for marine crabs and by (8) for inland saline–alkali crabs.
Consumers in the coastal market are indifferent between marine and inland saline–alkali crabs when , with the indifference point calculated as . If , then demand is determined by (9), whereas if , it is determined by (10).
4. Strategy and Result Analysis
In different strategic scenarios, the two suppliers determine their pricing and quality levels within distinct cost structures. For marine crabs, established aquaculture technology does not require further quality improvements, resulting in a farming cost of . In contrast, the farming of saline–alkali crabs involves two cost components: the basic farming cost and the technological input cost. Reduced leasing expenses and effective disease prevention reduce the base unit cost to () [1,15]; however, quality improvements necessitate water adjustments, adding a proportional cost of , which yields a total unit cost of . Saline–alkali farming necessitates significant upfront investments, including larval desalination and ionic regulation. These costs depend on the local water composition, requiring potassium, calcium, and magnesium supplementation.
4.1. No-Encroachment (N) Scenario
Under scenario N, supplier sells only in the inland market, with its profit function provided by (16). On the other hand, supplier operates in both markets, as defined in (15).
Proposition 1.
The optimal solutions for suppliers and are summarized in Table 2 for the scenario in which supplier stays in the inland market without expanding to the coastal market.
Table 2.
The equilibrium solutions in scenario N.
The optimal results show that the decisions of both suppliers depend on production costs, market size, investments in quality improvement, and intensity of competition. Notably, the quality choices of supplier influence both its own pricing and that of supplier . Substitutes for Complex Expressions, please refer to Appendix A.
Corollary 1.
In scenario N, quality decisions are influenced by factors such as consumer preference γ, flavor difference δ, and quality improvement cost .
- The relationship between quality decisions and γ depends on μ. If , then ; otherwise, .
- The relationship between quality decisions and δ is jointly influenced by and μ. If and or if and , then ; otherwise, .
- The relationship between quality decisions and is also influenced by μ. If and or if and , then ; otherwise, .
Let denote the basic utility loss for saline–alkali crabs, reflecting the influence of consumer perceptions and the quality reference effect. Here, is associated with consumer sensitivity to quality, with smaller signifying lower sensitivity and larger indicating a stronger emphasis on quality, which may inhibit quality improvement in inland saline–alkali crabs due to the high-quality reference effect of marine crabs. affects the utility derived from flavor. A larger amplifies sensitivity, making flavor more significant in utility. To maximize utility, inland saline–alkali crabs must have enhanced quality. Under scenario N, when is large and is low, flavor differences more effectively drive quality improvement. When is low, the influence of quality improvement costs dominates the suppressive effect of utility loss on quality improvement (), positioning quality improvement as the primary strategy for optimizing consumer utility. The impact of technological input costs on quality is shaped by both and . As increases, the overall cost of quality improvement escalates. However, with low and high , suppliers can still derive benefits from quality improvements, highlighting the need to manage long-term investment efficiency when entering markets with strong quality benchmarking. Given the quality level of the competing product, both suppliers adjust their pricing strategies based on market competition and product quality. Lower offers more pricing flexibility, enabling competitive pricing to capture market share. With higher , suppliers must increase prices to cover costs, positioning the product in the premium pricing range. These findings suggest that suppliers should adopt differentiated quality-positioning strategies based on consumer sensitivity, cost conditions, and competitive benchmarking, particularly when targeting segmented or niche markets. The dynamic relationship between consumer quality preferences and pricing is examined further in Corollary 2.
Corollary 2.
In scenario N, the relationship between the prices of the two products and the quality preference γ is influenced by and μ:
- If and or if and , then ; otherwise, .
- If and or if and , then ; otherwise, .
In scenario N, consumer quality preferences directly influence in the coastal market. In the inland market, the impact of quality preferences on pricing varies between products. When is low and is small, the price of inland saline–alkali crabs increases with consumer quality preference. In contrast, when is low but is large, the price of inland saline–alkali crabs declines as consumer quality preference rises due to the stronger quality reference effect of marine crabs. For marine crabs, when and are both low, the price decreases as consumer quality preference increases; however, when is low and is large, the price rises. These trends indicate that consumer quality preferences influence price levels, driving opposite price changes for the two products. Suppliers should evaluate not only consumer demand intensity but also the reference effect from competing products to develop effective pricing strategies. In particular, firms targeting inland markets should avoid blindly raising prices in high-reference environments and instead consider bundling strategies, transparent quality signaling, or phased upgrades to maintain price competitiveness.
Corollary 3.
In scenario N, δ significantly affects the pricing of both saline–alkali and marine crabs:
- The relationship between and δ is influenced by μ. If , then ; otherwise, .
- The relationship between and δ is influenced by and μ. If and or if and , then ; otherwise, .
In the inland market, significantly affects utility changes resulting from product differences. A larger increases sensitivity to these differences, while inland consumers, who are less sensitive than coastal consumers, experience smaller horizontal utility losses for both products. When the quality of marine crabs is fixed, a larger increases consumer search costs a, prompting supplier to lower its prices in order to expand market share and counteract this effect. The pricing of saline–alkali crabs depends on both consumer utility and product costs. When is low, supplier faces reduced cost pressure. With high a and price competition from supplier , increasing the price of inland saline–alkali crabs can help both products capture market share. However, higher limits the pricing flexibility of supplier . With large , supplier must lower its prices to remain competitive. Beyond , the technological input cost also influences pricing, as discussed in Lemma 1.
Lemma 1.
In scenario N, the impact of κ on the pricing of different products is as follows:
- The relationship between and κ is influenced by μ. If , then ; otherwise, .
- The relationship between and κ is affected by and μ. If and or if and , then ; otherwise, .
In scenario N, the price of marine crabs in the coastal market is unaffected by the technological investments of inland saline–alkali crabs; here, indirectly affects the profit of supplier by influencing quality improvement costs. As shown in Corollary 1, and are typically correlated. However, when and exceed certain thresholds, this relationship may reverse, changing the effect of on both quality and price. Quality drives price adjustments, impacting supplier profits; when is low, supplier enjoys greater pricing flexibility. If is high, consumers perceive a greater utility loss from inland saline–alkali crabs, prompting supplier to lower prices to capture market share. Conversely, when is low, consumers place more value on quality improvements, resulting in higher prices and quality levels. For marine crabs, the pricing of supplier is not directly affected by . However, due to the competition between the two products in the same market, supplier adjusts its price inversely in response to changes in . Supplier must then reduce its price to maintain market share and profitability. These findings suggest that firms should assess the return on investment of quality improvements under varying consumer sensitivity and input cost scenarios in order to avoid overinvestment.
4.2. Encroachment (Y) Scenario
In scenario Y, supplier enters both the inland and coastal markets, incurring additional encroachment costs, as detailed in (18). Supplier continues to operate in both markets, with its profit function specified in (17).
Proposition 2.
The optimal solutions for suppliers and , are presented in Table 3 for the scenario when supplier enters the market.
Table 3.
The equilibrium solutions in scenario Y.
Based on the data presented in Table 3, the pricing decisions of supplier are influenced by , , and , as are both the quality and pricing strategies of supplier . The quality decisions made by supplier directly impact the pricing strategies of both suppliers, as outlined below.
Corollary 4.
In scenario Y, the quality decisions of supplier are influenced by γ, δ, and :
- The relationship between γ and the quality decisions of supplier is influenced by the parameter μ. If , then . Under the conditions for optimality, does not exist.
- The relationship between δ and the quality decisions of supplier is influenced by and μ. If and or if and , then ; otherwise, .
- The relationship between and the quality decisions of supplier is also influenced by μ. If and or if and , then ; otherwise, .
In scenario Y, where the inland saline–alkali crab supplier enters both the inland and coastal markets, quality decisions are influenced by several factors. Corollary 4 highlights as a key factor linking product quality and consumer utility. Although the trends affecting the quality of inland saline–alkali crabs remain consistent with those described in Corollary 1, the parameter thresholds shift due to market encroachment. When is low, consumer search costs are minimal and product quality has a significant impact on utility. Improving quality boosts consumer demand, with the enhancement driven by consumer sensitivity to quality. Here, affects quality indirectly through product differentiation. With high , consumers’ search costs diminish the influence of on utility, although quality improvements continue to enhance utility. If is low, flavor differences can still significantly improve product quality. The impact of on quality is constrained by both and . Coastal consumers are more sensitive to flavor, whereas inland consumers are less sensitive, resulting in a “catch-up effect” that shifts the parameter thresholds. When , the inequality holds, indicating that increasing cost investments in the short term is effective for capturing market share. The pricing patterns for inland saline–alkali crabs in scenario Y are influenced by these factors. Corollary 5 further explores the dynamic relationship between technological input costs and pricing, emphasizing the combined effects of market encroachment on pricing and quality strategies.
Corollary 5.
In scenario Y, the relationship between prices in different markets and consumer quality preferences γ is influenced by :
- In the inland market, product prices are not constrained by . If , then , while does not exist within the feasible domain. If , then ; otherwise, .
- In the coastal market, the relationship between product prices and consumer quality preferences is constrained by . If and or if and , then ; otherwise, . If , then ; otherwise, .
In scenario Y, Corollary 6 demonstrates that differences in consumer flavor preferences significantly influence pricing in both markets. In the coastal market, indirectly impacts pricing by affecting product quality. According to Corollary 4, the price of inland saline–alkali crabs is positively correlated with quality, while marine crab prices are adjusted based on competitive dynamics. When is low and is high, suppliers can mitigate utility losses with cost advantages, meaning that an increase in raises the price of inland saline–alkali crabs; conversely, when is low, an increase in diminishes consumer utility for inland saline–alkali crabs, thereby enhancing the market position of supplier . In the inland market, horizontal differentiation amplifies sensitivity to quality through loss aversion when is low and is high; in this case, both suppliers can increase prices by raising within specific parameter ranges. Understanding regional flavor preferences is essential for effective price setting and product positioning. Suppliers targeting flavor-sensitive markets should consider flavor enhancement or branding strategies to justify premium pricing, while those in less differentiated markets might focus on volume sales or cost leadership.
Corollary 6.
Under scenario Y, the relationship between product prices and consumer flavor preference differences δ is influenced by the basic utility loss μ and the quality improvement cost coefficient under specific conditions, as detailed below:
- In the inland market, the relationship between the prices of the two products and δ is as follows. If , then ; otherwise, . If and or if and , then ; otherwise, .
- In the coastal market, the relationship between the prices of the two products and δ is as follows. If , then ; otherwise, . If and or if and , then ; otherwise, .
Under Corollary 6, differences in flavor preferences play a crucial role in pricing decisions in scenario Y. In coastal markets, while does not directly impact consumer utility selection, it indirectly influences pricing decisions through its effect on product quality. According to Corollary 4, the price of marine crabs is positively correlated with their quality level, whereas the price of inland saline–alkali crabs is adjusted based on competition. When is high and is low, an increase in raises the price of marine crabs, as the supplier can leverage cost advantages to offset utility losses; conversely, when is low, an increase in may reduce consumer utility evaluations for marine crabs, thereby enhancing the competitive advantage of supplier . In inland markets, directly influences the pricing of both products. When is low and is high, an increase in can elevate the prices of both products. This occurs because utility loss due to horizontal differentiation becomes more pronounced as increases, making product quality variations more sensitive to price. Therefore, within certain parameter ranges, both suppliers can leverage increases in to raise product prices. By comparing Corollaries 3 and 6, it is clear that flavor preference differences under scenario Y have a more substantial impact on the price of marine crabs, while under scenario N they primarily affect the price of inland saline–alkali crabs. This distinction underscores the differing mechanisms of horizontal and vertical pricing differentiation under various strategies. Consequently, in order to gain a comprehensive understanding of pricing strategies in market competition, it is crucial to examine the impact of quality improvement costs on pricing outlined in Corollary 7.
Corollary 7.
Under scenario Y, impacts the prices of both types of crabs in the following manner:
- The price changes of marine crabs are influenced by μ. If , then , ; otherwise, , .
- The price changes of marine crabs are jointly influenced by and μ. If and or if and , then , ; otherwise, , .
As stated in Corollary 7, the impact of on pricing is consistent across market segments under scenario Y, although differences arise in consumer perceptions of flavor. Similar to Corollary 1, the effect of is constrained by consumer flavor preferences. According to Corollary 4, when and , an increase in t amplifies the perception gap between consumer groups, resulting in a weaker impact of quality on the utility of coastal consumers. By combining the demand equations in (10) and (14), it can be seen that a larger quality gap boosts marine crab demand while suppressing inland saline–alkali crab demand, highlighting the interplay between consumer preferences and competitive dynamics.
5. Discussion and Managerial Implications
To clarify these relationships, parameter values are assigned based on real-world scenarios and model constraints. Specifically, we set , with the competition intensity set at and the market encroachment cost at . Supplier incurs a unit farming cost of for marine crabs, while supplier faces a quality improvement cost of or depending on the scenario. Additionally, supplier incurs a fixed input cost of , while the unit farming cost for inland saline–alkali crabs is negligible () [1,15]. Consumer flavor preference differences impose a “travel cost” of [44,45], with the quality level of marine crabs set at . The utility loss from incomplete information and search costs is set at or .
5.1. The Influence of Consumer Quality Preferences on Suppliers
Consumers’ emphasis on product quality plays a crucial role in shaping their purchasing decisions and brand loyalty, especially in the food industry; thus, investigating how consumers perceive product quality and its impact on quality improvement and pricing strategies holds both theoretical and practical significance. Suppliers can tailor their approaches to specific market contexts, developing targeted strategies for quality enhancement and pricing that align more closely with consumer expectations. Additionally, these strategies allow suppliers to navigate intense market competition effectively. By optimizing the balance between quality and pricing, suppliers can maintain product competitiveness while also maximizing profitability.
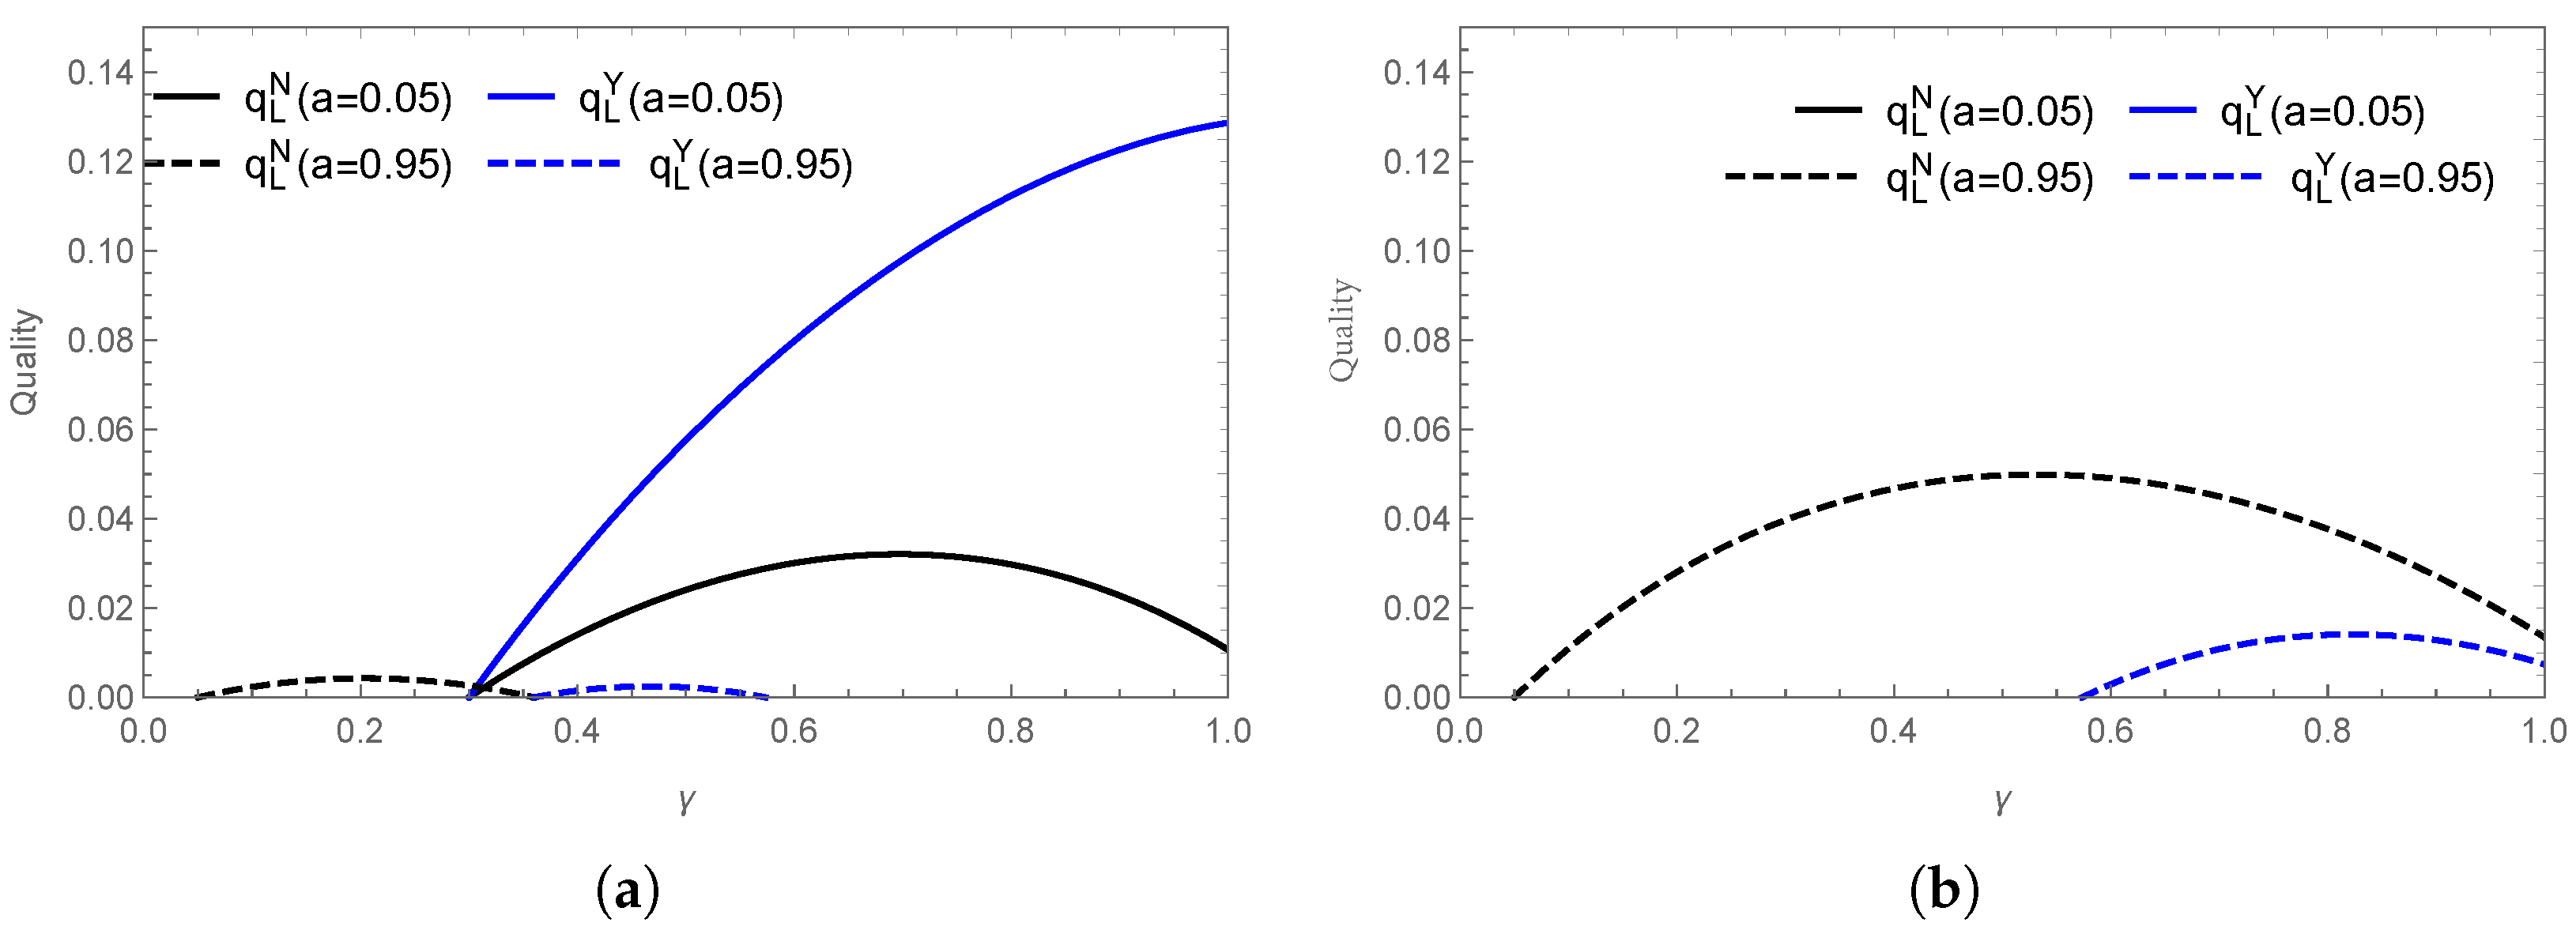
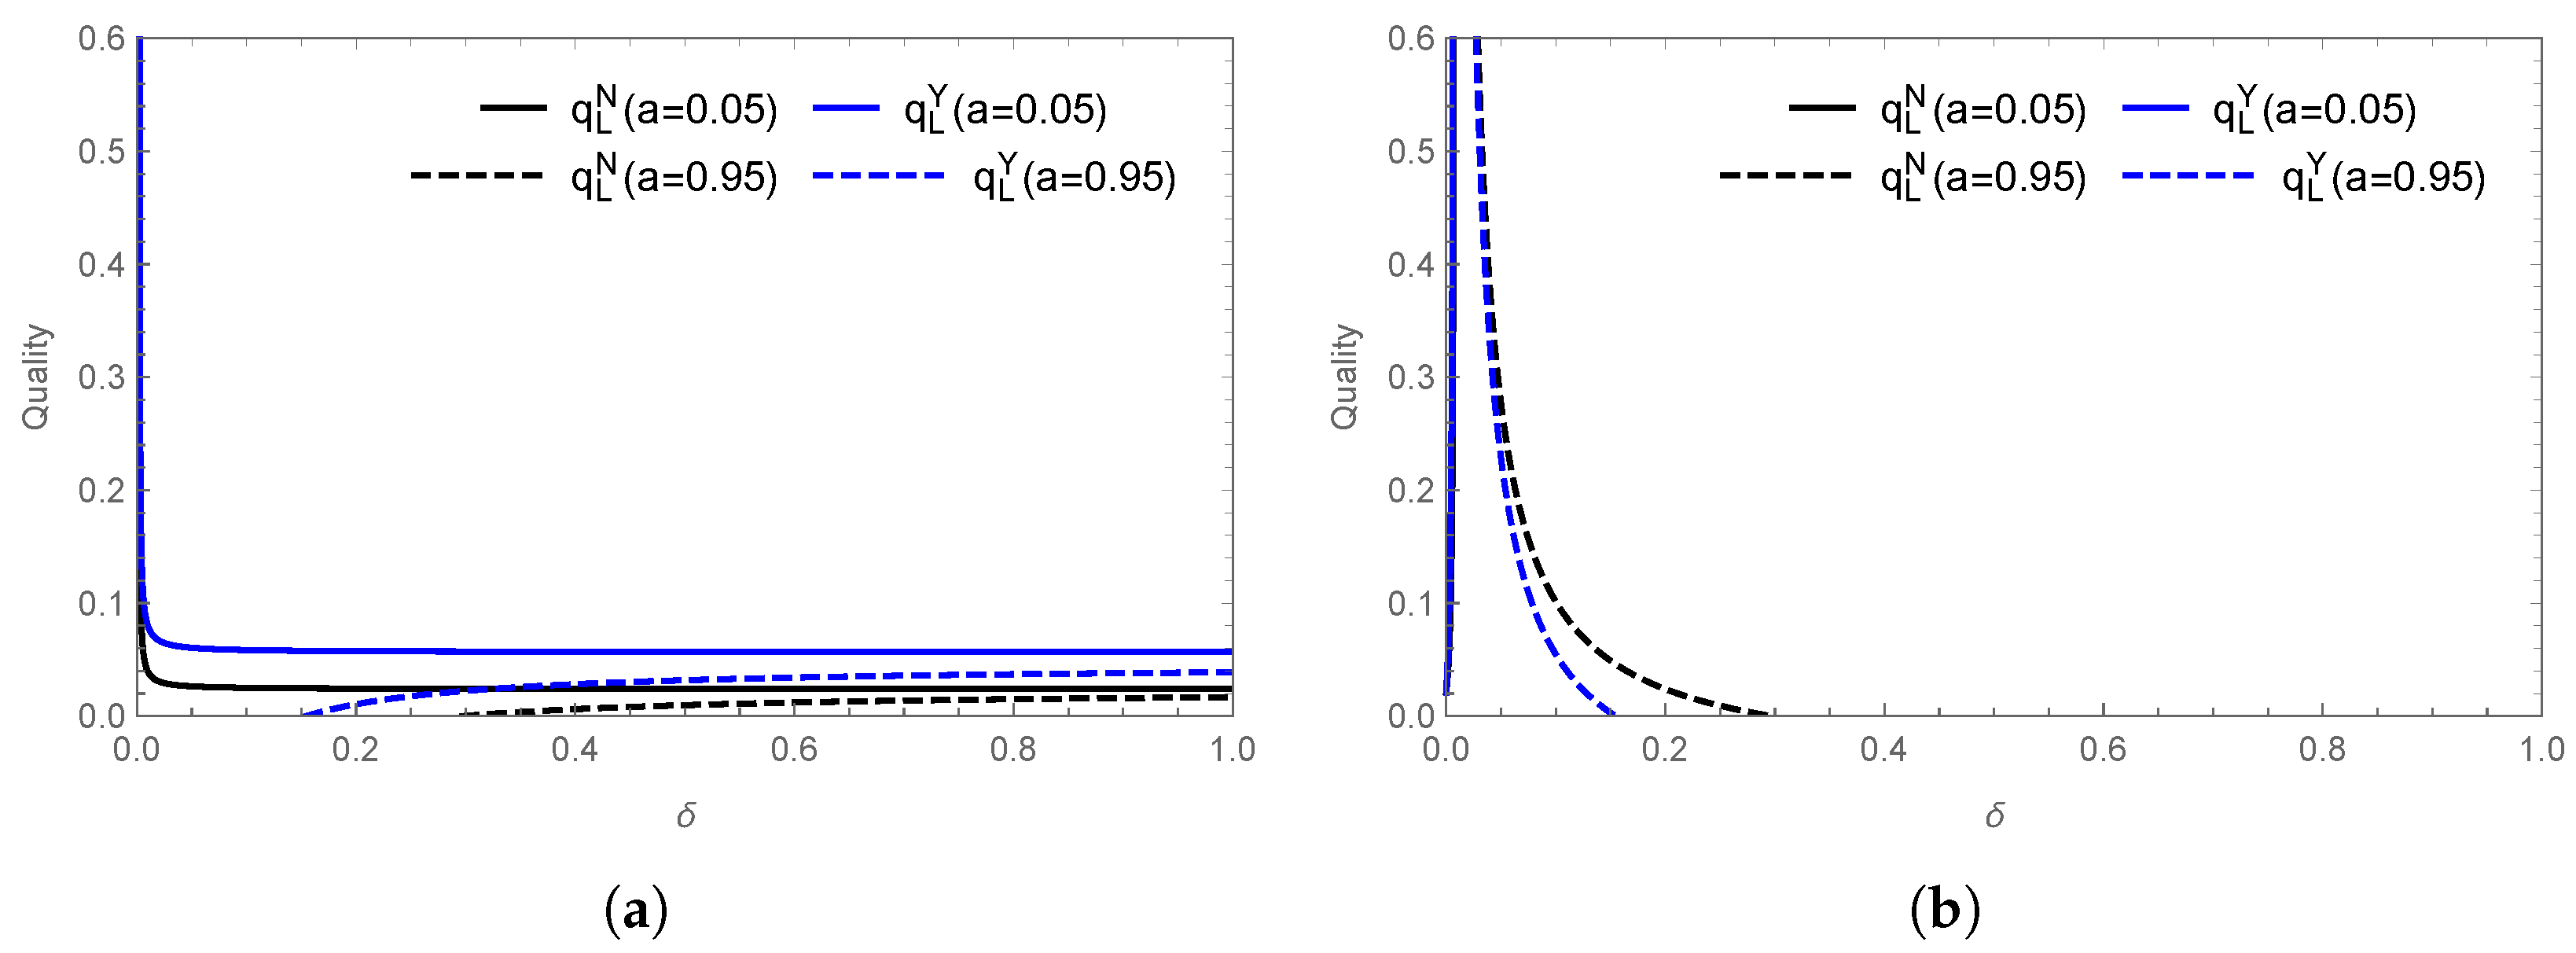
The impact of consumer quality preference on saline–alkali crab quality is illustrated in Figure 2. When is low, supplier actively supplies inland saline–alkali crabs; however, when and search costs are high, market entry depends on specific conditions. As shown in Figure 2a, when , supplier benefits from a cost advantage, and market encroachment stimulates quality improvements. For example, in the Zhoushan hairtail and Pacific white shrimp markets, live streaming and traceability reduce search costs, encouraging suppliers to enhance quality. Conversely, when , market encroachment suppresses quality improvements. Figure 2b demonstrates that when is high and a is low, increased quality costs do not significantly enhance consumer utility. In such cases, supplier prioritizes market share over quality improvements. However, when a is high, consumers are more adept at perceiving product differences, making quality improvements a crucial competitive strategy. The effect of on quality follows a “promotion-then-suppression” pattern. Initially, when consumers are unfamiliar with a product or brand, quality has a limited impact on their purchasing decisions, which explains their preference for established brands. To gain a competitive edge, saline–alkali crab suppliers must focus on not only enhancing quality through technological innovations but also on strengthening brand visibility.
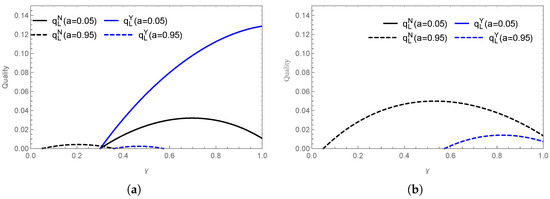
Figure 2.
Effect of consumer quality preference on quality of saline–alkali crabs: (a) , (b) .
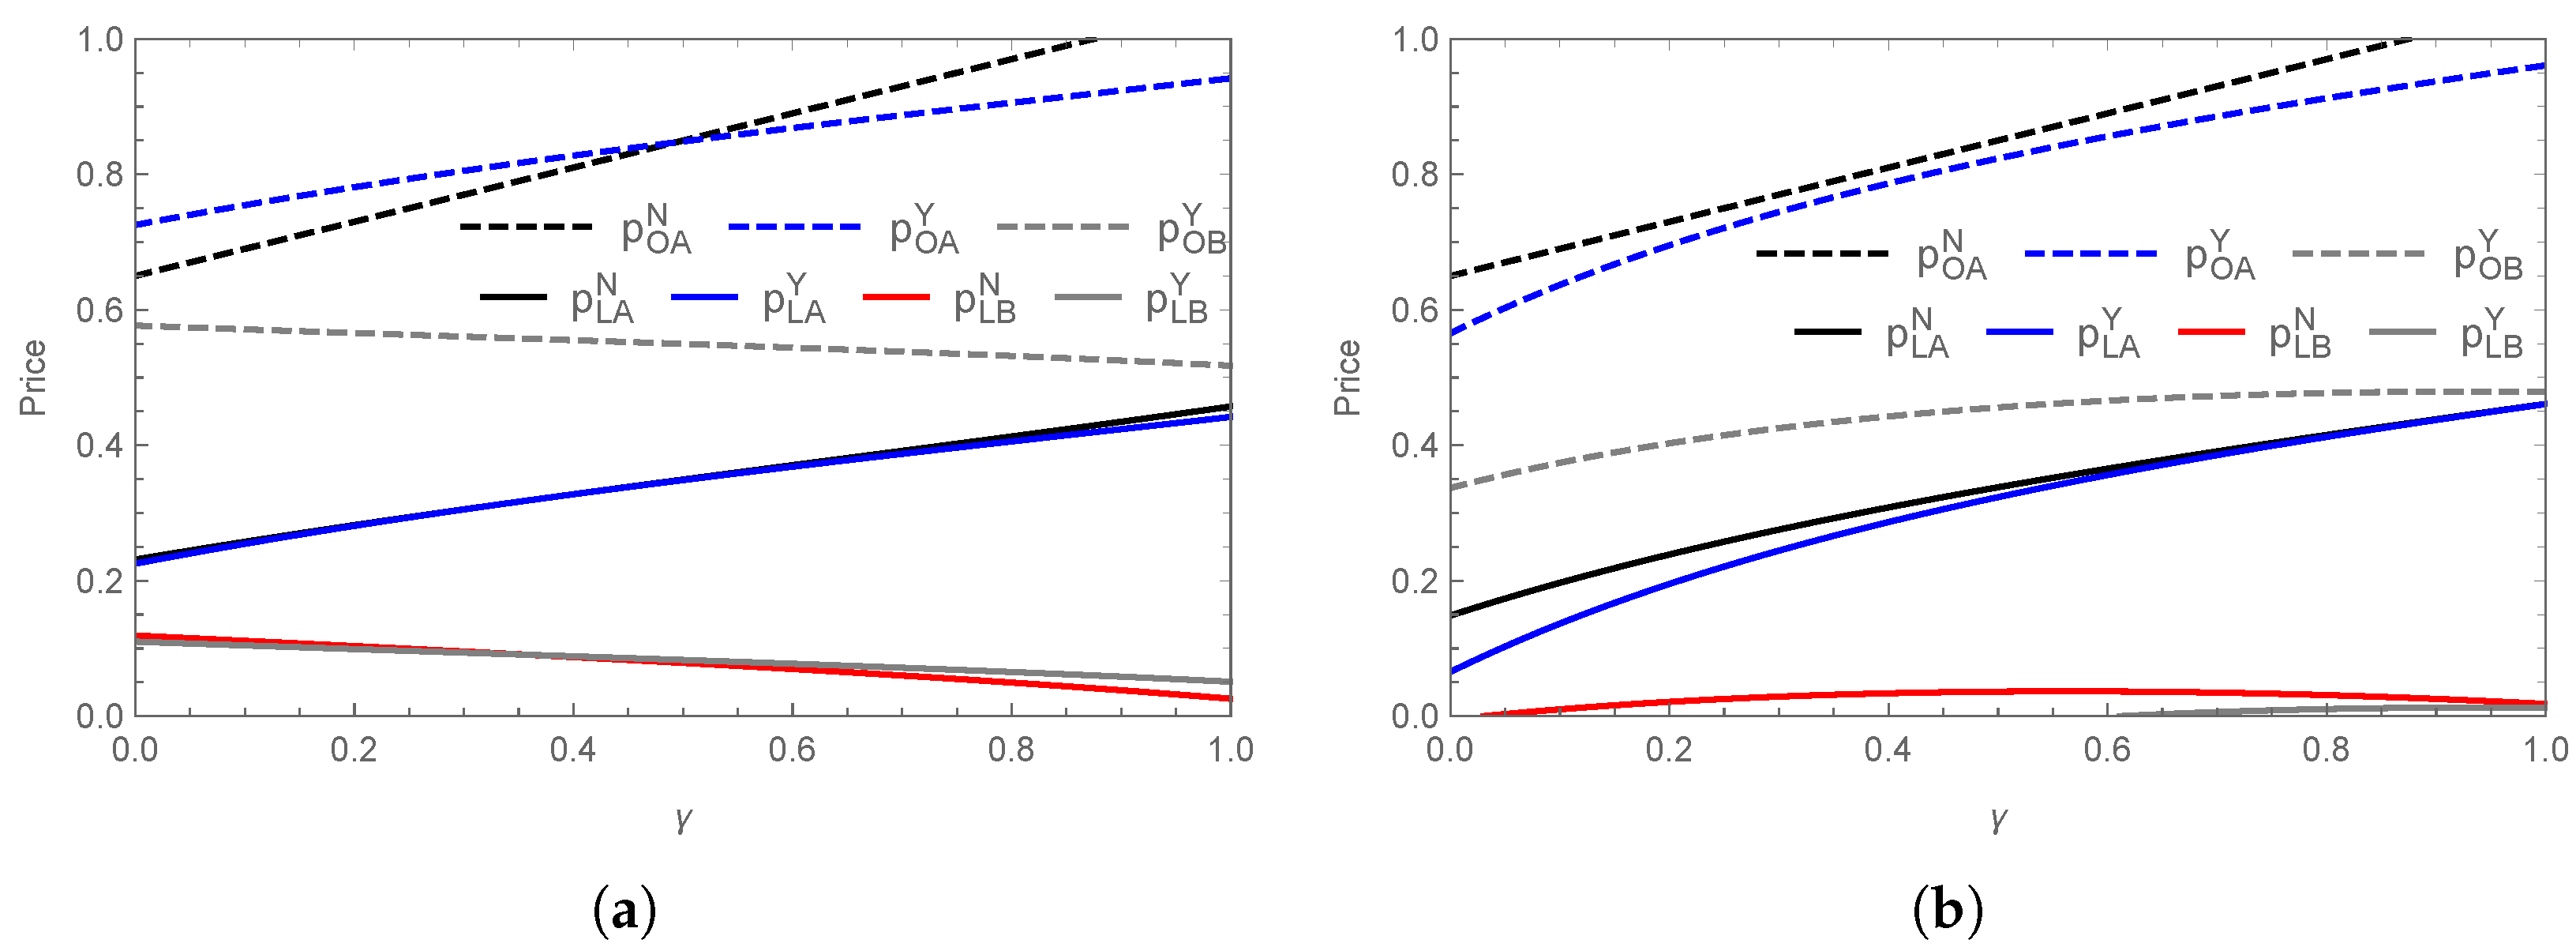
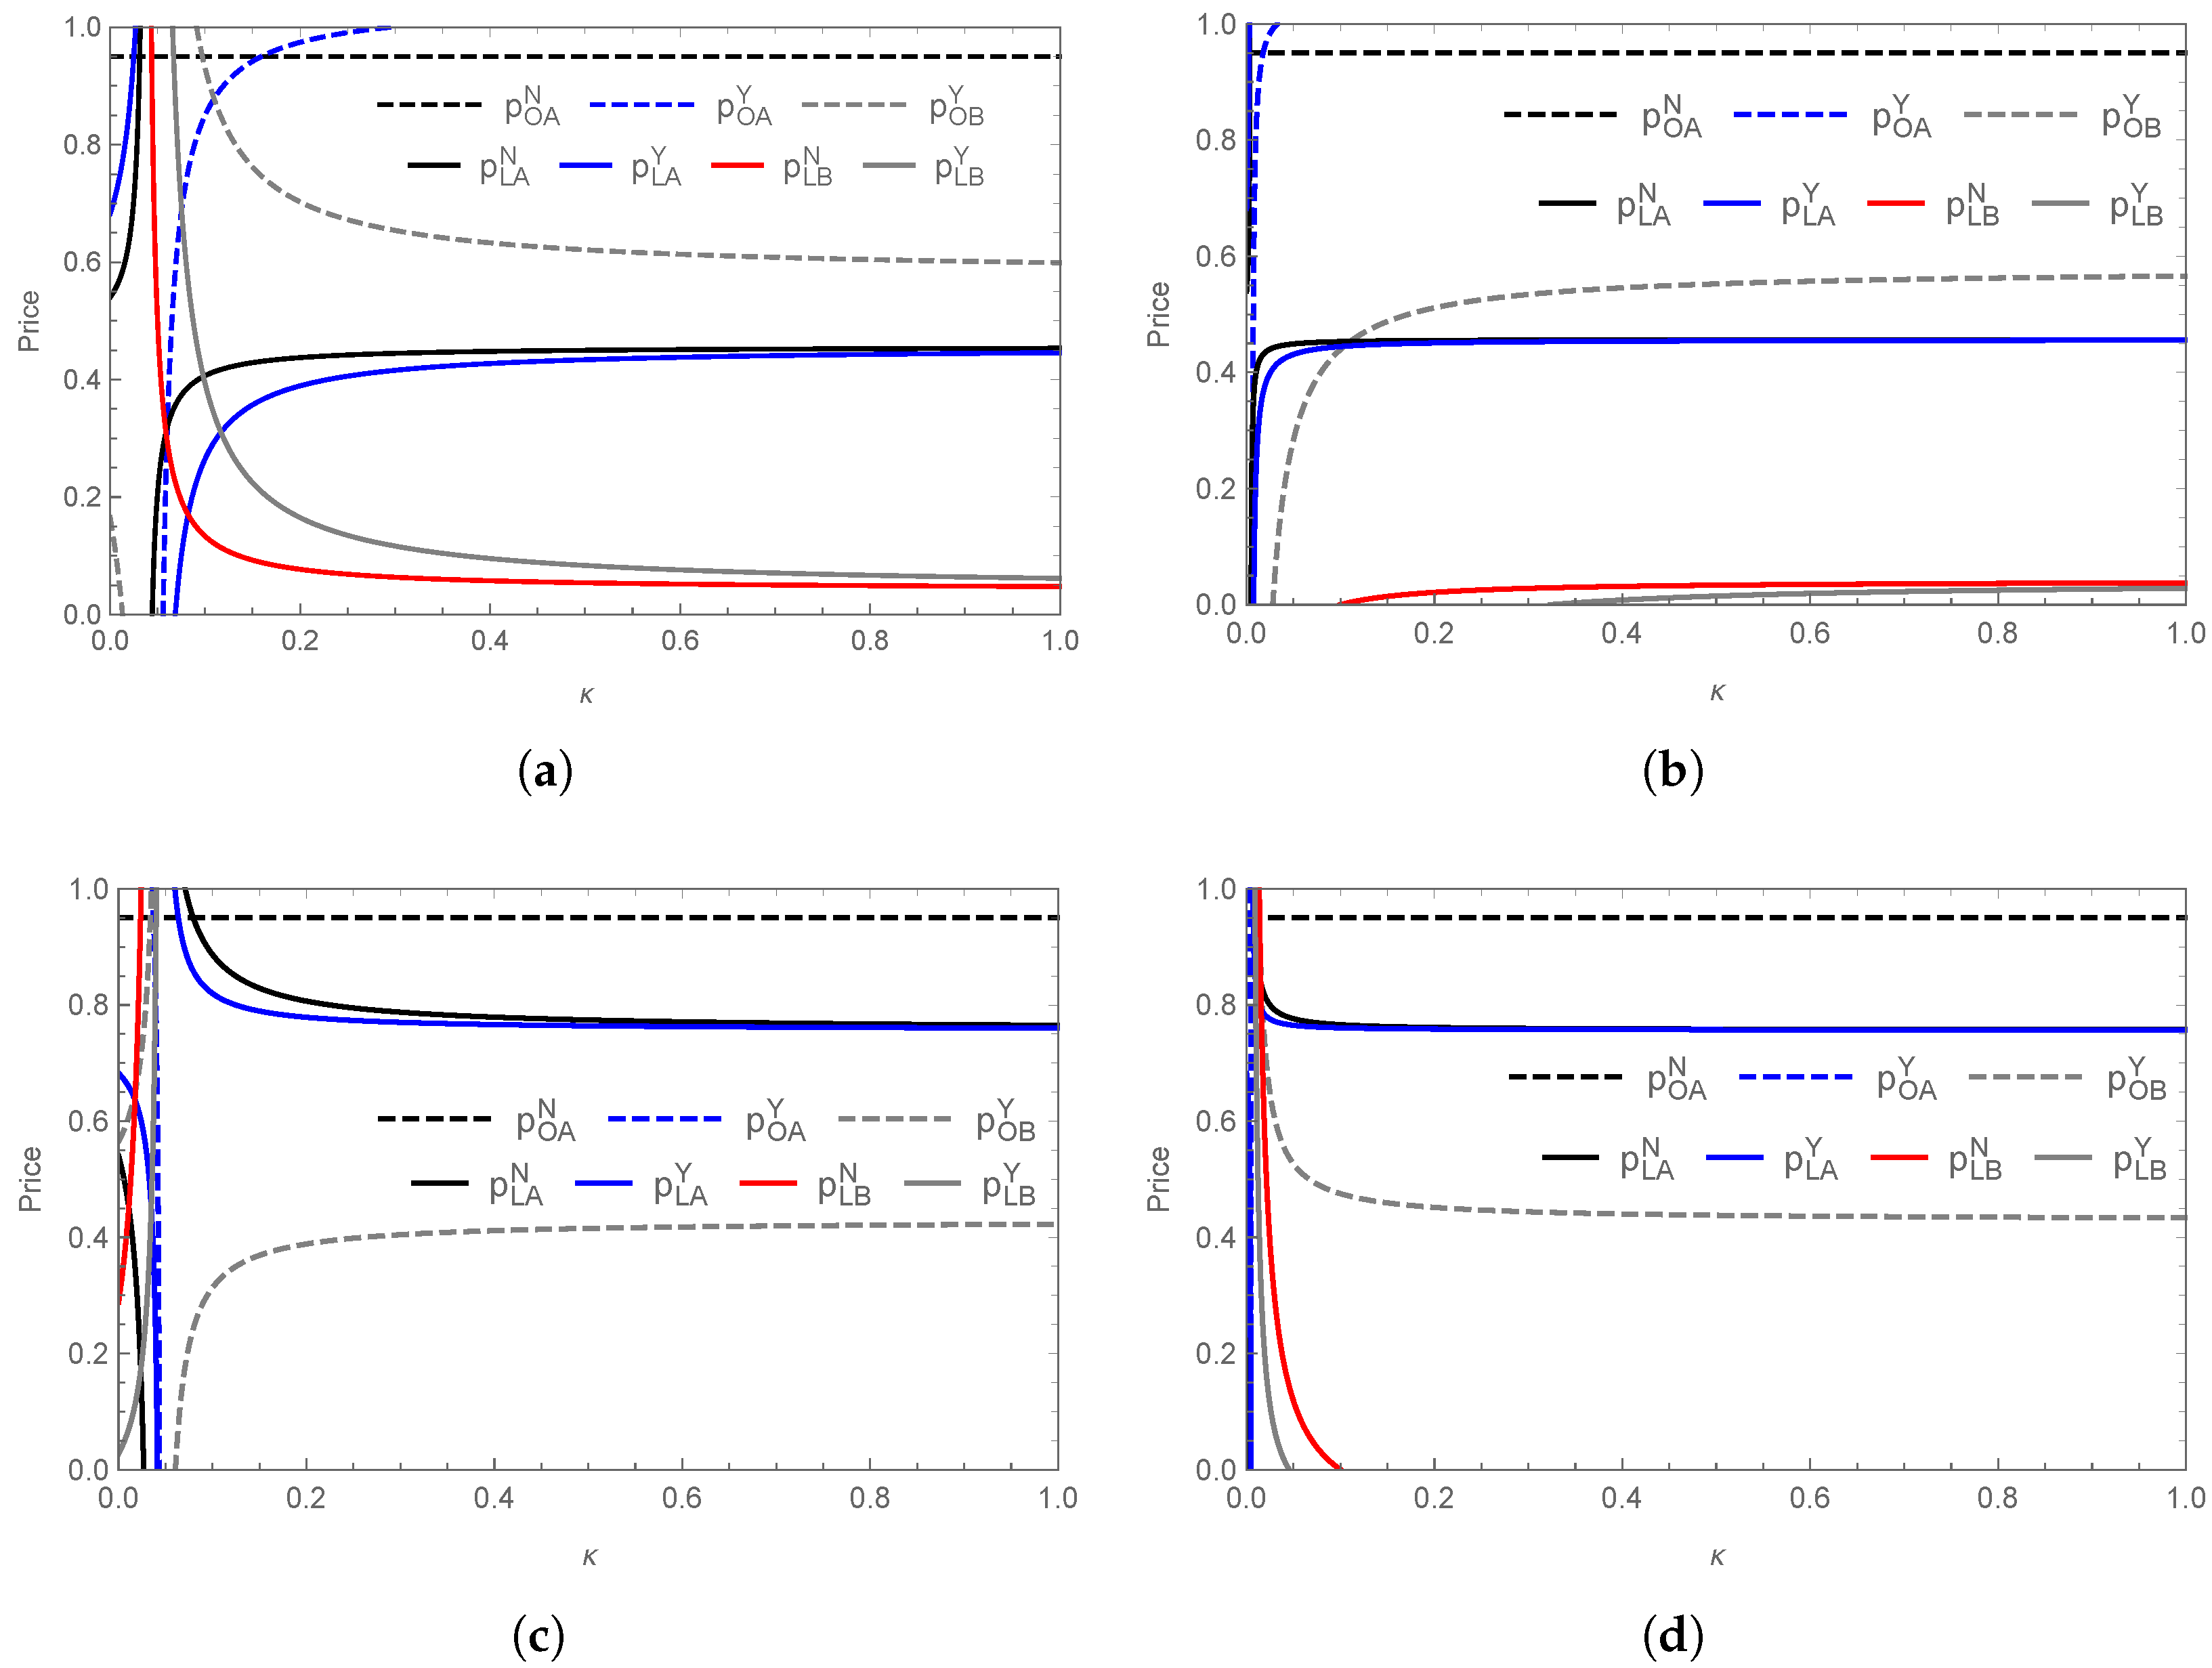
Consumer quality preference has a significant impact on product pricing across markets. As illustrated in Figure 3, consistently drives up the prices of marine crabs, while its effect on inland saline–alkali crabs varies with . When (Figure 3a), decreases as increases; however, when (Figure 3b), increases. Similar patterns are observed for and , supporting Corollary 5. Marine crabs consistently command higher prices due to their established market presence and superior quality. As a new market entrant, inland saline–alkali crabs rely more heavily on quality improvements to position themselves competitively. When is high, their coastal market price exceeds that in the inland market. As increases, inland saline–alkali crabs achieve higher coastal prices, with quality becoming an increasingly important factor in the pricing strategy.
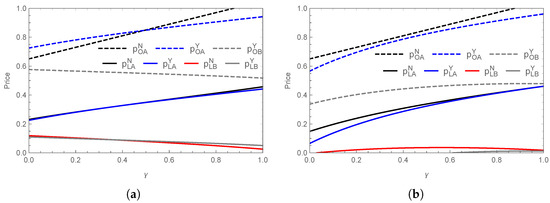
Figure 3.
Effect of consumer quality preference on prices of different products: (a) , (b) .
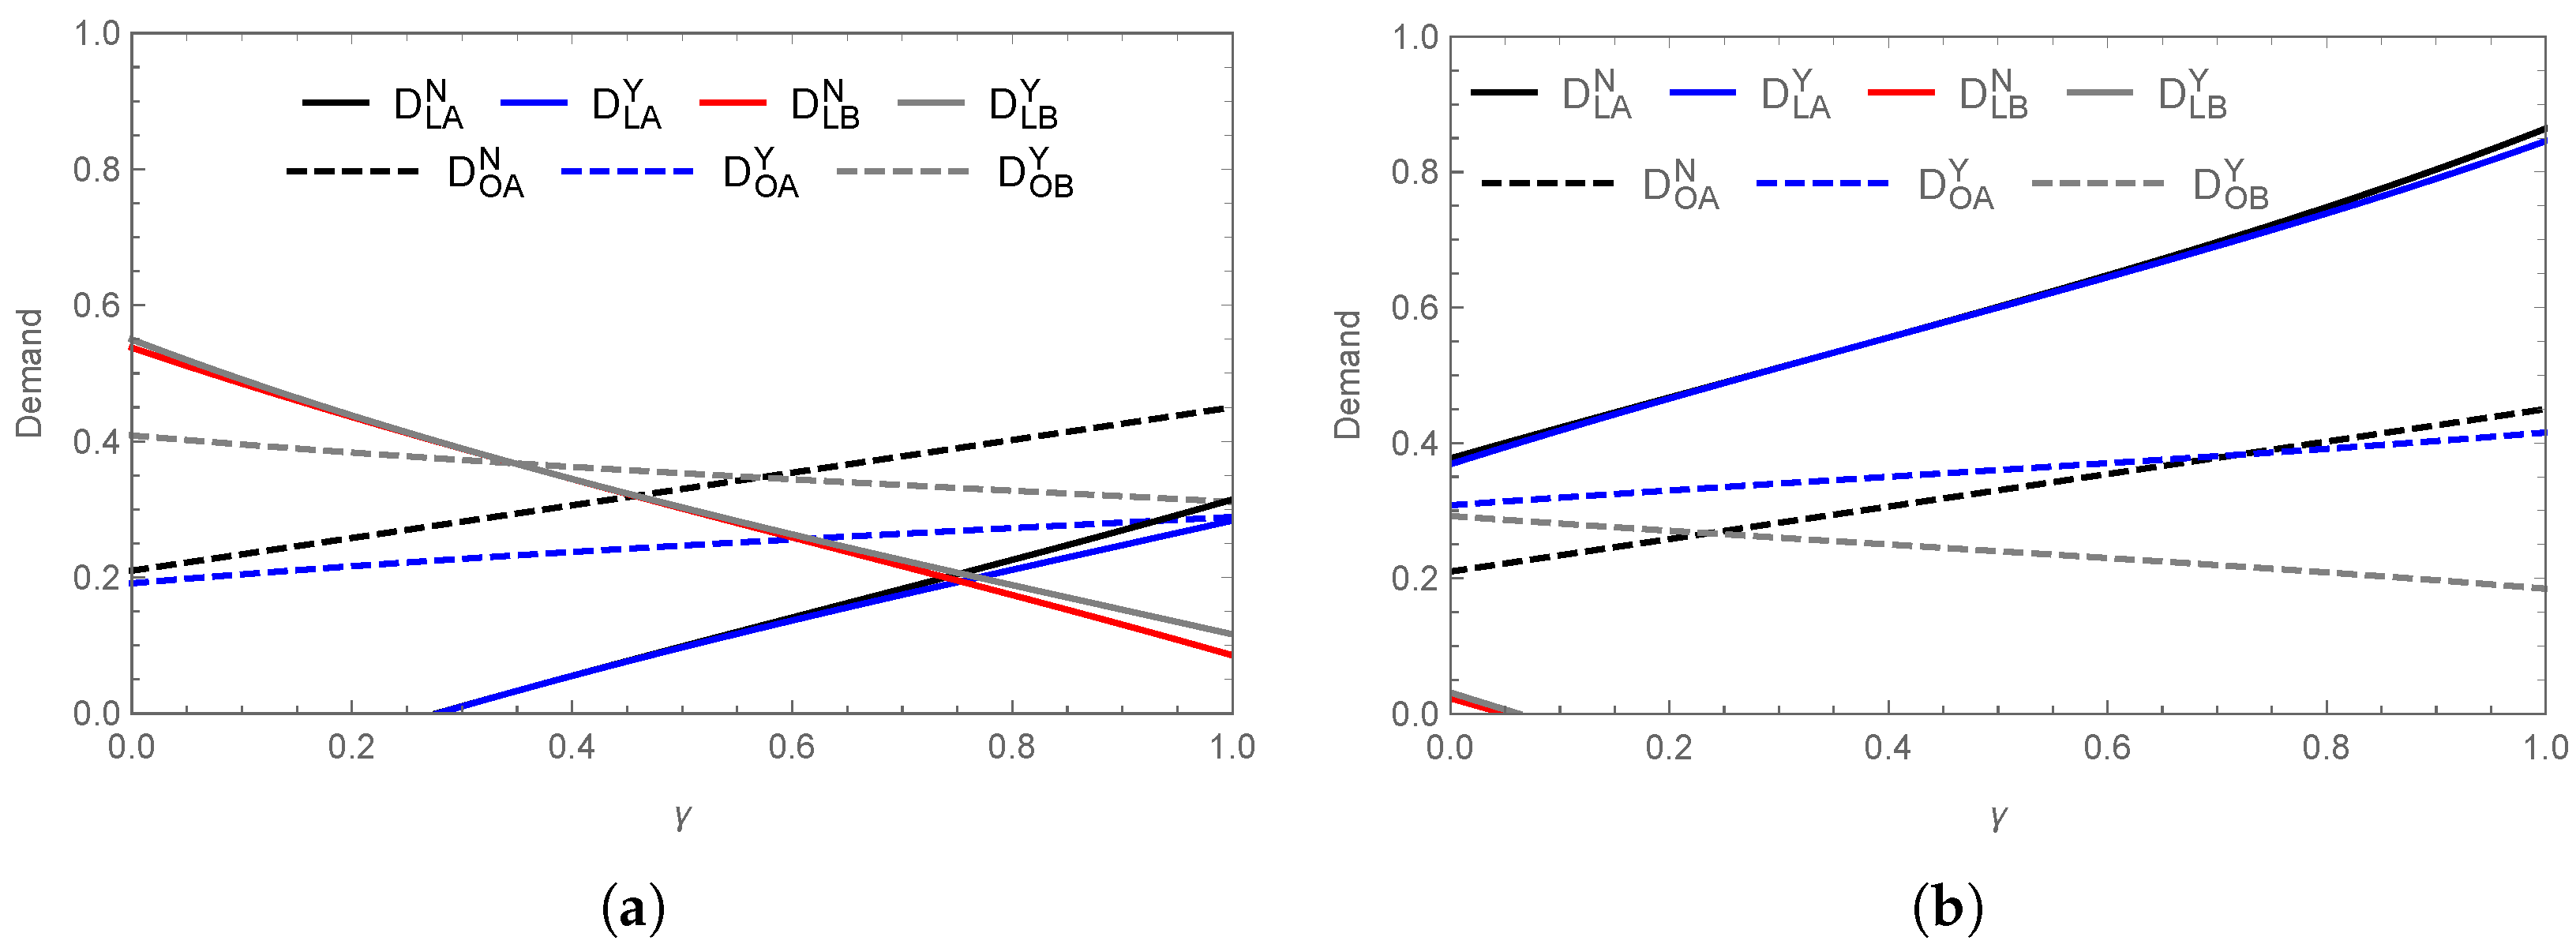
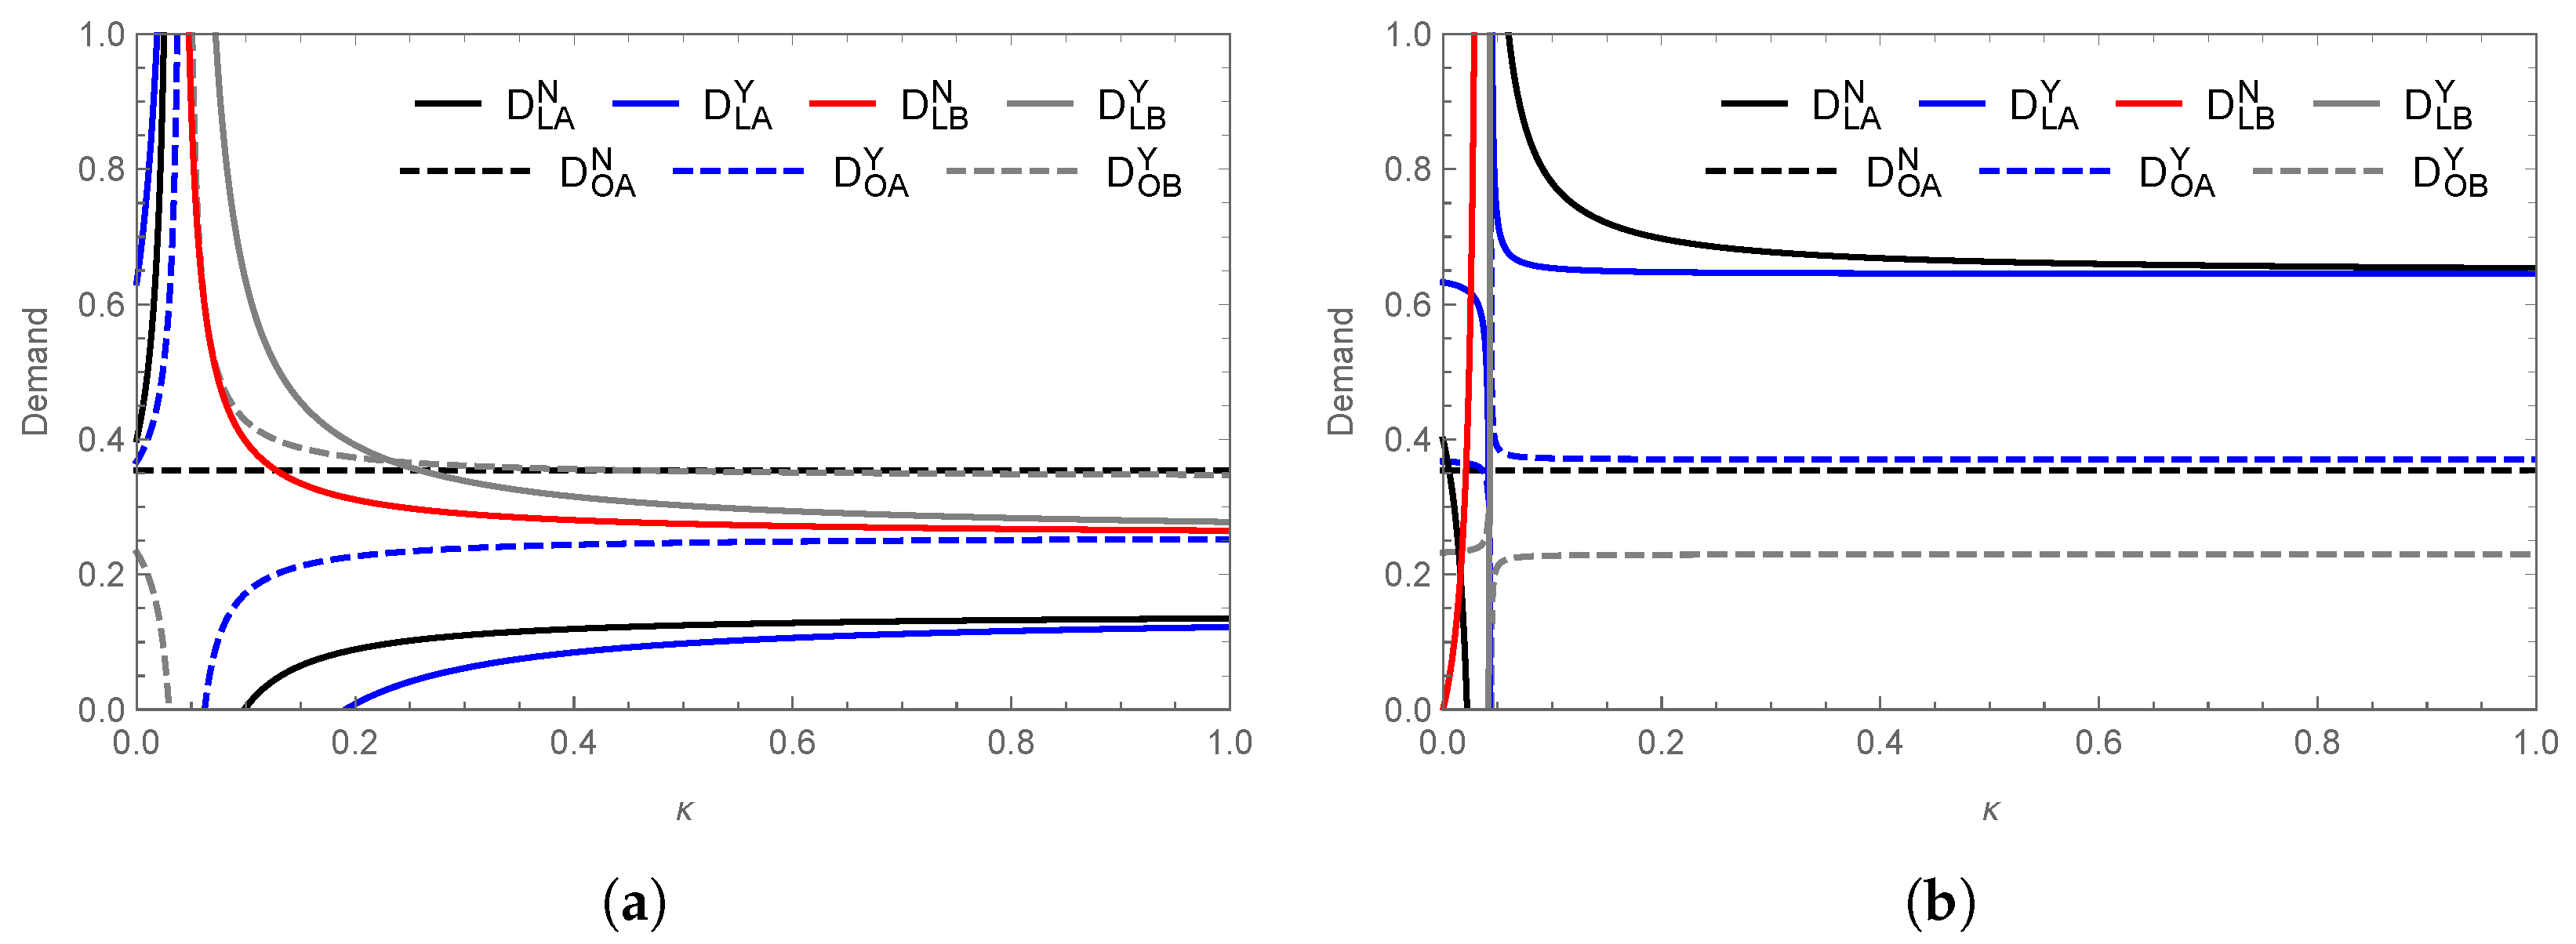
Consumer quality preference influences product demand within the constraint of . As illustrated in Figure 4, consistently affects both products, supporting Corollaries 2 and 5. Overall, marine crab demand increases with , while demand for inland saline–alkali crabs decreases. The quality reference effect of marine crabs raises consumer expectations, thereby reducing perceived quality differences and suppressing demand for inland saline–alkali crabs. A similar pattern is observed in the competition between Pacific white shrimp and ordinary shrimp, where strong brand identity enhances market competitiveness. Due to the stable quality of marine crabs, their demand remains consistently high, as reflected in and . At (Figure 4a), marine crab demand is higher in coastal markets, while demand for inland saline–alkali crabs exhibits . As increases, the relationship shifts to . At (Figure 4b), marine crab demand is lower in coastal markets than in inland markets. Across various market conditions, a and jointly influence demand, with consistently holding. Thus, supplier should leverage the quality reference effect of marine crabs in order to narrow the quality gap and enhance the competitiveness of inland saline–alkali crabs.
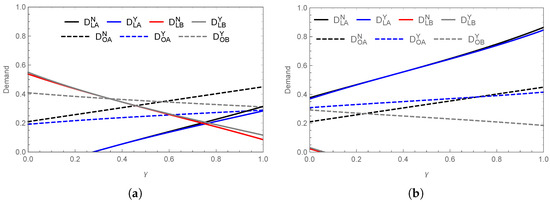
Figure 4.
Effect of consumer quality preference on prices of different products: (a) , (b) .
5.2. The Influence of Flavor Preferences on Suppliers
Consumer flavor preference differences reflect regional and cultural influences on product choices, with coastal and inland consumers demonstrating distinct flavor preferences.
Flavor preferences shape both subjective perceptions and market demand, influencing suppliers’ quality and pricing strategies. The impact of on the quality of saline–alkali crabs is moderated by and a, as confirmed by Corollaries 1 and 4. As shown in Figure 5, when is low (Figure 5a), the associated “travel cost” increases sharply, causing significant fluctuations in . In this case, quality improvement becomes a viable strategy for market encroachment. In coastal markets, inland saline–alkali crabs gain a competitive advantage due to their distinct flavor, which can be further enhanced through quality improvements. Conversely, when is high (Figure 5b), lower “travel costs” shift consumer focus toward price and brand, thereby reducing the impact of quality. As increases, the quality of saline–alkali crabs stabilizes. For example, Pacific white shrimp competes in coastal markets by prioritizing enhanced flavor and freshness, while inland suppliers prioritize consistent supply over quality improvements.
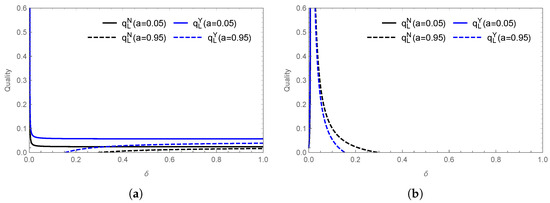
Figure 5.
Effect of flavor preference differences on quality of saline–alkali crab: (a) , (b) .
The impact of on pricing varies across markets and is jointly influenced by a and (Figure 6). Competitive pressure forces suppliers to adjust their pricing strategies in response to rivals. Under scenario N, pricing in coastal markets remains unaffected by , whereas under scenario Y it is influenced by , as confirmed by Corollaries 3 and 6. As a increases, marine crabs benefit from a stronger quality reference effect, which drives up their price. In contrast, saline–alkali crab prices are influenced by both a and . When both factors are low (Figure 6a) or high (Figure 6b), initially declines and then stabilizes, indicating that price reductions are a more effective strategy for stimulating demand. At moderate a levels (Figure 6b,c), rises with before stabilizing, allowing suppliers to maintain competitiveness through flexible pricing.
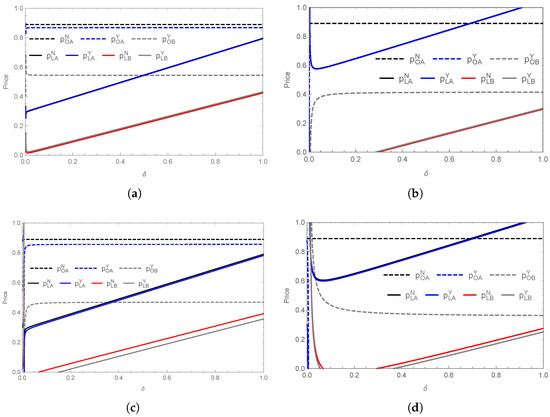
Figure 6.
Effect of flavor preference differences on prices of products: (a) , ; (b) , ; (c) , ; (d) , .
In inland markets, saline–alkali crab pricing follows a similar trend, but with lower volatility. Marine crab pricing is highly sensitive to a. When a is low (Figure 6a,c), prices rise rapidly or stabilize, indicating that consumers are willing to pay a premium when flavor differences are more pronounced. Conversely, when a is high (Figure 6b,d), price reduction becomes a more effective strategy, particularly when is low and is high. This has a stronger impact on saline–alkali crab pricing, especially in market encroachment scenarios. As shown in Figure 6a,b, the pricing relationship holds regardless of a, indicating that market encroachment boosts both the price and market share of inland saline–alkali crabs. This pattern mirrors the premium observed in geographical indication (GI) products, where product authenticity and regional branding often command higher prices. In competitive markets, adjusting pricing strategies and expanding market reach are crucial for enhancing product competitiveness and ensuring long-term profitability.
The relationship between differentiated product demand and flavor preference differences is shown in Figure 7. When is low, price fluctuations lead to greater demand volatility. As increases, demand becomes more stable. As illustrated in Figure 7a, with low search costs (), demand for marine crab initially rises rapidly before stabilizing regardless of whether inland saline–alkali crabs enter the market. In contrast, inland saline–alkali crab demand drops sharply before leveling off. When (Figure 7b), the demand trends reverse, with price becoming a more significant factor in consumer choice. Without market encroachment, inland saline–alkali crab suppliers cannot enter coastal markets (), leaving marine crab demand unaffected by . However, with market encroachment, demand is redistributed; some previously undecided consumers shift to marine crab, while others switch to inland saline–alkali crab. This scenario mirrors the Zhoushan hairtail market, where branding and regional identity enable product entry into new markets, highlighting the importance of flavor differentiation and strategic market positioning. According to utility function (1), potential consumers exist in incomplete markets, where product differentiation reshapes market dynamics. As a increases, consumers become more sensitive to price, leading to a reduction in overall demand. However, strong brands are able to capture a larger market share, highlighting the importance of brand effects in driving demand shifts. These brand effects help to mitigate the impact of price fluctuations, ultimately enhancing competitiveness in differentiated markets.
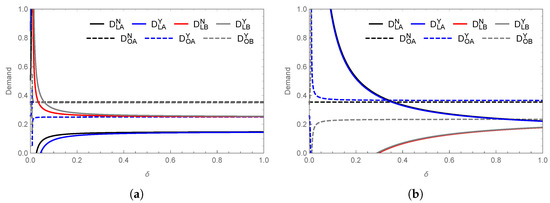
Figure 7.
Effect of flavor preference differences on demand for products in different markets: (a) , (b) .
5.3. The Influence of Technical Input Cost on Suppliers
The technological input cost is a critical factor that influences suppliers’ quality investment decisions; in particular, it directly impacts the profitability of supplier . The analysis of quality improvement costs and their effects on pricing and product quality provides a theoretical foundation for optimizing market strategies.
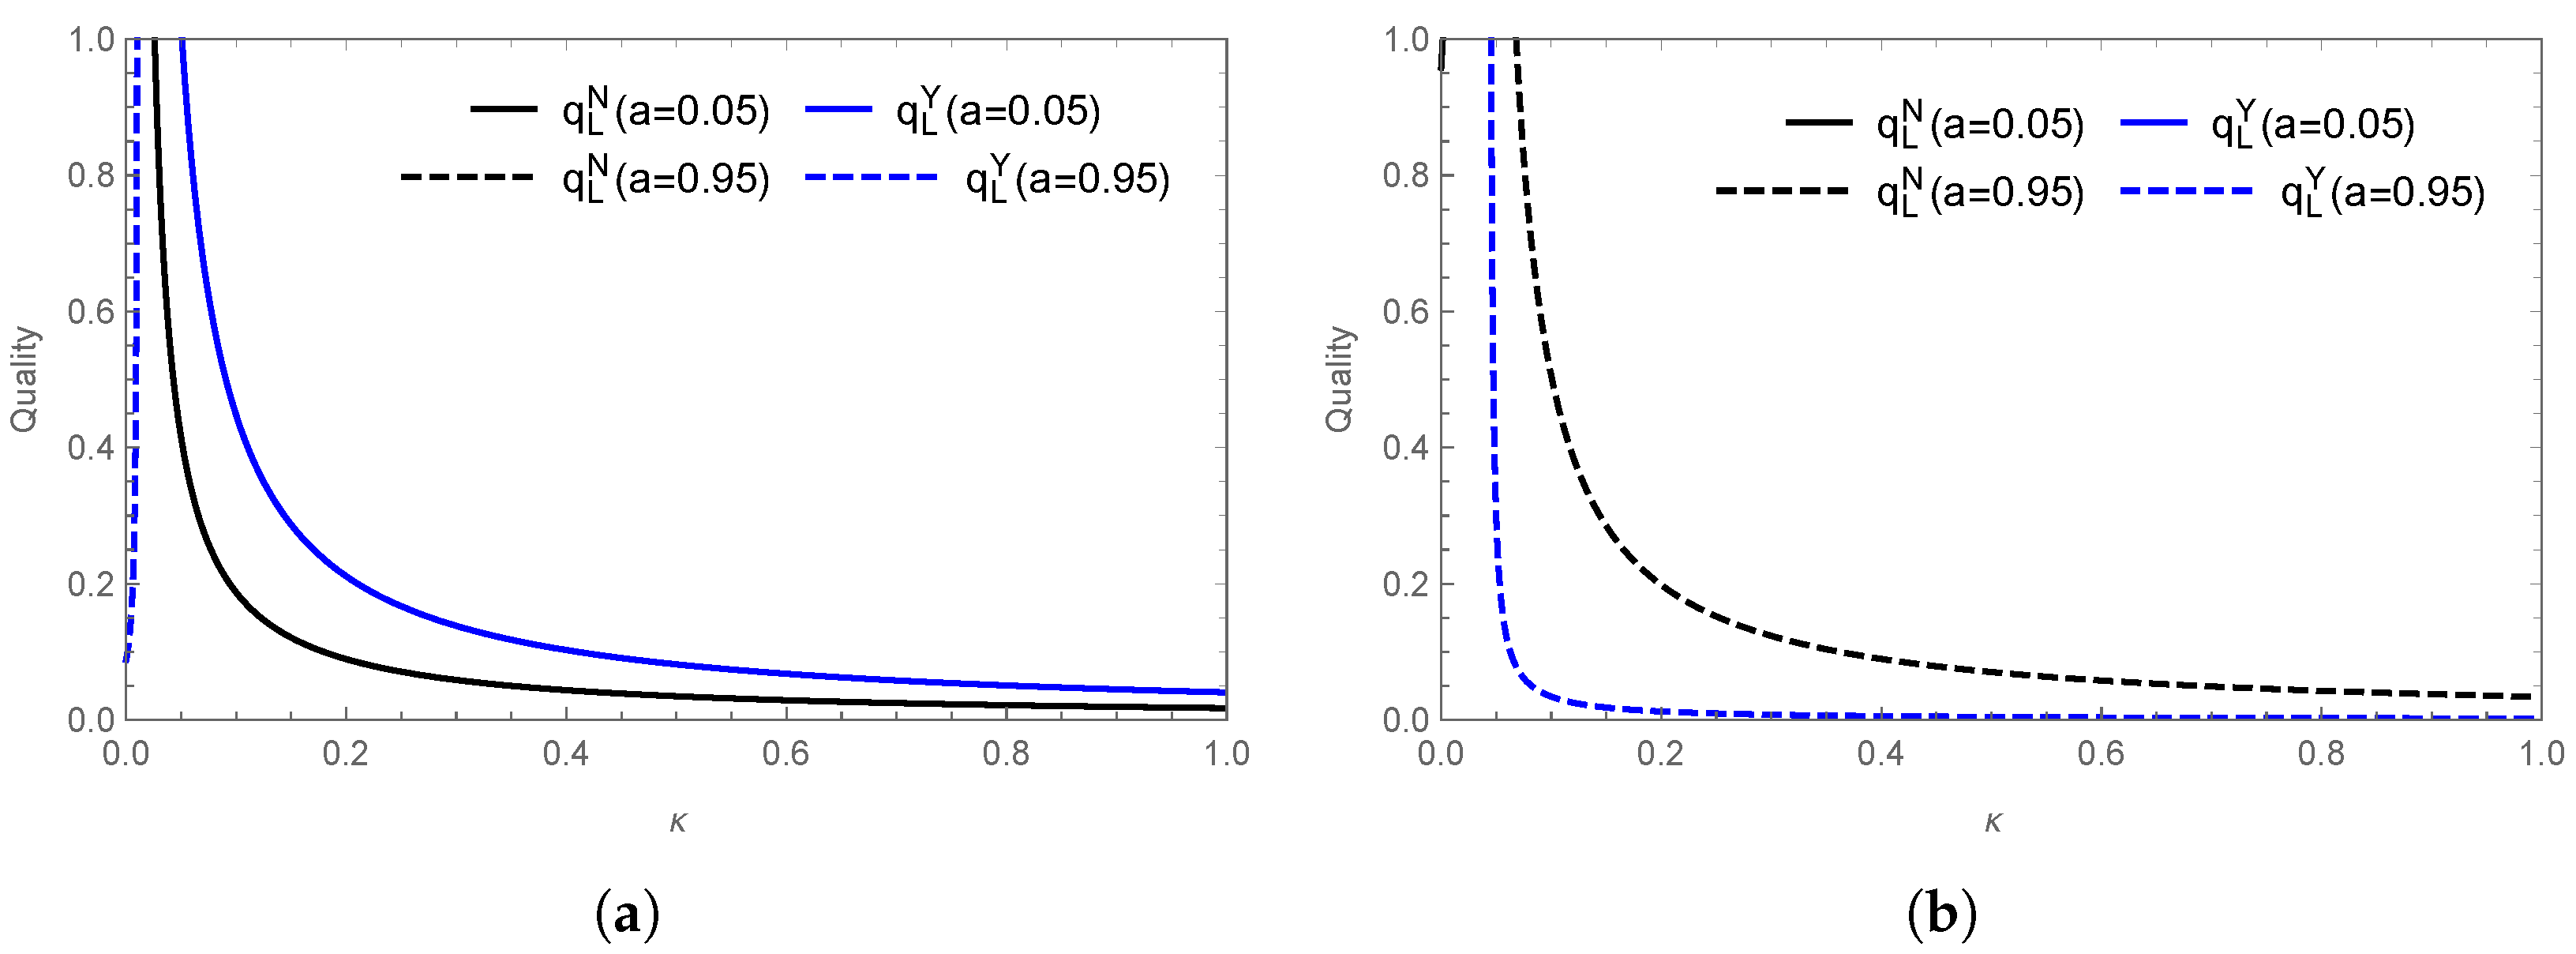
The relationship between and the quality of saline–alkali crabs (Figure 8) supports Corollaries 1 and 4, demonstrating that lower values of lead to higher quality improvement efficiency for supplier . As illustrated in Figure 8a,b, when is low, product quality declines sharply with increasing . To mitigate utility loss resulting from quality reduction, suppliers implement flexible pricing strategies to sustain competitiveness, similar to the way freshwater fish suppliers leverage pricing advantages to increase inland market share. These quality changes stabilize as exceeds a threshold, while further increases in elevate fixed costs and the average unit cost of quality improvement. Under profit-maximizing constraints, suppliers adjust their market strategies accordingly, while excessive quality improvement costs may lead to market exit. In scenario Y, when is low, supplier continues to supply high-quality products; however, when is high and consumers perceive a smaller difference between various types of crab, supplier becomes more likely to exit the coastal market. Quality improvement efficiency and cost structures are critical factors in the selection of market strategies. Thus, suppliers must balance cost management with market demand in order to optimize their decision-making around product quality and ensure long-term competitiveness.

Figure 8.
Effect of technological input cost coefficient on quality of saline–alkali crab: (a) , (b) .
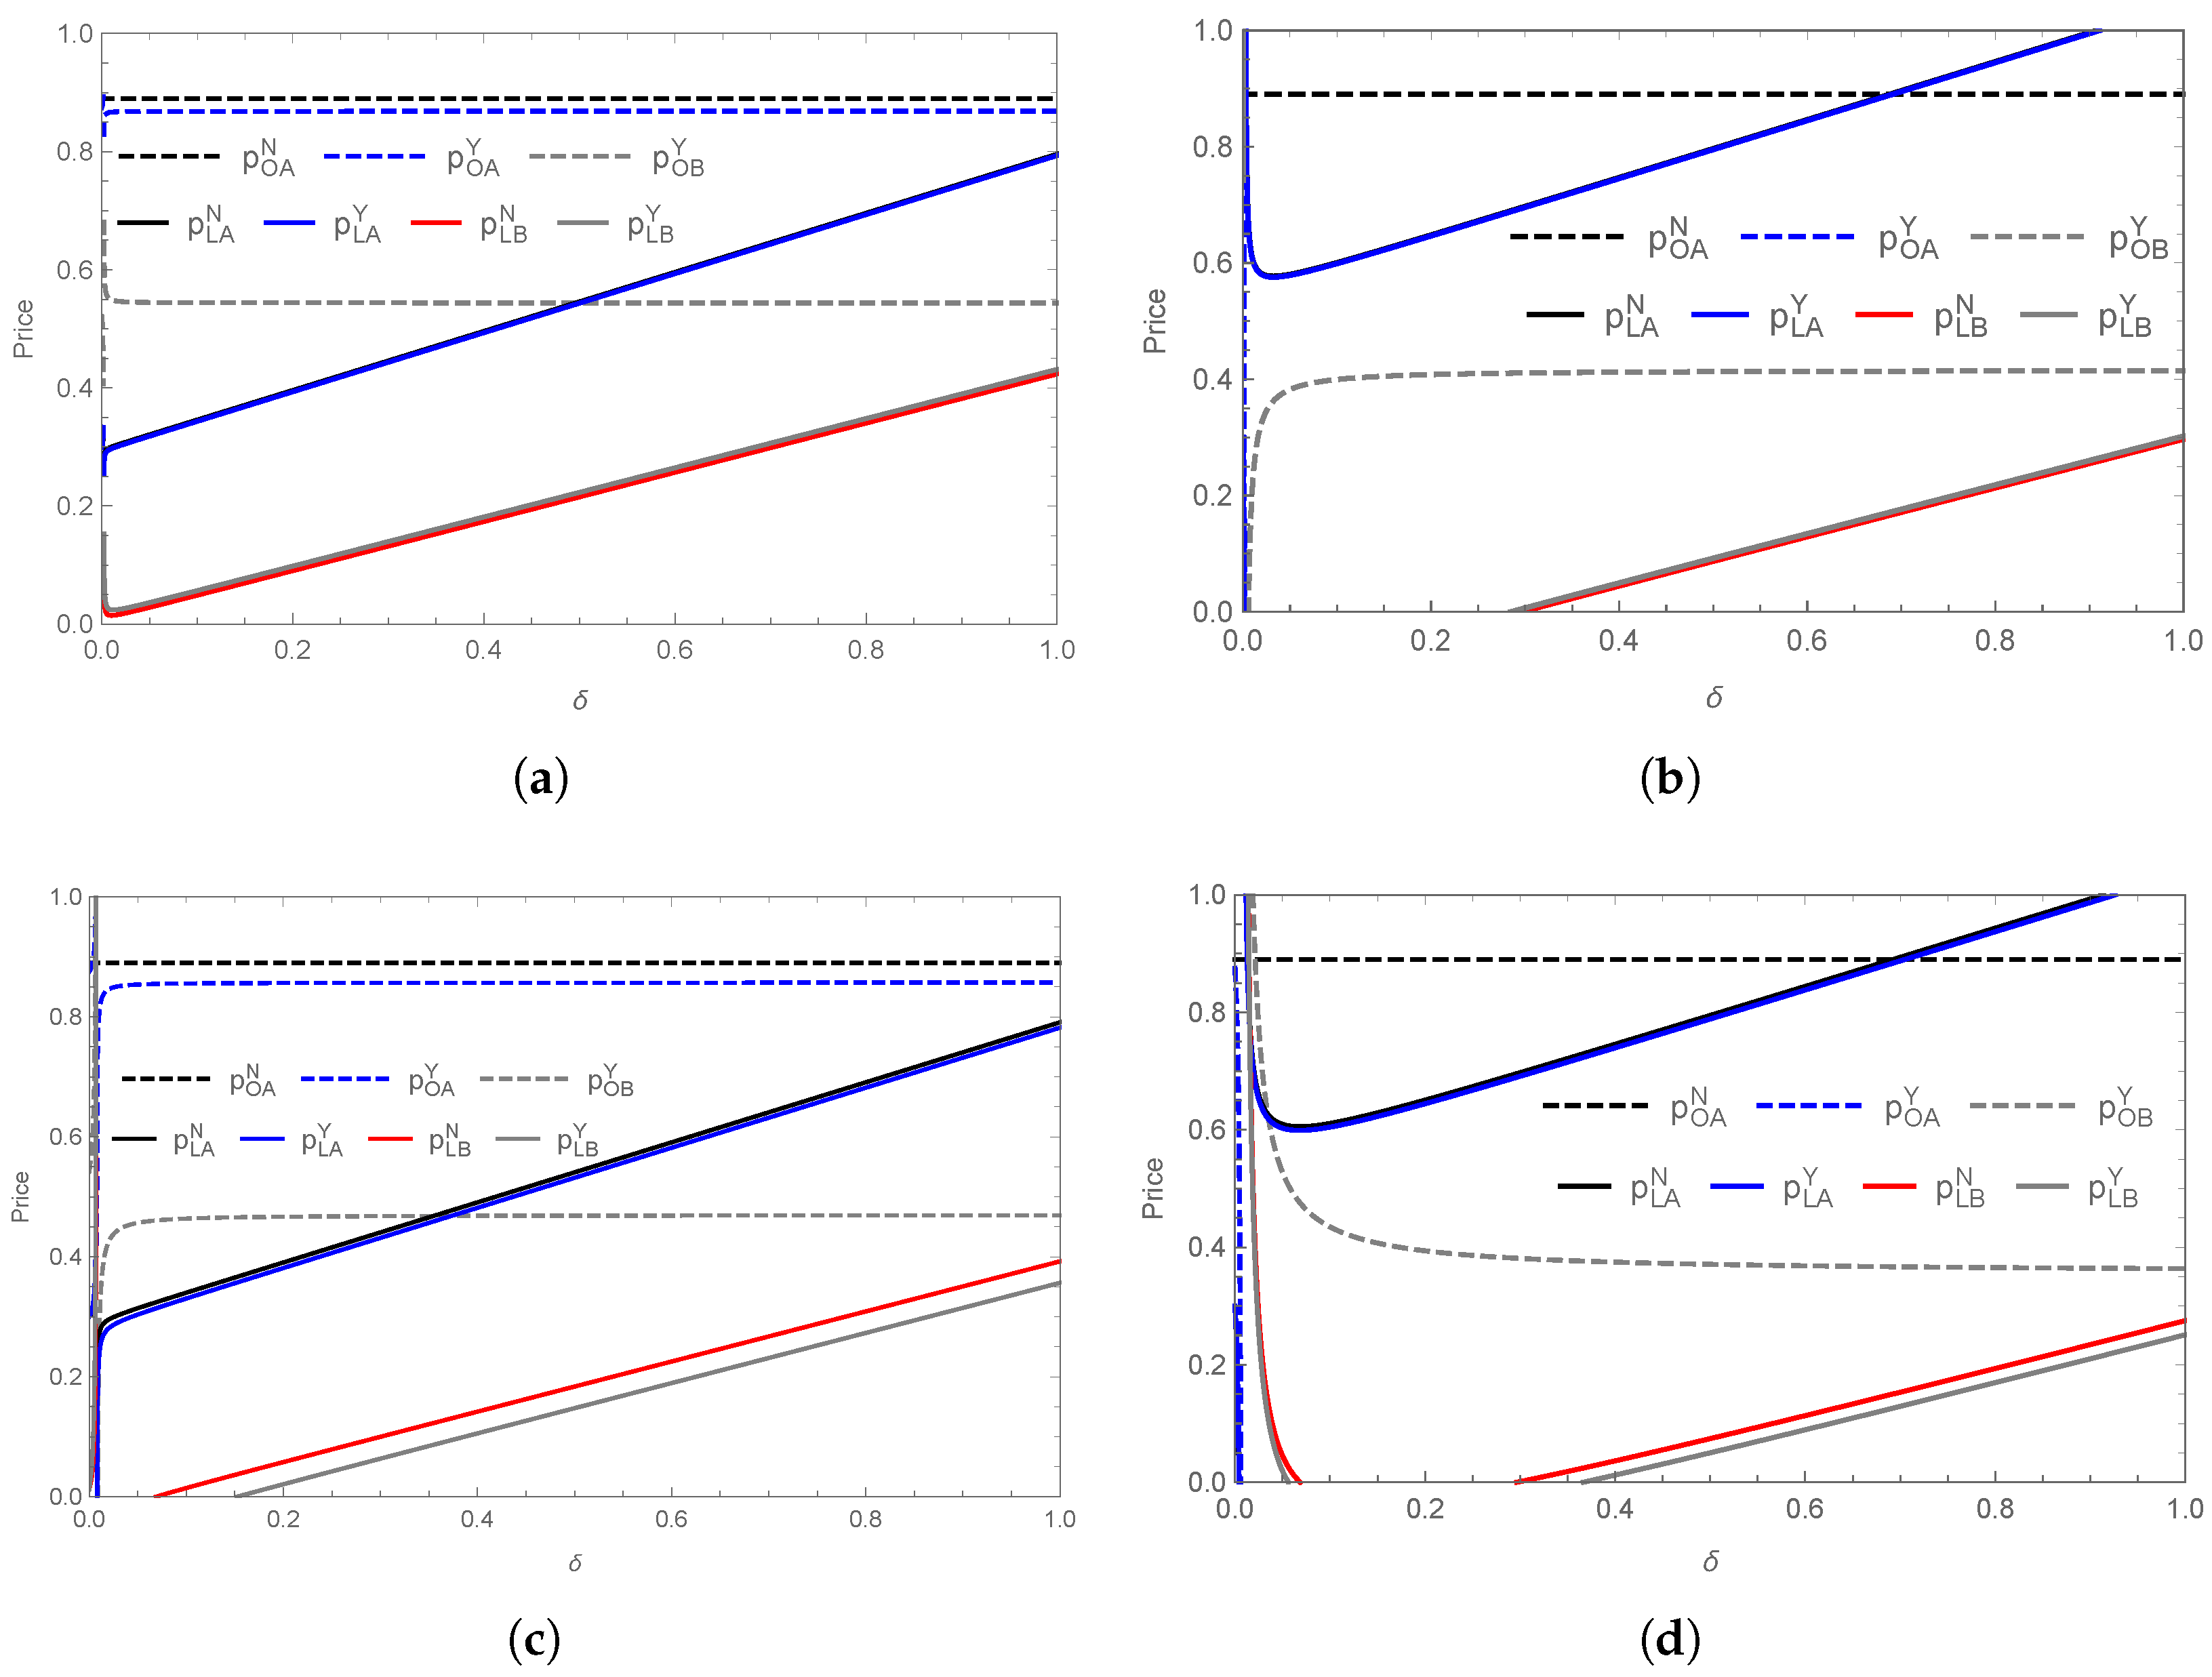
Figure 9 depicts the pricing and technological input cost , confirming Corollaries 1 and 7. In scenario N, is unaffected by . However, in scenario Y the prices of and are significantly influenced by . Information search moderates the effect of on marine crab pricing cost a. When a is low (Figure 9a,b), consumers can more easily access information on product quality, leading to a sharp price increase for marine crab, which subsequently stabilizes. This suggests that aligning prices with market positioning strengthens pricing power. Conversely, when a is high (Figure 9c,d), marine crab prices initially decline before stabilizing due to high search costs, which reduces consumer utility and limits pricing flexibility. The pricing of saline–alkali crabs is jointly influenced by and a. When both parameters are either low (Figure 9a) or high (Figure 9d), prices exhibit a “rise–fall–stabilization” pattern. When and a diverge (Figure 9a,c), prices initially rise before stabilizing as increases, emphasizing the role of differentiation strategies in price adjustments.
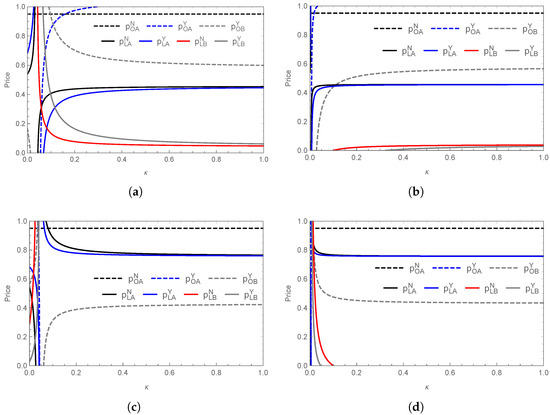
Figure 9.
Effect of technological input cost on prices of products: (a) , ; (b) , ; (c) , ; (d) , .
The impact of on product demand varies across market conditions, demonstrating a two-phase trend (Figure 10) involving an initial fluctuation phase followed by stabilization. When is low, demand volatility is high; as increases, demand stabilizes. The information search cost a directly influences this transition. When a is low (Figure 10a), marine crab demand surges before stabilizing, whereas saline–alkali crab demand declines before leveling off. In the stabilization phase, the demand order follows . Market encroachment by supplier increases the market share of inland saline–alkali crab, sometimes surpassing that of marine crab. This indicates that market encroachment strengthens consumer recognition, which is a common strategy in the promotion of new products. The demand trends shift when a is high (Figure 10b), favoring more familiar products. In the stabilization phase, demand follows the sequence , indicating a preference for marine crabs in both the inland and coastal markets. Here, high a restricts the market penetration of inland saline–alkali crabs, underscoring the importance of brand awareness and reduced search costs for successful entry. Numerous fresh seafood brands employ experiential marketing in these scenarios to improve consumer perception and preferences; for instance, seafood festivals can be used to heighten consumer exposure and facilitate new product market entry.
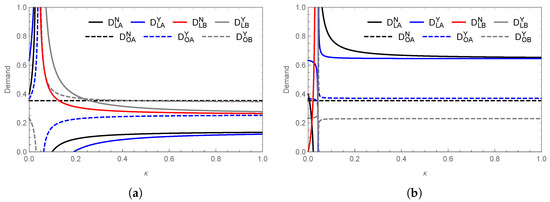
Figure 10.
Effect of technological input cost on demands of products in different markets: (a) , (b) .
5.4. Product Strategy in Segmented Markets
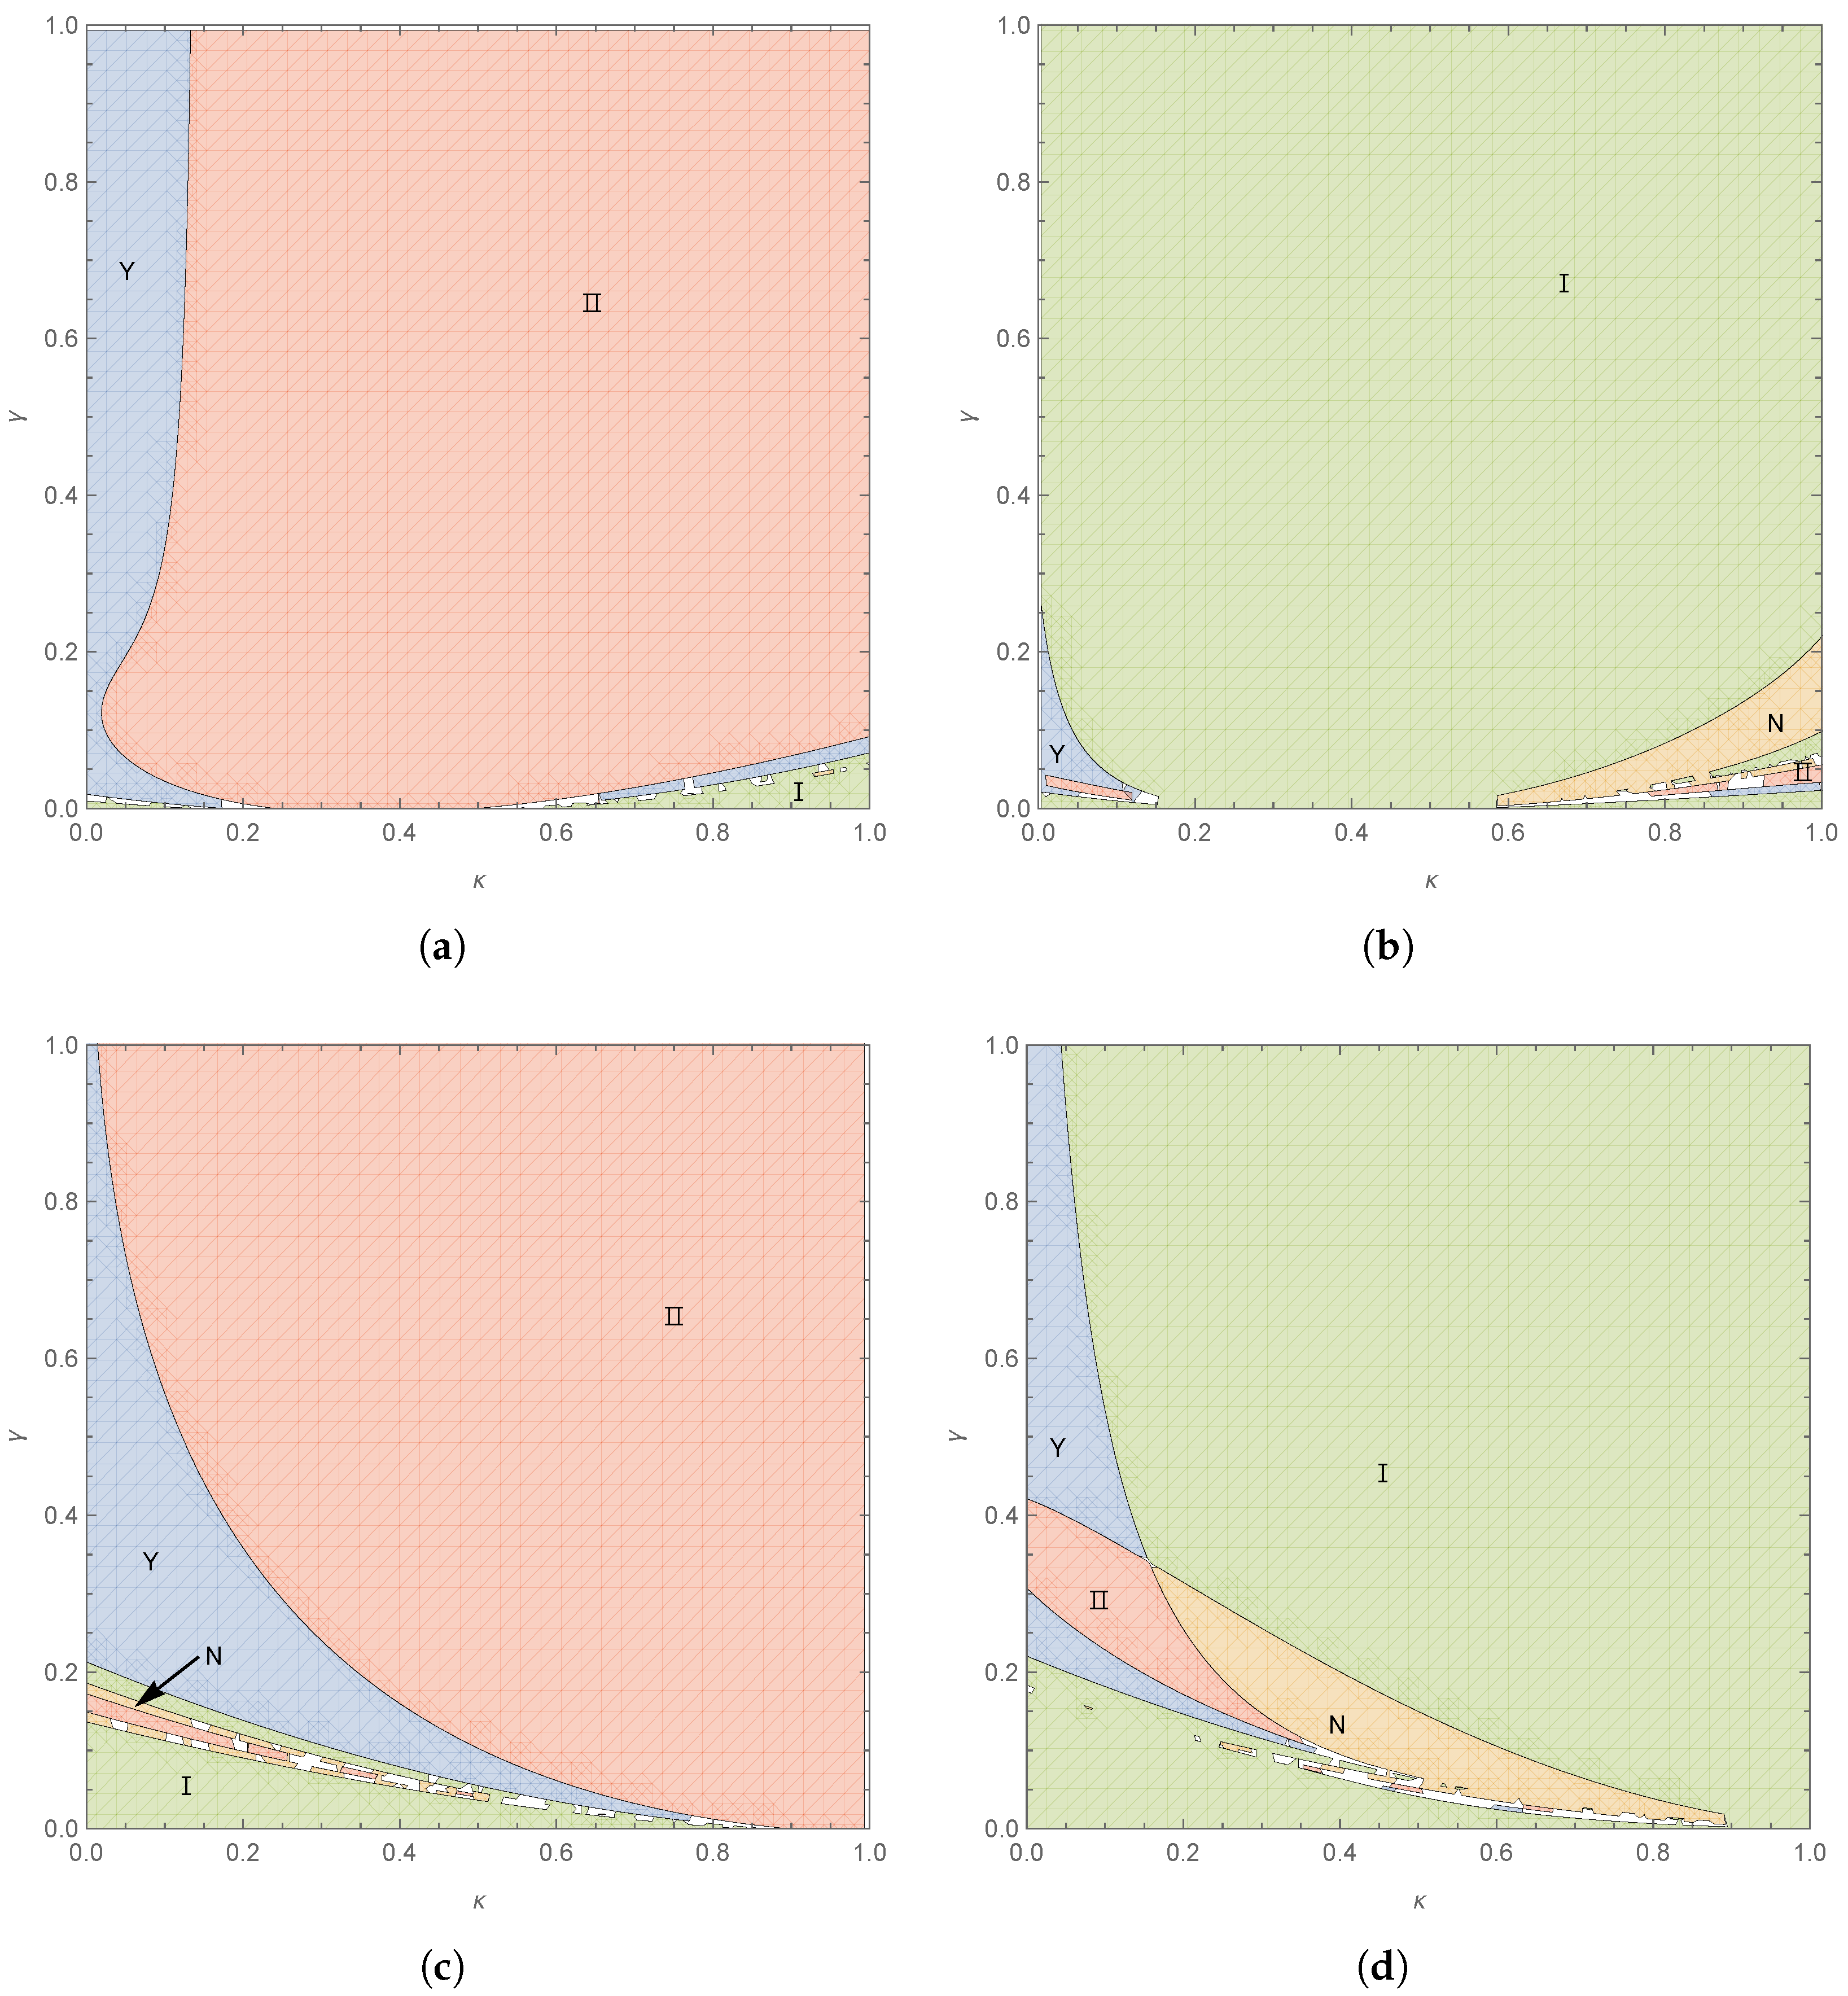
Consumer quality preference and quality improvement cost directly influence supplier strategy choices, whereas and a define the strategic decision-making framework. When or is low, suppliers are more likely to attain Pareto-optimal outcomes. In Region I, adopting strategy Y reduces profitability (), whereas supplier benefits from maintaining its premium positioning and brand effect (). In Region II, supplier benefits from scenario Y, while supplier incurs losses. Within the Pareto-optimal range, strategic adjustments may still optimize joint profitability.
Consumer quality preference plays a pivotal role in the selection of strategy. At low a (Figure 11a,c), encroachment benefits both suppliers when is low, as quality improvements are cost-efficient and contribute to enhanced market share. When a is high (Figure 11b,d), emerges as the decisive factor. Low favors market encroachment for supplier , whereas high diminishes quality-based advantages, positioning encroachment as the primary profit driver. At high , an increase in a may shift the optimal strategy, making market encroachment advantageous solely for supplier , underscoring the strategic significance of search costs. When is low, supplier demonstrates greater growth potential. If both and are low (Figure 11a,b), market encroachment remains the optimal strategy. As increases, low a favors supplier , while high a benefits supplier . When is high, this relationship is reversed. At low a (Figure 11a,c), broadens the equilibrium strategy range, thereby reducing competition. Supplier must meticulously manage its quality improvement costs in order to prevent diminishing returns in a competitive market. When both and a are high (Figure 11c,d), equilibrium Y partially shifts to Region II, while portions of Region II transition into N. To overcome these challenges, supplier can leverage a to influence coastal consumers by lowering its prices to compensate for perceived quality deficits. Alternatively, expanding into inland markets can help to mitigate the high search costs associated with coastal markets. In conclusion, supplier must optimize its quality improvement costs while adjusting both pricing strategies and market positioning according to varying conditions in order to ensure long-term competitiveness and profitability.

Figure 11.
The equilibrium strategies for consumer quality preference and technological input cost coefficient in segmented markets: (a) , ; (b) , ; (c) , ; (d) , .
5.5. Product Strategy in Hybrid Markets
The market for specialty aquatic products demonstrates pronounced regional characteristics influenced by variations in climate, geography, economic development, and cultural preferences. Advances in cold chain logistics and e-commerce platforms (e.g., Alibaba Rural Taobao and Pinduoduo’s agricultural initiatives) are gradually erasing regional boundaries, resulting in enhanced market integration and product circulation. This transformation is bringing about a hybrid market that encompasses both coastal and inland regions. In such markets, supplier decisions regarding quality and pricing are no longer confined by geographical limitations. By determining product quality in hybrid market C, supplier can strategically balance quality improvements and price competition to meet a broader range of consumer demand. Enhanced logistics and e-commerce platforms allow suppliers to transcend geographic barriers, extend their market reach [53], and promote the sustainable development of specialty aquatic products.
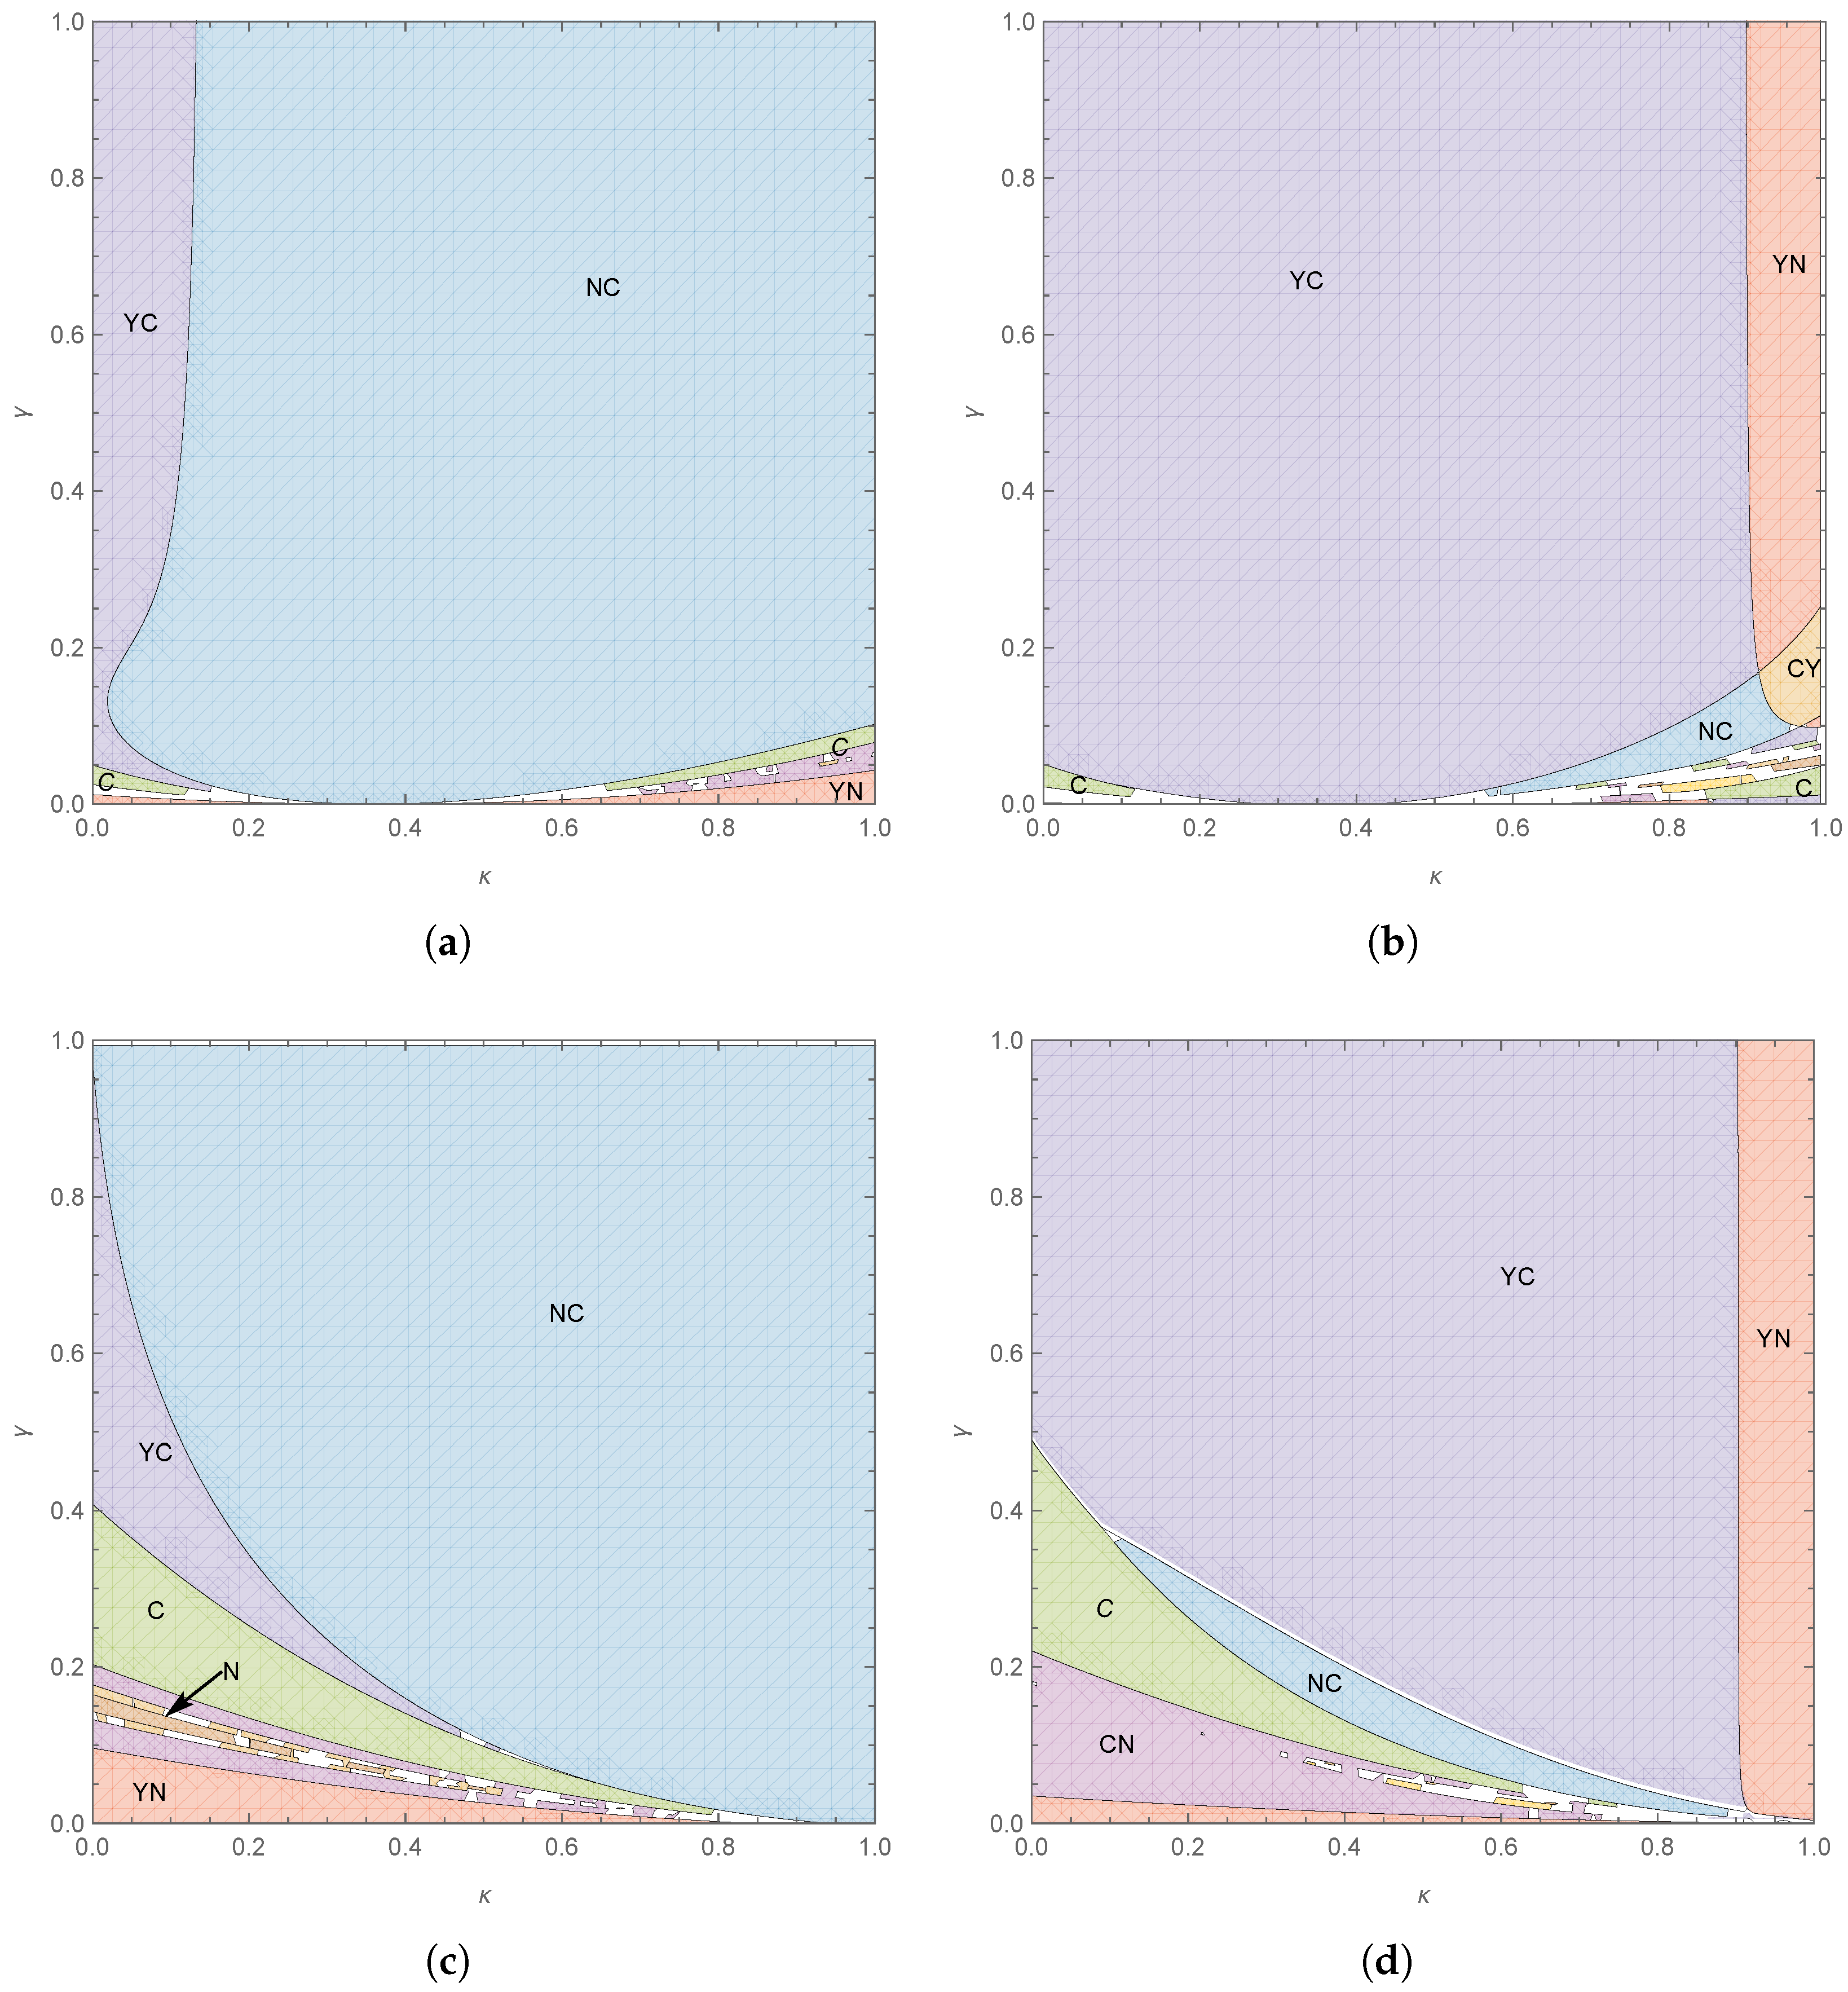
Figure 11 and Figure 12 illustrate notable shifts in optimal supplier strategies under hybrid market conditions, although the strategic boundaries remain largely consistent. Here, N, Y, and C represent Pareto-optimal strategies, while other outcomes indicate suboptimal strategies; for instance, NC refers to a scenario in which supplier selects N and supplier chooses C, with similar notations used for other cases. When consumer sensitivity to quality is high, supplier prefers scenario N, while supplier transitions from Y to C. Advanced logistics and e-commerce platforms significantly reduce market entry costs in the hybrid market scenario, enabling suppliers to invest more in quality improvements. Unlike traditional regional markets, which necessitate substantial market penetration efforts, hybrid markets have lower entry barriers, allowing suppliers to prioritize quality enhancements and strategic optimization. This reduces the costs for new entrants and provides them with a stronger competitive position.

Figure 12.
The equilibrium strategies for consumer quality preference and technological input cost coefficient in hybrid markets: (a) , ; (b) , ; (c) , ; (d) , .
When consumer sensitivity to quality is low, equilibrium strategies partially shift from Y to C under low search costs (Figure 12a,c), as informed consumers and intensified product competition enhance profitability. Under high search costs (Figure 12b,d), parts of Region II also shift to C, with supplier transitioning from N to C and from Y to C. The established market position of supplier and related consumer trust serve as a strategic reference for new entrants such as supplier . For new entrants, niche markets offer initial growth opportunities when infrastructure is underdeveloped. As infrastructure improves, supplier can achieve lower entry costs and expand into larger markets to gain a competitive advantage. A real-world example can be observed in remote regions of China such as Xinjiang, Qinghai, and Inner Mongolia, where logistics constraints have historically limited market participation. With advances in logistics, suppliers in these regions can now expand their market reach and optimize their strategies.
6. Conclusions
This paper addresses three core research questions regarding consumer preferences, supplier pricing strategies, and market competitiveness for saline–alkali crabs. Specifically, it analyzes how differences in consumer preferences for quality and flavor drive suppliers’ decisions on quality improvement and pricing across segmented and hybrid markets. Saline–alkali crab suppliers are found to face greater challenges in balancing cost structures and consumer expectations, requiring targeted pricing and differentiated quality strategies. Our model confirms that when quality improvement costs are high and sensitivity is low, niche markets become preferable; conversely, high sensitivity enables aggressive market encroachment by new entrants.
Quality improvement costs impact supplier market entry, while consumer perception and market structure guide decisions on quality and pricing. When quality sensitivity is low and improvement costs are high, suppliers tend to favor competing in niche markets. Conversely, when consumers prioritize quality, new entrants can capitalize on market encroachment, while incumbents leverage brand trust to sustain their competitive edge. During the early stages of development of the saline–alkali crab market, high-quality improvement costs favor local markets, while increased consumer awareness and market maturity facilitate encroachment into coastal markets.
Moreover, entry barriers are significantly lowered in hybrid markets characterized by improved logistics and e-commerce infrastructure, allowing suppliers to shift their strategic focus from market penetration to quality enhancement and competitive positioning. As infrastructure improves, especially in inland regions such as Xinjiang and Qinghai, new entrants can benefit from reduced entry costs and broader market access, enhancing their ability to compete through quality upgrades. These dynamics suggest that saline–alkali crab suppliers can achieve competitive positioning in inland and hybrid markets by aligning their strategic focus with regional infrastructure development and evolving consumer expectations.
Consumer quality preferences significantly influence the development of new product quality strategies and pricing decisions. Quality improvement costs also play a crucial role in shaping entry strategies, with high sensitivity and mature markets encouraging offerings with varying quality levels and lower sensitivity instead tending to favor targeting a single market. In addition, improvement costs shape the impact on pricing of consumer quality preferences. When these costs are low, greater emphasis by consumers on product quality can result in price reductions.
Flavor preference differences also impact consumer expectations and market acceptance. When these differences are minimal, quality improvement costs can support market encroachment. However, when differences are significant and costs are low, differentiation strategies enhance competitiveness. The effect of flavor preferences on pricing is influenced by both information search and quality improvement costs. If both of these costs are either high or low, moderate price reductions can improve market acceptance and competitiveness. Under hybrid market settings, our analysis identifies a partial strategic transition from encroachment to a quality-first strategy in hybrid markets, particularly when search costs are low and product competition intensifies. These findings highlight the managerial implication that hybrid market strategies may offer cost-effective paths to scalability, especially when aligned with consumer expectations and regional logistics development.
This paper has several limitations. First, the focus is specifically on examining how consumer preferences involving quality and flavor differences between crab types influence suppliers’ product strategies. Second, the analysis focuses only on heterogeneity in quality and flavor preferences, without accounting for other important factors such as price sensitivity, brand loyalty, and purchase frequency. Third, the impact of cross-regional circulation and the development of e-commerce on supplier strategies is not fully explored. Fourth, the model assumes a two-player market, while in real-world settings a larger number of competitors and strategic behaviors such as alliances and mergers may significantly affect market outcomes.
Future research could explore the impact of environmental improvements on consumer behavior, particularly how sustainability considerations influence demand. Investigating the role of government subsidies in fostering a positive cycle between economic and environmental benefits would provide valuable insights into the effectiveness of policy and market dynamics. Another promising area for study would be the influence of different sales channels on supplier decision-making. As suppliers increasingly adopt resale, agency, or hybrid models, understanding how these strategies affect competition could offer valuable insights into the evolution of business models and collaborative frameworks. In addition, investigating optimal strategies for managing these channels could help to further enhance suppliers’ competitiveness.
Author Contributions
Conceptualization, S.Z. and B.D.; methodology, S.Z. and B.D.; software, S.Z. and W.S.; validation, S.Z. and B.D.; formal analysis, S.Z., W.S. and B.D.; investigation, S.Z., W.S. and B.D.; writing—original draft preparation, S.Z. and B.D.; writing—review and editing, S.Z., W.S. and B.D.; supervision, B.D.; funding acquisition, B.D. All authors have read and agreed to the published version of the manuscript.
Funding
This research was funded by the National Natural Science Foundation of China (71771128, 72172069), the Fundamental Research Funds for the Provincial Universities of Zhejiang (SJWZ2021002, SJWY2021001), K. C. Wong Magna Fund in Ningbo University, and Special Fund for Innovative Open Experiment Project of Ningbo University.
Data Availability Statement
The data presented in this study are available on request from the corresponding author.
Acknowledgments
Thank the editors and the anonymous reviewers of this manuscript for their careful work.
Conflicts of Interest
The authors declare no conflicts of interest.
Appendix A. Substitutes for Complex Expressions
References
- Wang, C. Current status and high quality culture industry development strategiesof mud crab in genus Scylla in China: A review. J. Dalian Ocean. Univ. 2023, 38, 913–924. [Google Scholar]
- Jiang, X.; Niu, M.; Qin, K.; Hu, Y.; Li, Y.; Che, C.; Wang, C.; Mu, C.; Wang, H. Enhancement of Nutrient Composition and Non-Volatile Flavor Substances in Muscle Tissue of Red Drum (Sciaenops ocellatus) Through Inland Low Salinity Saline-Alkaline Water Culture. J. Agric. Food Chem. 2024, 72, 7326–7335. [Google Scholar] [CrossRef] [PubMed]
- Ding, W.; Lu, Q.; Fan, L.; Yin, M.; Xiao, T.; Guo, X.; Zhang, L.; Wang, X. Correlation of Taste Components with Consumer Preferences and Emotions in Chinese Mitten Crabs (Eriocheir sinensis): The Use of Artificial Neural Network Model. Foods 2022, 11, 4106. [Google Scholar] [CrossRef]
- Ministry of Education of China. Marine Crabs Settling Along Yellow River: Transforming Saline-Alkali Barren Land into Productive Fields—Ningbo University’s Targeted Assistance. 2022. Available online: http://www.moe.gov.cn/jyb_xwfb/xw_zt/moe_357/jjyzt_2022/2022_zt04/dianxing/xiangmu/shengshu/shengshu4th/202204/t20220418_619116.html (accessed on 27 December 2023).
- CCTV. Henan Yanjin: Large-Scale Crab Production in Saline-Alkali Land. 2021. Available online: https://sannong.cctv.com/2021/10/11/ARTIX1Uy44BQCZGTisIQbQAu211011.shtml (accessed on 14 March 2024).
- Ningxia Daily. New Prospects for Prosperity—Modern Agricultural Development in Ningxia. 2024. Available online: https://szb.nxrb.cn/nxrb/pc/con/202409/16/content_133968.html (accessed on 18 September 2024).
- Inner Mongolia Daily. Small Crabs Revitalizing Saline-Alkali Land. 2023. Available online: https://szb.northnews.cn/nmgrb/html/2023-10/11/content_44172_217975.htm (accessed on 14 March 2024).
- Qin, K.; Feng, W.; Ji, Z.; Jiang, X.; Hu, Y.; Li, Y.; Che, C.; Wang, C.; Mu, C.; Wang, H. Shrimp Cultured in Low-Salt Saline-Alkali Water has a Better Amino Acid Nutrition and Umami-Comparison of Flavors between Saline-Alkali Water- and Seawater-Cultured Litopenaeus vannamei. J. Agric. Food Chem. 2024, 72, 6585–6592. [Google Scholar] [CrossRef]
- Latsos, C.; Bakratsas, G.; Moerdijk, T.; van Houcke, J.; Timmermans, K.R. Effect of salinity and pH on growth, phycoerythrin, and non-volatile umami taste active compound concentration of Rhodomonas salina using a D-optimal design approach. J. Appl. Phycol. 2021, 33, 3591–3602. [Google Scholar] [CrossRef]
- Chen, Y.; Qin, K.; Liang, G.; Li, X.; Niu, M.; Wang, H.; Wang, C.; Mu, C.; Zhu, R. Comparative study on non-volatile flavor substances of Scylla paramamosain cultured in inland low saline-alkaline water. J. Food Compos. Anal. 2023, 118, 105157. [Google Scholar] [CrossRef]
- Chen, W.; Li, X.; Zhao, Y.; Chen, S.; Yao, H.; Wang, H.; Wang, C.; Wu, Q. Effects of short-term low salinity stress on non-volatile flavor substances of muscle and hepatopancreas in Portunus trituberculatus. J. Food Compos. Anal. 2022, 109, 104520. [Google Scholar] [CrossRef]
- Zhu, T.; Jin, M.; Peng, H.; Zhao, W.; Shen, Y.; Xie, S.; Zhou, Q. Cholesterol Modifies Nutritional Values and Flavor Qualities in Female Swimming Crab (Portunus trituberculatus). Aquac. Nutr. 2024, 2024, 7067588. [Google Scholar] [CrossRef]
- Wu, Q.; Shi, X.; Fang, S.; Xie, Z.; Guan, M.; Li, S.; Zheng, H.; Zhang, Y.; Ikhwanuddin, M.; Ma, H. Different biochemical composition and nutritional value attribute to salinity and rearing period in male and female mud crab Scylla paramamosain. Aquaculture 2019, 513, 734417. [Google Scholar] [CrossRef]
- Qin, K.; Li, X.; Jiang, X.; Hu, Y.; Li, Y.; Che, C.; Wang, H.; Wang, C.; Ye, C.; Mu, C.; et al. Effect of Domestication on Nonvolatile Flavor Substances in Mud Crabs (Scylla paramamosain): A Way to Improve the Quality of Commercial Crabs. J. Agric. Food Chem. 2023, 71, 15270–15279. [Google Scholar] [CrossRef]
- Thepaper.cn. East China Sea Crab Settles in Yulin: Transforming Saline-Alkali Land into Productive Farmland. 2023. Available online: https://www.thepaper.cn/newsDetail_forward_23597809 (accessed on 15 March 2024).
- Online, G. Xinjiang Has No “Sea”—So How Can It Farm “Seafood”? 2023. Available online: https://m.gmw.cn/2023-09/11/content_1303510963.htm (accessed on 28 December 2023).
- News, Q.N.L. Geographical Indications in Shandong: What Makes Yellow River Estuary Eriocheir Sinensis So Delicious? 2023. Available online: https://sdxw.iqilu.com/w/article/YS0yMS0xNTExMjQyNg.html (accessed on 28 December 2023).
- Xia, N.; Rajagopalan, S. Standard vs. custom Products: Variety, lead Time, and price competition. Mark. Sci. 2009, 28, 887–900. [Google Scholar] [CrossRef]
- Lauga, D.O.; Ofek, E. Product Positioning in a Two-Dimensional Vertical Differentiation Model: The Role of Quality Costs. Mark. Sci. 2011, 30, 903–923. [Google Scholar] [CrossRef]
- Cheung, R.; Lam, A.Y.; Lau, M.M. Drivers of green product adoption: The role of green perceived value, green trust and perceived quality. J. Glob. Sch. Mark. Sci. 2015, 25, 232–245. [Google Scholar] [CrossRef]
- Wang, Z.; Yang, T. Research on the product positioning strategy of the independent seller under platform encroachment. Systems 2024, 12, 36. [Google Scholar] [CrossRef]
- Liu, Z.; Geng, X.; Gao, Z.; Zhang, J. Consumer preference for fresh produce: Does the biological control influence their choices? Econ. Anal. Policy 2025, 85, 2030–2042. [Google Scholar] [CrossRef]
- Desai, P.; Kekre, S.; Radhakrishnan, S.; Srinivasan, K. Product differentiation and commonality in design: Balancing revenue and cost drivers. Manag. Sci. 2001, 47, 37–51. [Google Scholar] [CrossRef]
- Iyer, G. Coordinating Channels Under Price and Nonprice Competition. Mark. Sci. 1998, 17, 338–355. [Google Scholar] [CrossRef]
- Guo, L.; Zhang, J. Consumer Deliberation and Product Line Design. Mark. Sci. 2012, 31, 995–1007. [Google Scholar] [CrossRef]
- Raimondo, M.; Spina, D.; D’Amico, M.; di Vita, G.; Califano, G.; Caracciolo, F. Taste matters more than origin: An experimental economics study on consumer preferences for native and foreign varieties of walnuts. Food Qual. Prefer. 2024, 115, 105106. [Google Scholar] [CrossRef]
- Bohlmann, J.D.; Golder, P.N.; Mitra, D. Deconstructing the Pioneer’s Advantage: Examining Vintage Effects and Consumer Valuations of Quality and Variety. Manag. Sci. 2002, 48, 1175–1195. [Google Scholar] [CrossRef]
- Alptekinoğlu, A.; Corbett, C.J. Mass customization vs. mass production: Variety and price competition. Manuf. Serv. Oper. Manag. 2008, 10, 204–217. [Google Scholar] [CrossRef]
- Takagoshi, N.; Matsubayashi, N. Customization competition between branded firms: Continuous extension of product line from core product. Eur. J. Oper. Res. 2013, 225, 337–352. [Google Scholar] [CrossRef]
- Chen, Y.; Iyer, G. Research Note Consumer Addressability and Customized Pricing. Mark. Sci. 2002, 21, 197–208. [Google Scholar] [CrossRef]
- Oertel, C.; Schmutzler, A. Challenging the incumbent: Entry in markets with captive consumers and taste heterogeneity. J. Econ. Manag. Strategy 2022, 31, 961–979. [Google Scholar] [CrossRef]
- Ha, A.; Long, X.; Nasiry, J. Quality in Supply Chain Encroachment. Manuf. Serv. Oper. Manag. 2016, 18, 280–298. [Google Scholar] [CrossRef]
- Dai, B.; Wang, M.; Ke, J. Implications of product line competition on channel matching strategies in a retail platform. Nav. Res. Logist. 2023, 70, 145–164. [Google Scholar] [CrossRef]
- Chen, J.; Liang, L.; Yao, D.Q.; Sun, S. Price and quality decisions in dual-channel supply chains. Eur. J. Oper. Res. 2017, 259, 935–948. [Google Scholar] [CrossRef]
- Chen, W.; Yang, H. Assortment planning for vertically differentiated products under a consider-then-choose model. Oper. Res. Lett. 2019, 47, 507–512. [Google Scholar] [CrossRef]
- Li, X.; Cai, X.; Chen, J. Quality and private label encroachment strategy. Prod. Oper. Manag. 2022, 31, 374–390. [Google Scholar] [CrossRef]
- Yang, H.; Luo, J.; Zhang, Q. Supplier encroachment under nonlinear pricing with imperfect substitutes: Bargaining power versus revenue-sharing. Eur. J. Oper. Res. 2018, 267, 1089–1101. [Google Scholar] [CrossRef]
- Xu, J.; Zhou, X.; Zhang, J.; Long, D.Z. The optimal channel structure with retail costs in a dual-channel supply chain. Int. J. Prod. Res. 2021, 59, 47–75. [Google Scholar] [CrossRef]
- Mou, Z.; Ding, K.; Fu, Y.; Sun, H. Supplier encroachment channel selection on an online retail platform. Systems 2025, 13, 66. [Google Scholar] [CrossRef]
- Liang, L.; Chen, J.; Yao, D. Switching to profitable outside options under supplier encroachment. Prod. Oper. Manag. 2023, 32, 2788–2804. [Google Scholar] [CrossRef]
- Yao, Y.; Zhang, J.; Fan, X. Strategic pricing: An anti-encroachment policy of retailer with uncertainty in retail service. Eur. J. Oper. Res. 2021, 302, 144–157. [Google Scholar] [CrossRef]
- Cui, Q. Quality investment, and the contract manufacturer’s encroachment. Eur. J. Oper. Res. 2019, 279, 407–418. [Google Scholar] [CrossRef]
- Choi, S.C.; Turut, O. National brand’s competition with premium private labels: The role of context-dependent preferences. J. Bus. Res. 2023, 165, 114038. [Google Scholar] [CrossRef]
- Hamzah, I.N.; Huang, W. The dynamics of strategically important food preference in Indonesia: An empirical evaluation of consumption pattern and welfare loss. Econ. Anal. Policy 2023, 79, 435–449. [Google Scholar] [CrossRef]
- Kumar, S.; Talwar, S.; Murphy, M.; Kaur, P.; Dhir, A. A behavioural reasoning perspective on the consumption of local food. A study on REKO, a social media-based local food distribution system. Food Qual. Prefer. 2021, 93, 104264. [Google Scholar] [CrossRef]
- Hasanzade, V.; Elshiewy, O.; Toporowski, W. Is it just the distance? Consumer preference for geographical and social proximity of food production. Ecol. Econ. 2022, 200, 107533. [Google Scholar] [CrossRef]
- Zhou, J.X.; Arnold, M.J.; Pereira, A.; Yu, J. Chinese consumer decision-making styles: A comparison between the coastal and inland regions. J. Bus. Res. 2010, 63, 45–51. [Google Scholar] [CrossRef]
- Yu, J.; Zhou, J.X. Segmenting Young Chinese Consumers Based on Shopping-Decision Styles: A Regional Comparison. J. Int. Consum. Mark. 2009, 22, 59–71. [Google Scholar] [CrossRef]
- Ahmadi, R.; Iravani, F.; Mamani, H. Coping with Gray Markets: The Impact of Market Conditions and Product Characteristics. Prod. Oper. Manag. 2015, 24, 762–777. [Google Scholar] [CrossRef]
- Bernstein, F.; Song, J.; Zheng, X. Free riding in a multi-channel supply chain. Nav. Res. Logist. 2009, 56, 745–765. [Google Scholar] [CrossRef]
- Zhang, Z.; Ren, D.; Lan, Y.; Yang, S. Price competition and blockchain adoption in retailing markets. Eur. J. Oper. Res. 2021, 300, 647–660. [Google Scholar] [CrossRef]
- Garella, P.G.; Laussel, D.; Resende, J. Behavior based price personalization under vertical product differentiation. Int. J. Ind. Organ. 2021, 76, 102717. [Google Scholar] [CrossRef]
- Zhang, X.; Zhang, S.; Du, B. To compete or to collaborate? Logistics service sharing and retailers’ resale in competitive online channels. Systems 2023, 11, 358. [Google Scholar] [CrossRef]

Disclaimer/Publisher’s Note: The statements, opinions and data contained in all publications are solely those of the individual author(s) and contributor(s) and not of MDPI and/or the editor(s). MDPI and/or the editor(s) disclaim responsibility for any injury to people or property resulting from any ideas, methods, instructions or products referred to in the content. |
© 2025 by the authors. Licensee MDPI, Basel, Switzerland. This article is an open access article distributed under the terms and conditions of the Creative Commons Attribution (CC BY) license (https://creativecommons.org/licenses/by/4.0/).