Abstract
Efficient urban traffic management is crucial for mitigating congestion and enhancing road safety. This study introduces a novel algorithm, with code provided, to generate a traffic light conflict matrix, identifying potential signal conflicts solely based on road network topology. Unlike existing graphical approaches that are difficult to execute automatically, our method leverages readily available topological data and adjacency matrices, ensuring broad applicability and automation. While our approach deliberately focuses on topology as a stable foundation, it is designed to complement rather than replace dynamic traffic analysis, serving as an essential preprocessing layer for subsequent temporal optimization. Implemented in MATLAB, with specific functionality for Vissim users, the algorithm has been tested on various networks with up to 547 traffic lights, demonstrating high efficiency, even in complex scenarios. This tool enables focused allocation of computational resources for traffic light optimization and is particularly valuable for prioritizing emergency vehicles. Our findings make a significant contribution to traffic management strategies by offering a scalable and efficient tool that bridges critical gaps in current research. As urban areas continue to grow, this algorithm represents a step forward in developing sustainable solutions for modern transportation challenges.
1. Introduction
Urban traffic management presents significant challenges, with congestion and accidents negatively impacting quality of life and economic productivity. In 2019, traffic accidents in the United States resulted in 36,500 deaths and a USD 340 billion economic cost [1]. In 2022, congestion caused average delays of 54 h per traveler, leading to USD 224 billion in losses [2]. Addressing these issues requires efficient traffic light control, especially in complex networks where signal conflicts occur within and between intersections [3]. Traffic analysis and optimization is influenced by internal factors, like network topology, and external factors, such as events and weather conditions.
To address these challenges, research has increasingly focused on automating traffic signal management. Coordinating traffic signals is a proven strategy for optimizing transportation systems [4,5] and enhancing road safety [6]. Effective coordination requires understanding the relationships among traffic signals, which must be established by manipulating available data.
The evolution of traffic analysis techniques has expanded from isolated intersections to complex spatio-temporal relationships across entire networks [7,8]. These methods require both spatial and temporal information, and they are often represented through graphs or adjacency matrices. For instance, Spatio-Temporal Multi-Agent Reinforcement Learning (STMARL) [9] constructs a directional traffic light adjacency graph based on spatial structures before analyzing temporal dependencies.
While some studies focus on isolated intersections and attempt to relate them through adjacency [10,11], our approach, similar to Wang et al.’s, focuses on the relationships between individual traffic lights across the entire network, allowing for a more comprehensive understanding of potential conflicts.
Our method identifies traffic light conflicts using network topology, offering several advantages:
- Stable conflict detection that is unaffected by temporary changes in traffic patterns or signal timing.
- Large-scale analysis without costly real-time data collection.
- Proactive conflict identification and resolution based on structural relationships.
This topological approach is valuable for long-term urban planning and serves as a preprocessing step for detailed optimization techniques. Building on our previous work on traffic light adjacency list algorithms [12], we introduce a scalable method for identifying conflicting traffic lights using readily accessible GIS datasets.
Key contributions of this work include the following:
- A scalable methodology to identify conflicting traffic lights using only topological data.
- Utilization of widely available network infrastructure datasets.
- Extension of adjacency list algorithms to address traffic light conflicts.
- Enhanced traffic flow continuity through conflict identification and resolution.
- Improved emergency vehicle prioritization through immediate spatial coordination.
- A practical, sustainable tool for urban traffic management.
These contributions address critical gaps in traffic optimization and provide solutions for improving urban transportation networks. Our approach presents a foundational layer of information that is crucial for understanding and optimizing urban traffic patterns based on network topology.
To ensure reproducibility and facilitate further research, we have attached all the necessary MATLAB codes as complementary files. These codes allow for the complete reproduction of our algorithm on the four networks used in our experiments. By providing these implementation details, we aim to support transparency in research and enable other researchers to build upon or validate our work.
Section 2 reviews related works in traffic signal control and network analysis. Section 3 provides the key definitions used in our methodology. Section 4 details the proposed algorithm for generating the traffic light conflict matrix. Section 5 presents the experimental setup and results, demonstrating the algorithm’s performance across four different urban networks. Section 6 discusses the implications of our findings, and Section 7 offers conclusions and recommendations for future research. Finally, Appendix A provides detailed examples, illustrating the methodology for both isolated intersections and network-wide scenarios, along with Supplementary CSV Files, which contain complete matrices to enhance reproducibility and facilitate further analysis.
2. Related Works
The evolution of traffic signal control (TSC) systems has been driven by the need to manage increasing urban congestion effectively. From isolated intersections to large-scale networks, all strategies require an understanding of the relationships between traffic signals. While most strategies concentrate on isolated intersections due to scalability and lower computational costs, research on optimizing complete networks has grown significantly, particularly with the use of computational intelligence (CI) models [13].
CI tools are well suited for identifying spatial correlations and time-based events within networks [14], often utilizing graphs where nodes represent study objectives and edges indicate their relationships [15,16]. However, many publications overlook the relationships between signals or provide non-specific suggestions on obtaining these relationships. Some studies consider phase information [17], while others require additional data about intersections [18] or rely on network topology [9].
In our previous work [12], we proposed an algorithm that establishes relationships among traffic signals in a complete network using an adjacency list based on topology. This approach provides valuable information for generating green waves and prioritizing traffic signals for emergency vehicles.
Li et al. [19] developed a higher-order conflict graph approach for network-wide traffic signal control. Their method models traffic signal configurations using a conflict graph, where nodes represent movements permitted by specific signal phases and edges connect conflicting movements. While our approach shares similarities with Li’s work in considering movements permitted by signal heads, there are key differences in methodology and focus.
We employed adjacency matrices derived from our previous work to calculate the traffic light conflict matrix, allowing for efficient computation and representation of conflicts between signal heads. Our algorithm automates the entire process of generating the conflict graph, eliminating manual intervention and improving scalability. Our current focus is on efficiently identifying and representing conflicts without addressing timing optimization, serving as a crucial filter for other optimization tools. The traffic light conflict matrix generated by our method is particularly valuable for emergency vehicle prioritization systems, providing a clear representation of potential conflicts for efficient emergency routing.
These distinctions highlight the different objectives of our respective methods for analyzing traffic signal networks, despite the shared basis in movement-based conflict graphs.
3. Definitions
3.1. Adjacency Matrix
Consider an undirected graph with vertex set V and edge set E. The adjacency matrix representation A of G constitutes a square matrix of order . The entries of this matrix are determined by the following rule:
where vertices .
For directed graphs, we modify this formulation accordingly:
The adjacency matrix, thus, encodes the graph structure G into numerical form, where each non-zero entry signifies connectivity between vertices and . In weighted graphs, these entries may instead correspond to edge weights rather than binary values.
3.2. Traffic Light Conflict Matrix
The traffic light conflict matrix C is an symmetric matrix that represents conflicts between traffic signal heads in a road network. Each element indicates whether signal heads i and j control conflicting movements.
Alternatively, the traffic light conflict matrix can be computed as follows:
where
- A is the adjacency matrix describing the connections between real signal heads (SH) and crossing signal heads (CH).
- is the transpose of the adjacency matrix.
- The product determines the conflicts between signal heads based on shared connections to conflict points.
This formulation is useful in traffic network analysis, allowing for efficient conflict detection using matrix operations.
3.3. Road
A road is a transportation route designed for vehicles and pedestrians. It is typically paved, publicly accessible, and connects towns, cities, regions, or countries.
3.4. Link
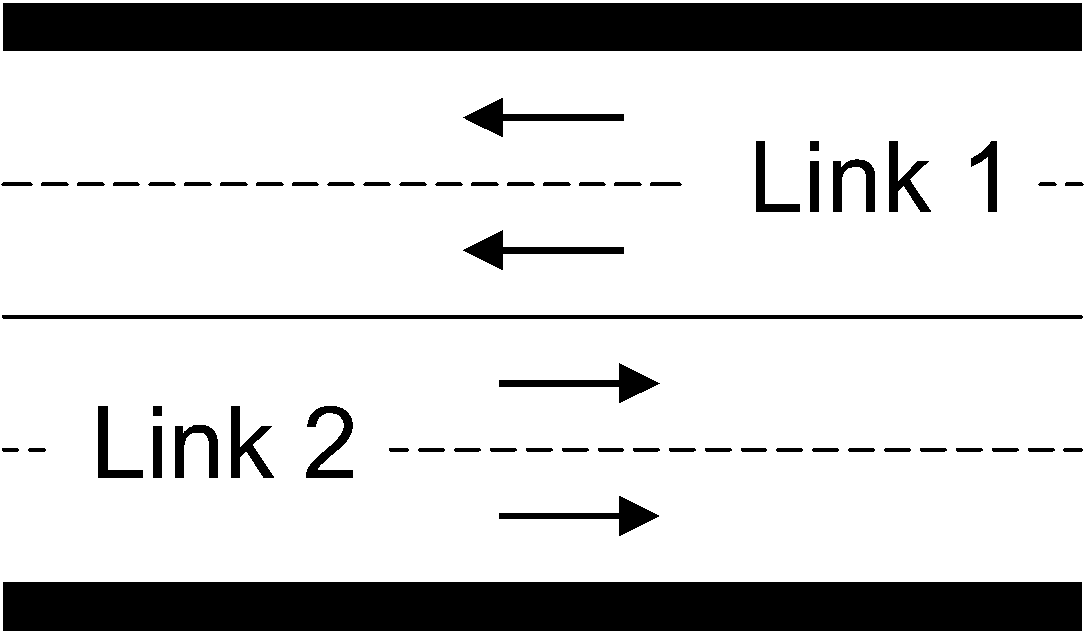
In this study, a link refers to a segment of road infrastructure, modeling roads, streets, lanes, or other transportation pathways. A link can be considered a segment or representation of a road within a traffic simulation or model. Some considerations when representing roads using links include the following:
- Unidirectionality and bidirectionality: In the case of a bidirectional road, two separate links are modeled, one for each direction.
- Direction of traffic: When simulating traffic with PTV Vissim, ensure that the direction of traffic flow on the links matches the actual road design.
- Connections: Connections between different links must occur at endpoints, not at intermediate points.
Figure 1 shows an example of a right-hand traffic road with two-way traffic that is analytically divided into two links.
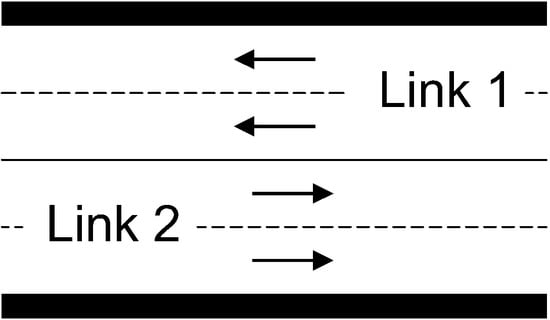
Figure 1.
Two-way road represented by two links, each for a different traffic direction.
3.5. Traffic Light
A traffic light is a signaling device that regulates traffic flow at intersections, pedestrian crossings, and key points in a road network. Its main function is to ensure safe and efficient movement by controlling the right of way for vehicles and pedestrians.
3.6. Signal Head
A signal head is a simulated object that replicates the function of a real traffic light within a road network. It represents traffic signals, including control lights for different traffic directions and users, such as vehicles and pedestrians.
3.7. Endpoint Signal Head
An endpoint signal head is a fictitious traffic signal introduced at network boundaries to represent the endpoints of a road network. It helps define the system’s limits and facilitates the analysis of traffic flow interactions beyond intersections.
3.8. Cut Signal Head
A crossing signal head is a virtual signal introduced at conflict points where vehicle paths intersect within an intersection or road network. It is used to model and identify potential traffic signal conflicts based on movement patterns.
4. Materials and Methods
4.1. Challenges in Network Analysis
The implementation of our methodology faced several significant challenges during development. When working with complex traffic networks, we identified three primary obstacles that required specific solutions.
First, establishing relationships between traffic lights belonging to intersecting roads proved particularly complex. Our solution introduced “fictional crossing signal heads” at intersection points, allowing us to model conflict areas without modifying existing physical infrastructure.
Second, developing an algorithm to accurately locate points where roads intersect presented considerable computational difficulties. Our current implementation uses a basic geometric approach that identifies potential crossing points based on the spatial coordinates of road segments. While functional, this method has limitations when dealing with complex road geometries or multi-level intersections. The algorithm searches for points where line segments representing road centerlines intersect in a two-dimensional plane, which works well for standard grid-like networks but may require refinement for more complex urban configurations.
Third, traffic network designers employ varying methodologies for connecting roads: some link the end of one road to the beginning of another, while others create connections at intermediate points. This inconsistency necessitated developing flexible approaches to conflict identification that could accommodate different network construction styles within simulation environments like Vissim.
We validated our algorithm through manual verification in smaller networks and strategic regions of larger, more complex networks. These tests confirmed that our approach correctly identifies structural conflicts in the vast majority of cases, though we acknowledge the inherent limitations of purely topological analysis.
4.2. Conceptual Framework
The conflict relationships between signal heads can be represented as an undirected graph , where is a set of N signal heads, and is the set of edges that represent conflict relationships between signal heads. The traffic light conflict matrix represents these conflicts, where if signal heads i and j control conflicting states, and 0 otherwise.
This representation captures the bidirectional nature of conflicts between signal heads.
4.3. Methodology Overview
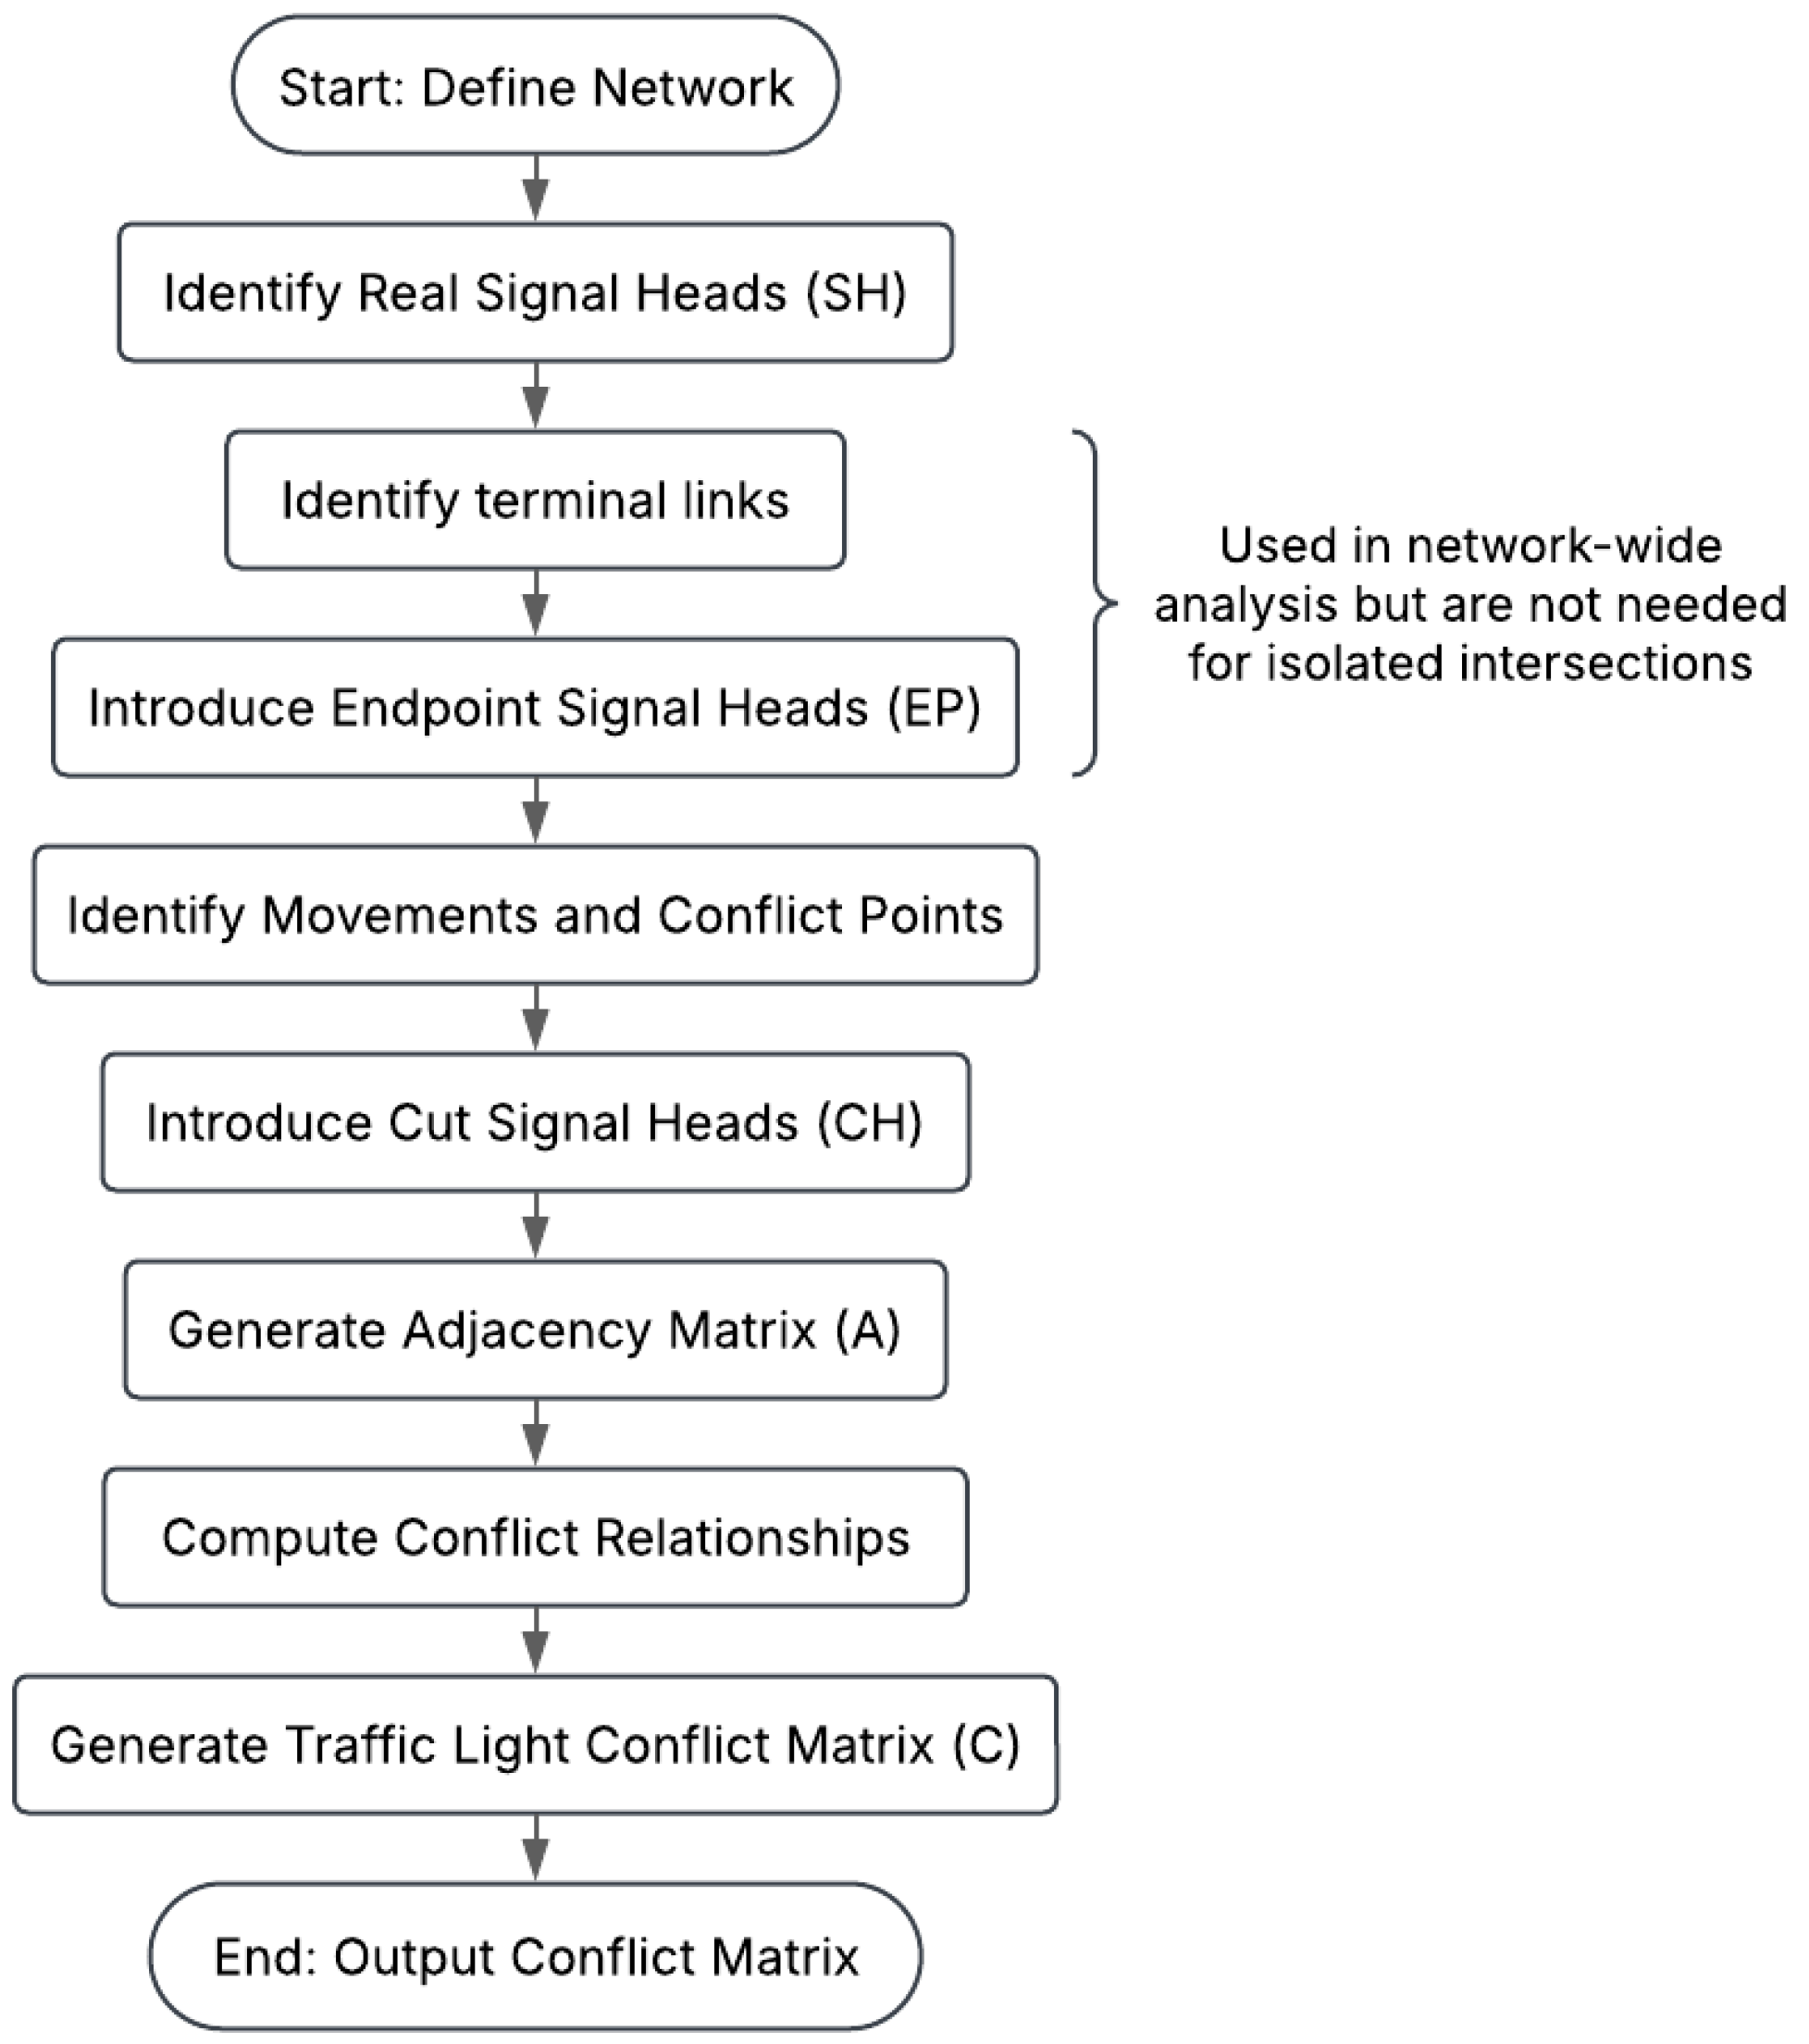
Our methodology for constructing the traffic light conflict matrix involves a systematic process that can be applied to both isolated intersections and large-scale road networks. The key steps include the following:
- Network Representation: Representing the road network as a graph, identifying real signal heads (SH), and introducing fictitious endpoint signal heads (EP) and crossing signal heads (CH) to model network boundaries and conflict points, respectively.
- Adjacency Matrix Generation: Constructing an adjacency matrix A that captures the relationships between real signal heads and both endpoint and crossing signal heads.
- Traffic Light Conflict Matrix Computation: Using the adjacency relationships represented in matrix A to compute the traffic light conflict matrix C, where each element indicates whether two signal heads control conflicting movements.
This process allows for the efficient identification of potential signal conflicts based on network topology, providing a foundation for optimizing traffic signal control strategies.
Figure 2 summarizes our methodology.
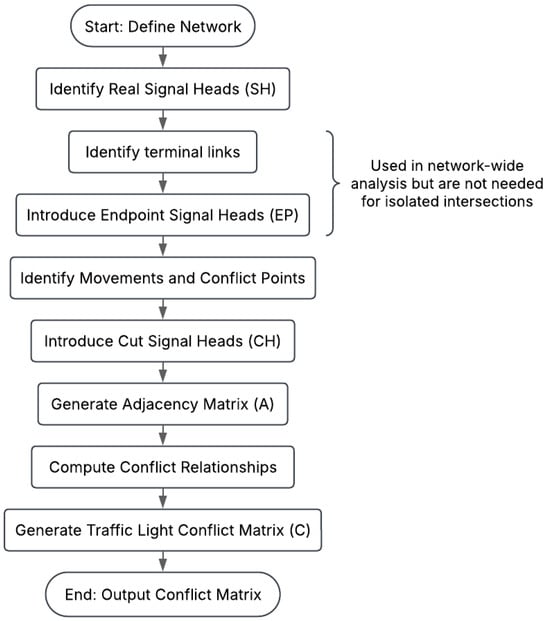
Figure 2.
Overview of the methodology.
4.3.1. Isolated Intersection Analysis
For an isolated intersection, conflicts arise when two or more traffic movements intersect within the same space. Each movement is controlled by a real signal head (SH). To systematically detect conflicts, we introduce crossing signal heads (CHs), fictitious elements placed at movement intersection points. Each CH represents a conflict involving multiple SHs. These CHs allow us to construct an adjacency matrix, where each 1 indicates a conflict between an SH and a CH.
Then, we generated the intersection’s adjacency matrix, which includes both real signal heads and fictional crossing signal heads. Each crossing signal head is introduced at a movement intersection point to represent a conflict. These conflict points serve as the input data for our algorithm, allowing for systematic identification of signal conflicts.
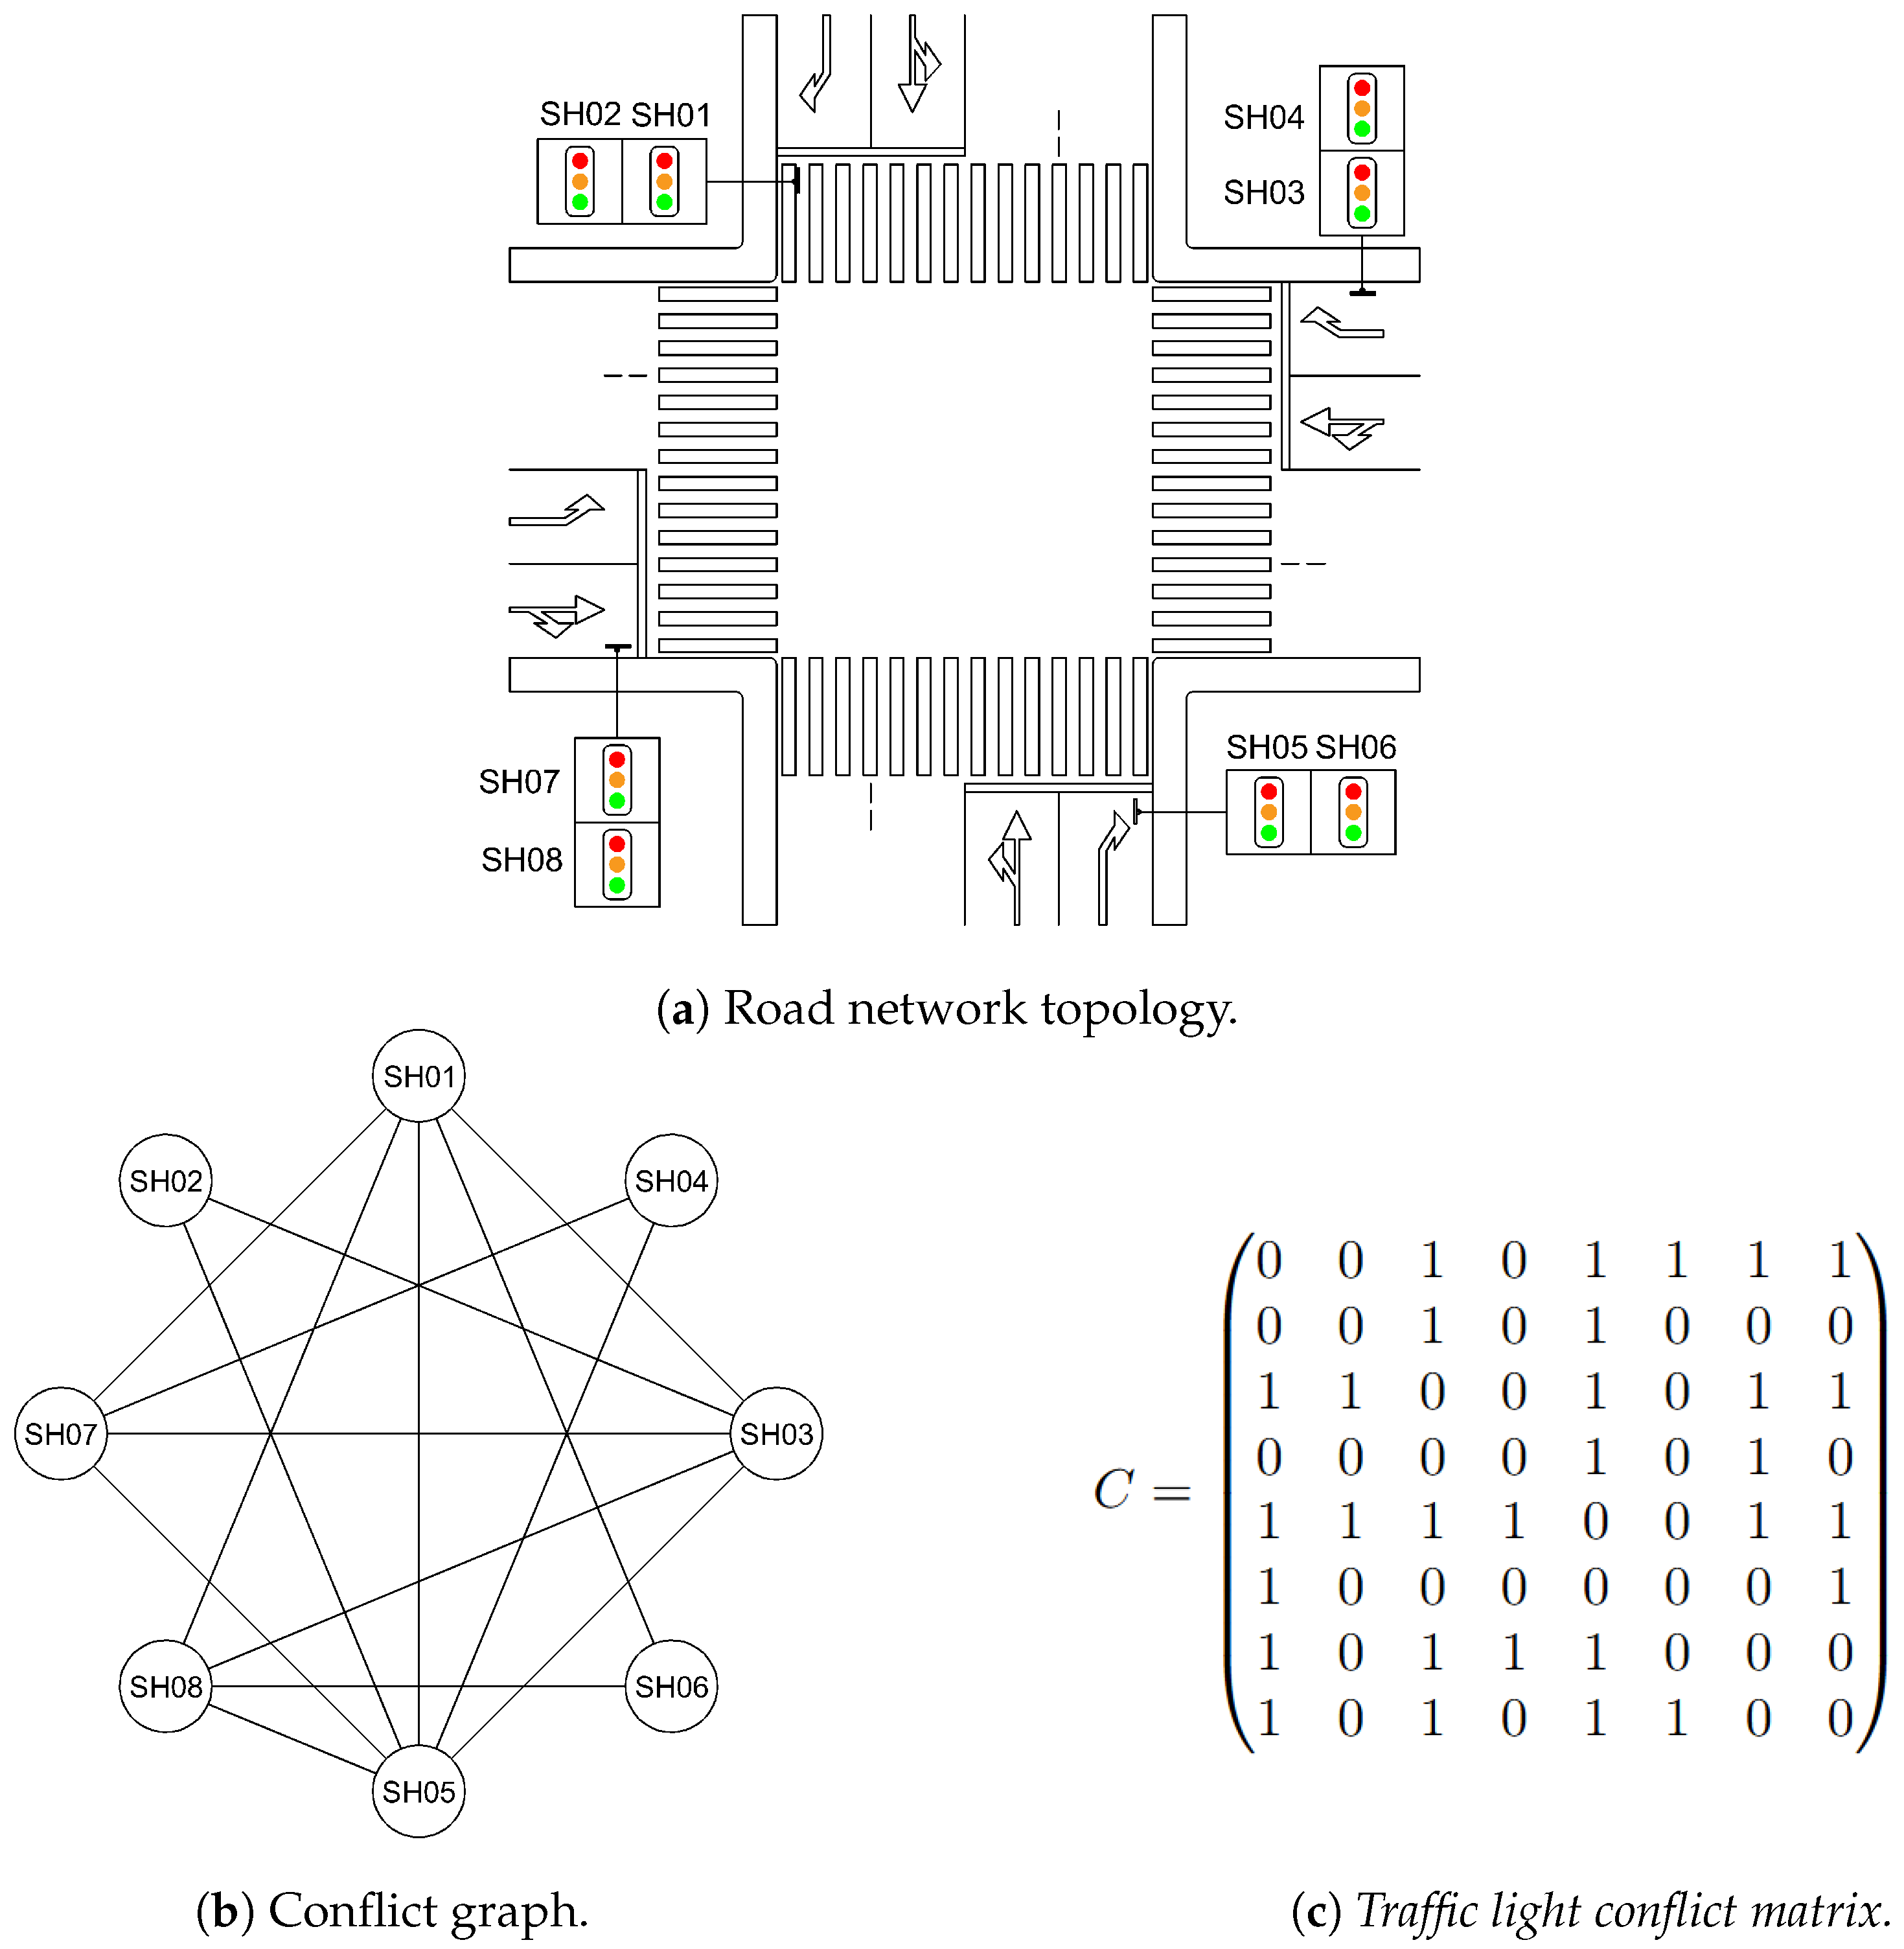
Figure 3 illustrates an example of an isolated signalized intersection with four roads, its corresponding conflict graph, and the associated traffic light conflict matrix.
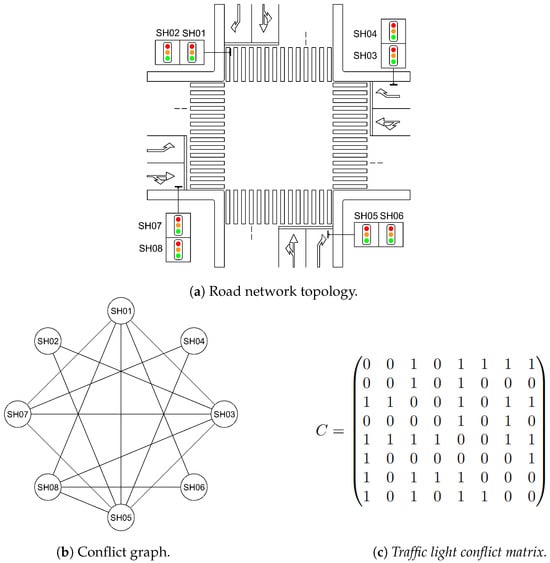
Figure 3.
Example of an isolated intersection.
In this representation, we have the following:
- The intersection scheme displays the physical layout, including lanes, permitted movements, and the signal heads controlling these movements.
- In the conflict graph, each node represents a signal head controlling a specific movement through the intersection.
- Edges in the conflict graph connect nodes (signal heads) that control conflicting movements, directly representing the conflict relationships.
- The traffic light conflict matrix provides a numerical representation of the conflict graph, where each element indicates whether signal heads i and j control conflicting movements (1) or not (0).
In our example intersection, 8 real signal heads control various movements. We identified 34 conflict points, each assigned a fictional crossing signal head (CH01–CH34) based on its associated real signal heads.
This information is used to generate the corresponding adjacency matrix. A simplified version is shown in Figure 4, displaying only the most relevant adjacencies for clarity. The full matrix includes all 34 columns for the crossing signal heads, but, for brevity, only a subset is shown. A value of 1 in the matrix indicates an adjacency between a real signal head (SH) and a crossing signal head (CH), while 0 represents no adjacency.
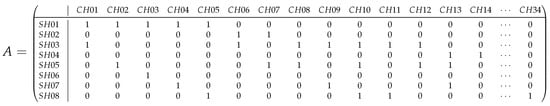
Figure 4.
Adjacency matrix for an isolated intersection with real and fictional signal heads.
Each CH represents a specific conflict involving multiple real signal heads. In the adjacency matrix, all SHs associated with that conflict will have a 1 in the corresponding CH column.
Building on this, the adjacency matrix provides the foundation for constructing the traffic light conflict matrix. By analyzing its columns, we can systematically identify conflicts: signal heads that share a 1 in the same column are considered to be in conflict. This relationship can be expressed mathematically as follows:
where
- A is the adjacency matrix of dimensions , where n is the number of real signal heads (SH) and m is the number of crossing signal heads (CH).
- C is the traffic light conflict matrix of dimensions .
- is the element in row i and column j of the traffic light conflict matrix C.
- is the element in row i and column k of the adjacency matrix A.
- is the element in row j and column k of the adjacency matrix A.
This formula captures the idea that two real signal heads i and j are in conflict if and only if there exists at least one crossing signal head k for which both and are 1.
The process of transforming the adjacency matrix into the traffic light conflict matrix involves the following steps:
- For each real signal head (SH), we identify its adjacent crossing signal heads (CH) by looking for 1s in the corresponding row of the adjacency matrix.
- For each adjacent CH identified, we then search for other SHs that are also adjacent to this CH by looking for 1s in the same column.
- These other SHs are in conflict with the original SH, and we mark this conflict in the traffic light conflict matrix with a 1.
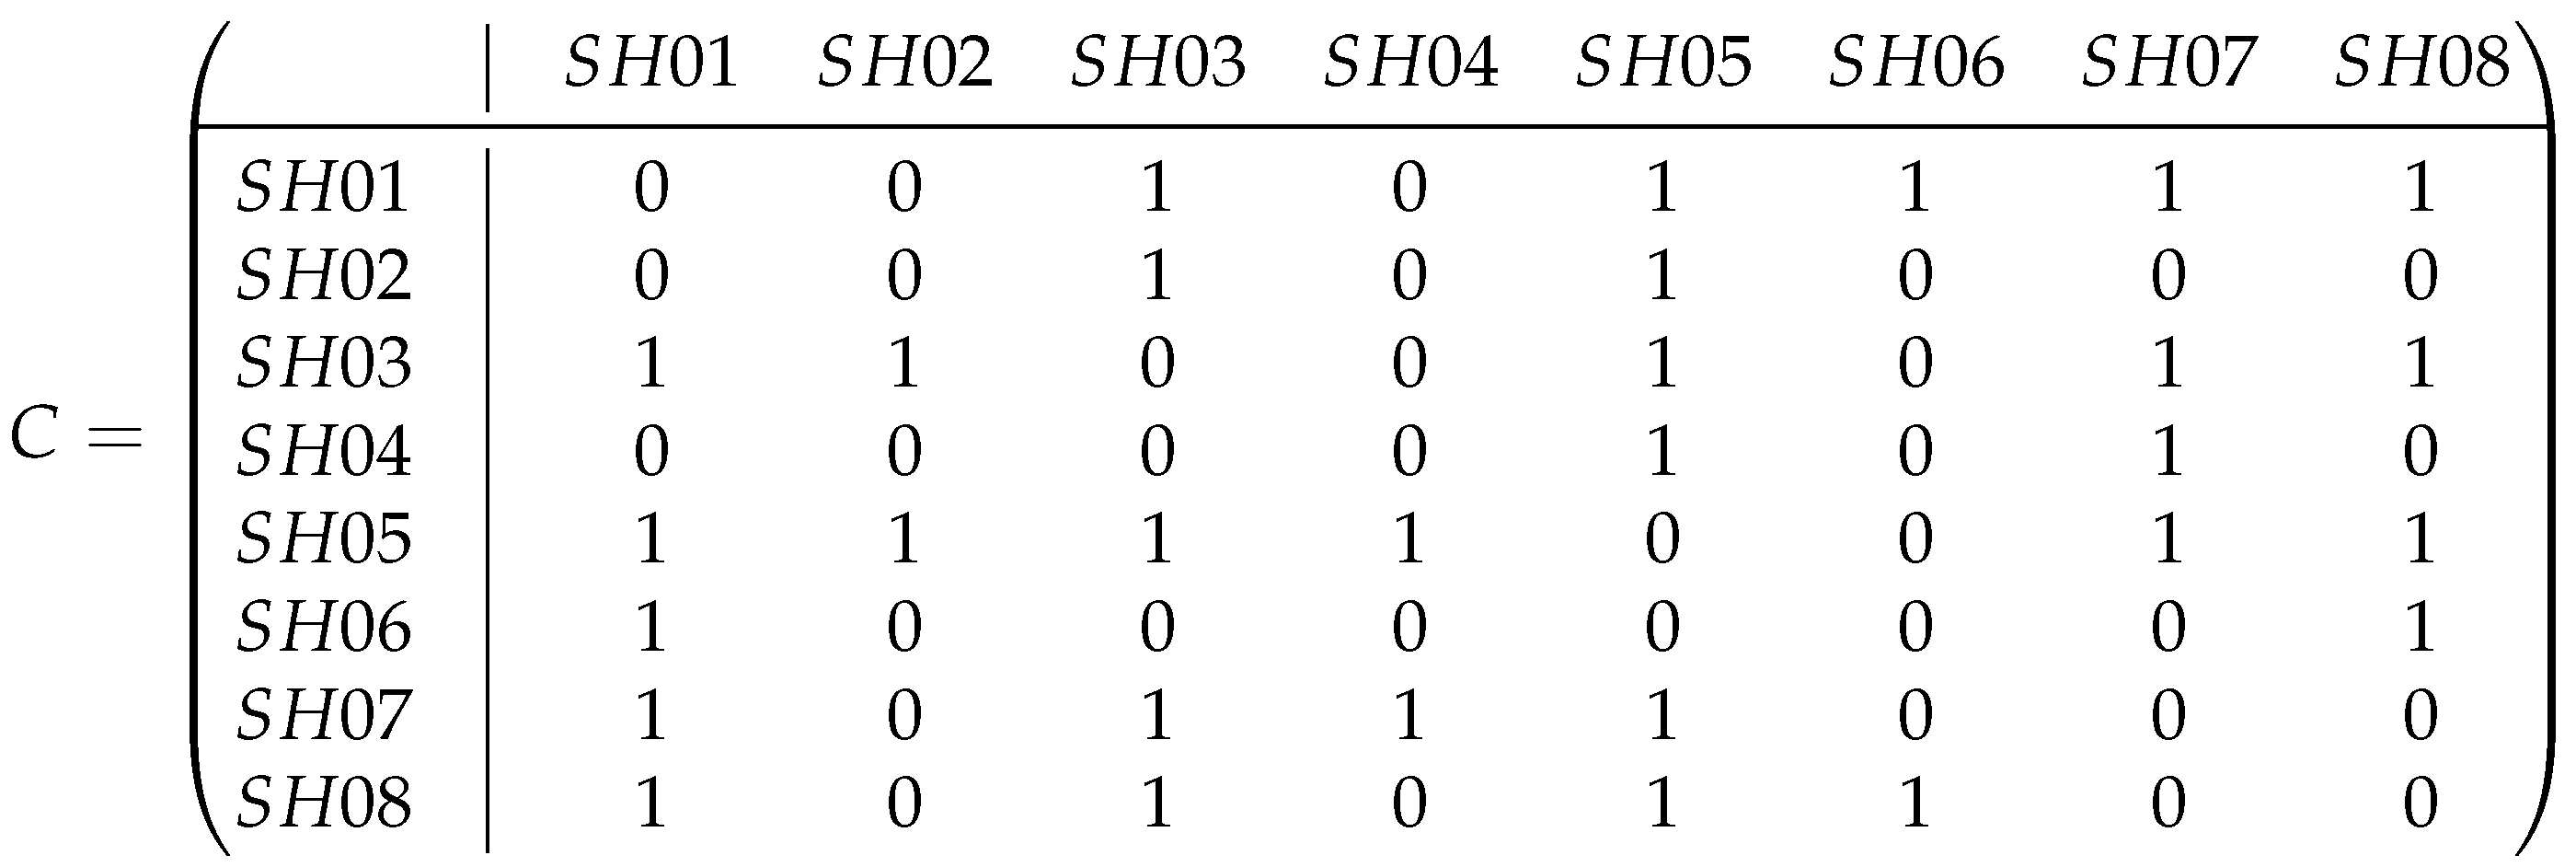
Figure 5 shows the resulting traffic light conflict matrix.
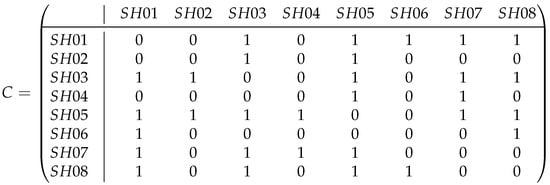
Figure 5.
A traffic light conflict matrix for an isolated intersection.
This process can be simplified to identifying the conflict points between movements controlled by signal heads, as this directly provides the conflicting signal heads. It is important to note that Figure 3c and Figure 5 present the same traffic light conflict matrix but with different purposes. Figure 3c is part of an illustrative set (Figure 3) that conceptually demonstrates the expected relationships in an isolated intersection, while Figure 5 represents the actual computational result obtained by following the systematic algorithmic process described above. This dual presentation reinforces how our theoretical framework translates into practical implementation.
The methodology we have described above, involving the introduction of fictional signal heads at these conflict points, justifies this approach when dealing with large-scale networks. Following on from this, we will describe the general methodology and the algorithm applicable to any road network.
4.3.2. Network-Wide Analysis
We will now extend the methodology to entire road networks presents additional challenges, such as the following:
- Managing conflicts across multiple intersections.
- Defining network boundaries for accurate traffic modeling.
To address these challenges, as shown in the methodology indicated above, we introduce another class of fictitious signal heads: endpoint signal heads (EP). These act as network boundary markers, ensuring that the traffic flow at the edges of the analyzed network is appropriately modeled.
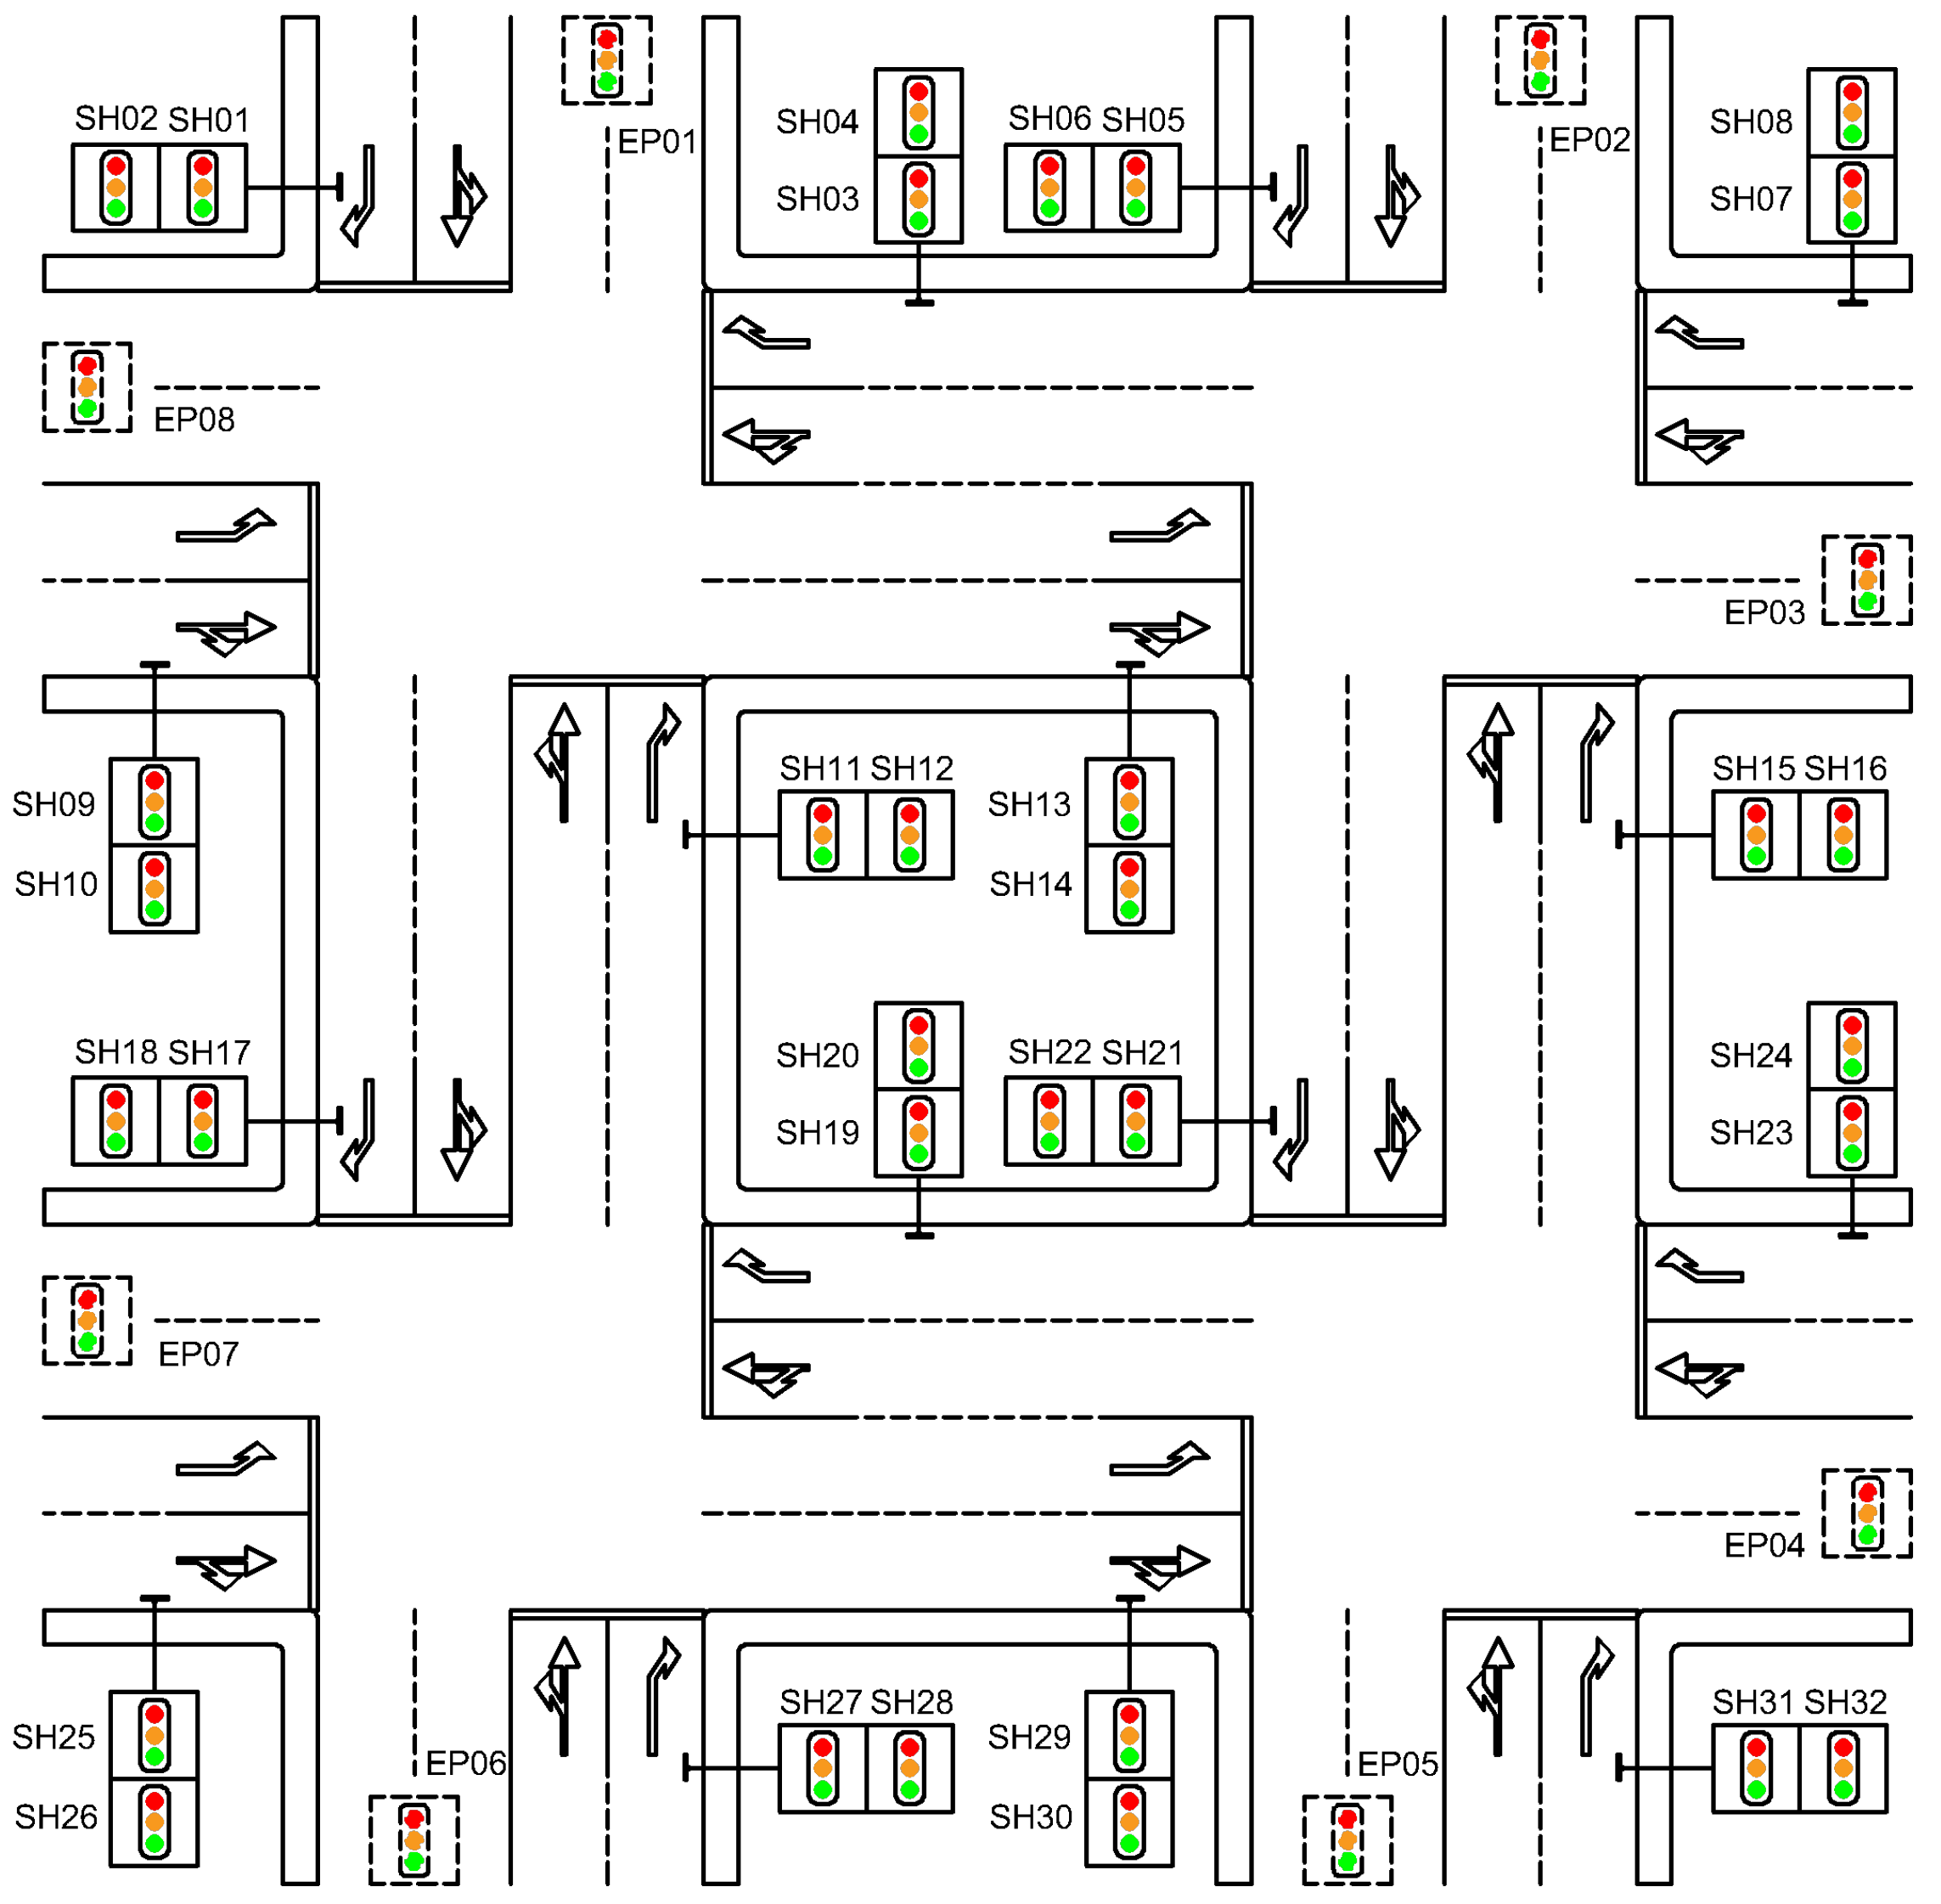
To better visualize this concept, Figure 6 presents a network with four intersections, where real signal heads are displayed alongside their permitted movements, and endpoint signal heads are also indicated.
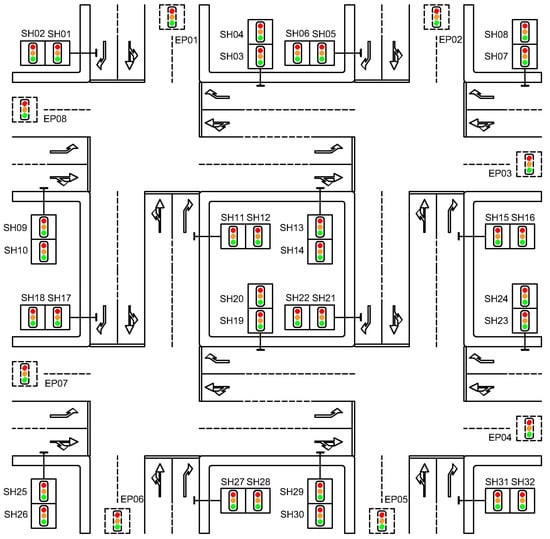
Figure 6.
The real and endpoint signal heads in the network.
Examining Figure 6, we can identify key adjacency relationships between signal heads (SH) and endpoint signal heads (EP) in the network. These relationships form the basis for understanding traffic flow and potential conflicts within the system.
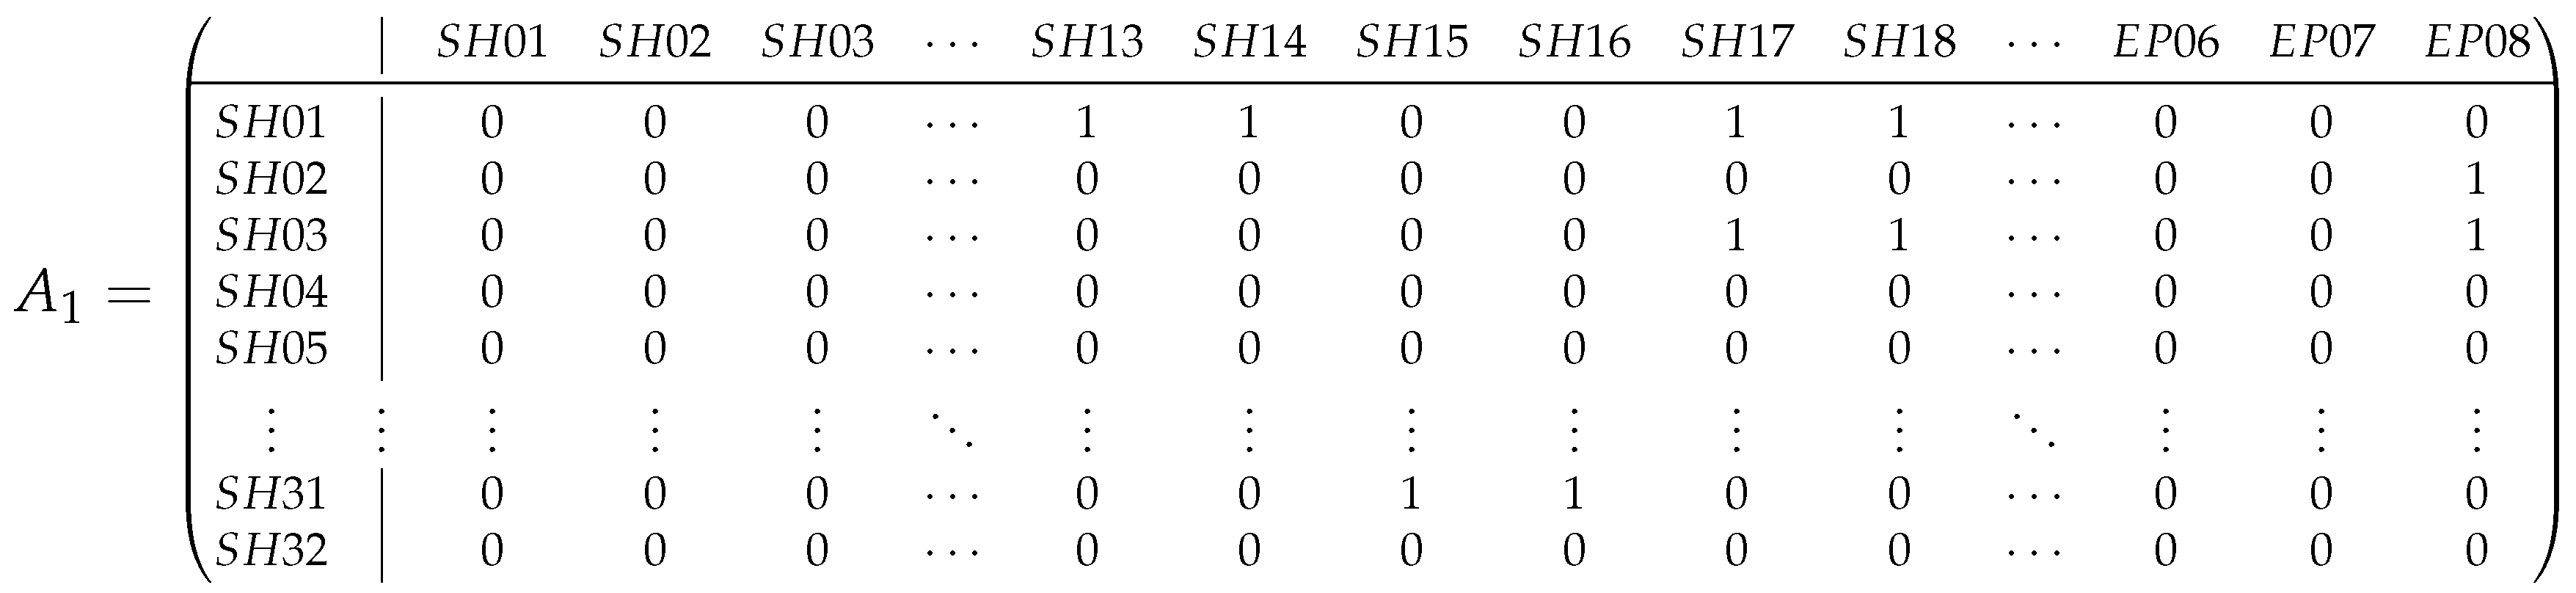
Based on the adjacency relationships observed in the figure, we generated the adjacency matrix shown below (Figure 7).
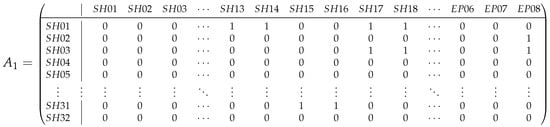
Figure 7.
Adjacency matrix for a network with real and endpoint signal heads.
The complete adjacency matrix contains 32 real signal heads and 8 endpoint signal heads, resulting in a 32 × 40 matrix. Endpoint signal heads, by definition, do not have adjacencies to other signal heads, so their adjacencies are not represented in the matrix. Here, we present a representative subset to facilitate visibility and understanding of the network’s connectivity structure.
These adjacency relationships illustrate how different signal heads interconnect and how endpoint signal heads represent the boundaries of the analyzed network.
After introducing endpoint signal heads to define the network boundaries, the next step is to identify and introduce the crossing signal heads. The specific methodology for identifying these crossing points is beyond the scope of this analysis. However, Vissim users can utilize a MATLAB function, which is provided in the accompanying documentation, to locate these crossing points within their network models. In complex network configurations, it is crucial to recognize that the conflict points resulting from link cuts may be either signalized or unsignalized. Consequently, the signal heads nearest to an conflict point might not always be situated on the links directly involved in that intersection. Instead, they may be positioned on more distant links within the network structure. This spatial distribution of signal heads adds an extra layer of complexity to the analysis and must be carefully considered when developing traffic control strategies.
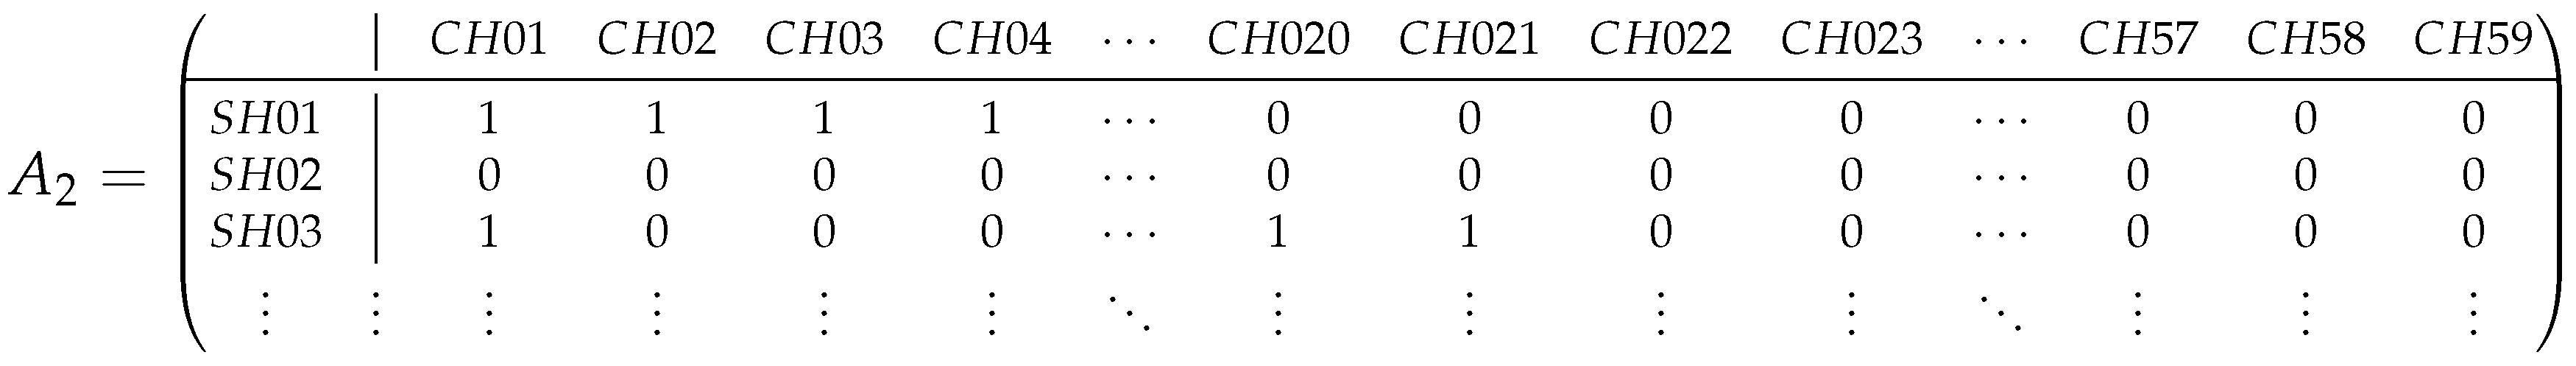
In our example case, we identified the crossing links and added crossing signal heads at each conflict point. Based on the crossing signal heads, we can generate the adjacency matrix relating to real signal heads (SH) to crossing signal heads (CH). Figure 8 shows this matrix. Due to the large size of the matrix, we present a subset focusing on a few signal heads.

Figure 8.
Adjacency matrix for a network with real and crossing signal heads.
The complete adjacency matrix A for the network-wide analysis was constructed by horizontally concatenating and .
This resulted in a matrix that represents the adjacency relationships between the real signal heads and both endpoint signal heads and crossing signal heads. The rows of A correspond to the real signal heads, while the columns represent the endpoint signal heads (from ) and the crossing signal heads (from ).
Once the complete adjacency matrix A was obtained, the calculation of the traffic light conflict matrix (C) followed the same procedure as for an isolated intersection. This matrix was derived through the following matrix operation:
where is the transpose of matrix A. After this matrix multiplication, two additional steps were necessary to obtain the final traffic light conflict matrix:
- Binarization: Any non-zero value in the resulting matrix was converted to 1, indicating the presence of a conflict.
- Diagonal nullification: The diagonal elements of the matrix were set to zero as a signal head cannot be in conflict with itself.
The complete process can be expressed mathematically as follows:
This process ensures that the matrix multiplication captures all of the conflict relationships: two real signal heads will be in conflict if and only if both share at least one connection with the same fictitious signal head (either an endpoint signal head or a crossing signal head).
For our example network, the resulting conflict matrix had the dimensions of , corresponding to the 32 real signal heads. Due to its size, we present below a representative submatrix showing the conflict relationships for a subset of signal heads.
In this matrix, each element indicates whether a conflict exists between the real signal heads i and j. A value of 1 indicates that both signal heads control movements that are in conflict, while a value of 0 indicates no conflict between them. For example, we can observe that SH01 is in conflict with SH03, while it has no conflicts with SH02, SH04, etc.
The complete matrix provides a comprehensive representation of all possible conflicts between signal heads across the entire network, serving as a foundation for traffic control strategy optimization. This representation facilitates the identification of signal head groups that can have the same state (green) simultaneously, as well as those that must necessarily have different states to avoid conflicts.
It is important to note that the conflict matrix is symmetric (), reflecting the bidirectional nature of conflicts: if signal head i is in conflict with signal head j, then signal head j is also in conflict with signal head i.
4.3.3. Algorithm for Generating the Traffic Light Conflict Matrix
The methodology for creating the traffic light conflict matrix (C) in general networks involves identifying signal heads, their relationships, and potential conflicts. Algorithm 1 outlines the steps to generate the conflict matrix.
| Algorithm 1 Algorithm for generating the traffic light conflict matrix |
Input: Adjacency matrix A between real signal heads and fictional signal heads Output: Traffic light conflict matrix C
|
The algorithm involves several key computational steps:
- Construction of the adjacency matrix A: This matrix represents the connections between real signal heads and fictional signal heads (both endpoint and crossing signal heads).
- Matrix multiplication: The product calculates a raw conflict matrix, where the value at position indicates the number of conflict points shared between signal heads i and j.
- Binarization: Since we are only interested in whether a conflict exists (not how many conflict points are shared), we convert all positive values to 1.
- Diagonal nullification: A signal head cannot be in conflict with itself, so all diagonal elements are set to zero.
This process is implemented in our algorithm by applying the following rule:
where the binarize function converts any positive value to 1, representing the existence of at least one conflict point.
While the traffic light conflict matrix is ultimately represented as an adjacency matrix, the internal computations leverage adjacency lists for efficiency, particularly given the sparse nature of typical road network graphs. This matrix-based approach allows for efficient computational implementation while ensuring all of the conflict relationships are accurately captured.
This implementation ensures a comprehensive identification of all the potential signal conflicts based on the network’s topological structure.
5. Experiments and Results
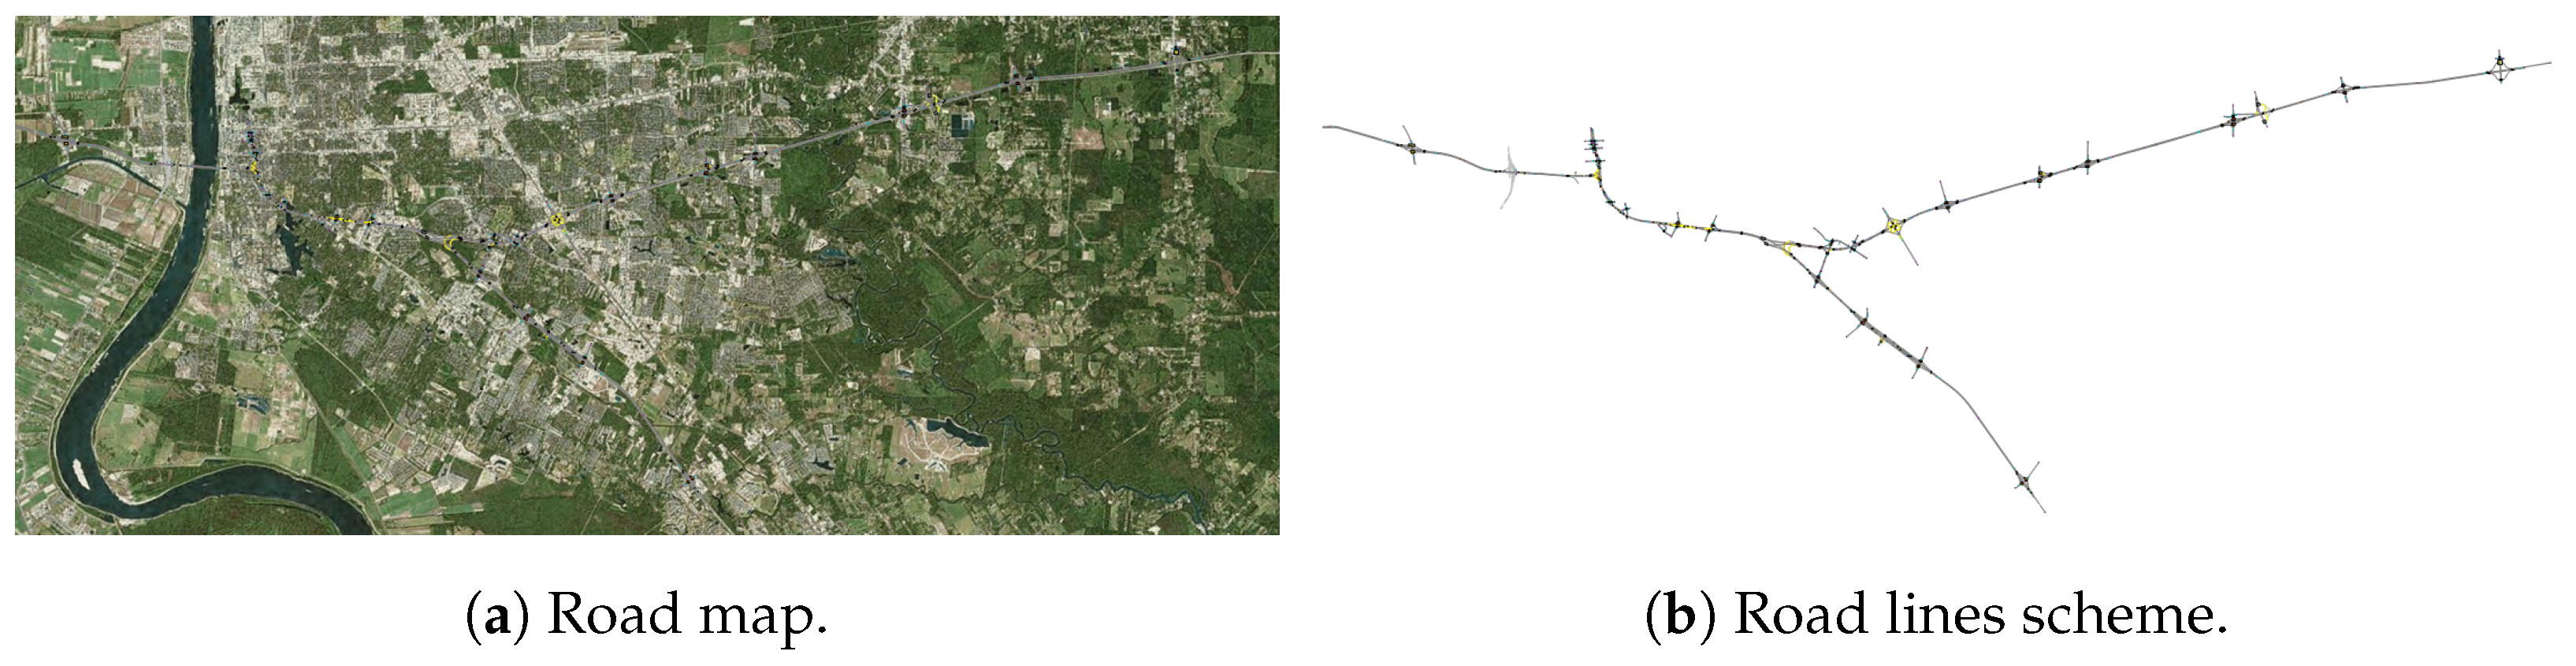
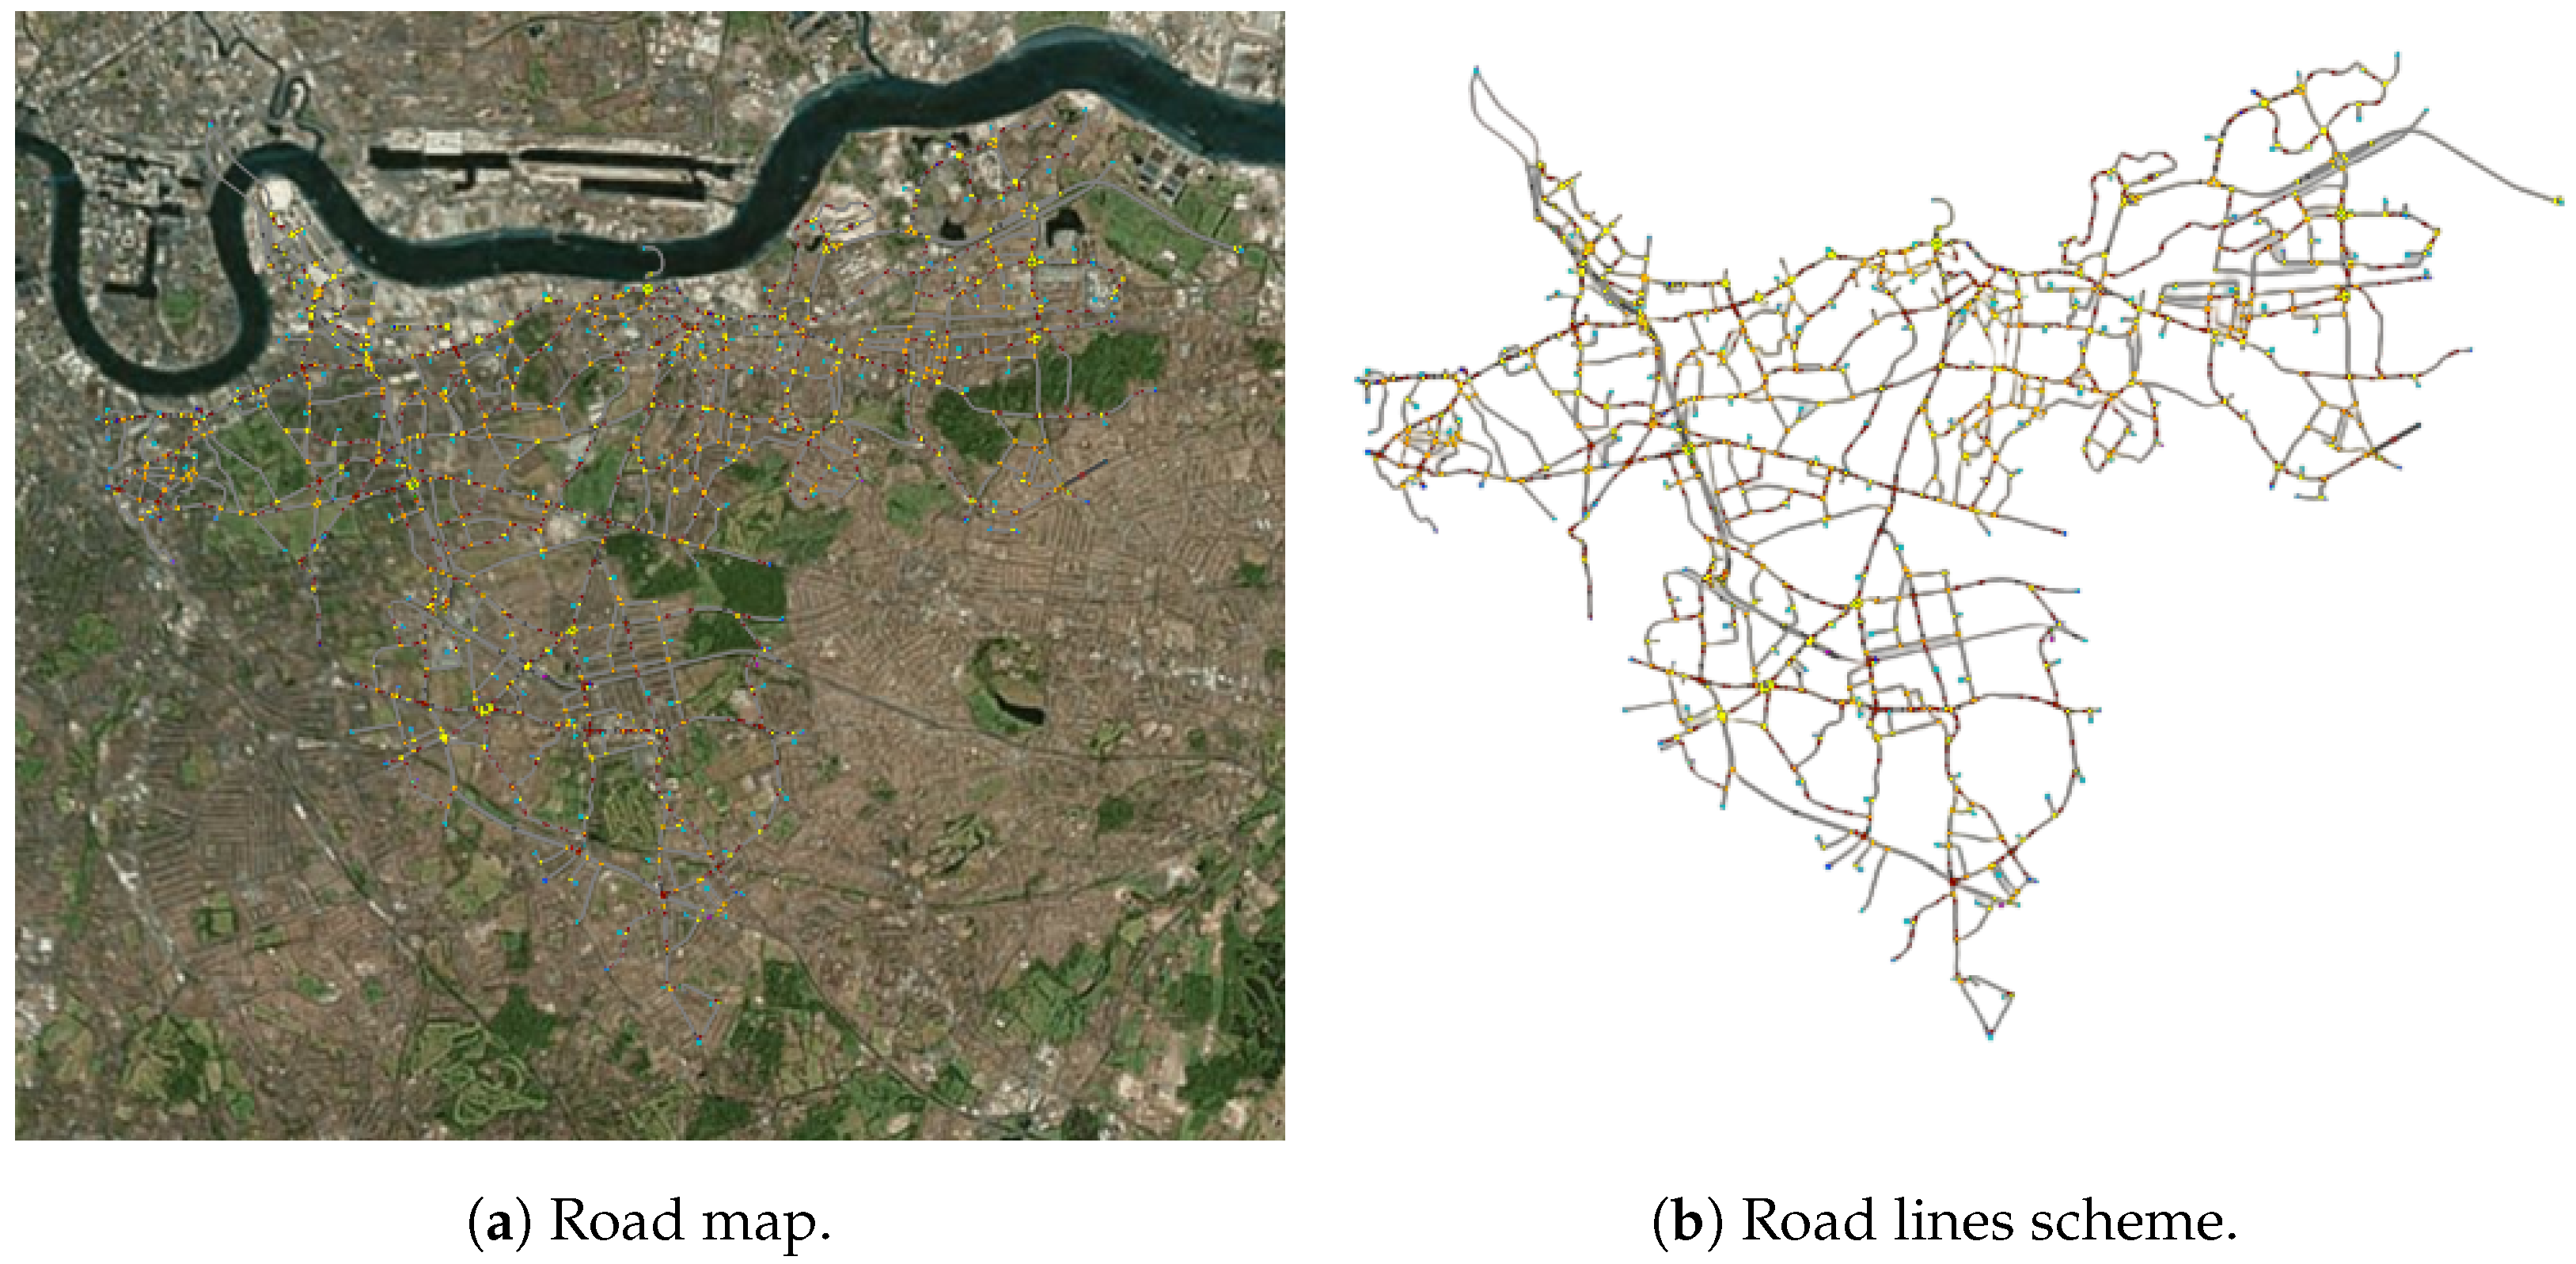
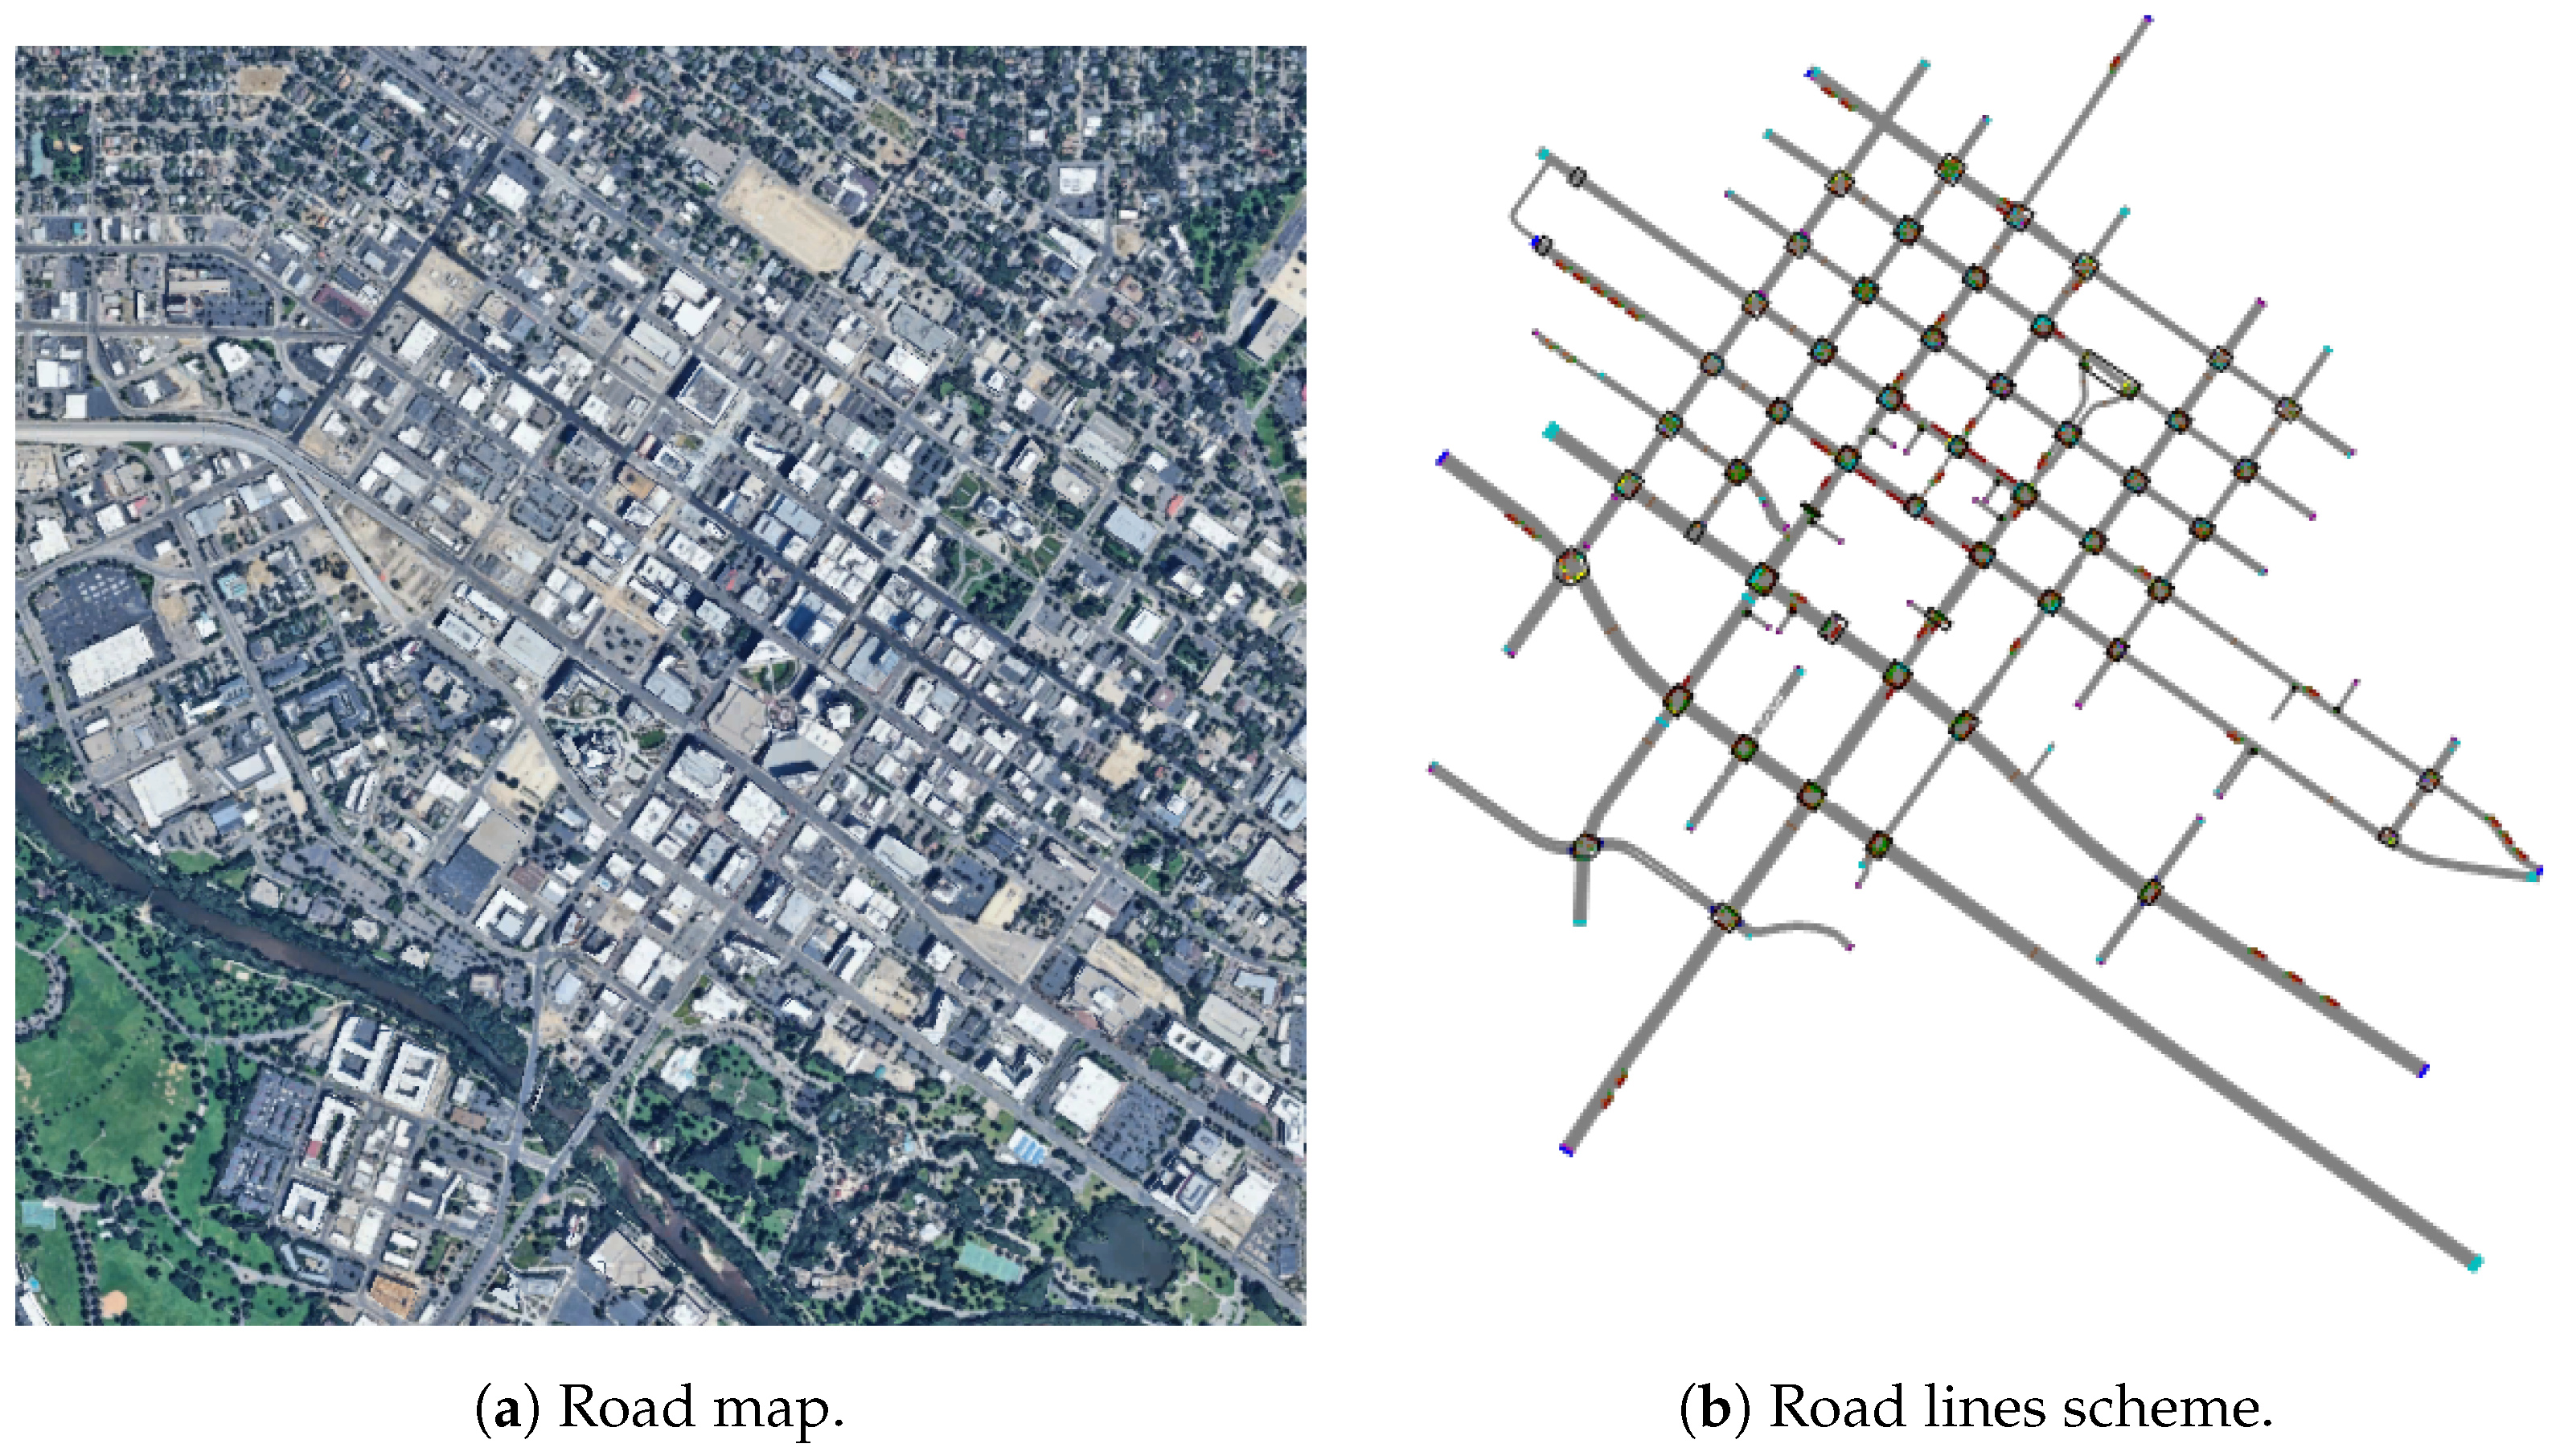
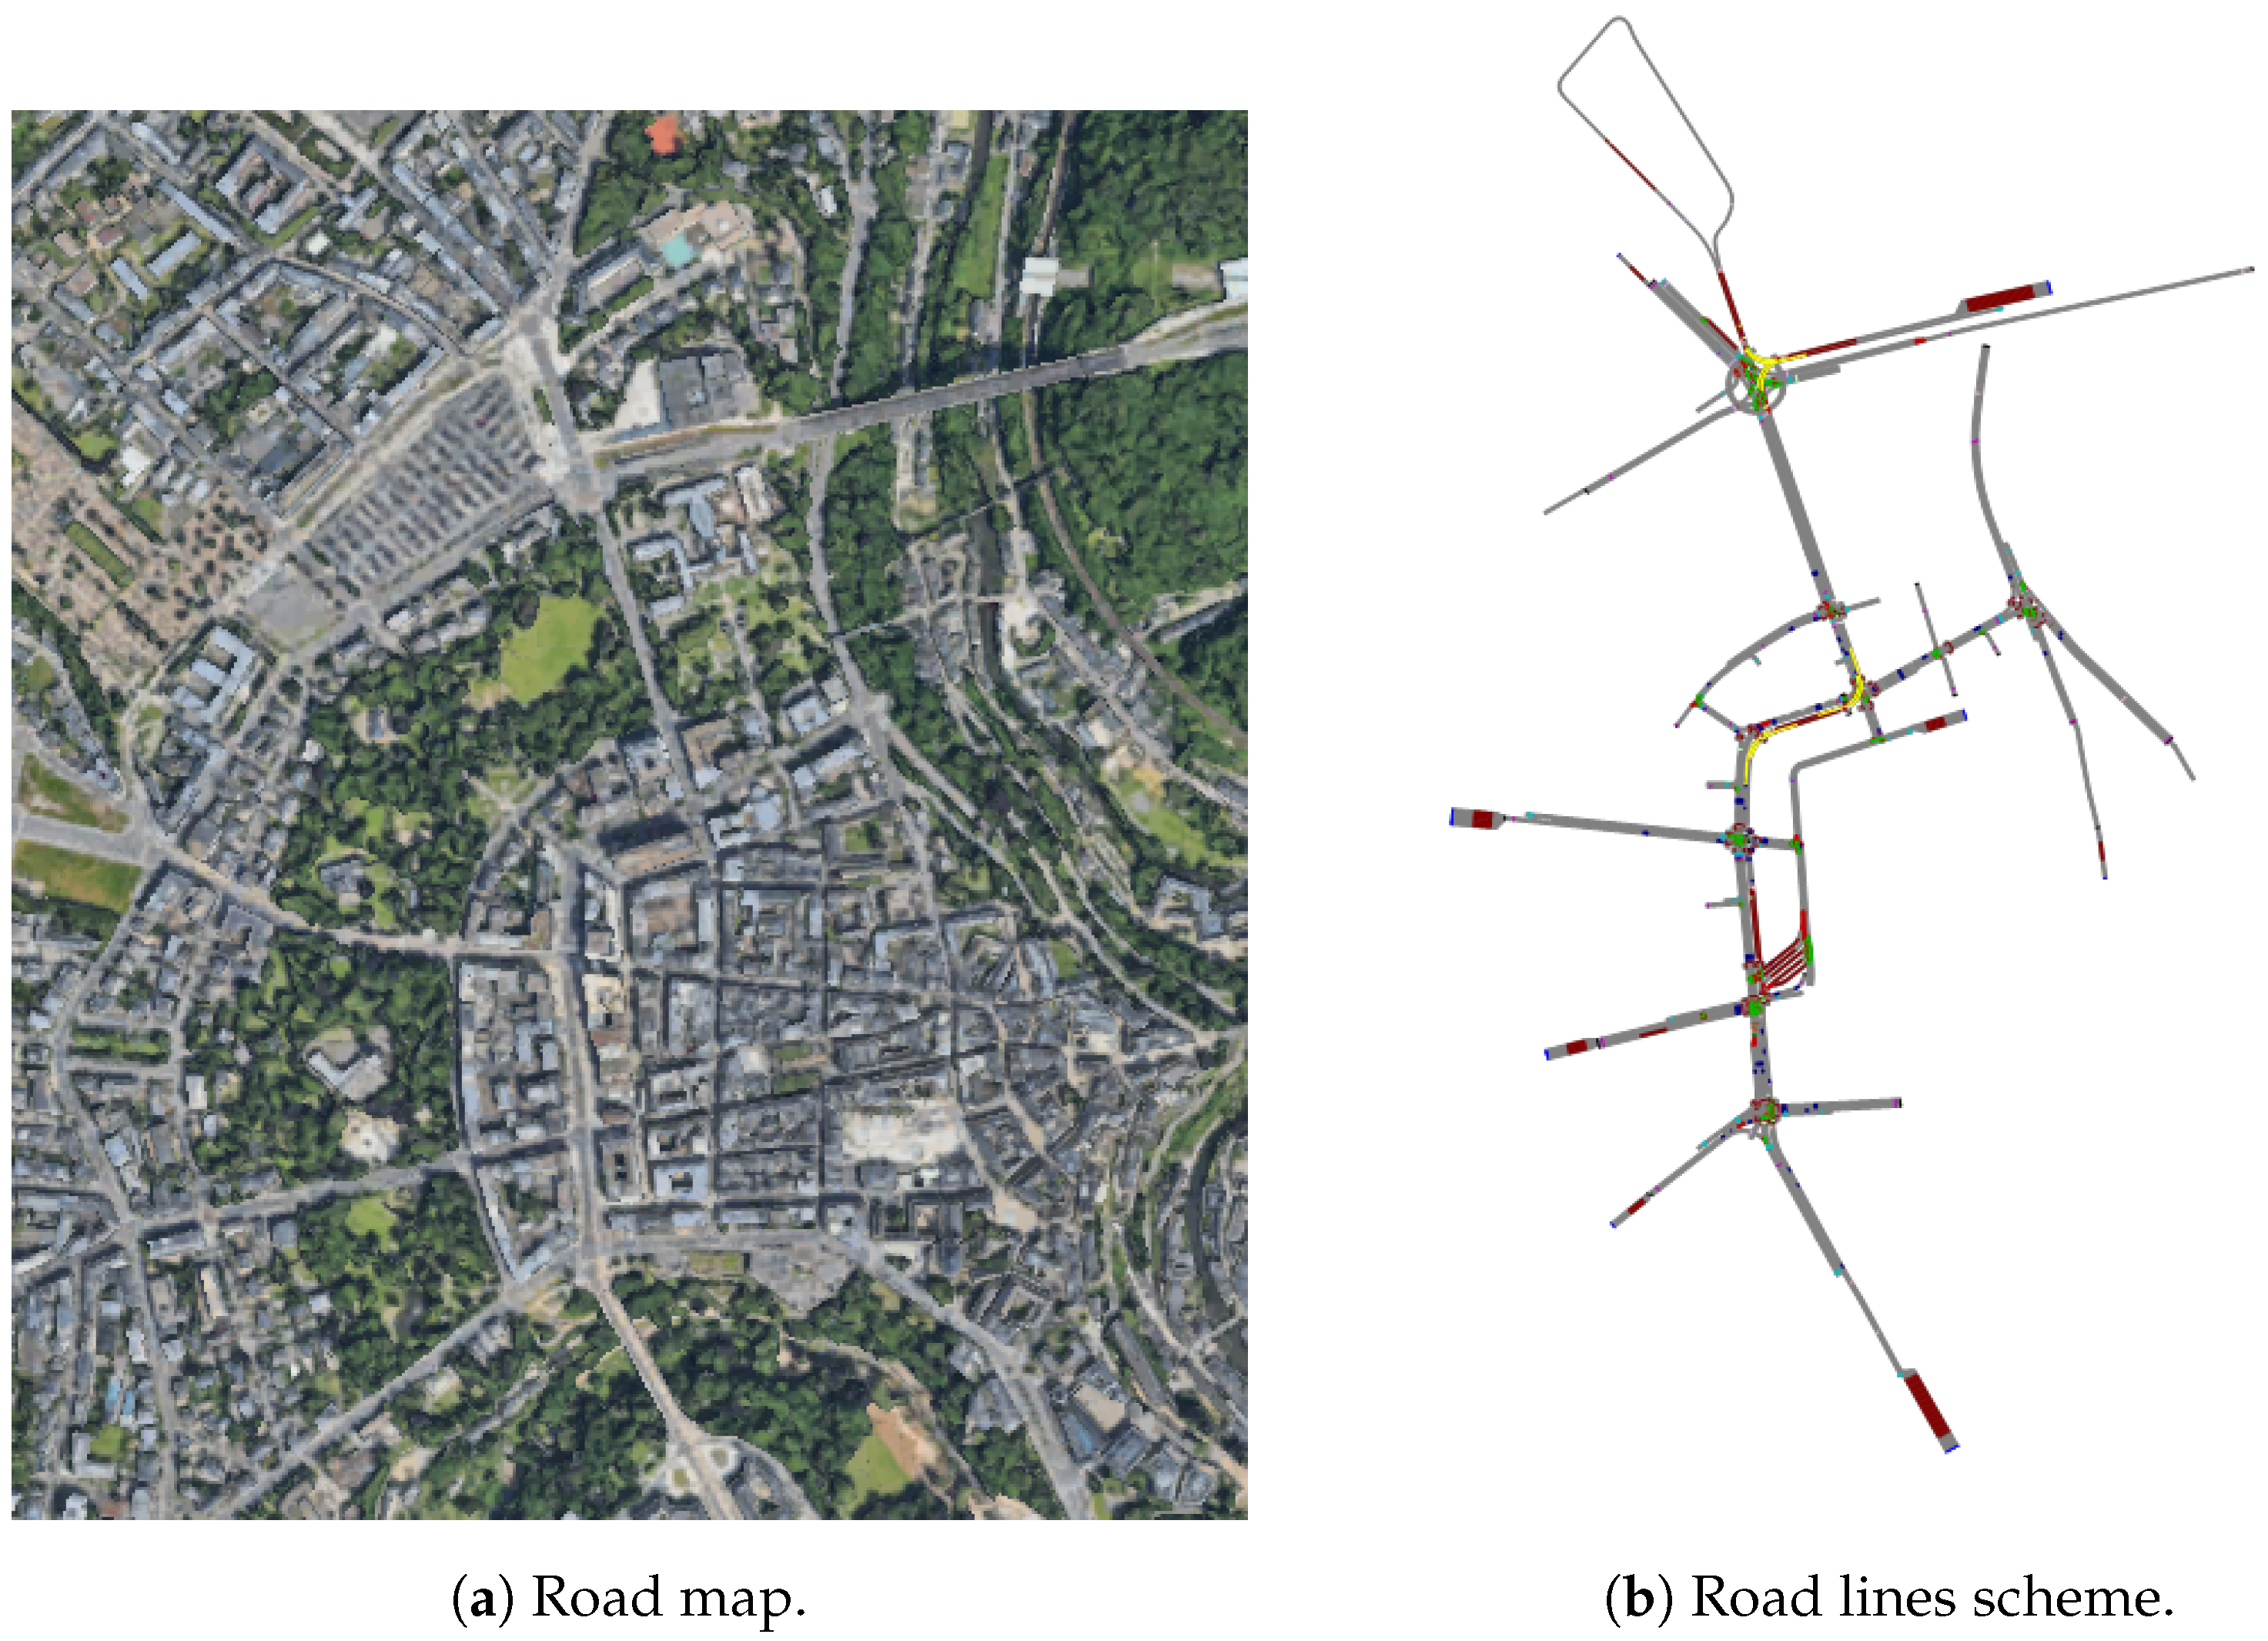
To validate our conflict matrix algorithm, we selected four diverse urban networks from PTV Vissim [20]: the Baton Rouge corridor [21], a central London district, the Boise metropolitan area, and a Luxembourg urban sector. Satellite imagery and corresponding road networks for these test cases appear in Figure 9, Figure 10, Figure 11 and Figure 12.
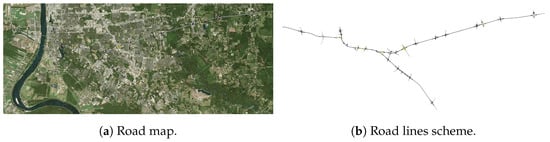
Figure 9.
Map and road network of Baton Rouge (US).
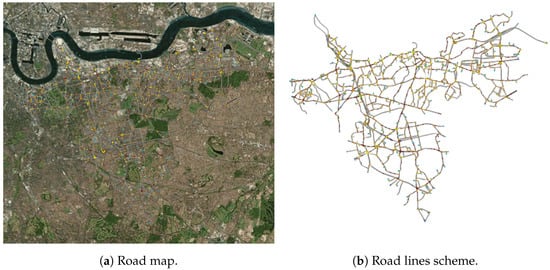
Figure 10.
Map and road network of London (GB).
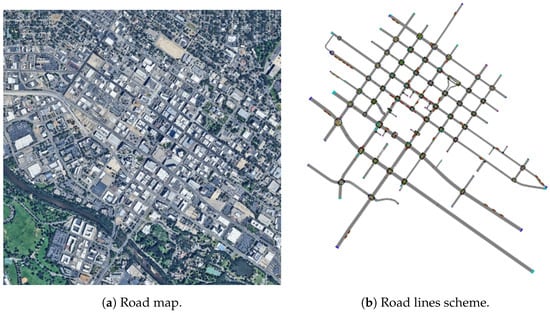
Figure 11.
Map and road network of Boise (US).
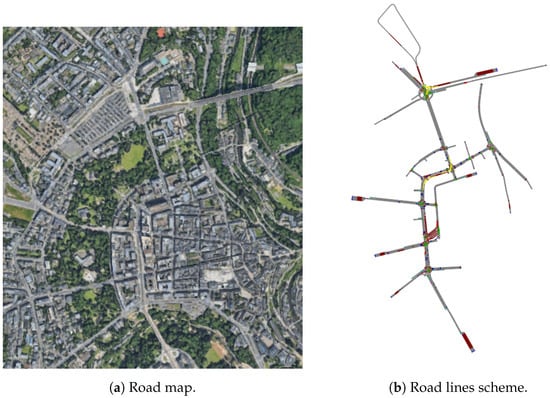
Figure 12.
Map and road network of Luxembourg (LU).
We conducted testing on modest hardware: an Intel i5-4310U processor (2.00 GHz base, 2.60 GHz turbo), 8 GB RAM, and Windows 10 Enterprise 64-bit (version 22H2). All implementations used MATLAB R2024a. To establish reliable performance metrics, we processed each network ten consecutive times and calculated average execution times.
The results obtained are summarized in Table 1. For each network, the number of links, the number of intersections, the number of signal heads, the number of conflicts, and the average execution time for 10 iterations of the function are presented. These results demonstrate the efficiency of the algorithm in networks of varying sizes and configurations.

Table 1.
Network information and traffic light conflict matrix computation results.
It should be noted that the execution times reported in the table correspond specifically to the conflict matrix generation once the intersection points between links have been identified. Our current implementation for detecting these intersection points (the Crossing_links function) is relatively basic and could be improved for complex geometries. However, we have included it as a subfunction within Adjacency_list_of_signal_heads_extended in the Supplementary Material section to ensure full reproducibility of our results. The processing time for this intersection detection step varies depending on network complexity, and is not included in the reported execution times as it represents a preprocessing step that can be optimized independently.
The Supplementary Materials section contains our complete implementation, providing researchers with everything needed to reproduce our work. These materials include our full MATLAB source code along with the specific datasets used in our analysis: Baton_Rouge_dataset.mat, London_dataset.mat, Boise_dataset.mat, and Luxembourg_dataset.mat. By sharing these resources, we enable independent verification and extension of our findings by interested researchers.
6. Discussion
Our algorithm for generating the traffic light conflict matrix introduces an innovative approach to traffic management by systematically identifying potential signal head conflicts through network structural relationships. By leveraging topological data instead of traditional phase diagrams or real-time traffic information, we provide a universal method for conflict detection that transcends the limitations of existing intersection-level analyses.
A key advantage of our method is its ability to fully automate the conflict detection process. The most relevant prior work, Li et al., introduced a graph-based conflict representation for traffic signals but did not provide a scalable automation framework. Instead, their conflict graphs were manually derived from isolated intersections and networks, making their approach impractical for large-scale implementation. Our algorithm eliminates this limitation by automating the entire process, making it feasible for real-world traffic management at an urban scale.
An alternative approach to traffic signal conflict detection could involve machine learning or artificial intelligence (AI) methods. However, such solutions would present several significant drawbacks:
- Computational Cost. AI models require significant training and inference time, making them far more expensive to run compared to our deterministic matrix-based approach.
- Data Dependency. AI would require large, labeled datasets of real-world traffic conflicts, which are not readily available across different cities.
- Generalization Issues. AI models trained on one urban area may fail to generalize to different city layouts without retraining.
- Lack of Transparency. AI-based solutions, particularly deep learning models, function as black boxes, making it difficult to interpret why a certain conflict was identified. Our matrix-based method, in contrast, provides a clear, interpretable representation of conflicts, ensuring that traffic engineers can validate and trust the results.
Thus, our method provides an optimal balance between accuracy, efficiency, and scalability. It requires only readily available topological data, processes large-scale networks in milliseconds, and integrates seamlessly with existing traffic optimization frameworks. While future research may explore AI-based enhancements, our approach presents the most practical, cost-effective, and interpretable solution for large-scale urban traffic management.
One consideration for the applicability of our method is its validation with real-world traffic conditions. Our experiments were conducted on networks ported from Visum and Vissim, which are widely used in urban mobility research and transportation planning. These networks accurately model real-world road layouts and traffic infrastructures, ensuring a realistic representation of network topology and signal configurations.
Since our traffic light conflict matrix is designed as a modular input for traffic light analysis and optimization, it can be integrated with other data-driven approaches, including real-time traffic data, AI-based analysis, or other optimization techniques. The strength of our method lies in its flexibility—it provides a stable, structural foundation for traffic signal studies without being constrained by specific data sources.
An important consideration in our implementation is the classification of conflicts by severity. Recognizing that not all conflicts pose the same level of hazard in real-world traffic scenarios, our method distinguishes between two types of conflicts:
- Convergent conflicts: These occur when two real signal heads converge directly, typically representing merging or diverging movements. These conflicts generally pose lower safety risks.
- Crossing conflicts: These occur at road intersection points where real signal heads connect through a fictional signal head at a crossing point. These conflicts typically represent more severe hazards, such as those arising from left-turn movements crossing opposing traffic.
This classification aligns with established traffic engineering principles that consider crossing conflicts more hazardous than merging conflicts. Our implementation not only identifies conflicts, but also categorizes them by type, providing traffic engineers with critical information to prioritize the resolution of higher-risk conflicts when designing signal timing plans. This enhancement improves both the practical utility and safety implications of our conflict detection approach.
Our topological approach is designed to serve as a structural foundation that can be integrated with real-time applications through a layered architecture. This architecture consists of three primary components: (1) our topological conflict matrix as a static base layer that remains valid regardless of traffic conditions, (2) a dynamic layer incorporating real-time traffic volume data from sensors or cameras, and (3) an optimization layer that combines both structural constraints and current conditions to make adaptive decisions. This layered approach significantly reduces computational complexity by pre-identifying which signals must be considered together during real-time optimizations. For example, in emergency vehicle prioritization, our conflict matrix immediately identifies which signals must be coordinated when an emergency vehicle approaches, allowing the system to focus only on relevant conflict relationships rather than analyzing the entire network. Similarly, for adaptive signal timing, optimization algorithms can be applied only to the specific sets of conflicting signals identified by our matrix, rather than attempting global optimization across all signals. This strategic reduction in the search space is particularly valuable in time-sensitive applications, where computational efficiency directly impacts response time and system performance. By providing these essential structural constraints, our approach enables more efficient and effective real-time traffic management solutions while maintaining flexibility to incorporate changing traffic conditions.
However, we acknowledge several limitations and opportunities for future research:
- Real-time Adaptation: Integrating dynamic traffic data could enhance the algorithm’s responsiveness.
- Validation: Extensive real-world testing is necessary to fully validate the method’s effectiveness.
- System Integration: Further research is needed to incorporate the conflict detection method into existing traffic management systems.
- Comprehensive Considerations: Future iterations could incorporate pedestrian and cyclist interactions for a more holistic approach.
In conclusion, our study offers a practical and scalable method for identifying potential conflicts across entire networks. This tool allows us to focus calculation efforts on critical traffic lights when applying timing optimization techniques, thereby decreasing computational costs and processing time. The implications of this work extend beyond immediate traffic control. It enables city planners and traffic engineers to make data-driven decisions that can reduce congestion, lower emissions, and improve overall urban mobility. As cities continue to grow and evolve, tools like ours will be crucial in creating more efficient, safer, and more livable urban environments.
For users looking to implement our approach, we designed it to minimize adoption barriers. Vissim users can easily incorporate our solution using the MATLAB scripts, which extract all necessary network information and generate adjacency and conflict matrices automatically, included in the Supplementary Materials section. Detailed step-by-step instructions are provided in the included Readme.txt file. For municipalities without Vissim, our approach can still be applied using the network datasets provided in our Supplementary Materials section or can be adapted to other topological data sources. Traffic engineers with basic MATLAB knowledge can implement our solution with minimal training, as the process is largely automated through our documented scripts. We are currently developing a web platform where researchers and municipal engineers can upload their network data (initially in Vissim format, with plans to expand to OpenStreetMap, GeoFabrik, and Google Maps) and automatically receive complete conflict analysis results. This platform will further reduce implementation barriers, especially for smaller municipalities with limited technical resources. While this platform is under development, we offer direct assistance to any municipality wishing to test our approach with their networks. Our method represents a cost-effective enhancement to existing traffic management systems rather than requiring significant infrastructure changes or specialized training.
7. Conclusions
This study presents several significant contributions to the field of urban traffic management.
- We developed an innovative methodology for identifying conflicts between traffic signals using only topological data from road networks. This approach offers a robust solution applicable to urban networks of any size, overcoming limitations of previous methods that focus on isolated intersections.
- Our algorithm leverages readily available network infrastructure data, such as GIS datasets from platforms like OpenStreetMap and Google Maps. This eliminates the need for specialized hardware or proprietary devices, making our solution widely accessible and implementable.
- The research significantly advances traffic management system optimization, particularly in detecting conflicts between traffic signals across entire networks. This comprehensive approach is crucial for improving traffic flow in complex urban environments.
- Our method can enhance emergency vehicle prioritization strategies through immediate spatial coordination, potentially reducing response times in critical situations.
- By focusing on the structural relationships within road networks, our approach provides a stable foundation for traffic management strategies that is adaptable to changes in traffic patterns and signal timing adjustments.
- This work establishes a solid groundwork for future research in traffic network optimization, especially in understanding the intricate relationships between traffic signals in large-scale urban environments.
These contributions not only address critical gaps in current traffic optimization strategies, but also provide practical, actionable solutions for improving coordination and efficiency in urban transportation networks.
Future improvements to our approach could include developing more sophisticated algorithms for crossing point detection, especially in complex urban environments with multi-level intersections. The current implementation relies on basic geometric intersection calculations that work effectively in planar networks but have limitations in three-dimensional contexts. Advanced spatial algorithms incorporating elevation data and non-linear road geometries could enhance detection accuracy. Additionally, machine learning techniques could potentially identify crossing patterns from visual or spatial data, reducing the reliance on perfect geometric representations. These enhancements would extend the applicability of our conflict matrix approach to increasingly complex urban environments, including those with tunnels, overpasses, and elaborate interchange designs that characterize modern metropolitan areas.
In future works, we plan to leverage the traffic light conflict matrix and the adjacency matrix from our previous research ([12]) to develop a novel emergency vehicle priority approach.
Supplementary Materials
The following supporting information can be downloaded at: https://www.mdpi.com/article/10.3390/systems13040290/s1, Code S1: Dataset_network.m; Code S1: Adjacency_list_of_signal_heads.m; Code S1: Adjacency_list_of_signal_heads_extended.m; Code S1: Adjacency_list_to_matrix.m; Code S1: Conflict_list_of_signal_heads_type.m; Dataset S1: Baton_Rouge_dataset.mat; Dataset S1: Boise_dataset.mat; Dataset S1: London_dataset.mat; Dataset S1: Luxembourg_dataset.mat; Text S1: LICENSE.txt; Text S1: README.txt; Dataset S1: Traffic Ligth Adjacency Matrix.csv; Dataset S1: Traffic Ligth Conflict Matrix.csv.
Author Contributions
Conceptualization, methodology, development of algorithms and MATLAB programs, manuscript writing, and data publication management were conducted by corresponding author S.R.-B.; A.C.-N. and M.O.-M. reviewed the conceptualization, bibliographic references, content planning, and scheduling, and also reviewed and validated the drafts until the final document was obtained; S.S.-M. reviewed the mathematical content and contributed to the structuring of the algorithms. All authors have read and agreed to the published version of the manuscript.
Funding
This research was funded by Universidad de Cádiz grant number RYC-2017-22222.
Data Availability Statement
The original contributions presented in this study are included in the article/Supplementary Material. Further inquiries can be directed to the corresponding author(s).
Acknowledgments
We would like to thank the entire PTV Group team for their support, especially Marilo Martin-Gasulla, Product Manager Academia and Research.
Conflicts of Interest
The authors declare no conflicts of interest.
Appendix A. Detailed Examples of Traffic Light Conflict Matrix Generation
This appendix provides detailed step-by-step examples illustrating the methodology for generating the traffic light conflict matrix described in Section 4. These examples cover both an isolated intersection and a network-wide scenario, demonstrating the algorithm’s application in different contexts. The examples will focus on how road networks and signal heads are represented, how conflict points are identified, how the adjacency matrix is built, how crossing signal heads are used, and how network boundaries are handled. To enhance reproducibility and facilitate further analysis, CSV files containing the complete matrices for these examples are included as Supplementary Material.
Appendix A.1. Isolated Intersection
Appendix A.1.1. Identifying Real Signal Heads (SH)
Figure 3a illustrates the road network and its corresponding signal heads for an isolated intersection. The signal heads are labeled SH01 through SH08.
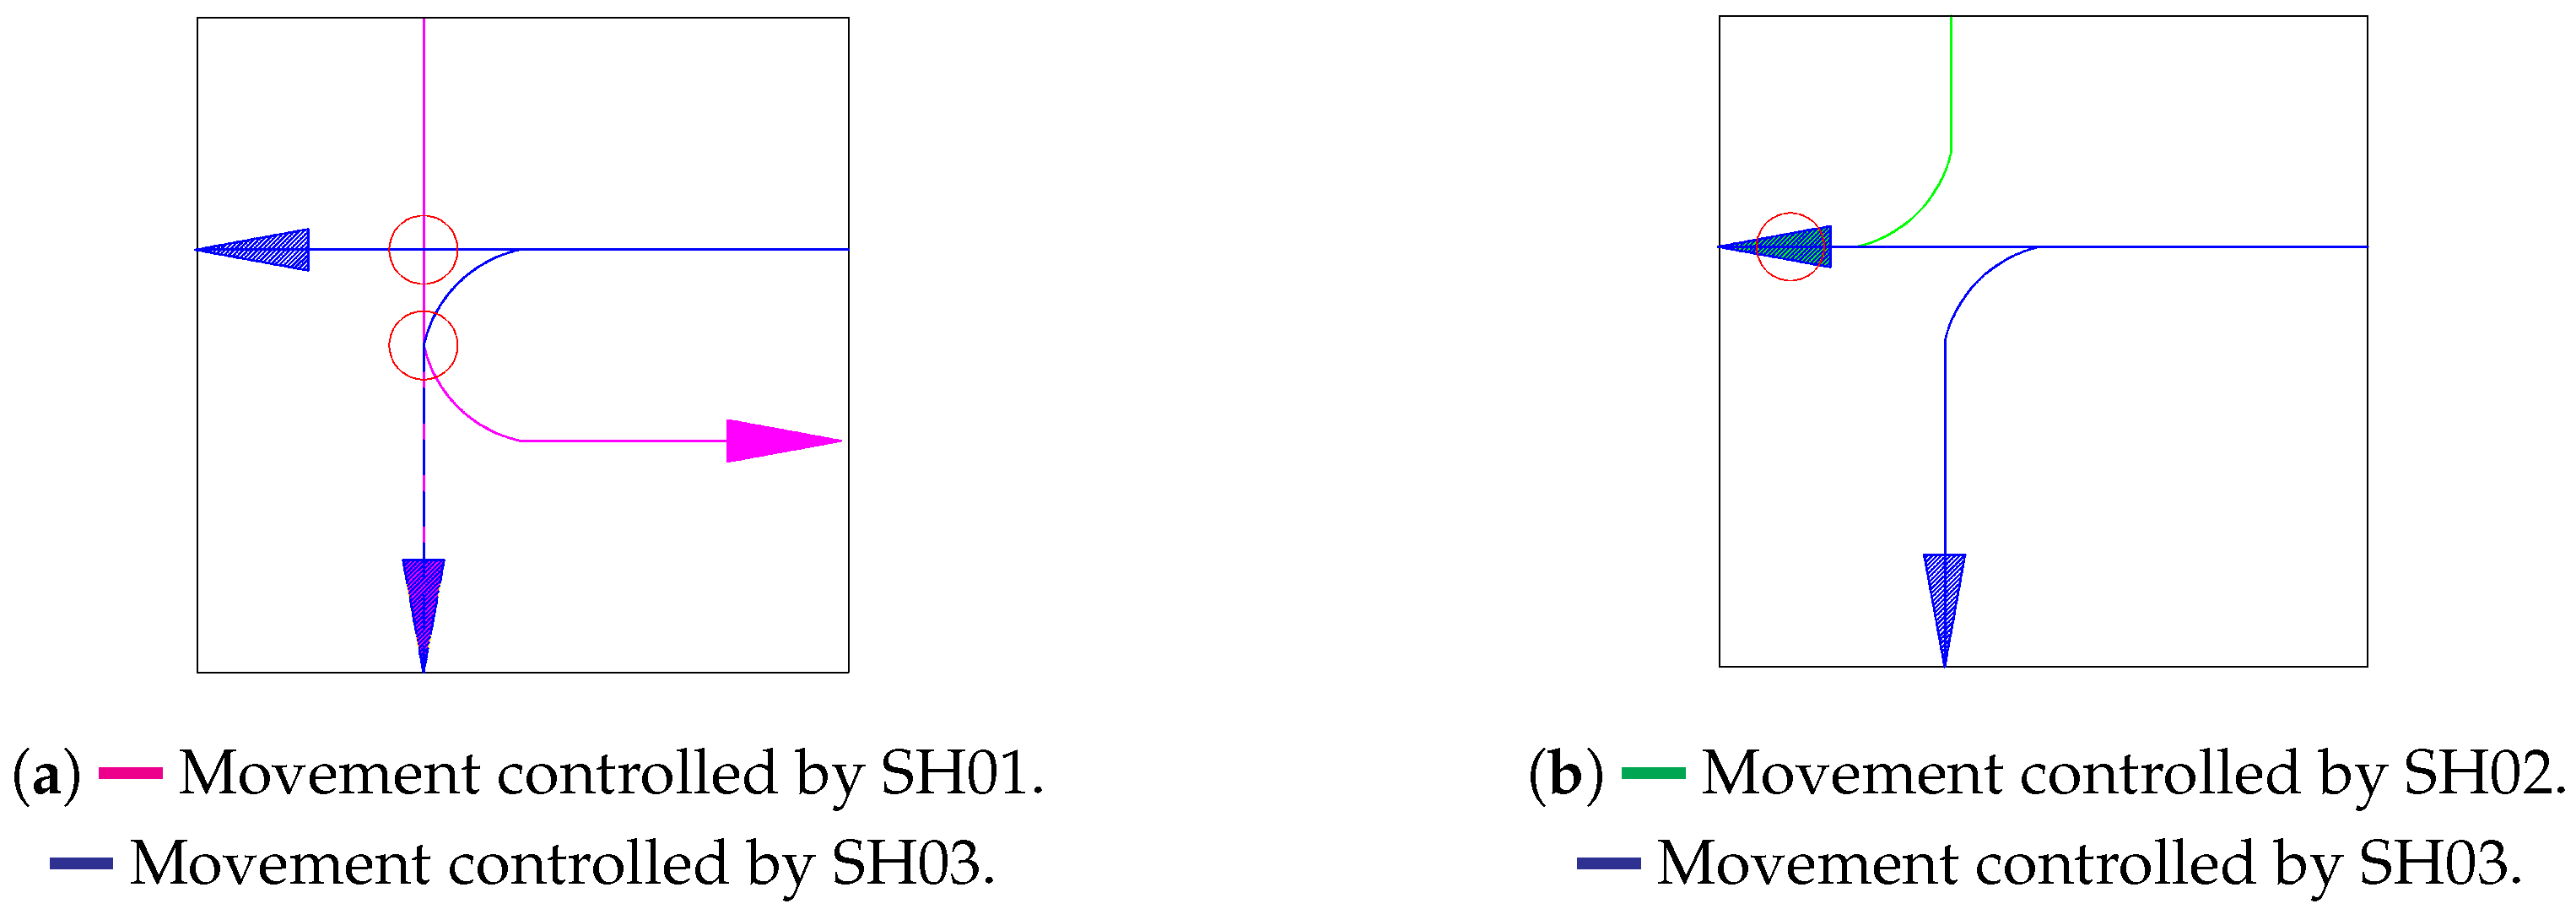
Appendix A.1.2. Identifying Conflict Points and Introducing Crossing Signal Heads (CH)
Conflict points are identified based on overlapping movements. Figure A1 illustrates key conflict points (red circles) between specific movements in the intersection. The figure highlights two primary conflicts: the movement controlled by SH01 (magenta lines) intersecting with the movement controlled by SH03 (blue lines), and the movement controlled by SH02 (green lines) also conflicting with SH03’s movement. For clarity, other potential conflicts have been intentionally omitted from this visualization.

Figure A1.
Example of conflict movements.
Figure A1.
Example of conflict movements.
Appendix A.1.3. Generating the Adjacency Matrix (A)
Based on the detected conflicts, we constructed the adjacency matrix A. To generate the traffic light conflict matrix, we began with the intersection’s adjacency matrix, incorporating both real signal heads and fictional crossing signal heads. One fictional crossing signal head was added for each pair of intersecting movements. This information serves as input for our algorithm.
In this example intersection, there are eight real signal heads. Using a MATLAB function, we identified the following movement conflicts:
- SH01 conflicts with SH03, SH05, SH06, SH07, and SH08.
- SH02 conflicts with SH03 and SH05.
- SH03 conflicts with SH01, SH02, SH05, SH07, and SH08.
- SH04 conflicts with SH05 and SH07.
- SH05 conflicts with SH01, SH02, SH03, SH04, SH07, and SH08.
- SH06 conflicts with SH01 and SH08.
- SH07 conflicts with SH01, SH03, SH04, and SH05.
- SH08 conflicts with SH01, SH03, SH05, and SH06.
Consequently, 34 conflict points between movements were identified. For each conflict point, we introduced a fictional crossing signal head, denoted as CH01 to CH34. The distribution of these crossing signal heads (CH) among the real signal heads (SH) is as follows:
- CH01 to CH05: Conflicts involving SH01.
- CH06 to CH07: Conflicts involving SH02.
- CH08 to CH12: Conflicts involving SH03.
- CH13 to CH14: Conflicts involving SH04.
- CH15 to CH20: Conflicts involving SH05.
- CH21 to CH22: Conflicts involving SH06.
- CH23 to CH26: Conflicts involving SH07.
- CH27 to CH30: Conflicts involving SH08.
Considering SH01 as an example, we have the following:
- CH01, CH02, CH03, CH04, and CH05 are identified as adjacent CHs.
- For CH01, SH03 is also adjacent.
- For CH02, SH05 is also adjacent.
- For CH03, SH06 is also adjacent.
- For CH04, SH07 is also adjacent.
- For CH05, SH08 is also adjacent.
The complete adjacency matrix A represents the relationships between the real signal heads (SH) and crossing signal heads (CH). The rows of A correspond to the real signal heads, and the columns represent the crossing signal heads. A value of 1 in the matrix indicates the presence of a conflict between a real signal head and a crossing signal head, while 0 indicates no conflict.
Appendix A.1.4. Computing the Traffic Light Conflict Matrix
The final traffic light conflict matrix C was obtained using the adjacency relationships. Therefore, in the traffic light conflict matrix, SH01 will have conflicts (marked by 1) with SH03, SH05, SH06, SH07, and SH08.
The adjacency matrix for this intersection is provided in the Supplementary Materials CSV Files, with the rows and columns corresponding to the signal heads (SH01–SH08) and crossing signal heads (CH01–CH34). The cells indicate the presence (1) or absence (0) of a conflict between the corresponding signal heads.
Appendix A.2. Network-Wide Scenario
Appendix A.2.1. Identifying Real Signal Heads (SH)
Figure 6 illustrates a sample network. Table A1 details the adjacency relationships between the real and endpoint signal heads for the example network.
Table A1.
Adjacency relationships.
Table A1.
Adjacency relationships.
| Signal Head | Adjacent Signal Heads |
|---|---|
| SH01 | SH10, SH13, SH14, SH17, SH18 |
| SH02 | EP08 |
| SH03 | SH17, SH18, EP08 |
| SH04 | EP01 |
| SH05 | EP03, SH21, SH22 |
| SH06 | SH03, SH04 |
| SH07 | SH03, SH04, SH21, SH22 |
| SH08 | EP02 |
| SH09 | EP01 |
| SH10 | SH13, SH14, SH17, SH18 |
| SH11 | EP01, EP08 |
| SH12 | SH13, SH14 |
| SH14 | EP03, SH21, SH22 |
| SH15 | EP02, SH03, SH04 |
| SH16 | EP03 |
| SH17 | EP06, SH29, SH30 |
| SH18 | EP07 |
| SH19 | EP06, EP07 |
| SH20 | SH11, SH12 |
| SH21 | EP04, EP05 |
| SH22 | SH19, SH20 |
| SH23 | SH19, SH20, EP05 |
| SH24 | SH15, SH16 |
| SH25 | SH11, SH12 |
| SH26 | EP06, SH29, SH30 |
| SH27 | EP07, SH11, SH12 |
| SH28 | SH29, SH30 |
| SH29 | SH15, SH16 |
| SH30 | EP04, EP05 |
| SH31 | SH15, SH16, SH19, SH20 |
| SH32 | EP04 |
Appendix A.2.2. Identifying Terminal Links and Introducing Endpoint Signal Heads (EP)
To define the network boundaries and ensure comprehensive analysis, the following steps were implemented:
- Identify the edges of the network.
- Introduce fictitious signal heads (EP01, EP02, etc.) at these boundary points to represent the endpoints of the network.
- Connect these fictitious signal heads to the corresponding real signal heads in the adjacency matrix.
- Create a closed system that allows for comprehensive analysis of traffic flow and signal interactions within the defined network boundaries.
Appendix A.2.3. Identifying Conflict Points and Introducing Crossing Signal Heads (CH)
For the network-wide scenario, the complete adjacency matrix A was constructed to represent the relationships between the real signal heads (SH) and both endpoint signal heads (EP) and crossing signal heads (CH). The rows of A correspond to the real signal heads, while the columns represent the endpoint signal heads and the crossing signal heads. The adjacency relationships were determined based on network topology and traffic flow considerations.
The adjacency matrix for this network is provided in the Supplementary Materials CSV Files, with the rows and columns corresponding to the real signal heads (SH01–SH32) and endpoint signal heads (EP01–EP08). The cells indicate the presence (1) or absence (0) of an adjacency relationship between the corresponding signal heads.
References
- Blincoe, L.; Miller, T.R.; Wang, J.S.; Swedler, D.; Coughlin, T.; Lawrence, B.; Guo, F.; Klauer, S.; Dingus, T. The Economic and Societal Impact of Motor Vehicle Crashes. Report by U.S. Department of Transportation, National Highway Traffic Safety Administration. 2019. Available online: https://crashstats.nhtsa.dot.gov/Api/Public/ViewPublication/813403.pdf (accessed on 1 April 2025).
- Schrank, D. 2023 Urban Mobility Report; Texas A&M Transportation Institute: College Station, TX, USA, 2024. [Google Scholar]
- Jima, D.; Sipos, T. The Impact of Road Geometric Formation on Traffic Crash and Its Severity Level. Sustainability 2022, 14, 8475. [Google Scholar] [CrossRef]
- Park, B.B.; Chen, Y. Quantifying the Benefits of Coordinated Actuated Traffic Signal Systems: A Case Study; Vtrc 11-Cr2; The National Academies of Sciences, Engineering, and Medicine: Washington, DC, USA, 2010. [Google Scholar]
- Haddad, J.; Tur, N.; Veikherman, D.; Buchnik, E.; Ferster, S.; Kalvari, T.; Karliner, D.; Litov, O.; Zagoury, A.; Rottenstreich, O.; et al. Quantitative Approach for Coordination, at Scale, of Signalized Intersection Pairs. In Proceedings of the 2024 European Control Conference (ECC), Stockholm, Sweden, 25–28 June 2024; pp. 1881–1888. [Google Scholar] [CrossRef]
- Xing, J.; Zhang, Q.; Cheng, Q.; Zu, Z. A Geographical and Temporal Risk Evaluation Method for Red-Light Violations by Pedestrians at Signalized Intersections: Analysis and Results of Suzhou, China. Int. J. Environ. Res. Public Health 2022, 19, 14420. [Google Scholar] [CrossRef] [PubMed]
- Jin, Q. Automatic Control of Traffic Lights at Multiple Intersections Based on Artificial Intelligence and ABST Light. IEEE Access 2024, 12, 103004–103017. [Google Scholar] [CrossRef]
- Chen, W.; Yang, S.; Li, W.; Hu, Y.; Liu, X.; Gao, Y. Learning Multi-Intersection Traffic Signal Control via Coevolutionary Multi-Agent Reinforcement Learning. IEEE Trans. Intell. Transp. Syst. 2024, 25, 15947–15963. [Google Scholar] [CrossRef]
- Wang, Y.; Xu, T.; Niu, X.; Tan, C.; Chen, E.; Xiong, H. STMARL: A Spatio-Temporal Multi-Agent Reinforcement Learning Approach for Cooperative Traffic Light Control. IEEE Trans. Mob. Comput. 2022, 21, 2228–2242. [Google Scholar] [CrossRef]
- Ding, L.; Zhao, D.; Zhu, B.; Wang, Z.; Tan, C.; Tong, J.; Ma, H. SpeedAdv: Enabling Green Light Optimized Speed Advisory for Diverse Traffic Lights. IEEE Trans. Mob. Comput. 2024, 23, 6258–6271. [Google Scholar] [CrossRef]
- Sheriff, F. ELMOPP: An application of graph theory and machine learning to traffic light coordination. Appl. Comput. Informatics 2024, 20, 217–230. [Google Scholar] [CrossRef]
- Rojas-Blanco, S.; Cerezo-Narváez, A.; Otero-Mateo, M.; Sáez-Martínez, S. Adjacency List Algorithm for Traffic Light Control Systems in Urban Networks. Systems 2024, 12, 539. [Google Scholar] [CrossRef]
- Qadri, S.S.S.M.; Gökçe, M.A.; Öner, E. State-of-art review of traffic signal control methods: Challenges and opportunities. Eur. Transp. Res. Rev. 2020, 12, 1–23. [Google Scholar] [CrossRef]
- Shaygan, M.; Meese, C.; Li, W.; Zhao, X.G.; Nejad, M. Traffic prediction using artificial intelligence: Review of recent advances and emerging opportunities. Transp. Res. Part C Emerg. Technol. 2022, 145, 103921. [Google Scholar] [CrossRef]
- Cui, H.; Meng, Q.; Teng, T.H.; Yang, X. Spatiotemporal correlation modelling for machine learning-based traffic state predictions: State-of-the-art and beyond. Transp. Rev. 2023, 43, 780–804. [Google Scholar] [CrossRef]
- Jiang, W.; Luo, J. Graph neural network for traffic forecasting: A survey. Expert Syst. Appl. 2022, 207, 117921. [Google Scholar] [CrossRef]
- Zhu, R.; Li, L.; Wu, S.; Lv, P.; Li, Y.; Xu, M. Multi-agent broad reinforcement learning for intelligent traffic light control. Inf. Sci. 2023, 619, 509–525. [Google Scholar] [CrossRef]
- Chalaki, B.; Malikopoulos, A.A. Optimal Control of Connected and Automated Vehicles at Multiple Adjacent Intersections. IEEE Trans. Control Syst. Technol. 2022, 30, 972–984. [Google Scholar] [CrossRef]
- Li, W.; Wang, B.; Khattak, Z.H.; Deng, X. Network-Level Traffic Signal Cooperation: A Higher-Order Conflict Graph Approach. IEEE Trans. Intell. Transp. Syst. 2023, 24, 990–999. [Google Scholar] [CrossRef]
- Fellendorf, M.; Vortisch, P. Microscopic Traffic Flow Simulator VISSIM. In Fundamentals of Traffic Simulation; Springer: New York, NY, USA, 2010; pp. 63–93. [Google Scholar] [CrossRef]
- Ahmed, S.; Osman, O.; Codjoe, J. Mitigating Traffic Congestion on I-10 Mississippi River Bridge in Baton Rouge, LA. MATEC Web Conf. 2019, 271, 06002. [Google Scholar] [CrossRef]

Disclaimer/Publisher’s Note: The statements, opinions and data contained in all publications are solely those of the individual author(s) and contributor(s) and not of MDPI and/or the editor(s). MDPI and/or the editor(s) disclaim responsibility for any injury to people or property resulting from any ideas, methods, instructions or products referred to in the content. |
© 2025 by the authors. Licensee MDPI, Basel, Switzerland. This article is an open access article distributed under the terms and conditions of the Creative Commons Attribution (CC BY) license (https://creativecommons.org/licenses/by/4.0/).