Article

The Influence of Conformity and Global Learning on Social Systems of Cooperation: Agent-Based Models of the Spatial Prisoner’s Dilemma Game

College of General Education, Kookmin University, Seoul 02707, Republic of Korea
Systems 2025, 13(4), 288; https://doi.org/10.3390/systems13040288
Submission received: 9 March 2025 / Revised: 13 April 2025 / Accepted: 14 April 2025 / Published: 15 April 2025
(This article belongs to the Section Systems Practice in Social Science)

Abstract

:
Individuals can learn about others from sources far from them, and conformity can operate not only on a local scale but also on a global scale. This study aimed to investigate the influence of conformity and global learning on social systems of cooperation using agent-based models of the spatial prisoner’s dilemma game. Three agent-based models incorporating differing types of global conformity were built and analyzed. The results suggested that global learning was generally unfavorable for cooperation. However, in some cases, it enabled resistance to the dominance of defection. Moreover, referring to more diverse sources was less harmful to cooperation than referring to a larger number of similar sources. Evolutionary dynamics were generated according to how competing forces of cooperative and defective agents were balanced. Random drifts toward either the cooperation- or defection-dominant state occurred under some parameter conditions. Whether the drifts were equally or unequally probable toward either state differed according to the parameter conditions. This study highlights the importance of individuals’ psychological biases in the evolution of cooperation. It also shows that differing practices of those biases can generate different dynamics, resulting in the system having different states.

1. Introduction

The advancement of communication systems has significantly lowered the cost of obtaining information about others. This change can have an influence on individuals’ behavior. For example, the increased frequency and strength of individuals’ relationships with others can lead to opinion polarizations, especially in the online space [1]. Further, the advanced environment can affect individuals’ psychological biases that drive their behaviors. Since an individual’s judgment can be influenced by others [2], the range of information sources may shape the set of “others” who influence the individual. In other words, the range of information sources can determine to whom an individual conforms.
This range of information sources about others can have a significant meaning for the evolution of cooperation in social systems. The evolution of cooperation among selfish individuals has been a key puzzle in many domains [3], and a number of mechanisms that explain it have been suggested [4]. For example, cooperation can evolve among individuals when they are genetically related (i.e., kin selection), when one of them previously helped the other (i.e., direct reciprocity), when individuals have cooperative reputations (i.e., indirect reciprocity), when cooperative individuals are located closely to each other (i.e., spatial reciprocity), or when one group has more cooperative individuals than other groups (i.e., group selection). In addition, other mechanisms regarding individuals’ psychological biases have been proposed. Basically, individuals have various psychological biases, such as following others’ behavior and desiring to belong to a group [5]. Thus, they might consider what other people do when they make decisions about whether to cooperate [6,7]. Also, obtaining information about others’ payoff can be difficult or impossible; in this situation, doing what others usually do can be a feasible strategy [8]. Even when that information is available, conforming to others’ behavior can be more efficient than seeking the information alone [9]. Thus, conformity has been examined in the literature in terms of its role in the evolution of cooperation [10,11,12,13,14,15], mainly in the framework of evolutionary game theory [16,17].
Previous studies have focused on various aspects of conformity and suggested that conformity generally promotes cooperation. First of all, the influence of conformists’ proportion in the population has been examined. Studies have shown that a moderate proportion of conformists in the population is the best condition for cooperation to evolve [13,18]. The strength of conformity has also been considered in the literature. It was demonstrated that the evolution of cooperation can be enhanced most under the condition of moderately strong conformity [14,19]. It was also illustrated that the shape of the conformity strength function determines the evolution of cooperation [20]: an S-shaped function determined by the number of neighbors with a particular strategy enhanced cooperation more than an inverse S-shaped function. Meanwhile, the type of conformity has been a concern in the literature. It was exhibited that cooperation evolved only when followers (low-degree nodes in a social network), not leaders (high-degree nodes), were conformists [21]. The rational conformity behavior was examined in [22], which showed that considering payoffs in current and previous time steps for strategy updating could promote cooperation. The effects of the conformity threshold above which players determine whether a strategy constitutes a majority was a concern in [23], which found an optimal conformity threshold that maximizes the cooperation level in the population. Other studies have examined how the effect of conformity on the evolution of cooperation is related to the relative benefit of defectors over cooperators in an evolutionary game. It was shown that conformity promoted cooperation only when the relative benefit of defectors was small [10]. Similarly, it was demonstrated that, when the relative benefit of defectors was small, an optimal fraction of conformists could enhance cooperation, but a large fraction of conformists hindered cooperation when the relative benefit was large [12]. And a study showed that cooperation was sustained better under a larger relative benefit of defectors in a population with conformists than in a population without conformists [13].
Notably, studies of conformity and evolution of cooperation have been based on local conformity in which individuals consider only their local neighbors for strategy updating. However, global conformity, in which individuals learn a new strategy from individuals other than their immediate neighbors [24], is also possible in human societies. Individuals use not only local but also global information, such as that from mass media and the internet, to decide on their behavioral change [25]. In addition, they are exposed to diverse sources of information because they usually belong to many social networks from which they can obtain information for decision making [26,27]. The distinction between informational and normative conformity [28] forms the basis of global conformity. Informational conformity is concerned with seeking information about the reality around individuals; thus, it concerns finding the best solution to a problem in a given context, and individuals conform to others for the solution. In contrast, normative conformity concerns developing and maintaining a social identity, and individuals conform to others to do what their social groups consider right [29]. Thus, informational conformity relates mainly to local conformity, while normative conformity relates to global conformity; individuals’ normative models, such as teachers, mentors, online influencers, or great figures in history, are located relatively far from individuals rather than close to them.
From the perspective of evolutionary game theory, an interaction group (IG) and a learning group (LG) can differ. An IG consists of other players with whom a player plays games and obtains payoffs, and an LG consists of others from whom a player acquires information about a potential strategy that may replace the current one. The literature has investigated the effect of the separation between an IG and an LG on the evolution of cooperation, but the results have been inconsistent. Some studies have reported an enhancing effect of different IGs and LGs. It was suggested that the difference between an IG and an LG in evolutionary spatial prisoner’s dilemma (PD) games can enhance cooperation [30]. In the same vein, it was shown that “play locally and learn globally” can be the best condition for the evolution of cooperation in a structured population [28], and the highest level of cooperation was achieved when the IG was relatively small and the LG was the largest [31]. In contrast, other studies reported that different IGs and LGs can hinder the evolution of cooperation. It was demonstrated that defection always wins in equilibrium when players use information of other players beyond their IG for strategy updating [32,33]. It was also shown that the optimum condition for the evolution of cooperation was identical IGs and LGs [34]. There are also reports of conditional effects of different IGs and LGs. It was reported that a larger LG than IG promoted cooperation when the LG was the further neighbor than immediate ones, but not when the LG was randomly sampled from the entire population [25]. It was also demonstrated that different IGs and LGs generally hindered cooperation but their large overlap could promote cooperation [24]. These studies show that the difference between IGs and LGs has been examined in terms of the evolution of cooperation. However, the examination was confined to payoff-biased learning, and investigation in the context of conformity-biased learning was scarce.
Based on the considerations above, this study aims to demonstrate the effect of conformity on the evolution of cooperation when learning for strategy updating is performed on a global scale. To achieve this aim, it incorporates both conformity and differing IGs and LGs, which have been reported to have different influences on the evolution of cooperation (Table 1 summarizes the research gap in the literature). An agent-based modeling approach is employed, and three models, each incorporating global conformity differently, are built and analyzed. In the first model, conformity-biased agents adopt the majority strategy of their LGs that are an expansion of their IGs. In the second model, conformists adopt the majority strategy of their LG that was built by randomly selecting agents from the entire population. In the third model, conformists adopt the strategy of another agent, randomly selected from the entire population, if the strategy conforms to the majority of the selected agent’s neighbors. This investigation should contribute to the understanding of how psychological biases work on a global scale influence the evolution of cooperation in social systems.
The remainder of this paper is organized as follows. The details of model specification are introduced, and the simulation results are presented in terms of equilibrium states, temporal dynamics of evolution, and changes in spatial distribution over time. Then, the results are summarized, and possible implications and suggestions for future studies are also presented.

2. Model

2.1. A Prisoner’s Dilemma Game on a Lattice

An evolutionary PD game on the L × L square lattice with a periodic boundary condition, where the left and right edges were connected and so were the top and the bottom edges, was considered [35]. Agent-based models were built using a different IG and LG of agents. The IG of agents was their nearest von Neumann neighbors (neighboring agents in the four directions—north, south, east, and west); thus, the size of their IG was 4 and this was fixed throughout the whole simulation runs in this study. Each agent had one of the two strategies, cooperation (C) or defection (D), and played a pairwise PD game with each agent in its IG using the same strategy in a given time step. Agent i accumulated payoff Π i = l I G ( i ) π i l , where π i l is the payoff that agent i obtains by playing a game with agent l. If two C agents play a game, they receive the reward payoff for mutual cooperation (R). If two D agents interact, they receive the punishment payoff for mutual defection (P). If a C agent and a D agent interact, the C agent receives the sucker’s payoff (S) and the D agent receives the temptation to defect payoff (T). The payoff matrix that describes the game is presented in Equation (1):
P T S R = 0 b 0 1 ,
where b is a model parameter. The row (column) indices of the payoff matrix indicate whether agent i (agent l) cooperates: the first row (column) is for defection and the second row (column) is for cooperation. This study used a rescaled version of a PD game: T = b (1 ≤ b ≤ 2), R = 1, and P = S = 0. Although it does not strictly obey the condition of a PD game, the rescaled PD game captures nearly all features of a PD game by a single parameter [36,37] and has been widely used in the literature [13,38,39].

2.2. Strategy Updating of Agents

After all agents obtained payoffs, they updated their strategies based on redetermined rules. Each agent was either payoff-biased (PO) or conformity-biased (CF). Three models were built to incorporate agents’ differing strategy updating.

2.2.1. Neighborhood Model (NHD)

In this model, the LG of an agent was its von Neumann neighbors within a radius r (model parameter) set to 1, 2, 3, or 4 (thus, the size of the LG in the NHD was 4, 12, 24, or 40). r =1 corresponds to local learning, and r = 2, 3, and 4 are, respectively, comparable to narrow, intermediate, and wide ranges of global learning. For strategy updating, a PO agent i randomly chose another agent j from its LG as a learning reference, and i adopted the strategy of j with a probability determined by the Fermi function:
Γ ( s i s j ) = 1 1 + exp ( ( Π i Π j ) / K ) ,
where s i is the strategy of i, Π i is the payoff of i, and K is the uncertainty parameter in the strategy adoption process [37]. The value generated by the Fermi function led the strategy of an agent with a higher payoff to be adopted by other agents with a higher probability, but the strategy of an agent with a lower payoff could also be adopted although the probability was low. The latter case accounted for error factors, and the high K value could lead to more errors. The K value was fixed at 0.1 in this study.
If agent i was CF, it observed its LG and changed its current strategy (C or D) to the other one with a probability determined by the Fermi function:
Γ ( s i ¬ s i ) = 1 1 + exp ( ( N s i k h i ) / K ) ,
where N s i is the number of other agents in i’s LG with the same strategy as i, and k h i is one-half of the size of i’s LG. The less popular i’s current strategy was, the more likely it was changed to the other strategy. The current strategy remained when it was popular, but the uncertainty parameter enabled the popular strategy to change with a low probability.

2.2.2. Random Sampling Model (RSP)

In this model, the LG of a CF agent was formed by randomly sampling q (model parameter) other agents from the entire population. The q value was set for the LG size to be equal in NHD: thus, q was 4, 12, 24, or 40. Then, agents updated their strategy with the probability in Equation (3). This represents an individual attempting to draw learning references from diverse sources. Meanwhile, a PO agent i randomly chose agent j as a learning reference from the entire population and adopted the strategy of j with the probability determined by Equation (2). Forming an LG by randomly sampling other agents and choosing one reference from it was equivalent to just randomly choosing a reference.

2.2.3. Reference Neighborhood Model (RND)

In this model, CF agent i randomly chose another agent j as a learning reference from the entire population and considered whether j conformed to its von Neumann neighbors within a radius r (= 1, 2, 3, or 4). Agent i adopted the strategy of j with a probability determined by the Fermi function:
Γ ( s i s j ) = 1 1 + exp ( ( k h j N s j ) / K ) ,
where k h j is one-half of the size of j’s von Neumann neighbors within the radius r, and N s j is the number of agents using the same strategy as j among j’s neighbors. Here, i’s LG can be said to be j’s neighbors. This represents an individual’s drawing references from a limited range of diversity. Note that the terms in the denominator of Equation (4) are reversed compared to Equation (3): the strategy adopted by more than half of an LG was more likely to be adopted, but the strategy not adopted by the majority could be adopted with a low probability. In the RND, a PO agent updated its strategy in the same way as in the RSP: forming an LG by the neighbors of a randomly chosen reference and choosing one from it was equivalent to just randomly choosing a reference.

2.3. Simulation Procedure

At the initialization phase of each simulation run, agents were designated as having either C or D with equal probability and randomly distributed on a simulation space with L = 100. A fraction ρ (∈ [0,1]) of the population was randomly selected regardless of their strategy and designated as CF, and the remaining fraction (1 − ρ ) as PO. In each time step, agents obtained payoffs, updated their strategies, and reset the payoffs to 0. Agents updated their strategy asynchronously: after all agents obtained payoff, they updated their strategies in a random sequence. Simulations were run for 10,000 time steps. The fraction of C agents in the population f C was the measurement of interest, and the f C s in the final 1000 steps was averaged as the measurement in a (quasi-)equilibrium state. Then, the average of 100 simulation realizations for each combination of parameter (b, ρ , and r or q) was obtained. The total number of parameter combinations was 25,452: 101 in b, 21 in ρ , 4 in r or q, and 3 in the models. Table 2 presents the model parameters. The value of the b parameter was set to 1 ≤ b ≤ 2 following previous studies on conformity and the evolution of cooperation [13,38]. The value of the ρ parameter was set to 0 ≤ ρ ≤ 1 by its definition (the fraction of conformists in the population) and following previous studies [13,18]. The value of the r parameter was set to 1, 2, 3, or 4 following previous studies on differing IGs and LGs [25,39], and the value of the q parameter was set to 4, 12, 24, or 40 so that the number of samples in the RSP should be equal to the number of neighbors in the NHD and RND. The simulations were performed using Agents.jl (v.6.1.7) package [40] in Julia language.

3. Results and Discussion

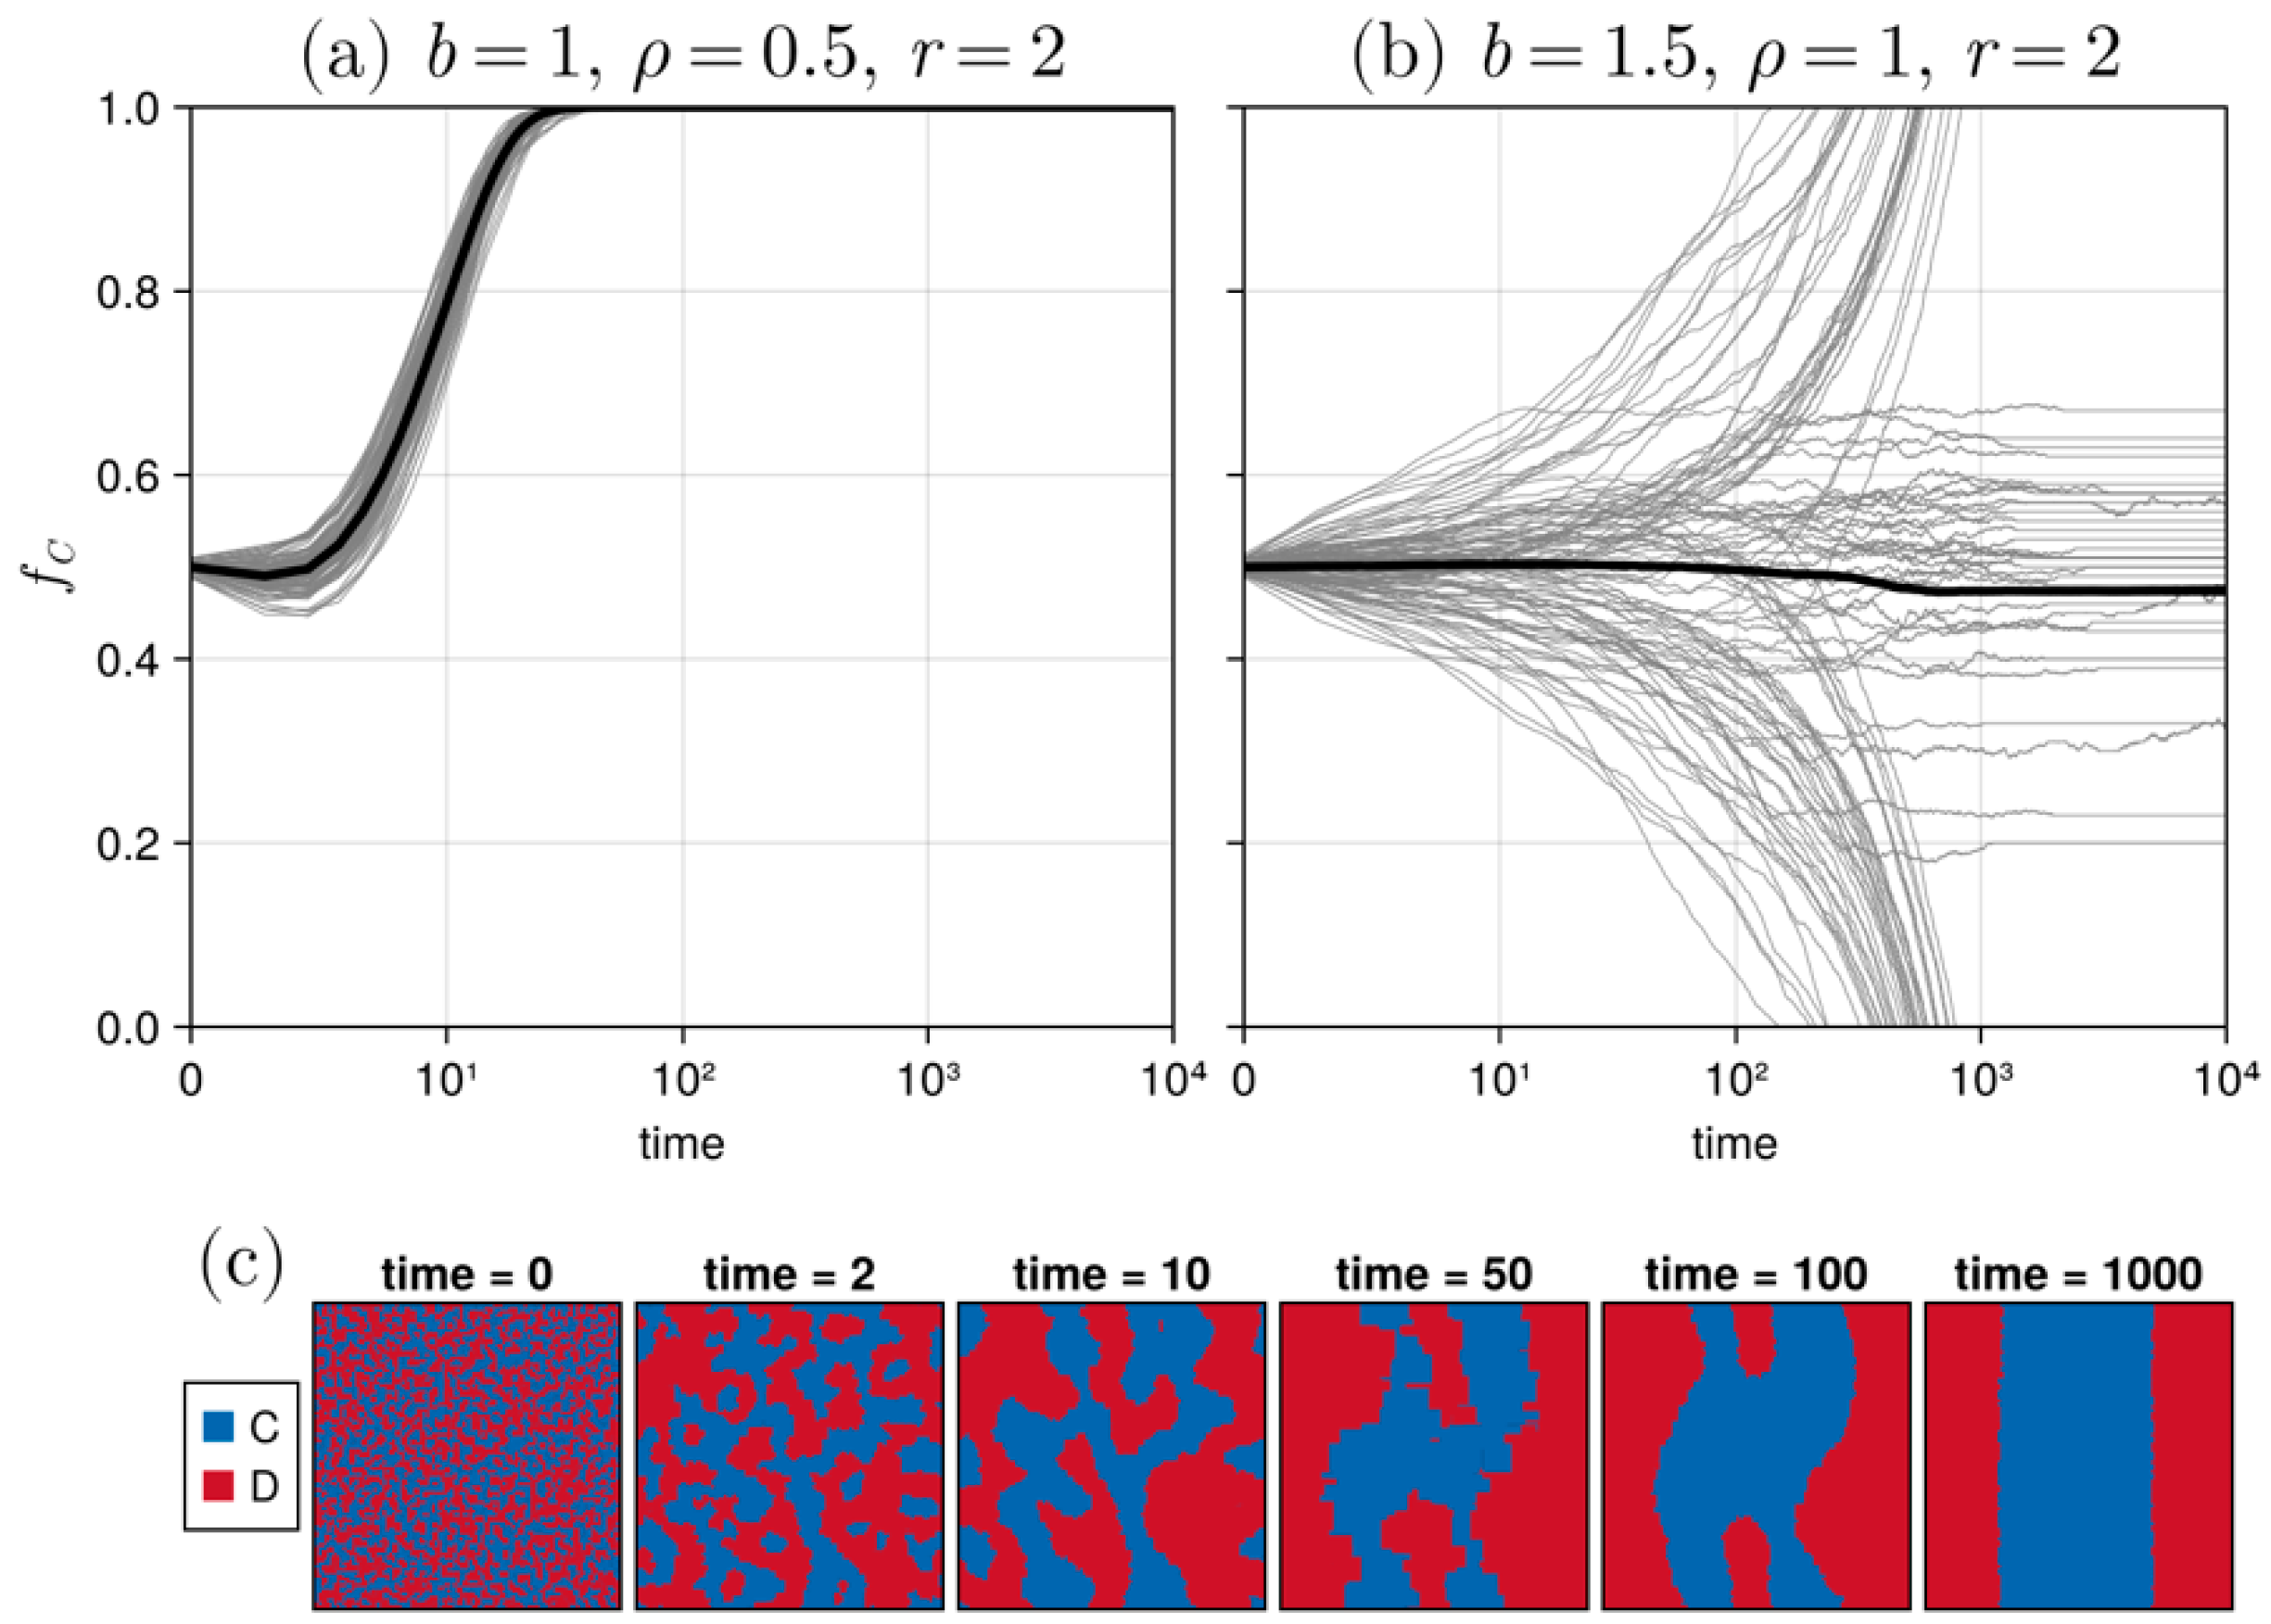
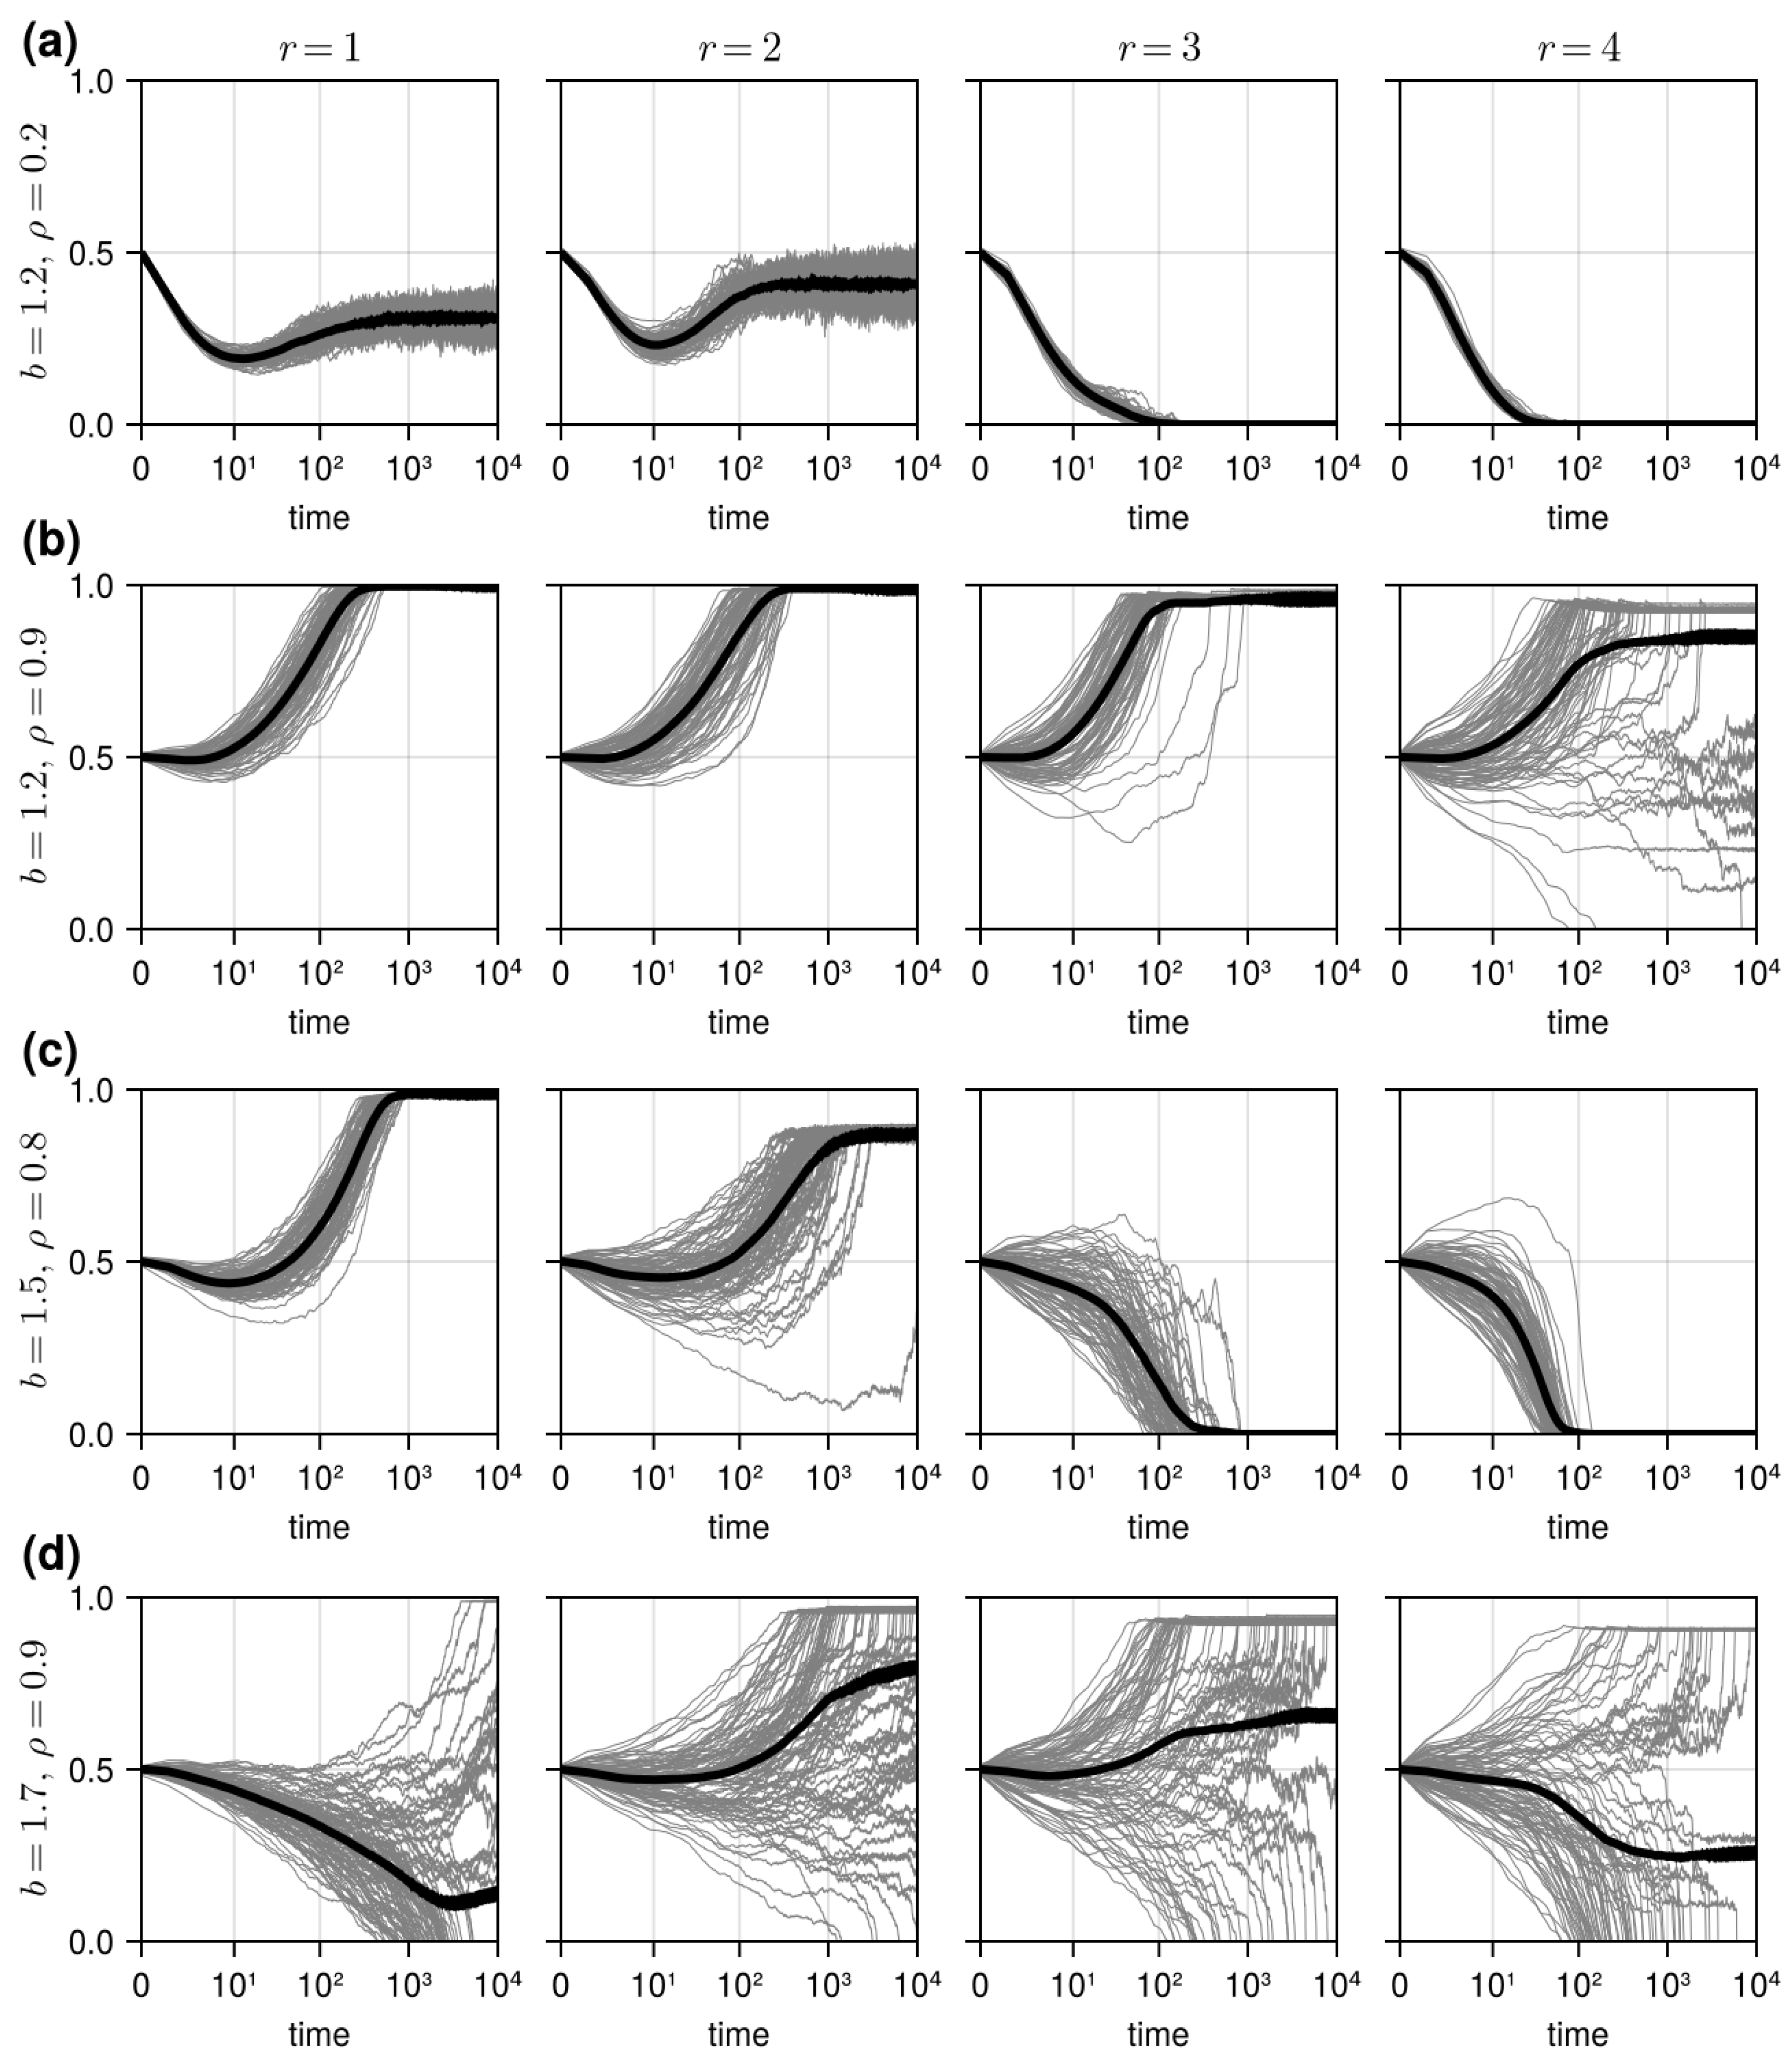
3.1. Results in Neighborhood Model

First, it is examined how cooperation evolved in equilibrium states. Figure 1 shows the f C under various parameter conditions, suggesting that a small b and a large ρ was a generally favorable condition for cooperation. The figure also illustrates that the parameter regions for the evolution of cooperation became smaller as r increased: global learning was generally unfavorable to cooperation in the NHD. This result is consistent with previous studies stating that (payoff-biased) global learning hinders cooperation [32,33], suggesting that this hindering effect also holds when conformity-biased agents are added to the population.
Before looking at the figure in detail, cases with the lowest b and the highest ρ are examined for comparison. When b = 1, all simulation runs proceeded toward the all-C state regardless of ρ and r (see Figure 2a for an example), except when ρ = 1. This was a consequence of spatial reciprocity [4]: a C-C interaction gave a larger payoff (R = 1) to participants than a D-D interaction did (P = 0), and the C strategy spread by forming C clusters. Moreover, since D agents did not have a relative advantage in a C-D interaction (T = b, S = 1), the D strategy could not invade C clusters. However, ruling out other factors such as ρ , this phenomenon disappeared when b increased slightly. In other words, other factors needed to operate for cooperation to evolve when b > 1. Turning to when ρ = 1, all players considered only a strategy’s popularity, not its payoff; thus, the evolution became a neutral random drift [13]. Consequently, simulation runs drifted toward either all-C, all-D, or their coexistence (see Figure 2b,c for an example) regardless of b and r, and the average f C became approximately 0.5.
Back to Figure 1, a closer look reveals the detailed relationships between f C and other parameters. When b was relatively small (⪅1.4), f C became larger as ρ increased, while the ρ threshold above which C dominated became higher as r increased. In other words, a larger fraction of conformists was needed for cooperation to evolve as the learning became more global. In contrast, when b was relatively large (⪆1.4), cooperation evolved under the condition of a large ρ (⪆0.8) and a narrow/intermediate r (=2 and 3). A large ρ could not cause cooperation to evolve when the range of global learning was wide (r = 4). In summary, there existed a limited parameter region where cooperation evolved when the T payoff was large: the narrow/intermediate range of global learning and the large fraction of conformists. Although previous studies have identified various conditions for the evolution of cooperation when IGs and LGs are different [25,31,41], results under the combined conditions of the fraction of conformists and the range of global learning are difficult to find in the literature.
To investigate the dynamics leading to the equilibrium states, Figure 3 presents the typical dynamics of f C . When b and ρ were both small, cooperation survived by growing after initial shrinkage when r = 1 and 2 (see Figure 3a for an example). These enduring and expanding periods were typical in previous studies [25,41,42]: cooperation shrinks at the beginning phase of a simulation but begins expanding after forming clusters, and f C reaches a certain level at equilibrium. Notably, f C reached higher values when r = 2 than when r = 1, and it went extinct without growing when r = 3 and 4. This result indicates that the narrow range of global learning was most favorable for the evolution of cooperation. This is consistent with previous studies on payoff-biased global learning [30,31,39], and this study shows that the result was the same when the population included a small fraction of conformists. However, when ρ was large (and b was still small), the population evolved to the C-dominant state (see Figure 3b for an example). Although the population of all CF agents showed a neutral random drift (Figure 2b), the population of largely CF agents with a few PO agents led the evolution to be C-dominant, as shown in [13]. The small fraction of PO agents could be the role models to which CF agents could conform [43]; in other words, the achievements of a few PO agents was amplified by many CF agents. This pattern was generally sustained under the global learning conditions, except when r = 4, where a few random drifts occurred and the final average f C decreased slightly. This was probably derived from the stronger influence of the random spatial distribution at initialization when the range of global learning was wider.
The most dramatic effect of global learning appeared when b was intermediate and ρ was large (see Figure 3c for an example). When r = 1 and 2, f C reached higher values in Figure 3c than in Figure 3a, although b was larger in the former and thus less favorable for cooperation. As discussed above, this was due to combining a large fraction of CF and a small fraction of PO agents [13]. When r = 3 and 4, however, cooperation became extinct, as shown in Figure 3c. This result suggests that cooperation was hindered when the range of global learning increased too much in the mostly conformist population, as in the payoff-biased population in the literature [30,31,39]. These two forces drove evolution in opposite directions [31]: the enhancing force from the combination of conformity- and payoff-biased agents and the hindering force from global learning. These two forces balanced each other and determined the evolutionary dynamics.
When b and ρ were both large, the simulation drifted toward either a C- or D-dominant state, each with a different probability (see Figure 3d for an example). As discussed above, a large ρ could function as the enhancing factor of cooperation [13]. At the same time, however, a large b was the hindering factor here; thus, the dynamics drifted more toward the D-dominant state in Figure 3d compared to in Figure 3b. Additionally, global learning was either the enhancing or hindering factor according to r: only the narrow and intermediate range of global learning (r = 2 and 3) functioned as the enhancing factor, as in the literature [30,31,39]. As a result, the average f C reached a C-dominant state under those conditions. Notably, more random drifts were observed in Figure 3d than under other conditions, suggesting that the contest between two forces was fiercer here. The large b strengthened the hindering force, but the large ρ still underpinned the enhancing force. In summary, a large b and a large ρ , combined with a different r, had complex influences on the dynamics of the evolution of cooperation.
Finally, the mechanism generating the above dynamics was examined through the microscopic view of the simulation runs. When learning was global, the agents in the C-D boundary could learn from other agents over the boundary, so D (C) agents could invade C (D) clusters [31]. Thus, the smooth boundary between C and D clusters could not be established (see Figure 4a for an example). The rough boundary is generally advantageous to D agents [42], enabling them to invade C clusters. However, several C clusters could survive because b was not large enough. In addition, the range of global learning could have an influence here. Too small an LG (local learning) prevents an agent from obtaining enough information to learn about cooperation from many sources, and too large an LG (wide range of global learning) makes it easier for defectors to invade [39]. The narrow range of global learning could increase the C agents’ invading force and prevent the D invasion. As a result, the C and D agents’ invading forces were balanced, and they coexisted along the rough boundary where the two camps kept invading each other’s cluster (as shown in Figure 4a).
However, the balance could be broken and the evolution ended with a C- or D-dominant state in other parameter settings. For example, a large ρ could lead the evolution toward the C-dominant state, because combining many CF agents and a few PO agents could strengthen the C agents’ invading force [13], as discussed above. In contrast, a large b or a large r could lead the evolution toward the D-dominant state, because these two factors are advantageous to D agents and could strengthen their invading force. Examples of these procedures are depicted in Figure 4b–d. When ρ was large (but b was still small), D clusters were destroyed by C agents, and evolution was toward the C-dominant state (see Figure 4b for an example). Notably, however, the D agents survived by scattering. This survival was possible because a PO-D agent could stay in the sea of CF-C agents: the PO-D agent in the center obtained a high payoff by exploiting neighboring CF-C agents, but the surrounding CF-C agents conformed to the majority and remained with the same strategy. This was also the case in the drift toward the C-dominant state when both b and ρ were large (see Figure 4d for an example). D agents were scattered after the invasion of C agents, but scattering took longer due to the large b that made the D agents’ defending force stronger compared to in Figure 4b. An example of a drift toward the D-dominant state under the condition of a large ρ and an intermediate b and r is presented in Figure 4c. The intermediate b and r could have a weak favoring power to D agents separately, but their joint force could win over the force of a large ρ that could favor C agents, and C clusters died out.

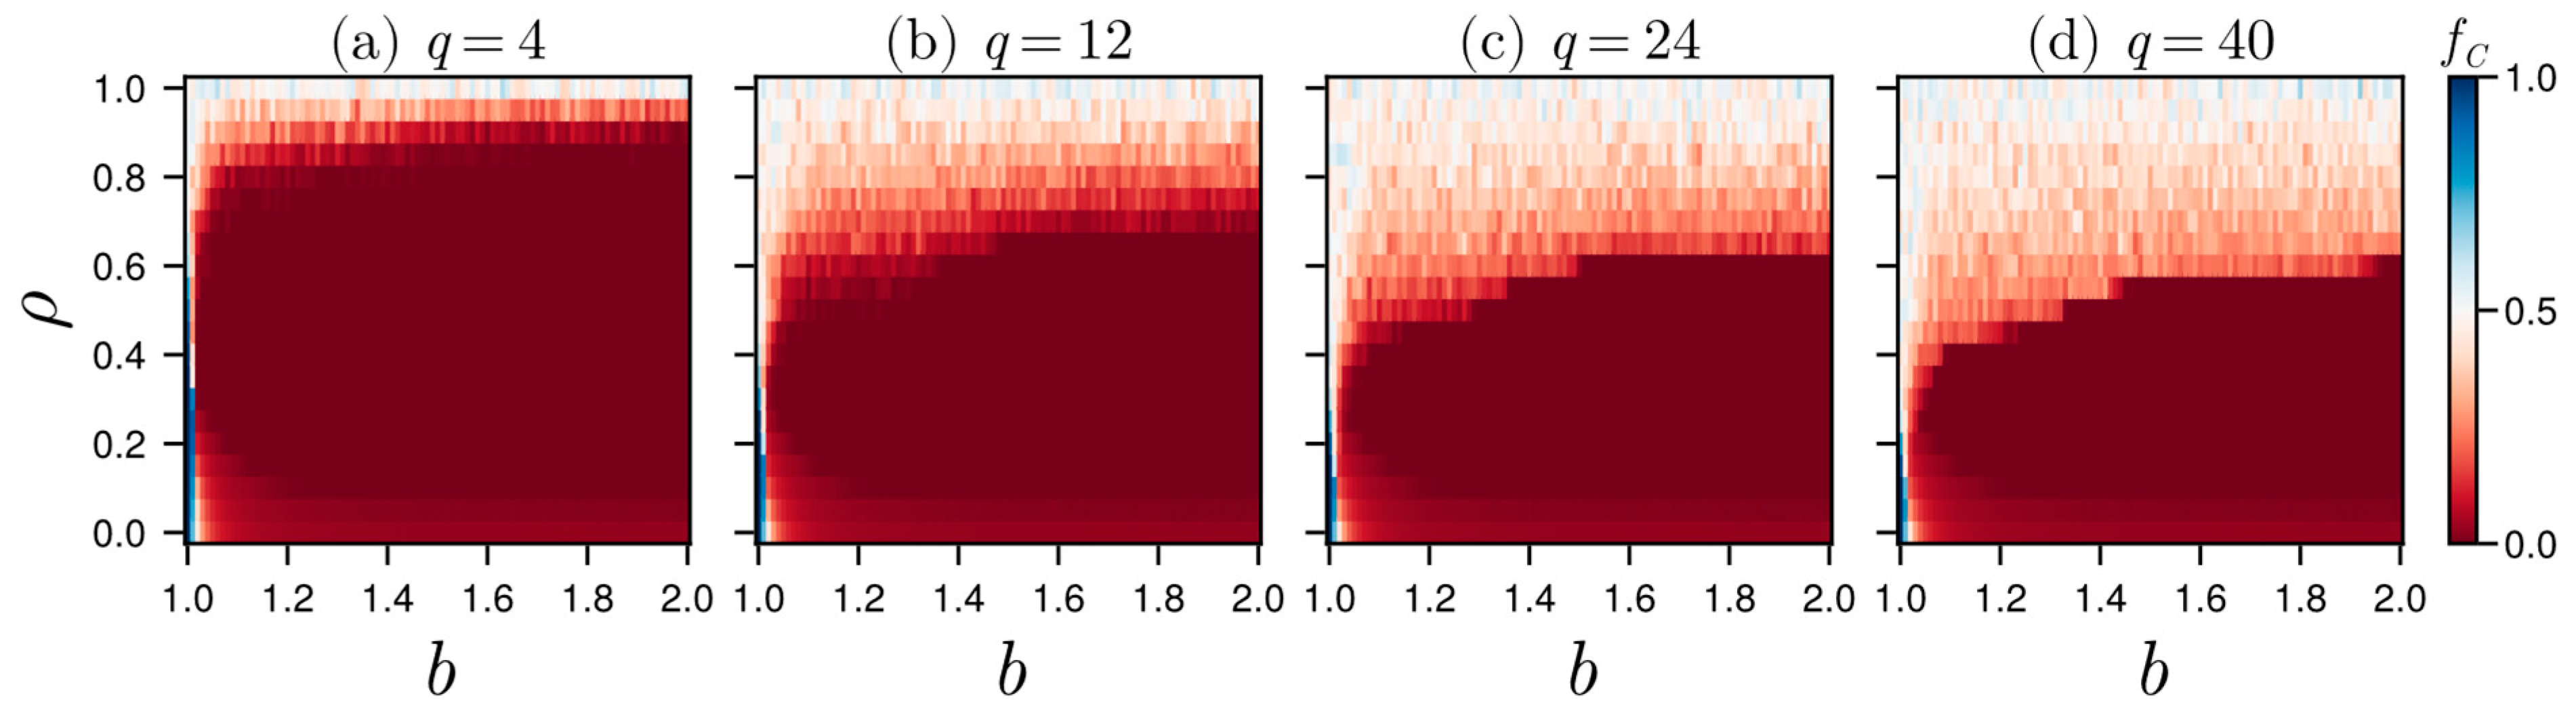
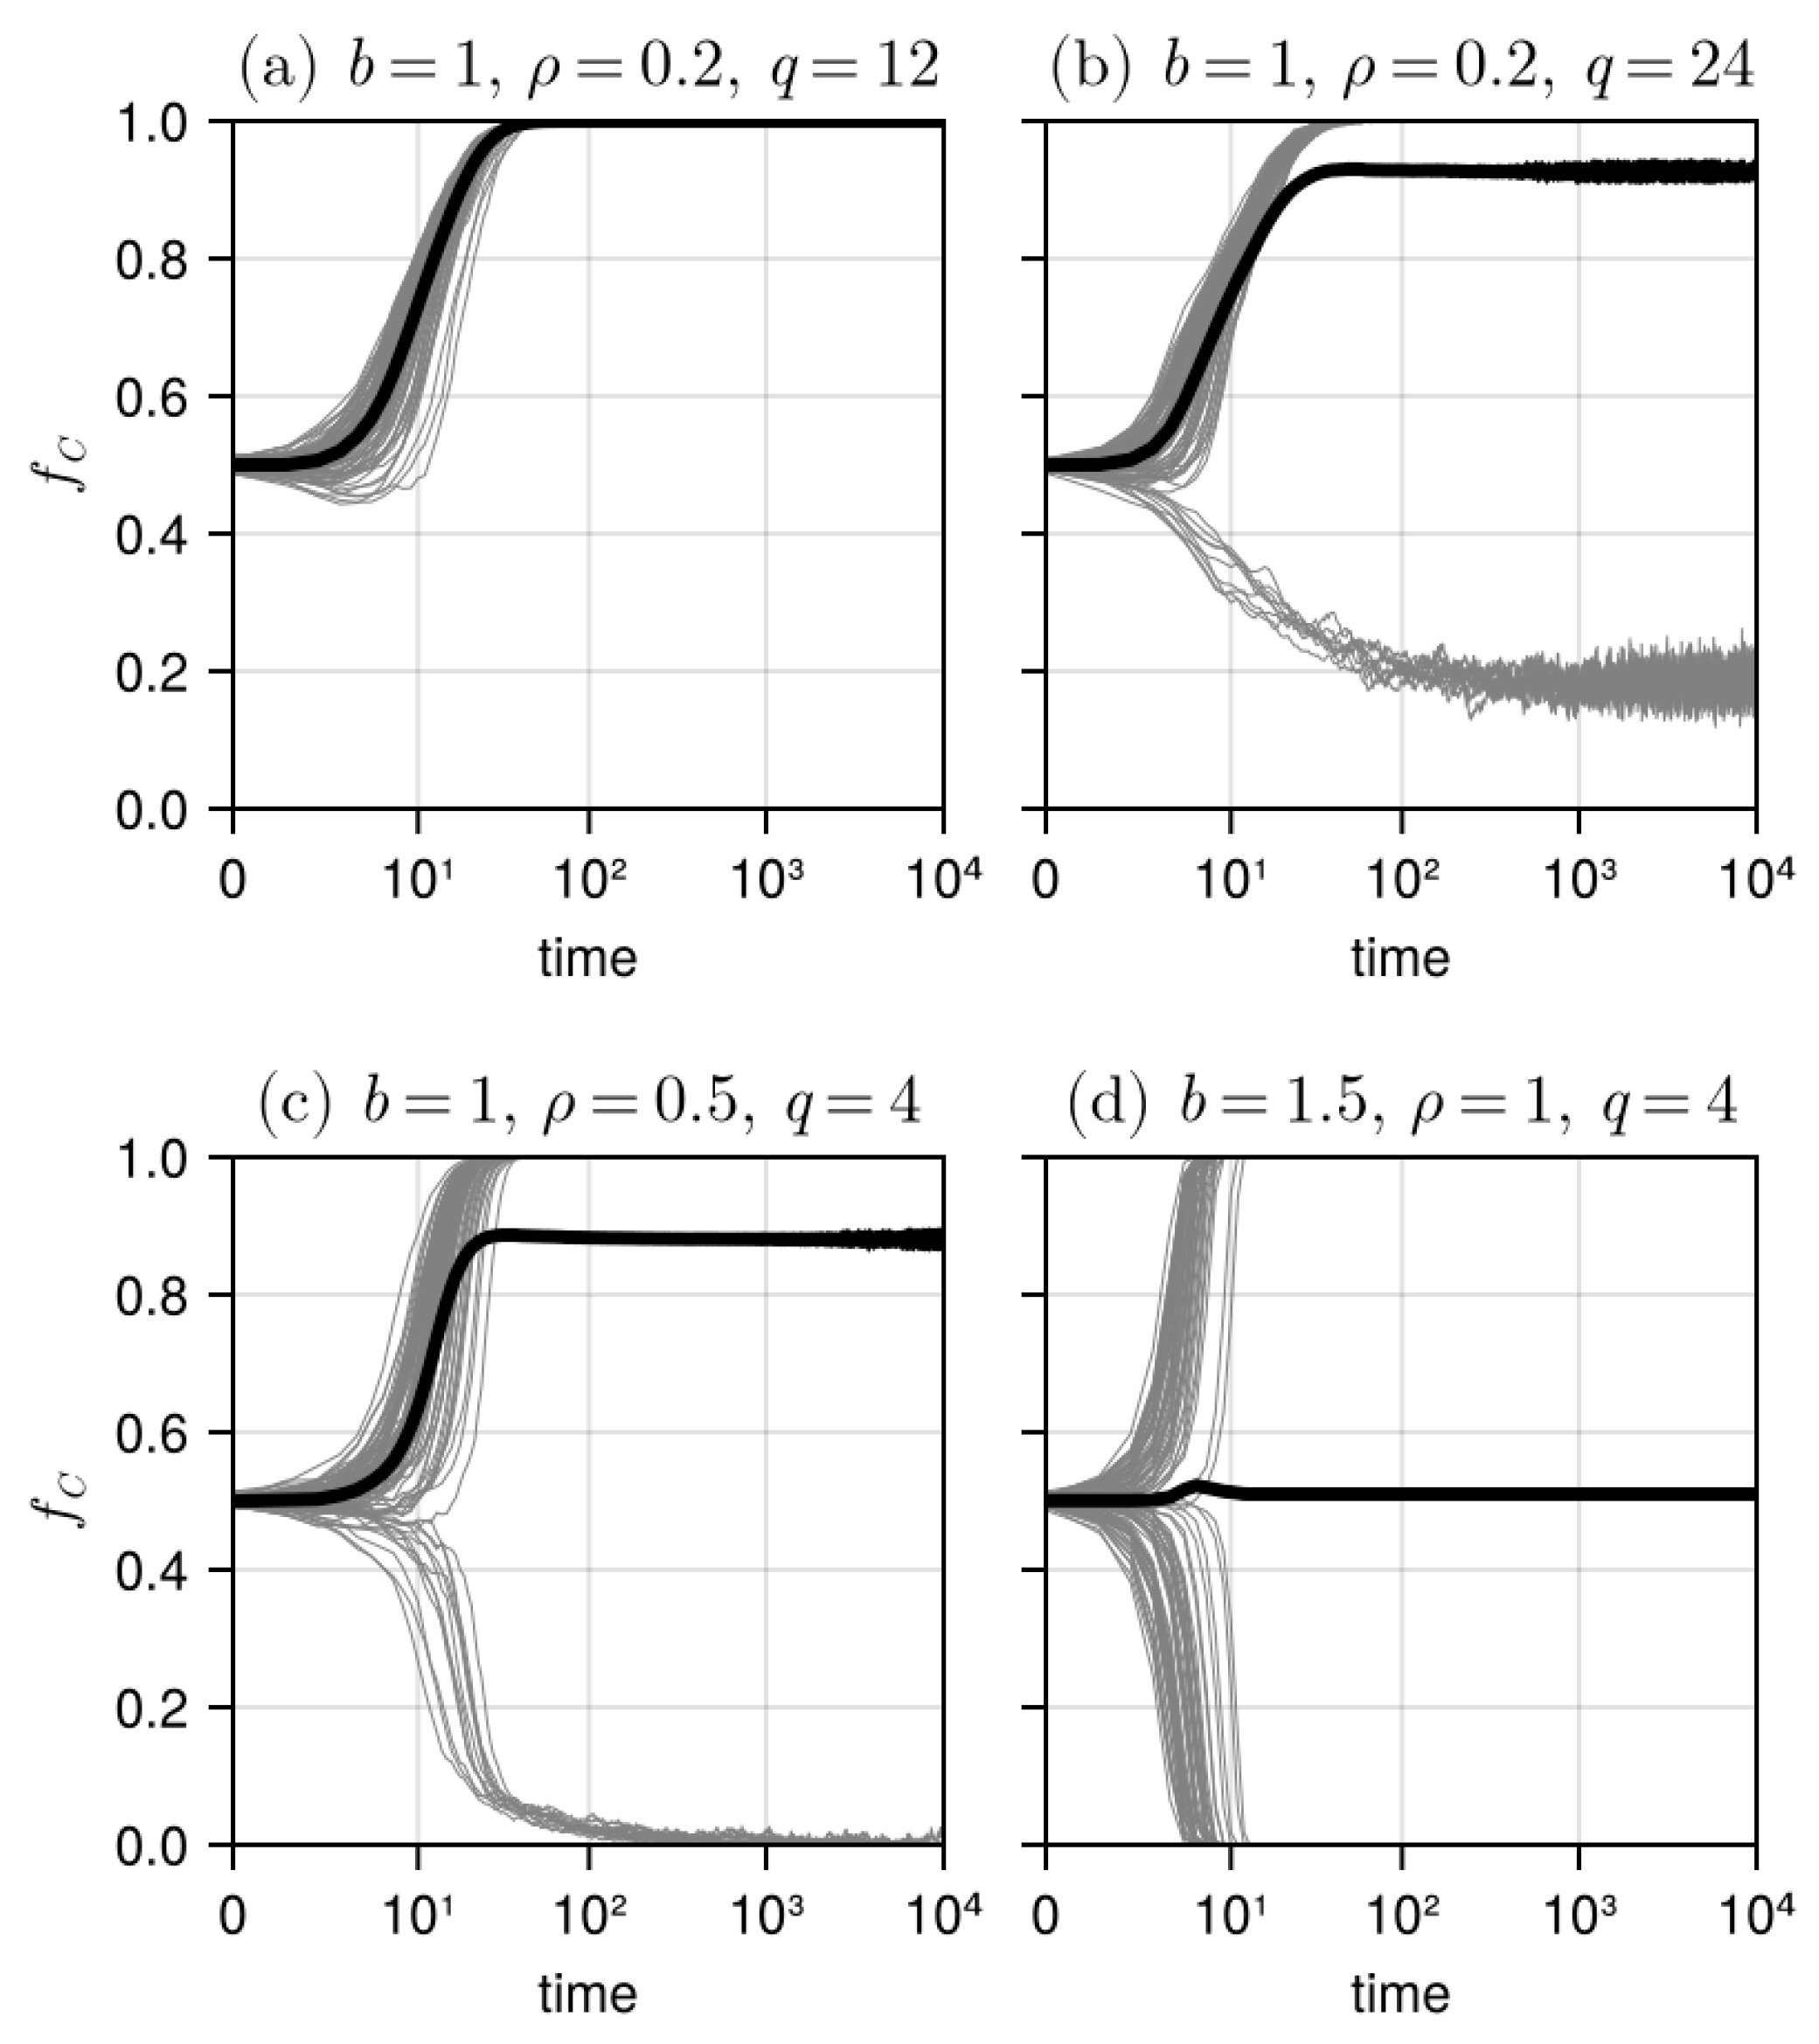
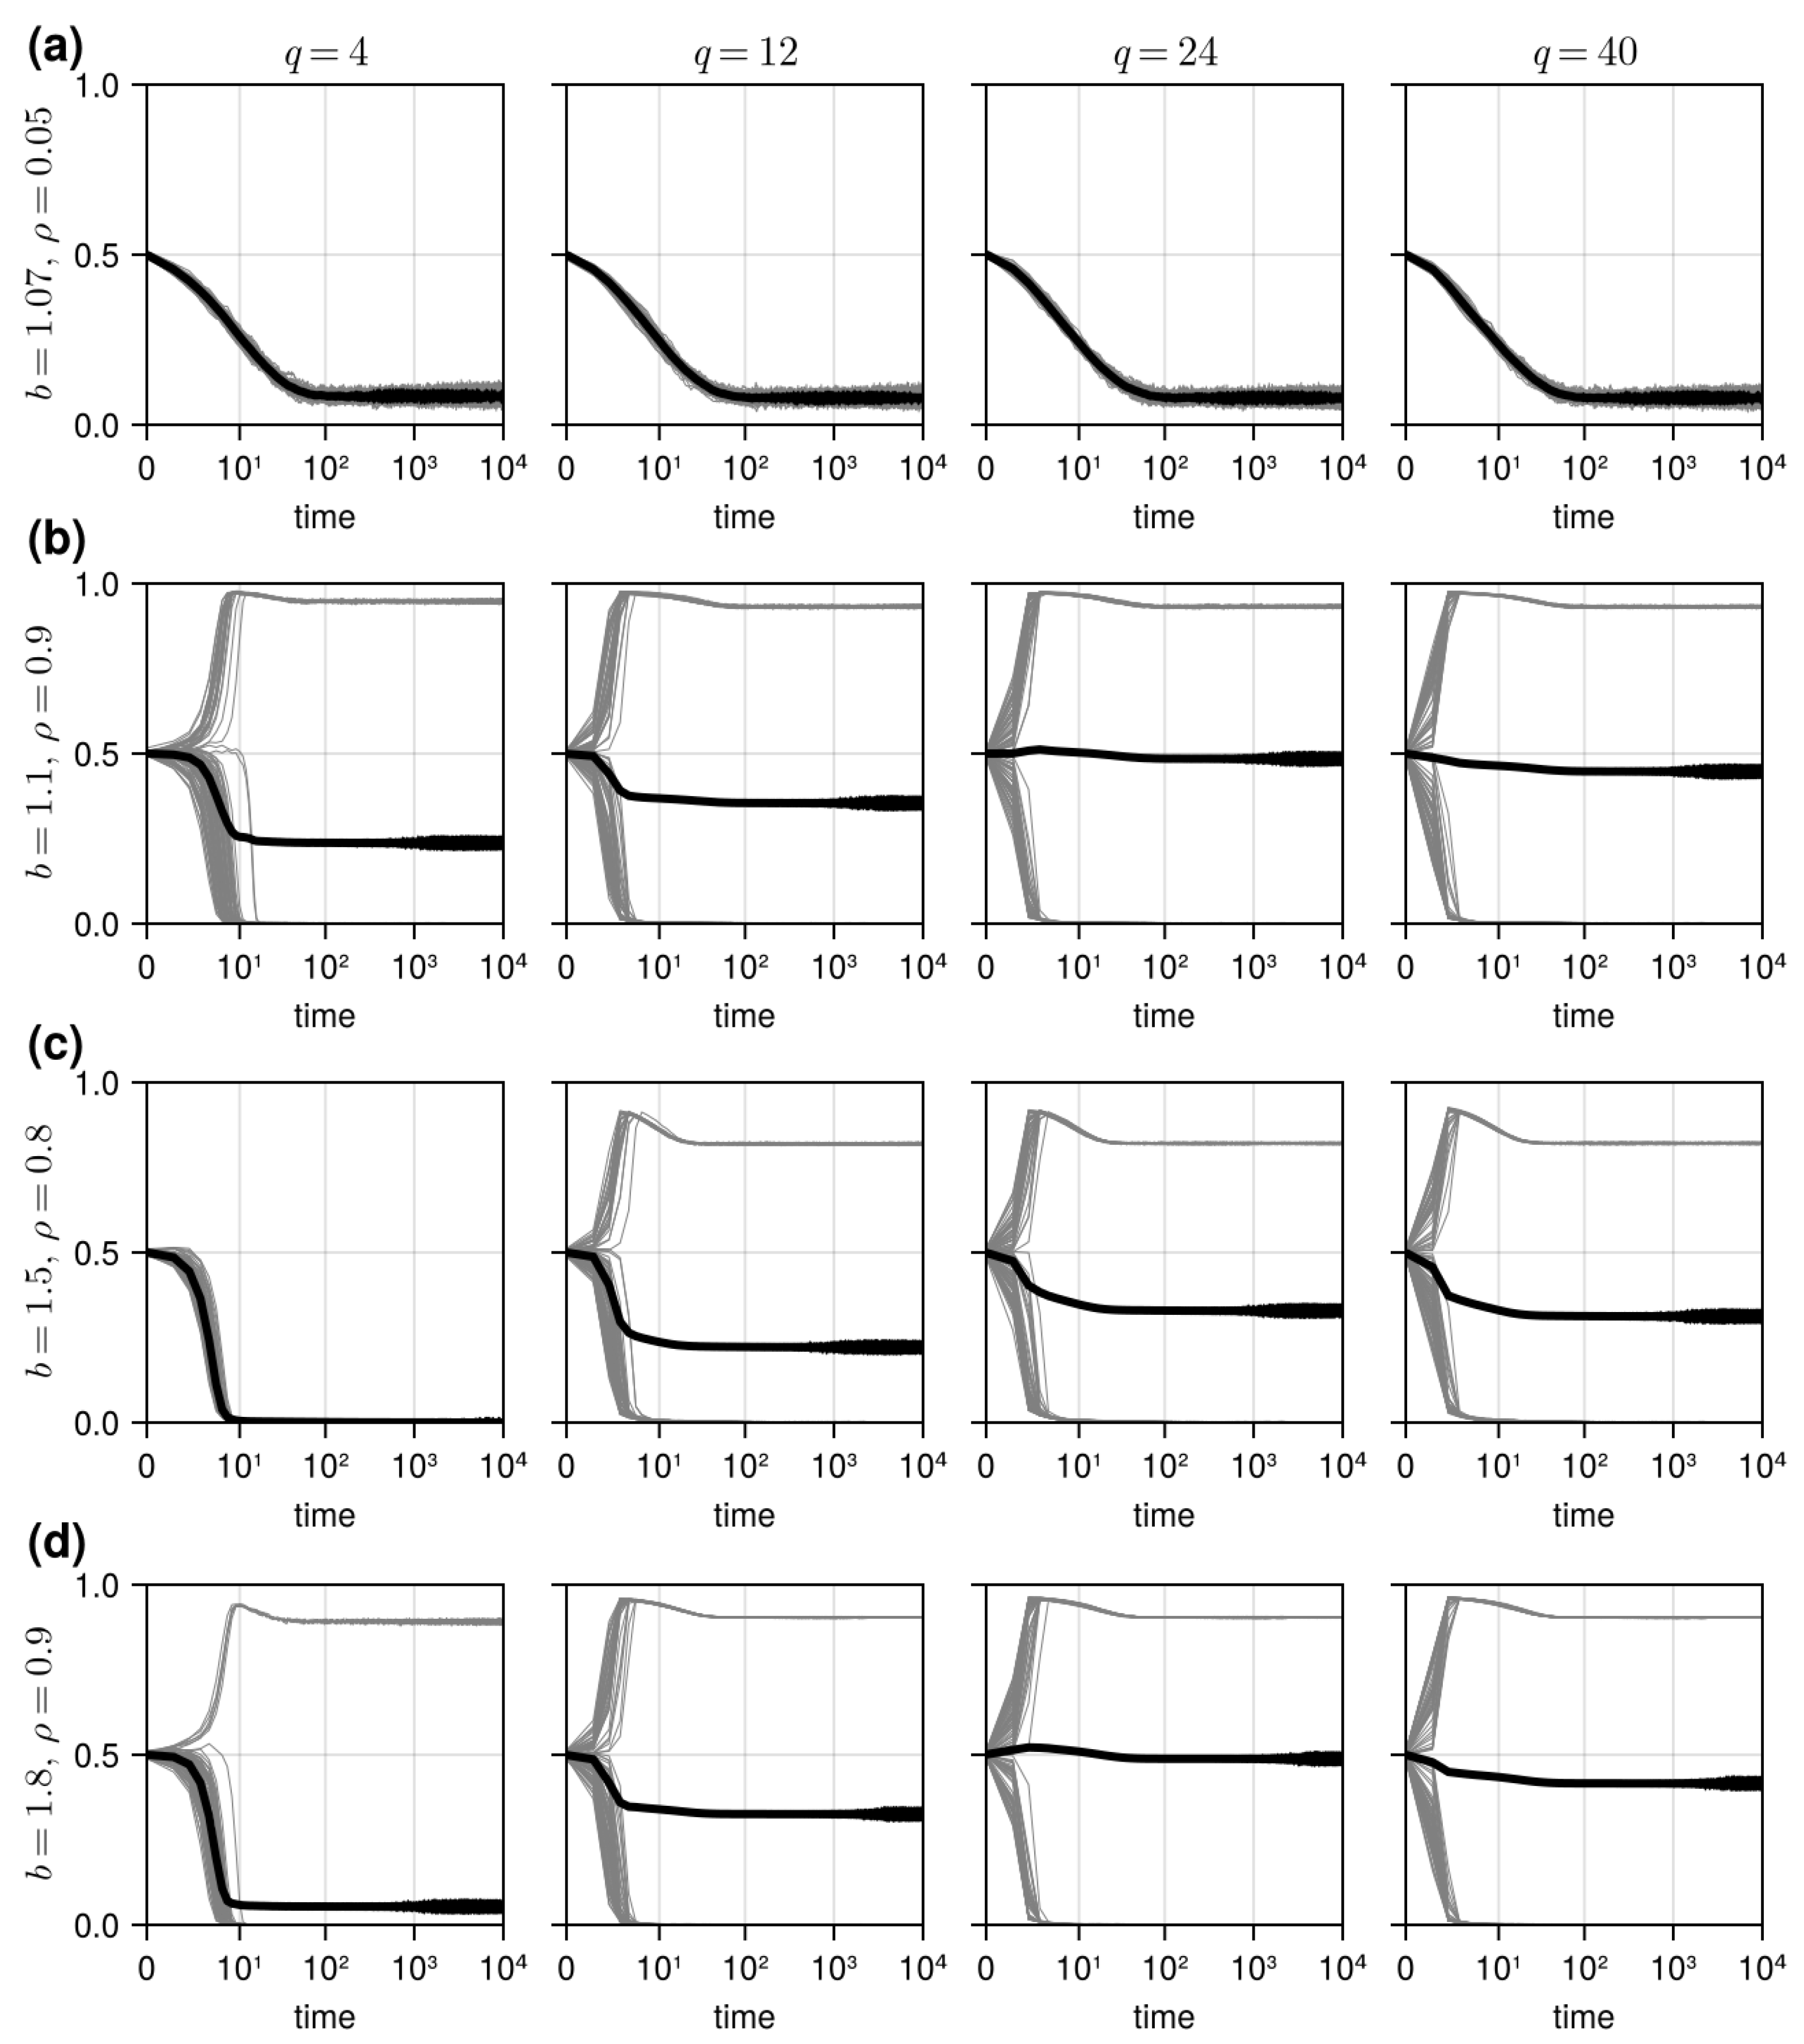
3.2. Results in Random Sampling Model

Figure 5 shows the f C in equilibrium states in the RSP. The figure shows that, on average, no parameter region led the evolution toward the C-dominant state in the RSP (except when b = 1); learning via random sampling from the entire population was not a behavior that could promise the evolution of cooperation. However, as q increased, the parameter regions that led the evolution toward the D-dominant state shrank. Previous studies suggest that random sampling that is not too small and not too large enhances cooperation [25]. Inconsistent with those studies, global learning from more random samples could only resist defectors’ dominance on average, not enhance cooperation. In addition, the figure illustrates that f C did not depend on b as much as it did in the NHD. Notably, when ρ was very small (⪅0.1), f C did not go to zero and a small fraction of cooperators survived. In particular, when b was small (⪅1.2), cooperators survived under the slightly increased ρ (≈0.2) condition. It will be addressed further below how this survival was possible.
The cases with the lowest b and the highest ρ in the RSP are examined. When b = 1, the population evolved toward the all-C state when ρ and q were both small (see Figure 6a for an example). This was due to spatial reciprocity, as in the NHD. However, unlike in the NHD, random drifts occurred when ρ and/or q increased; increased q (see Figure 6b for an example) and increased ρ (see Figure 6c for an example) both led the system to drift toward either the C- or D-dominant states. Because random sampling did not consider the population’s spatial structure, more conformists and their larger samples caused random drifts, and the coexistence of C and D agents in separated regions (as in the NHD) was rare. Naturally, when ρ = 1, the system drifted toward either the all-C or all-D state with (almost) equal probability, and the average f C became approximately 0.5 (see Figure 6d for an example). In this case, the convergence speed was very fast. It is known that a faster learning speed compared to the interaction speed can cause the spread of defection [25]. Thus, the agents’ disregard of the spatial structure would have expedited learning speed, as in a well-mixed population, and just slight random dominance of C or D at the early phase was amplified by the conformists.
Figure 7 presents the typical dynamics of f C in the characteristic parameter settings. When b and ρ were both small, the system evolved to the D-dominant state, and q rarely influenced the dynamics (see Figure 7a for an example). The samples size had little influence because there were few conformists and the agents did not consider the population’s spatial structure. However, when ρ became large (and b was still small), random drifts toward either the C- or D-dominant state occurred (see Figure 7b for an example). The large fraction of CF agents led the evolution to drift, because CF agents followed the majority among the samples randomly drawn from the population. Additionally, as q increased, the drifts became more equally probable toward the C- and D-dominant states and the average f C became closer to 0.5. It was because more samples would reflect more accurately the simulation runs’ initial population structure in which the C and D agents’ fractions were similar. When b became larger, the small q (= 4) could or could not generate random drifts (see Figure 7d for an example of the former and 7c for the latter). However, the increased q made the drifts closer to being equally probable toward the C- and D-dominant states and the average f C became closer to 0.5, as in Figure 7b. In summary, in the RSP where agents did not consider the population’s spatial structure, a large fraction of conformists and their large samples for global learning resulted in random drifts toward either the C- or D-dominant states with equal probability.
The micro mechanisms that generated the above dynamics were examined. When b and ρ were both small, the system evolved toward the D-dominant state, but a small number of C agents survived (see Figure 8a for an example). D became dominant due to b > 1, but C agents could survive because they did not need to form a cluster to survive due to global learning. D agents in a D-D interaction obtained the same amount of payoff (P = 0) as C agents in a D-C interaction (S = 0). Thus, a PO-D agent surrounded by other D agents could adopt the strategy of a C agent surrounded by D agents, if the latter was selected as a learning reference by the former, with a 0.5 probability determined by Equation (2).
In contrast, a small number of D agents could survive when the system drifted toward the C-dominant state. This phenomenon was observed under various parameter conditions (see Figure 8b for an example when ρ was large and b was small). It was because of the same mechanism in the NHD (shown in Figure 4b): a PO-D agent surrounded by CF-C agents obtained a high payoff while the surrounding CF-C agents kept their strategy by conforming to the majority. While D clusters could be formed occasionally (i.e., time = 4) due to b > 1, they soon resolved due to the global learning that could influence beyond the cluster boundary. The difference from the NHD is that the speed of domination was much faster in the RSP: random sampling made agents disregard the spatial distribution of strategies and accelerated the convergence as in a well-mixed population. The above mechanism operated the same when ρ and b were both large (see Figure 8d for an example): almost all PO agents turned into D and survived in the sea of C agents.
The speed of domination was also fast when the system drifted toward the D-dominant state (see Figure 8c for an example). C agents could neither form a cluster nor invade D clusters, and they died out quickly. This behavior was typical under many parameter conditions in which random drifts toward the D-dominant state occurred.

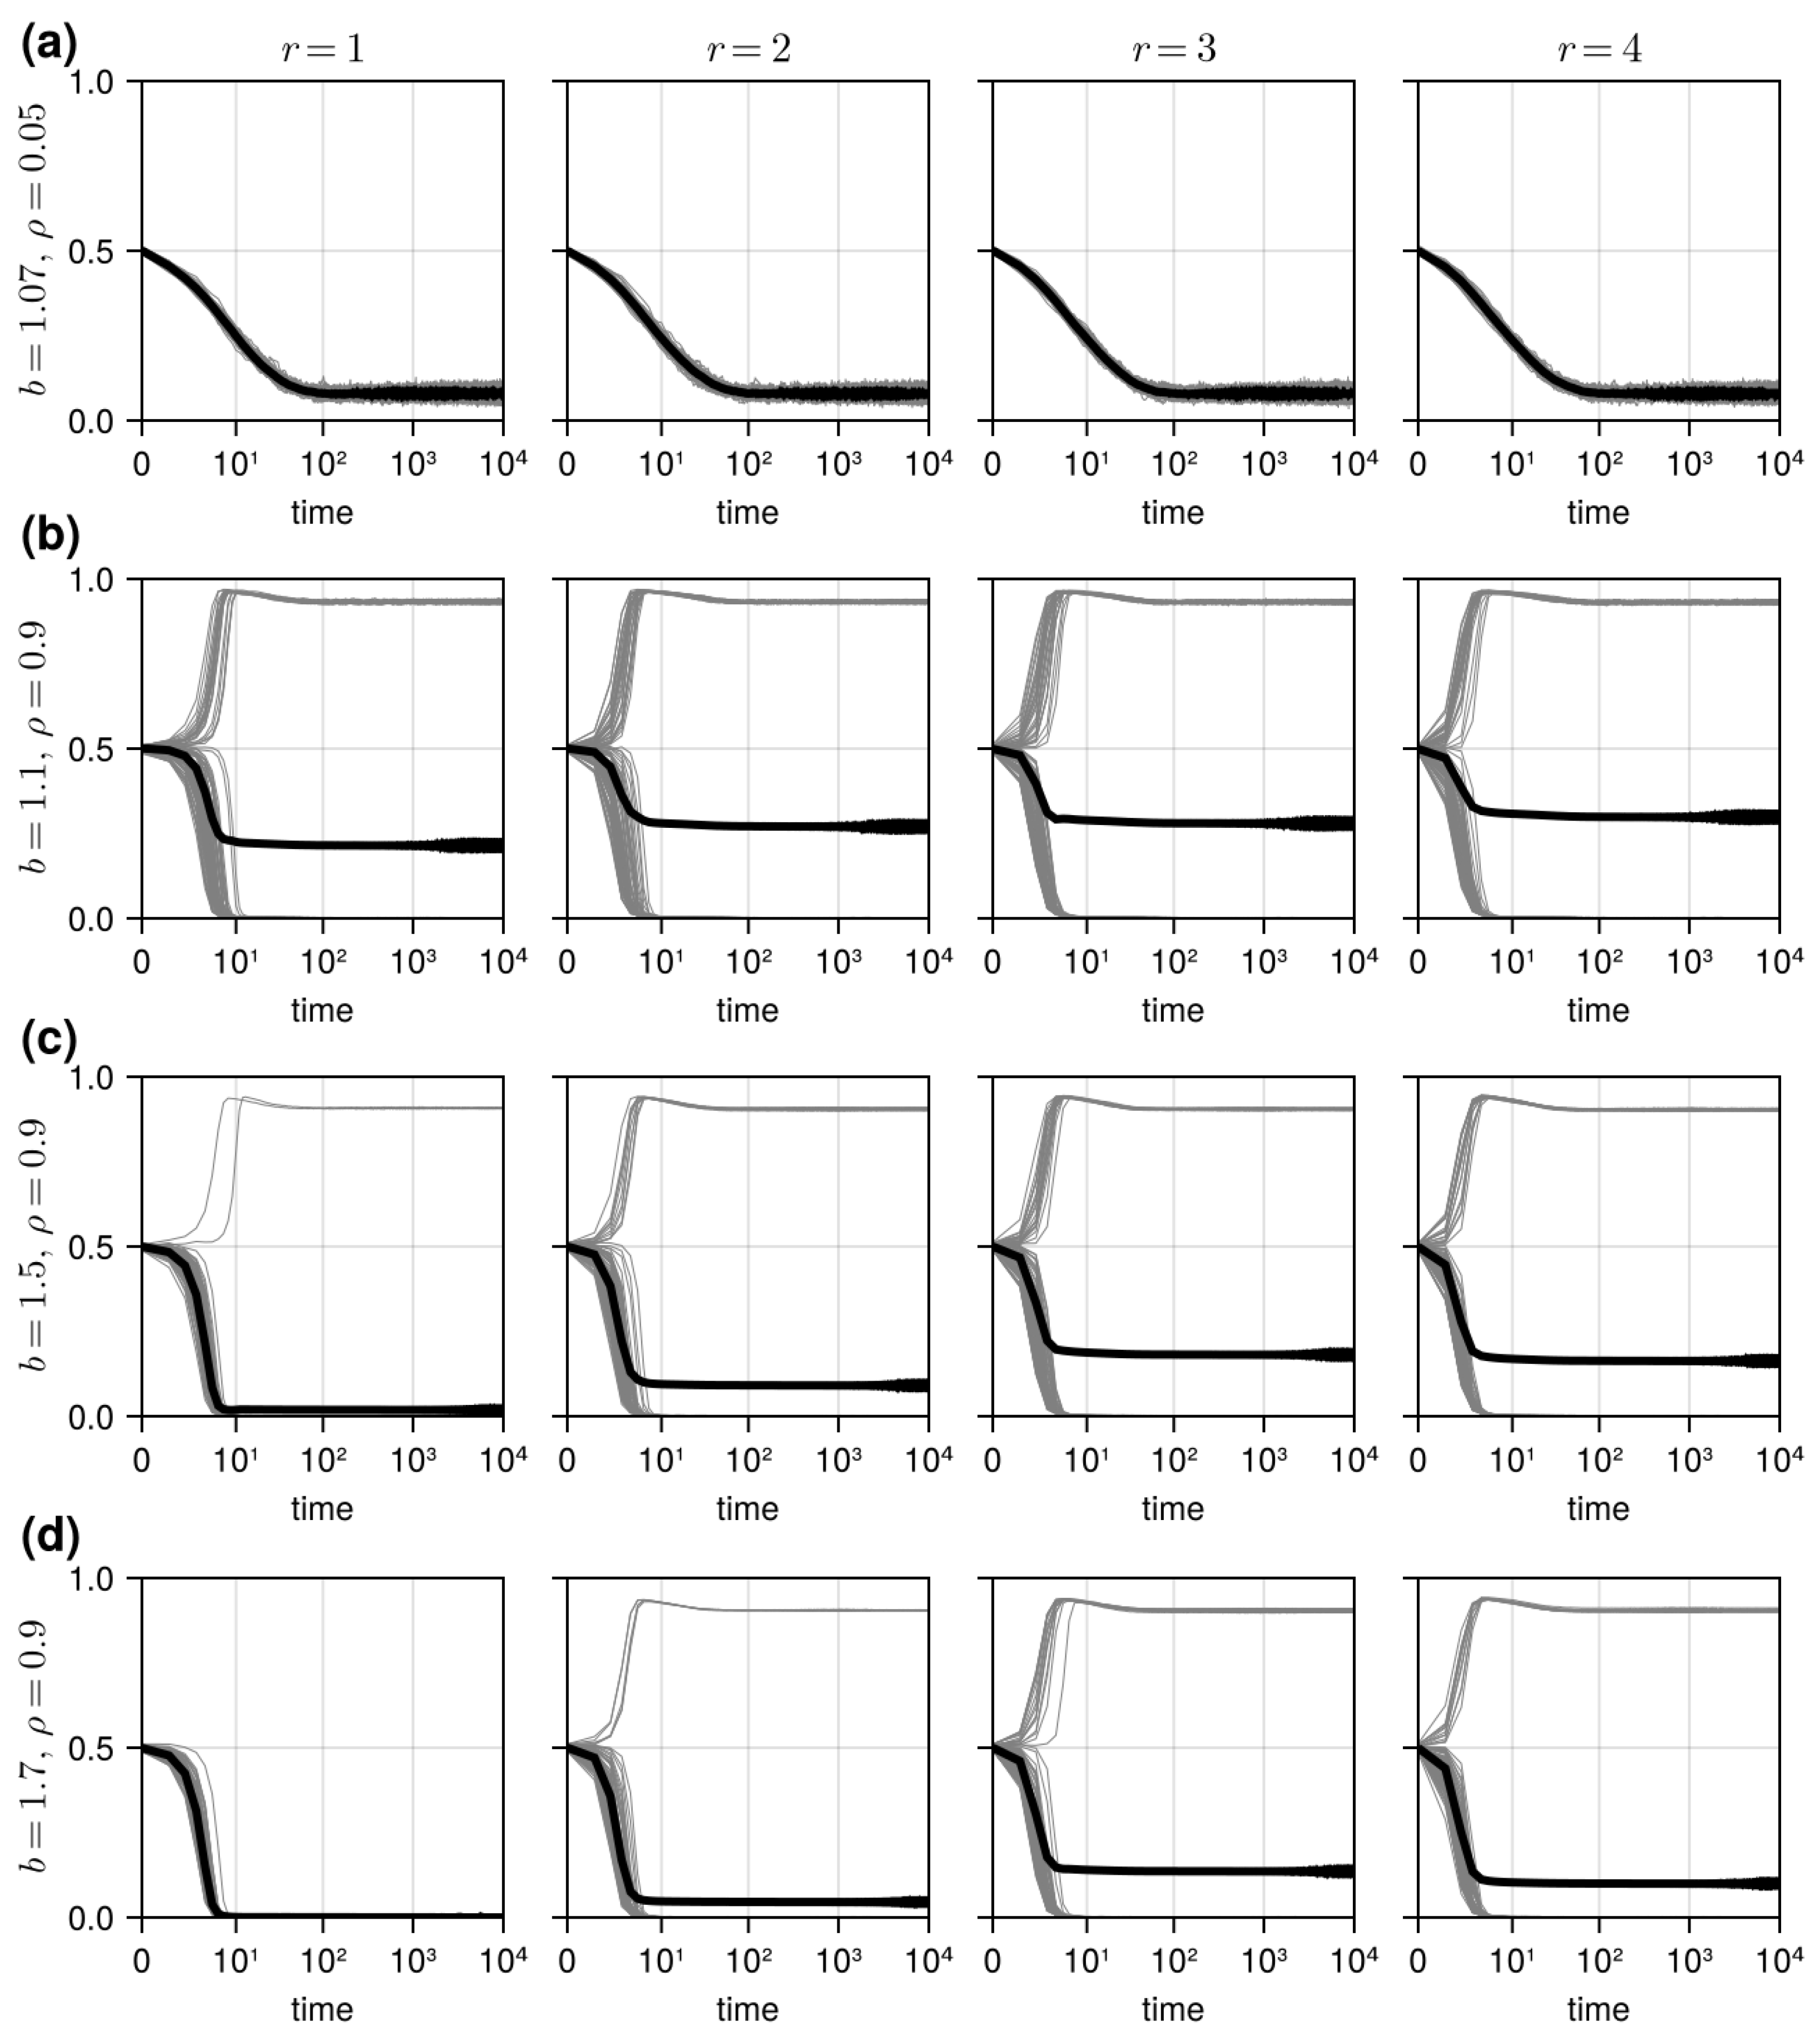
3.3. Results in Reference Neighborhood Model

The f C in equilibrium states in the RND is illustrated in Figure 9. It shows that, on average, the system evolved to the D-dominant state in almost all parameter regions (except b =1 and ρ = 1), and this was the case under all r conditions. Moreover, the RND in all r values showed similar results to the RSP with q = 4 (Figure 5a). This similarity suggests that drawing many references from a limited range of diversity is not a viable way to enhance cooperation, just as drawing a small number of learning references randomly from the population is not. In other words, referring to more diverse sources is more important than referring to a larger number of sources that are similar [44]. Meanwhile, Figure 9 also shows that f C was not highly dependent on b, just as it was not in the RSP. Also common with the RSP is that the small fraction of cooperators survived when ρ was very small (⪅0.1), and they survived under slightly increased ρ conditions (≈0.2) when b was small (⪅1.2).
The RND showed almost the same dynamics as the RSP in the lowest b and highest ρ cases. When b = 1, the system evolved toward the all-C state when ρ and r were both small (see Figure 10a for an example). Moreover, an increased r (see Figure 10b for an example) and an increased ρ (see Figure 10c for an example) led the system to drift toward either the C- or D-dominant state, as in the RSP. The spatial reciprocity that enabled C and D agents’ coexistence in the NHD was not established in the RND. This was because a learning reference was selected without considering the spatial structure as in the RSP, while the reference’s conformity to its neighbors was considered. Turning to when ρ = 1, the system drifted toward either the all-C or all-D state with (almost) equal probability and the average f C became approximately 0.5 (see Figure 10d for an example). As in the RSP, the convergence speed was also very fast. In summary, the difference between the RND and RSP, how the strategy adoption probability was calculated, had a negligible effect on the dynamics when b = 1 and ρ = 1.
Figure 11 presents the typical dynamics of f C in characteristic parameter settings. When b and ρ were both small, the system evolved to the D-dominant state, and r rarely influenced the dynamics (see Figure 11a for an example). When agents selected a learning reference, they did not consider the population’s spatial structure, and thus spatial reciprocity was not established. For the same reason, the influence of r on the average dynamics of f C was not dramatic under increased ρ conditions (as in Figure 11b–d). Instead, increased ρ tended to cause random drifts toward either the C- or D-dominant states, as in the RSP. Unlike in the RSP, however, the drifts did not become equally probable toward the C- or D-dominant state as r increased. The drifts were more probable toward the D-dominant state, so the average f C was always below 0.5. This result demonstrates that when the population had many conformists, it was worse for the average level of cooperation to select a single reference and adopt its strategy based on its local majority than to select multiple references and follow the majority. This comparison highlights the importance of references’ diversity: diverse sources could at least alleviate the defection, although they could not enhance cooperation. Figure 11 also shows that the average f C decreased further as b increased. It is straightforward that the large benefit for D agents made the random drifts more biased toward the D-dominant state.
In general, the RND showed similar phenomena to the RSP in how the spatial distribution of strategy changed over time. The first typical phenomenon was that a small number of C agents survived in the population of D agents (see Figure 12a for an example). This phenomenon mainly occurred when b and ρ were both small. As discussed above, C agents surrounded by D agents could be imitated by PO-D agents surrounded by other D agents via global learning (if the latter selected the former as a learning reference) because they obtained the same amount of payoff (P = S = 0), and the probability of adoption was 0.5, as determined by Equation (2). Conversely, a small number of D agents survived in the sea of C agents (see Figure 12b for an example). This phenomenon was typical when the random drift was geared toward the C-dominant state under the various conditions of b, ρ , and r. A PO-D agent surrounded by CF-C agents obtained large payoffs and the surrounding CF-C agents followed the majority; thus, both of them tended to remain the same. D clusters were formed occasionally (e.g., time = 4) but soon resolved through the random selection of learning references. The final typical phenomenon was the extinction of the C strategy (see Figure 12c,d for examples). This phenomenon was the consequence of the random drift toward the D-dominant state under the various conditions of b, ρ , and r. The extinction speed was slightly different due to b (as in Figure 12c,d), but it was common that C agents could neither form a cluster nor invade D clusters and died out quickly.

3.4. Statistical Analysis of Simulation Results

In addition to the graphical analysis above, a statistical analysis was performed to examine how f C depended on the model and parameter values. Table 3 presents the result of the multiple regression analysis. It shows that f C decreased in the RSP and RND compared to the NHD; cooperation evolved more in the NHD than in the other models. It also demonstrates that f C decreased as r (or q) and b increased: the more learning references and the larger benefit for defectors were unfavorable for the evolution of cooperation. In contrast, f C increased as ρ increased: the larger fraction of conformists promoted the evolution of cooperation. Overall, ρ had a larger effect on f C compared to the other parameters.

3.5. Comparing Model Results Under Equal Parameter Conditions

Figure 13 presents the model results compared under equal parameter conditions. The f C in equilibrium states are shown when (a) b and ρ were both small, (b) b was small and ρ was large, (c) b was moderate and ρ was large, and (d) b and ρ were both large in the models. The f C in the NHD depended on r when ρ was large and b was moderate or larger (Figure 13c,d). The f C in the RSP depended on q except when b and ρ were both small (Figure 13b–d). And the f C depended on r the least in the RND (Figure 13a–d). The results in the figure suggest that the influence of global learning on the evolution of cooperation depends on the conformists’ proportion and how their behaviors are incorporated in the model.

4. Conclusions

Human behavior is as influenced by psychological biases as by material incentives [5]. Among many biases, conformity has been widely studied as one of the key biases that influence cooperative behaviors in evolutionary game theory [10,11,12,13,14]. Meanwhile, individuals can obtain information about others from a wide range of sources. Thus, conformity can operate not only on a local scale but also on a global scale, where individuals conform to others located far from them. Global learning has been another strand of research [24,25,26,27], but attention has been paid only to payoff-biased learning. This study combined these two research strands to investigated the influence of conformity and global learning on the evolution of cooperation in the spatial prisoner’s dilemma game. Three agent-based models incorporating different practices of global conformity were built and analyzed. The results of the analyses suggest that global learning was generally unfavorable for cooperation in the NHD, while there existed limited parameter regions where cooperation evolved. In addition, learning via random sampling from the entire population could not guarantee the evolution of cooperation in the RSP, but global learning could resist defectors’ dominance. Additionally, referring to more diverse sources (as in the RSP) was less harmful to cooperation than referring to a larger number of sources that were similar (as in the RND). The dynamics of evolution were generated according to how the competing forces of C and D agents balanced each other. The population consisting of mostly CF with a few PO agents strengthened the force of C agents, as did the narrow range of global learning. In contrast, the large T payoff and wide range of global learning bolstered the force of D agents. The relative power of these two forces determined how agents invaded (and defended invasion by) the other camp and governed the dynamics. When one force was not strong enough to suppress the other under some parameter conditions, random drifts occurred and evolution proceeded toward either the C- or D-dominant state. Additionally, if learning references were randomly selected from the population (as in RSP), drawing more references made random drifts more equally probable toward either the C- or D-dominant state. However, this was not the case when learning references were selected from a limited population region.
This study highlights the importance of the sources from which individuals draw learning references for their behavior change. It is becoming increasingly easy for an individual to interact with and learn about others. Thus, an individual has the responsibility to select with whom to interact and from whom to learn. At the same time, it is crucial for designing communication systems that can promote or impede certain types of interaction among individuals [45,46,47]. In the real-world context, if communication systems could promote interactions among individuals far from them, cooperation at the social level would decrease. If those interactions were not diverse but limited to a particular type, defection would dominate further. In contrast, if communication systems could promote interactions among nearby individuals, it would enhance cooperation. The results of this study identify the conditions under which conformists who learn about a new strategy from a distance and from diverse sources would improve or damage cooperation in a society. They not only emphasize the significance of individuals’ psychological biases but also show that different ways of practicing those biases can generate different dynamics, leading a system to different states. Moreover, several real-world cases can be considered. First, online collaborative communities can be an example. Contributors interact around specific issues within small groups, but they can also learn globally from successful practices and norms which are spread across the entire community. Second, community-based resource management can be another example. People manage resources such as fisheries and water by interacting within local communities, but external organizations such as governments and NGOs can introduce practices that were introduced earlier in other communities. Third, industrial clusters and business ecosystems can be an example. Firms, investors, and universities in a local community interact within a region to collaborate, but new technologies and business models can be learned from other regions.
This study has limitations. Firstly, individual differences in cognition and behavior were not incorporated in the model. Studies have suggested the consistent differences among individuals in how they learn from others [48], particularly under social dilemma situations [49]. Moreover, individuals’ social identity, such as class, group affiliation, or political orientation, influences how they select their learning references [50], and this can affect the evolution of cooperation. Future studies should investigate how these individual differences influence their social learning and evolutionary dynamics. In particular, stochastic parameters during agent initialization can be used to incorporate individual differences. This would demonstrate how the stochastically initialized model would differ in terms of the generated results. Next, conditional strategies of cooperation were not introduced in the model. Although the cooperation–defection dichotomy is widely used for simplicity, individuals’ decision making about whether to cooperate or not can be context-dependent. The conditional strategies of cooperation have been examined in previous studies [51,52], and future studies that incorporate them into the model would make the generated results more valid. Thirdly, the diverse network structures in which agents interact were not considered. While the lattice is one of the most widely used spatial structures for simulating the evolution of cooperation [35], it cannot capture the heterogeneity of connections among individuals. The scale-free network [53] can be useful for this purpose because it can incorporate hubs (high-connectivity nodes) into the model and their role in information dissemination. The scale-free network was used in previous studies to investigate its impact on evolution of cooperation [54] and conformity [55]. Also, the small-world network [56] was employed for examining strategy evolution in evolutionary games [57] and differing IGs and LGs [58]. Future studies should employ heterogeneous spatial structures such as small-world and scale-free networks and examine how the structure changes the impact of conformity and global learning on the evolution of cooperation. Moreover, it can be investigated how the evolving network structure would influence agents’ conformity and global learning using dynamic networks. Finally, the simulation results were not validated against real-world datasets. The agents’ decision-making rules can be calibrated using the dataset on human behavior in evolutionary game [7,59], and/or the model outputs can be compared with experimental results [6,60]. Future research could obtain datasets on the impact of conformity and global learning on the evolution of cooperation and use them to validate the simulation results. If available, the datasets regarding online interactions among internet users and their cooperative behaviors would be particularly relevant. These validations would make the simulation results more empirically grounded.
Additionally, future research should explore other aspects of global conformity and its influence on the evolution of cooperation. For example, the cost of individual and social learning (including conformity) can be different [8]. These relative costs can change when learning becomes global, and it can be investigated how the changed costs affect the evolution of cooperation. Moreover, the range of global learning may not be static but dynamic, and an individual may employ different ranges of global learning in different time steps. As individuals can change their strategy updating rules [61], agents can adjust their range of global learning in future models. Such future studies would deepen the understanding of conformity’s role in the evolution of cooperation and, more generally, in human behavior.

Funding

This research received no external funding.

Data Availability Statement

The code for the simulation models presented in the study and the code and data for generating the figures in this paper are openly available in Open Science Framework at https://osf.io/ajt4g/?view_only=34c55d07755a4140b1a4d9b01a1fc83a.

Conflicts of Interest

The author declares no conflicts of interest.

Abbreviations

The following abbreviations are used in this manuscript:
IGInteraction Group
LGLearning Group
PDPrisoner’s Dilemma
POPayoff-Biased
CFConformity-Biased
NHDNeighborhood Model
RSPRandom Sampling Model
RNDRandom Neighborhood Model

References

  1. Ye, Y.; Zhang, R.; Zhao, Y.; Yu, Y.; Du, W.; Chen, T. A novel public opinion polarization model based on BA network. Systems 2022, 10, 46. [Google Scholar] [CrossRef]
  2. Lorenz, J.; Rauhut, H.; Schweitzer, F.; Helbing, D. How social influence can undermine the wisdom of crowd effect. Proc. Natl. Acad. Sci. USA 2011, 103, 9020–9025. [Google Scholar] [CrossRef]
  3. Hamilton, W.D. The evolution of altruistic behavior. Am. Nat. 1963, 97, 354–356. [Google Scholar] [CrossRef]
  4. Nowak, M.A. Five rules for the evolution of cooperation. Science 2006, 314, 1560–1563. [Google Scholar] [CrossRef]
  5. Fiske, S.T. Social Beings: Core Motives in Social Psychology, 3rd ed.; Wiley: Hoboken, NJ, USA, 2014. [Google Scholar]
  6. Efferson, C.; Lalive, R.; Richerson, P.J.; Mcelreath, R.; Lubell, M. Conformists and mavericks: The empirics of frequency-dependent cultural transmission. Evol. Hum. Behav. 2008, 29, 56–64. [Google Scholar] [CrossRef]
  7. Traulsen, A.; Semmann, D.; Sommerfeld, R.D.; Krambeck, H.J.; Milinski, M. Human strategy updating in evolutionary games. Proc. Natl. Acad. Sci. USA 2010, 107, 2962–2966. [Google Scholar] [CrossRef]
  8. Boyd, R.; Richerson, P.J. Culture and the Evolutionary Process; University of Chicago Press: Chicago, IL, USA, 1985. [Google Scholar]
  9. Bernheim, B.D. A theory of conformity. J. Political Econ. 1994, 102, 841–877. [Google Scholar] [CrossRef]
  10. Cui, P.-B.; Wu, Z.-X. Impact of conformity on the evolution of cooperation in the prisoner’s dilemma game. Phys. A Stat. Mech. Appl. 2013, 392, 1500–1509. [Google Scholar] [CrossRef]
  11. Habib, A.; Tanaka, M.; Tanimoto, J. How does conformity promote the enhancement of cooperation in the network reciprocity in spatial prisoner’s dilemma games? Chaos Solitons Fractals 2020, 138, 109997. [Google Scholar] [CrossRef]
  12. Hu, K.; Guo, H.; Geng, Y.; Shi, L. The effect of conformity on the evolution of cooperation in multigame. Phys. A Stat. Mech. Appl. 2019, 516, 267–272. [Google Scholar] [CrossRef]
  13. Szolnoki, A.; Perc, M. Conformity enhances network reciprocity in evolutionary social dilemmas. J. R. Soc. Interface 2015, 12, 20141299. [Google Scholar] [CrossRef]
  14. Yang, H.-X.; Tian, L. Enhancement of cooperation through conformity-driven reproductive ability. Chaos Solitons Fractals 2017, 103, 159–162. [Google Scholar] [CrossRef]
  15. Szolnoki, A.; Wang, Z.; Perc, M. Wisdom of groups promotes cooperation in evolutionary social dilemmas. Sci. Rep. 2012, 2, 576. [Google Scholar] [CrossRef]
  16. Maynard Smith, J. Evolution and the Theory of Games; Cambridge University Press: Cambridge, UK, 1982. [Google Scholar]
  17. Weibull, J.W. Evolutionary Game Theory; The MIT Press: Cambridge, MA, USA, 1997. [Google Scholar]
  18. Xu, B.; Wang, J.; Zhang, X. Conformity-based cooperation in online social networks: The effect of heterogeneous social influence. Chaos Solitons Fractals 2015, 81, 78–82. [Google Scholar] [CrossRef]
  19. Lin, J.; Huang, C.; Dai, Q.; Yang, J. Evolutionary game dynamics of combining the payoff-driven and conformity-driven update rules. Chaos Solitons Fractals 2020, 140, 110146. [Google Scholar] [CrossRef]
  20. Huang, C.; Li, Y.; Jiang, L. Dual effects of conformity on the evolution of cooperation in social dilemmas. Phys. Rev. E 2023, 108, 024123. [Google Scholar] [CrossRef]
  21. Szolnoki, A.; Perc, M. Leaders should not be conformists in evolutionary social dilemmas. Sci. Rep. 2016, 6, 23633. [Google Scholar] [CrossRef]
  22. Niu, Z.; Xu, J.; Dai, D.; Liang, T.; Mao, D.; Zhao, D. Rational conformity behavior can promote cooperation in the prisoner’s dilemma game. Chaos Solitons Fractals 2018, 112, 92–96. [Google Scholar] [CrossRef]
  23. Liu, X.; Huang, C.; Dai, Q.; Yang, J. The effects of the conformity threshold on cooperation in spatial prisoner’s dilemma games. EPL 2019, 128, 18001. [Google Scholar] [CrossRef]
  24. Zhang, J.; Zhang, C.; Chu, T.; Weissing, F.J. Cooperation in networks where the learning environment differs from the interaction environment. PLoS ONE 2014, 9, e90288. [Google Scholar] [CrossRef] [PubMed]
  25. Shigaki, K.; Tanimoto, J.; Wang, Z.; Kokubo, S.; Hagishima, A.; Ikegaya, N. Referring to the social performance promotes cooperation in spatial prisoner’s dilemma games. Phys. Rev. E 2012, 86, 031141. [Google Scholar] [CrossRef] [PubMed]
  26. Choi, J.-K. Play locally, learn globally: Group selection and structural basis of cooperation. J. Bioecon. 2008, 10, 239–257. [Google Scholar] [CrossRef]
  27. Ohtsuki, H.; Nowak, M.A.; Pacheco, J.M. Breaking the symmetry between interaction and replacement in evolutionary dynamics on graphs. Phys. Rev. Lett. 2007, 98, 108106. [Google Scholar] [CrossRef] [PubMed]
  28. Deutsch, M.; Gerard, H.B. A study of normative and informational social influences upon individual judgment. J. Abnorm. Soc. Psychol. 1955, 51, 629–636. [Google Scholar] [CrossRef] [PubMed]
  29. Claidière, N.; Whiten, A. Integrating the study of conformity and culture in humans and nonhuman animals. Psychol. Bull. 2012, 138, 126–145. [Google Scholar] [CrossRef]
  30. Wu, Z.-X.; Wang, Y.-H. Cooperation enhanced by the difference between interaction and learning neighborhoods for evolutionary spatial prisoner’s dilemma games. Phys. Rev. E 2007, 75, 041114. [Google Scholar] [CrossRef]
  31. Suzuki, R.; Arita, T. Evolution of cooperation on different combinations of interaction and replacement networks with various intensity of selection. Int. J. Bio-Inspired Comput. 2011, 3, 151–158. [Google Scholar] [CrossRef]
  32. Mengel, F. Conformism and cooperation in a local interaction model. J. Evol. Econ. 2009, 19, 397–415. [Google Scholar] [CrossRef]
  33. Wang, Z.; Wang, L.; Perc, M. Degree mixing in multilayer networks impedes the evolution of cooperation. Phys. Rev. E 2014, 89, 052813. [Google Scholar] [CrossRef]
  34. Ohtsuki, H.; Pacheco, J.M.; Nowak, M.A. Evolutionary graph theory: Breaking the symmetry between interaction and replacement. J. Theor. Biol. 2007, 246, 681–694. [Google Scholar] [CrossRef]
  35. Szabó, G.; Tőke, C. Evolutionary prisoner’s dilemma game on a square lattice. Phys. Rev. E 1998, 58, 69–73. [Google Scholar] [CrossRef]
  36. Perc, M.; Szolnoki, A. Coevolutionary games—A mini review. Biosystems 2010, 99, 109–125. [Google Scholar] [CrossRef] [PubMed]
  37. Szabó, G.; Fáth, G. Evolutionary games on graphs. Phys. Rep. 2007, 446, 97–216. [Google Scholar] [CrossRef]
  38. Nowak, M.A.; May, R.M. Evolutionary games and spatial chaos. Nature 1992, 359, 826–829. [Google Scholar] [CrossRef]
  39. Xia, C.; Miao, Q.; Zhang, J. Impact of neighborhood separation on the spatial reciprocity in the prisoner’s dilemma game. Chaos Solitons Fractals 2013, 51, 22–30. [Google Scholar] [CrossRef]
  40. Datseris, G.; Vahdati, A.R.; DuBois, T.C. Agents.jl: A performant and feature-full agent-based modeling software of minimal code complexity. Simulation 2024, 100, 1019–1031. [Google Scholar] [CrossRef]
  41. Huang, C.; Han, W.; Li, H.; Cheng, H.; Dai, Q.; Yang, J. Public cooperation in two-layer networks with asymmetric interaction and learning environments. Appl. Math. Comput. 2019, 340, 305–313. [Google Scholar] [CrossRef]
  42. Wang, Z.; Kokubo, S.; Tanimoto, J.; Fukuda, E.; Shigaki, K. Insight into the so-called spatial reciprocity. Phys. Rev. E 2013, 88, 315–318. [Google Scholar] [CrossRef]
  43. Rendell, L.; Fogarty, L.; Laland, K.N. Rogers’ paradox recast and resolved: Population structure and the evolution of social learning strategies. Evolution 2010, 64, 534–548. [Google Scholar] [CrossRef]
  44. Santos, F.C.; Pinheiro, F.L.; Lenaerts, T.; Pacheco, J.M. The role of diversity in the evolution of cooperation. J. Theor. Biol. 2012, 299, 88–96. [Google Scholar] [CrossRef]
  45. Yang, X.; Qu, S.; Kong, L. The impact of cooperation network evolution on communication technology innovation: A network interaction perspective. Systems 2025, 13, 126. [Google Scholar] [CrossRef]
  46. Veile, J.W.; Schmidt, M.-C.; Voigt, K.-I. Toward a new era of cooperation: How industrial digital platforms transform business models in Industry 4.0. J. Bus. Res. 2022, 143, 387–405. [Google Scholar] [CrossRef]
  47. Weder, F.; Yarnold, J.; Mertl, S.; Hübner, R.; Elmenreich, W.; Sposato, R. Social learning of sustainability in a pandemic—Changes to sustainability understandings, attitudes, and behaviors during the global pandemic in a higher education setting. Sustainability 2022, 14, 3416. [Google Scholar] [CrossRef]
  48. Molleman, L.; van den Berg, P.; Weissing, F.J. Consistent individual differences in human social learning strategies. Nat. Commun. 2014, 5, 3570. [Google Scholar] [CrossRef]
  49. van Lange, P.A.M.; Joireman, J.; Parks, C.D.; van Dijk, E. The psychology of social dilemmas: A review. Organ. Behav. Hum. Decis. Process. 2013, 120, 125–141. [Google Scholar] [CrossRef]
  50. Smaldino, P.E. Social identity and cooperation in cultural evolution. Behav. Process. 2019, 161, 108–116. [Google Scholar] [CrossRef] [PubMed]
  51. Szolnoki, A.; Perc, M. Conditional strategies and the evolution of cooperation in spatial public goods games. Phys. Rev. E 2012, 85, 026104. [Google Scholar] [CrossRef]
  52. Li, X.; Han, W.; Yang, W.; Wang, J.; Xia, C.; Li, H.-j.; Shi, Y. Impact of resource-based conditional interaction on cooperation in spatial social dilemmas. Phys. A Stat. Mech. Appl. 2022, 594, 127055. [Google Scholar] [CrossRef]
  53. Barabási, A.-L.; Bonabeau, E. Scale-free networks. Sci. Am. 2003, 288, 60–69. [Google Scholar] [CrossRef]
  54. Santos, F.C.; Pacheco, J.M. Scale-free networks provide a unifying framework for the emergence of cooperation. Phys. Rev. Lett. 2005, 95, 098104. [Google Scholar] [CrossRef]
  55. Peña, J.; Volken, H.; Pestelacci, E.; Tomassini, M. Conformity hinders the evolution of cooperation on scale-free networks. Phys. Rev. E 2009, 80, 016110. [Google Scholar] [CrossRef] [PubMed]
  56. Watts, D.J.; Strogatz, S.H. Collective dynamics of ‘small-world’ networks. Nature 1998, 393, 440–442. [Google Scholar] [CrossRef]
  57. Liu, C.; Lv, W.; Cheng, X.; Wen, Y.; Yang, X. Evolution of strategies in evolution games on small-world networks and applications. Chaos Solitons Fractals 2024, 189, 115676. [Google Scholar] [CrossRef]
  58. Inaba, M.; Akiyama, E. Evolution of cooperation in multiplex networks through asymmetry between interaction and replacement. Sci. Rep. 2023, 13, 9814. [Google Scholar] [CrossRef]
  59. Grujić, J.; Lenaerts, T. Do people imitate when making decisions? Evidence from a spatial Prisoner’s Dilemma experiment. R. Soc. Open Sci. 2020, 7, 200618. [Google Scholar] [CrossRef] [PubMed]
  60. Badea, C.; Binning, K.R.; Sherman, D.K.; Boza, M.; Kende, A. Conformity to group norms: How group-affirmation shapes collective action. J. Exp. Soc. Psychol. 2021, 95, 104153. [Google Scholar] [CrossRef]
  61. Yang, K.; Huang, C.; Dai, Q.; Yang, J. The effects of attribute persistence on cooperation in evolutionary games. Chaos Solitons Fractals 2018, 115, 23–28. [Google Scholar] [CrossRef]
Figure 1. Fraction of cooperative agents in equilibrium states in neighborhood model.
Systems 13 00288 g001
Figure 2. Example simulation runs with the lowest b and the highest ρ in the neighborhood model. (a) The dynamics of f C in an example run of b = 1, (b) the dynamics of f C in an example run of ρ = 1, and (c) an example of coexistence between C and D in a run with the same parameters in (b). Each thin gray line in (a,b) represents a simulation run, and the bold black line represents the average of 100 runs.
Systems 13 00288 g002
Figure 3. The dynamics of f C in example runs in the neighborhood model. Each thin gray line represents a simulation run, and the bold black line represents the average of 100 runs.
Systems 13 00288 g003
Figure 4. Snapshots of the spatial distribution in example runs in the neighborhood model. (a) b = 1.2, ρ = 0.2, r = 2, (b) b = 1.2, ρ = 0.9, r = 4, (c) b = 1.5, ρ = 0.8, r = 3, and (d) b = 1.7, ρ = 0.9, r = 2.
Systems 13 00288 g004
Figure 5. Fraction of cooperative agents in equilibrium states in random sampling model.
Systems 13 00288 g005
Figure 6. Example simulation runs with the lowest b and the highest ρ values in the random sampling model. (ac) The dynamics of f C in example runs of b = 1 and (d) the dynamics of f C in an example run of ρ = 1. Each thin gray line represents a simulation run, and the bold black line represents the average of 100 runs.
Systems 13 00288 g006
Figure 7. The dynamics of f C in example runs in the random sampling model. Each thin gray line represents a simulation run, and the bold black line represents the average of 100 runs.
Systems 13 00288 g007
Figure 8. Snapshots of the spatial distribution in example runs in the random sampling model. (a) b = 1.07, ρ = 0.05, q = 24, (b) b = 1.1, ρ = 0.9, q = 12, (c) b = 1.5, ρ = 0.8, q = 40, and (d) b = 1.7, ρ = 0.9, q = 24.
Systems 13 00288 g008
Figure 9. Fraction of cooperative agents in equilibrium states in reference neighborhood model.
Systems 13 00288 g009
Figure 10. Example simulation runs with the lowest b and the highest ρ values in the reference neighborhood model. (ac) The dynamics of f C in example runs of b = 1, and (d) the dynamics of f C in an example run of ρ = 1. Each thin gray line represents a simulation run, and the bold black line represents the average of 100 runs.
Systems 13 00288 g010
Figure 11. The dynamics of f C in example runs in the reference neighborhood model. Each thin gray line represents a simulation run, and the bold black line represents the average of 100 runs.
Systems 13 00288 g011
Figure 12. Snapshots of the spatial distribution in example runs in the reference neighborhood model. (a) b = 1.07, ρ = 0.05, r = 3, (b) b = 1.1, ρ = 0.9, r = 4, (c) b = 1.5, ρ = 0.9, r = 1, and (d) b = 1.7, ρ = 0.9, r = 2.
Systems 13 00288 g012
Figure 13. f C in equilibrium states in models under equal parameter conditions.
Systems 13 00288 g013
Table 1. Summary of research gap in literature.
Studies on ConformityStudies on Differing IGs and LGsThis Study
  • conformists’ proportion in the population [13,18]
  • strength of conformity [14,19,20]
  • type of conformity [21,22]
  • enhancing cooperation [28,30,31]
  • hindering cooperation [32,33,34]
  • conditional effect on cooperation [24,25]
effect of global conformity on cooperation in differing IGs and LGs
Gap: global conformity was not coveredGap: only payoff-biased learning was employed
Table 2. Model parameters.
ParameterMeaningValueReference
bTemptation to defect payoff1, 1.01, …, 2[13,38]
ρ Proportion of conformist0, 0.05, …, 1[13,18]
rRadius of neighbors (in NHD and RND)1, 2, 3, 4[25,39]
qNumber of samples (in RSP)4, 12, 24, 40[25]
Table 3. Result of regression analysis.
VariableCoefficientStd. Errortp
(Intercept)0.58140.007973.35<2 × 10⁻¹⁶
model RND−0.20650.0032−64.87<2 × 10⁻¹⁶
model RSP−0.13470.0032−42.3<2 × 10⁻¹⁶
r/q−0.00730.0012−6.332.49 × 10−10
b−0.33310.0045−74.74<2 × 10⁻¹⁶
ρ 0.42110.004398.09<2 × 10⁻¹⁶
Residual standard error: 0.2074 on 25446 degrees of freedom. Multiple R-squared: 0.4349. Adjusted R-squared: 0.4348. F-statistic: 3917 on 5 and 25446 DF. p-value: < 2 × 10⁻¹⁶.
Disclaimer/Publisher’s Note: The statements, opinions and data contained in all publications are solely those of the individual author(s) and contributor(s) and not of MDPI and/or the editor(s). MDPI and/or the editor(s) disclaim responsibility for any injury to people or property resulting from any ideas, methods, instructions or products referred to in the content.

