Article

Extended Application of Double Machine Learning in Corporate Financial Resilience Research: Based on Data Factor Marketization

The Institute for Sustainable Development, Macau University of Science and Technology, Macao 999078, China
*
Authors to whom correspondence should be addressed.
Systems 2025, 13(4), 292; https://doi.org/10.3390/systems13040292
Submission received: 12 March 2025 / Revised: 1 April 2025 / Accepted: 9 April 2025 / Published: 16 April 2025
(This article belongs to the Special Issue Sustainable Business Models and Digital Transformation)

Abstract

:
Corporate financial resilience and its integration with institutional reforms play a crucial role in promoting organizational sustainability in the digital economy. Previous research has predominantly focused on internal determinants of corporate financial resilience. However, it has paid limited attention to the role of external institutional factors. This gap is particularly evident in the context of data factor marketization (DFM). We addressed this gap by investigating the impact of DFM on corporate financial resilience, drawing on resource dependence theory (RDT) to highlight the importance of the external policy environment and inter-organizational resource exchange. We employed a double machine learning (DML) framework to assess corporate financial resilience using comprehensive panel data from Chinese listed firms. This approach overcomes the limitations of traditional econometric methods by allowing nonlinear interactions and high-dimensional controls. The results show that DFM significantly enhances corporate financial resilience, with its impact varying across different institutional contexts. Additionally, firm characteristics moderate this relationship. Specifically, ownership structure strengthens or weakens the positive effect of DFM, while industry competition and geographical location have varying effects on resilience outcomes. We offered novel theoretical insights and practical guidance for policymakers seeking to leverage institutional reforms to enhance financial resilience within an increasingly volatile and uncertain business landscape.

1. Introduction

The contemporary global business landscape faces unprecedented volatility and systemic disruptions. These challenges emerge from rapid technological advancements and evolving regulatory frameworks. In this environment, corporate financial resilience has become critical for survival and sustainable growth. This capability often supersedes profit as the key success determinant [1]. Financial resilience represents a firm’s ability to maintain stability and performance growth despite external disruptions. In addition to enabling firms to withstand short-term disruptions, financial resilience forms the backbone of sustainable business strategies. Robust data governance and digital transformation not only help companies manage risks but also lay the groundwork for integrating circular economy practices, enhancing ESG performance, and aligning operations with Sustainable Development Goals [2]. While resilience encompasses multiple dimensions including ecological, social, and operational aspects [3], the financial dimension serves as a foundation for broader organizational adaptability. Firms demonstrate financial resilience through sustained performance growth and reduced volatility, reflecting their capacity to withstand economic shocks while continuing value creation. Research on financial resilience has gained urgency as firms increasingly encounter nonlinear shocks. Traditional risk management frameworks often prove inadequate for addressing these challenges [4].
Existing studies have thoroughly explored internal determinants such as dynamic capabilities and governance structures. However, significant gaps remain in understanding how external institutional factors shape financial resilience outcomes [5]. Moreover, the role of data as a production factor in enhancing financial stability and performance growth remains particularly underexplored. Traditional econometric approaches show limitations in capturing the complex nature of financial resilience. This methodological challenge requires the integration of advanced machine learning techniques, which offer superior capabilities in handling high-dimensional data and identifying nonlinear patterns in organizational responses to external shocks.
As digital technologies become central to enterprise competitiveness, data has transitioned from a peripheral resource to a core production factor in value creation [6]. However, privacy concerns and confidentiality requirements significantly constrain the flow of data within markets. Data monopolization and siloed ecosystems create accessibility barriers, imposing high acquisition costs on enterprises. These challenges reduce the efficiency of data circulation across organizations. Moreover, improved data flow through DFM supports sustainable development by enabling businesses to adopt circular economy models, implement robust ESG practices, and align with the Sustainable Development Goals. Data factor marketization (DFM) addresses these barriers through institutional reforms. We defined DFM as the institutional process of establishing market-based mechanisms for data circulation, pricing, and utilization as a production factor. This approach operates through standardized trading protocols and compliance frameworks that foster cross-organizational sharing [7]. China’s data-element marketization initiatives exemplify this approach. The country’s 2020 national strategy recognizes data as a fifth production factor alongside land, labor, capital, and technology. These initiatives have established data trading platforms like the Beijing International Big Data Exchange, along with property rights frameworks and security controls.
We examined China’s establishment of data trading platforms as a quasi-natural experiment. We used resource dependence theory (RDT) to analyze how these platforms affect corporate financial resilience among listed companies. RDT suggests firms must acquire critical resources from external environments, forming interdependent exchange relationships [8,9]. However, the effectiveness of formalizing these exchanges through data marketplaces remains unclear. We explored how DFM, as a policy-driven institutional process, enables firms to build financial resilience through external data integration. While existing studies use traditional inference models that struggle with complex policy effects, we applied double machine learning (DML) to capture nonlinear interactions. DML uses advanced algorithms to select optimal control variables, addressing dimensionality problems and omitting variable bias. These techniques ensure robust estimates even with limited samples [10]. We used these methods to estimate how data trading platforms causally impact corporate financial resilience.
We mainly made the following contributions. Firstly, we contributed to the corporate financial resilience literature by identifying DFM as a critical institutional driver to explain how external policy architectures shape resilience outcomes. Traditional studies have focused on internal organizational factors and strategic management in shaping corporate financial resilience [11,12]. We identified DFM as a critical institutional driver. By integrating insights from institutional economics and RDT, we provided a more nuanced theoretical framework. This framework helps understand how external policy architectures shape corporate financial resilience in the digital era. Furthermore, our study extends the discussion to sustainable development by demonstrating that DFM supports the adoption of sustainable business models. By facilitating improved data governance and digital transformation, firms can integrate ESG initiatives, circular economy practices, and SDG-aligned strategies into their operations, thereby enhancing long-term corporate sustainability.
The second contribution focuses on the heterogeneous effects of DFM and firm characteristics. We examined how corporate financial resilience, a key factor for adaptation and survival, varies across different firm-specific characteristics. Previous studies have explored how ownership structure and industry competition affect responses to external shocks. However, they often overlook the heterogeneous nature of resource allocation and adaptation [11,13,14]. We emphasized the moderating role of various firm characteristics. These include ownership structure, firm size, industry competition, and geographical location. Through this emphasis, we extended the institutional economics literature. While DFM facilitates resource allocation, firm characteristics determine how effectively organizations can leverage these reforms. We provided recommendations for policymakers on designing institutional frameworks that account for firm diversity.
Thirdly, we demonstrated the transformative value of DML in analyzing how external policy environments shape corporate financial resilience. Much of the existing research tends to oversimplify complex interactions between institutional reform and organizational adaptability. These interactions are typically nonlinear and time-varying [15]. We applied DML with high-dimensional controls and flexible functional forms. This approach has led to the identification of dynamic moderation mechanisms. These mechanisms pertain to the differential impact of policy intensity thresholds on firms’ capacities to buffer risk. This approach successfully circumvents the endogeneity biases that are commonly observed in traditional difference-in-differences models, particularly in the context of measuring delayed policy effects across heterogeneous industries.
The rest of the structure is organized as follows: Section 2 reviews the literature and formulates the hypotheses. Section 3 explains the methodology, Section 4 presents the empirical analysis, and Section 5 concludes with a discussion of the research.

2. Literature Review and Hypothesis Development

2.1. Literature Review

2.1.1. Policy Background of DFM Implementation in China

In the digital era, data elements have emerged as pivotal production factors driving global economic growth [16]. These elements are characterized by infinite replicability and negligible marginal costs [17]. Nevertheless, the inadequate marketization of data has led to the underutilization of “cold data”, which has not been transformed into actionable knowledge [18]. To address these challenges, China has systematically advanced its data governance framework since 2014. Subsequent policy milestones include two key initiatives. First, the 2015–2016 Action Outline for Promoting Big Data advocated integrated online–offline trading mechanisms. Second, the 2020 Guidelines on Improving Market-Oriented Allocation of Production Factors accelerated cross-regional platform expansion. By 2021, the enactment of the Data Security Law formalized transaction protocols across 13 provincial-level regions. This legislation encompassed several critical elements: data property rights definition, pricing mechanisms, and privacy safeguards.
Despite these advances, persistent barriers continue to constrain value realization. These include ambiguous data ownership [19], platform-induced monopolies [20], and compliance risks in multi-stakeholder data use. China’s dual-track system aims to reconcile these tensions. This system comprises two components: government-led platforms for institutional standardization and enterprise-driven platforms for market innovation. Government platforms leverage administrative authorities to provide foundational services. These include property rights arbitration and transaction security. Meanwhile, commercial platforms facilitate data asset securitization and sector-specific applications [21]. The evolution of China’s data exchange ecosystem offers a unique quasi-experimental setting in which to explore these mechanisms.
Furthermore, firms are capitalizing on data marketization to drive business model innovation. Many companies are developing new digital platforms that seamlessly integrate sustainability principles into their operations. For instance, several manufacturing and renewable energy enterprises have implemented advanced digital supply chain management systems that enable resource reuse and waste minimization, effectively transforming traditional business models into sustainable, digitally enabled frameworks [22]. These real-world examples demonstrate how digital transformation not only reinforces financial resilience but also fosters sustainable business model adaptation.
Beyond the Chinese context, it is crucial to recognize that digital transformation for sustainability manifests differently across regions. While China’s data factor marketization (DFM) aims to bolster corporate financial resilience through enhanced data integration, the European Union emphasizes stringent regulatory frameworks, exemplified by the General Data Protection Regulation (GDPR) and digital market laws, to ensure data protection and drive sustainable innovation [23]. In contrast, the United States typically adopts a market-driven approach that promotes free data flow and innovation, as reflected in policies such as the Federal Data Strategy and the National AI Initiative Act of 2020, which encourage technological advancement and industry-led standards with relatively light regulatory oversight [24]. These differing policy paradigms underscore that digital sustainability strategies are inherently shaped by each region’s socio-economic priorities and institutional frameworks.

2.1.2. Corporate Financial Resilience

The notion of corporate financial resilience has evolved significantly over time. Initially conceptualized as a capacity to recover from disruptions, it has developed from engineering-centric “bounce-back” models to dynamic capability frameworks. Early studies rooted in ecological frameworks focused on ecosystem resistance and recovery [25]. Later research expanded these concepts to the organizational level. Vogus and Sutcliffe [26] defined organizational resilience as maintaining positive adjustments under challenging conditions. They emphasized that resilient organizations emerge stronger and more resourceful after facing adversity. Many scholars identify key qualities of organizational resilience, including adaptability, flexibility, and strategic agility. By integrating these qualities with complex adaptive systems theory, organizations achieve resource reorganization in volatile environments. This balance between stability and transformation becomes crucial during crisis periods. Truly resilient organizations adapt to change and learn from past events [3,12]. Such resilience is increasingly viewed as a catalyst for sustainable business practices, where the capacity to bounce back also drives investments in long-term environmental and social value creation. Moreover, financial robustness is critical not only for weathering economic shocks but also for enabling long-term sustainable innovation [27]. By leveraging efficient data management and digital transformation, firms can channel resources into ESG initiatives and circular economy models, thereby embedding sustainability into their core business strategies.
A seminal body of research on corporate financial resilience has established three core dimensions through conceptual refinement. The first dimension pertains to the robustness of the firm itself, with financial soundness serving as the primary indicator. This financial dimension, characterized by substantial cash reserves and minimal leverage, forms the foundation for absorbing external shocks [28]. While our study focuses specifically on this financial dimension of resilience, research shows other internal factors also contribute to overall resilience. These include employee satisfaction [29], extensive stakeholder networks [30], corporate social responsibility [31], and organizational diversity [4,32]. The second dimension involves operational agility, including supply chain diversification and digital transformation. Erol et al. [33] identified vulnerability mitigation as a significant aspect of business resilience. By enhancing operational adaptability, organizations proactively identify risks and prevent crisis escalation [30]. This agility is also key to adopting sustainable practices, as digital transformation enables companies to reconfigure their operations towards more environmentally and socially responsible models. The third dimension encompasses external enablers, including institutional support and regulatory adjustments [34,35]. Empirical studies confirm the importance of financial resilience in organizational survival. Firms with agile governance structures demonstrate 23% faster recovery during systemic shocks like the global pandemic [28]. Case studies reveal digitized companies maintain 68% higher business continuity during disruptions [33]. These findings underscore our focus on corporate financial resilience as a critical dimension worthy of detailed investigation. By examining financial resilience specifically, we addressed a foundational aspect of organizational survivability in uncertain environments.
Our research extends this understanding by investigating how DFM specifically enhances corporate financial resilience. We focused on this essential financial dimension as it underpins broader resilience capabilities and directly impacts long-term viability in increasingly digital and volatile markets. Furthermore, the institutional reforms driving DFM not only bolster financial strength but also enable firms to transform their business models towards sustainability. By integrating advanced data management with digital transformation, companies are empowered to pursue innovative ESG strategies and circular economy practices, thereby securing a competitive advantage in a sustainable global market.

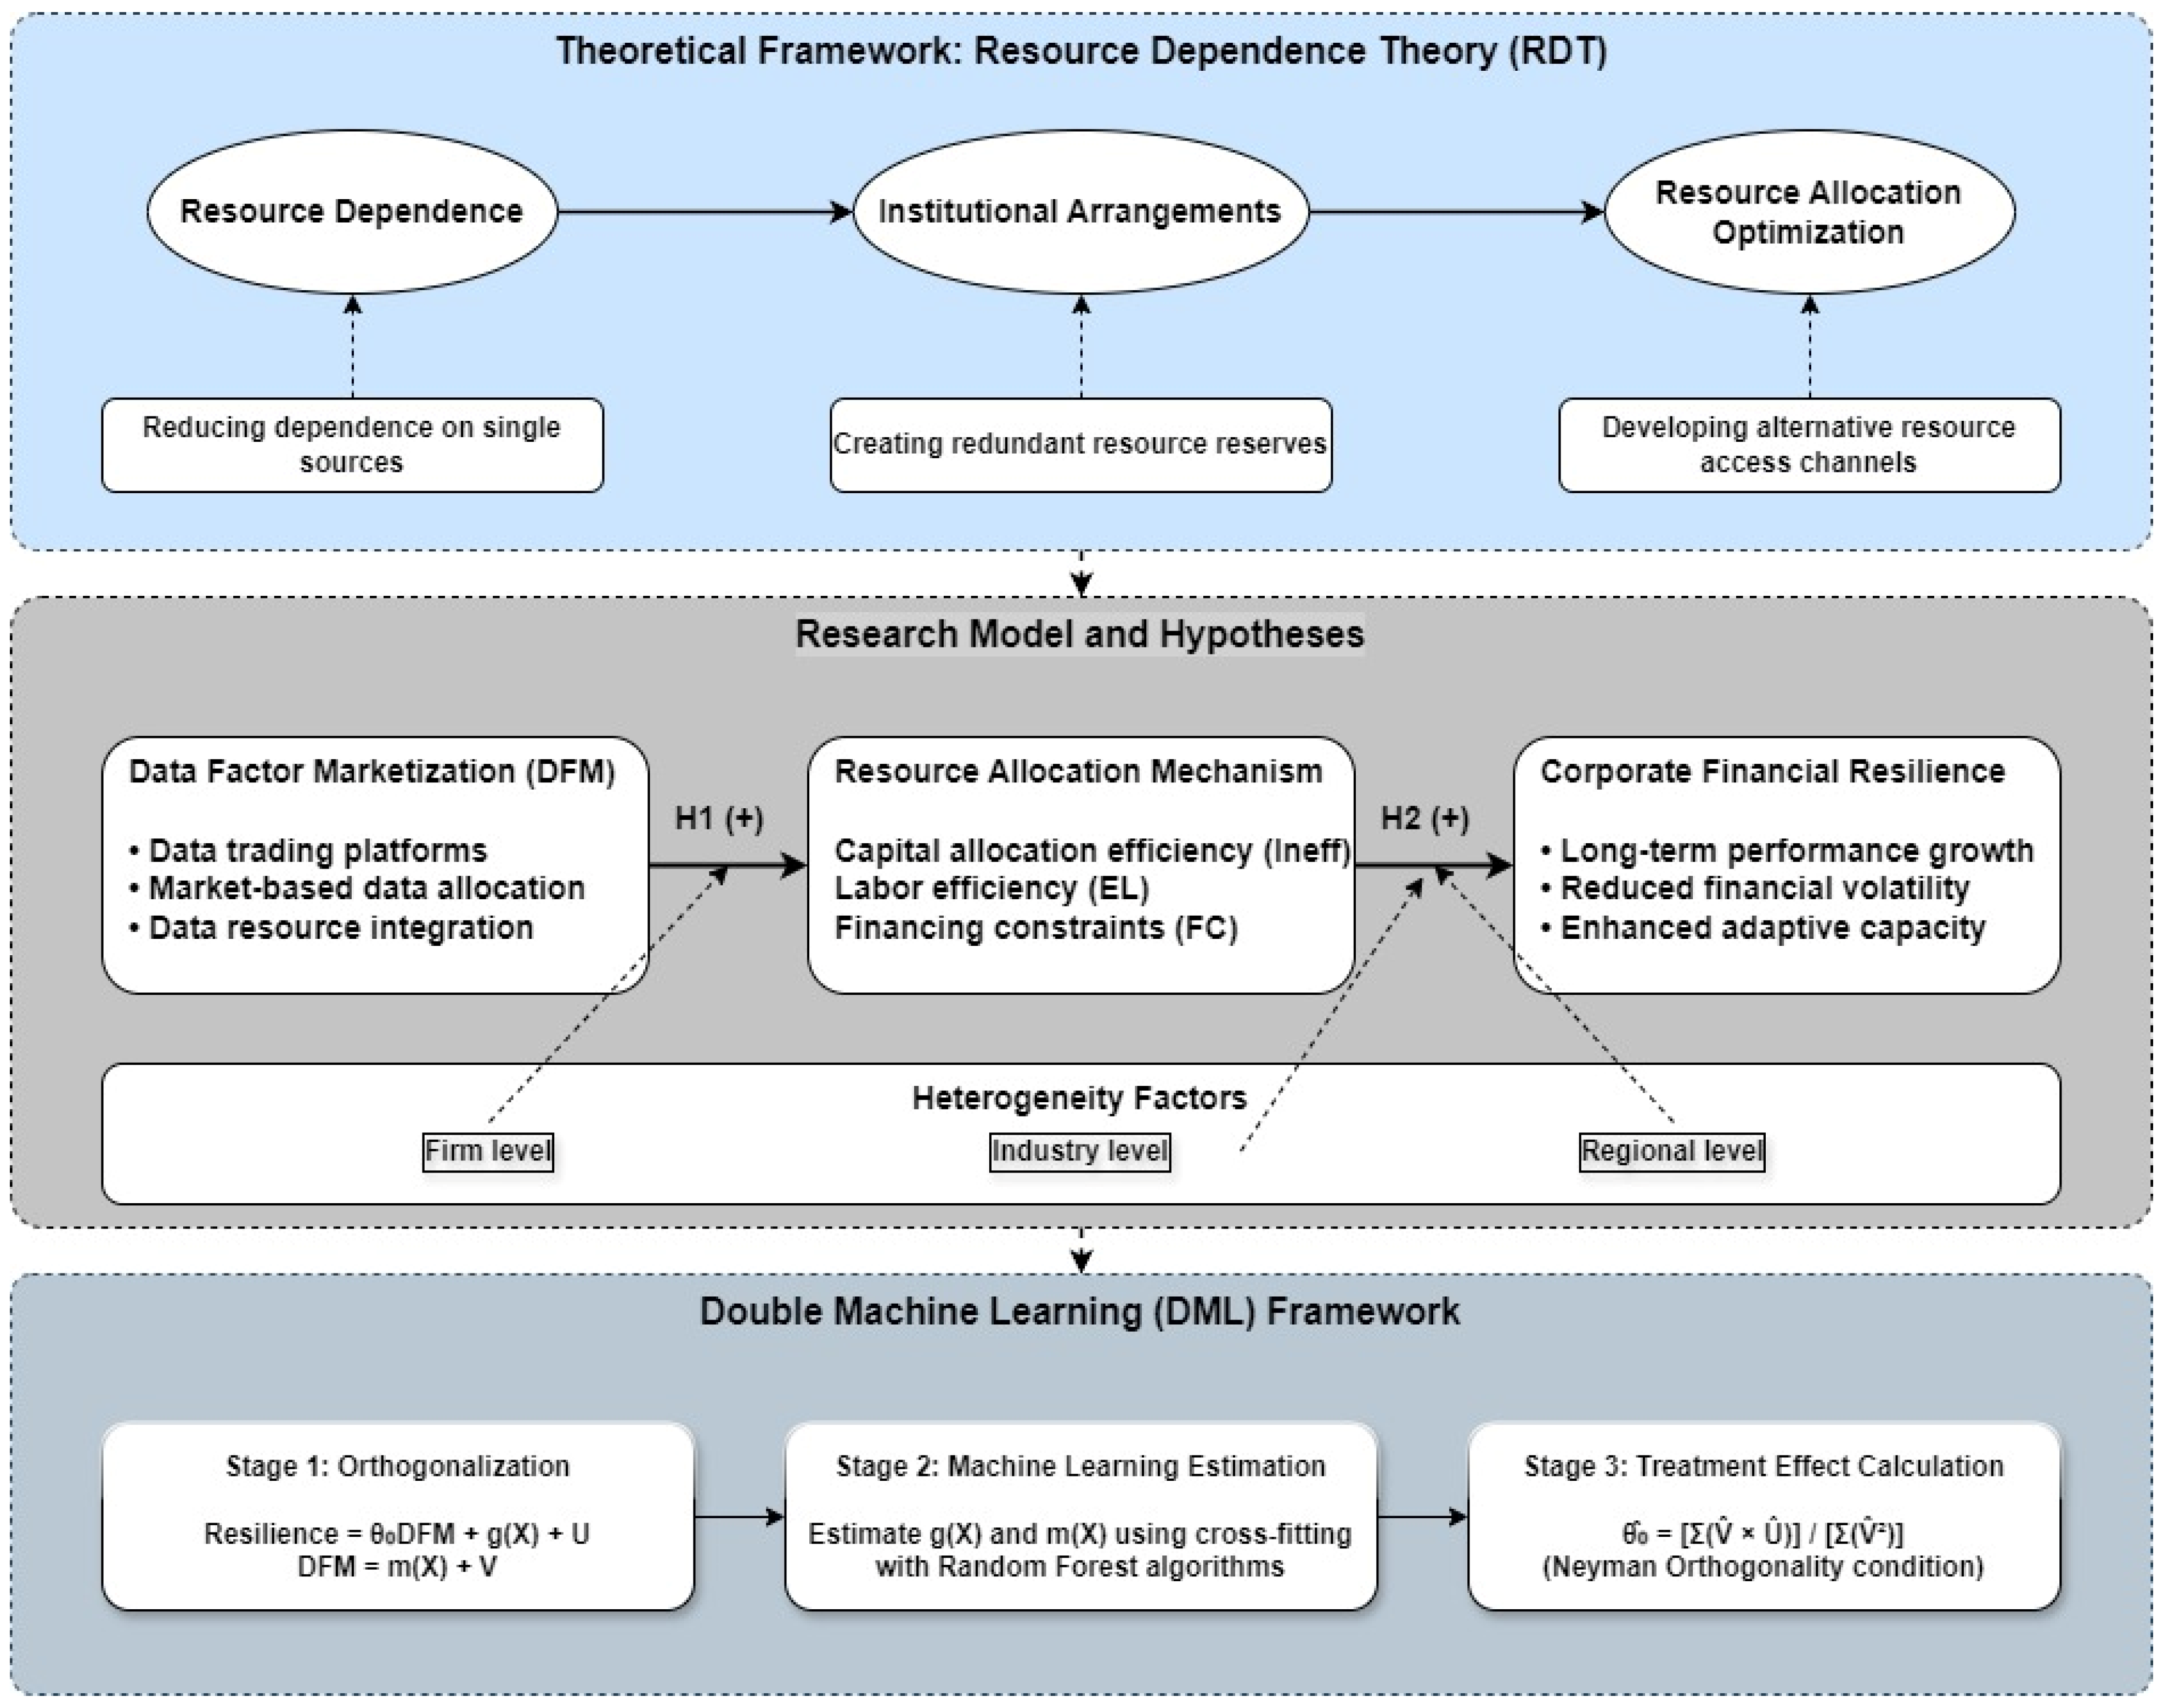
2.2. Hypothesis Development

The resource dependence theory (RDT) elucidates two key concepts. First, it explains the fundamental mechanisms of inter-organizational resource allocation. Second, it reveals the coping strategies that organizations employ when facing resource dependence pressures [36]. In essence, organizations possess the capacity to make strategic adjustments in accordance with their comprehension of dependencies [37]. Concurrently, the behaviors and structures exhibited by firms are propelled by the extent of their reliance on pivotal external resources [38]. This theoretical framework explains how organizations’ financial resilience is directly influenced by their ability to access and control critical resources, including data resources in the digital economy. We posited that DFM not only optimizes resource allocation for immediate financial stability but also provides the informational infrastructure for firms to adopt sustainable practices. Enhanced data transparency and access can drive the integration of ESG strategies and circular economy principles into business models. Under the RDT perspective, enterprises build resilience by strategically managing their resource dependencies. This involves three key strategies: reducing dependence on single sources, creating redundancies, and developing alternative resource access channels. To ensure a reliable supply of resources and preserve organizational autonomy, firms adopt strategies to control, reduce, or substitute these dependencies [39]. The capacity of an organization to regulate essential resources has been demonstrated to have a direct impact on its degree of financial resilience to environmental uncertainty [9].
Enterprises access external data resources through data trading platforms. This process can be conceptualized as a reconfiguration of inter-organizational dependencies. The platform-based access model enables enterprises to disrupt conventional linear resource chains. It allows them to establish multi-node, networked resource access channels. Additionally, data elements have decreasing marginal cost characteristics. This enables firms to build redundant resource reserves at reduced costs [40]. Such resource redundancy is a fundamental mechanism for developing corporate financial resilience. In the context of DFM, data trading platforms serve two important functions. First, they provide enterprises with access to multiple data sources. Second, they promote in-depth integration of data factors with traditional production factors (labor, capital, and land). This integration occurs through new-generation information technologies, including big data, cloud computing, and artificial intelligence. This integration helps reduce resource mismatches caused by asymmetric information. It also lowers enterprises’ costs in the financing process, specifically reducing searching, matching, and communication costs. Reduced matching and communication costs enhance capital market efficiency and improve financial supply structures. These improvements lead to greater capital allocation efficiency [41]. Enhanced capital allocation efficiency expedites capital circulation among enterprises. Studies have shown that these improvements enable enterprises to obtain financing more quickly and efficiently [42,43,44]. This measure ensures that enterprises maintain their production capacity prior to the impact, thereby enhancing their stabilization and restoration in the face of risky impacts [45].
Data trading platforms can incorporate data elements and their derivatives into economic operation systems. This incorporation occurs through market-oriented allocation mechanisms. These platforms help economic entities accurately discern customer preferences and obtain timely feedback. They also reduce resource mismatches between supply and demand. Additionally, they decrease uncertainty in research and the development of new products or services. This transformation creates two key benefits for companies. First, it reduces reliance on single suppliers by enabling resource substitution. This lowers dependency risks [46]. Second, it improves cross-border resource integration through better coordination. This strengthens business models and operational efficiency. These changes also boost innovation, help turn research into practical solutions, and unlock technology benefits. By using data platforms to access diverse resources, companies can avoid over-relying on specific data sources. This flexibility in resource management builds stronger foundations for long-term financial resilience.
Based on this analysis, we proposed two hypothesis:
Hypothesis 1.
Building data trading platforms can enhance corporate financial resilience.
Hypothesis 2.
Data trading platforms enhance corporate financial resilience through resource allocation optimization.
The theoretical model and hypotheses are shown in Figure 1 below:

3. Methodology

3.1. The Use of Double Machine Learning (DML)

We examined the impact of data factor marketization (DFM) on business resilience, with a focus on data trading platform policies at the prefecture-level city level. Current studies frequently utilize traditional causal inference models to assess policy effects; however, these methods exhibit numerous limitations in practice. The double-difference model imposes more stringent requirements on sample data to verify the parallel trend assumption, which may not be fully satisfied in the complex context of data marketization policies. This synthetic control method can satisfy this condition by constructing a virtual control group [47]. However, it is contingent on the absence of “extreme value” characteristics in the treatment group and is only applicable to “one-to-many” scenarios, limiting their usefulness for our nationwide policy evaluation. The propensity score matching method is susceptible to subjective bias in the selection of matching variables by the researcher. These shortcomings have led to an increased focus among scholars on the role of machine learning in causal inference in economics.
The concept of DML was formally introduced in 2018 by Chernozhukov et al. [48]. This approach has rapidly emerged as a potent analytical instrument within the domain of causal inference [47]. DML involves the relaxation of linearity assumptions between variables, permitting nonlinearity and interaction effects. In comparison to conventional econometrics and policy assessment methods, DML exhibits enhanced sensitivity to real-world economic environments and the requirements of policy analysis, particularly for emerging and complex policy areas like data marketization. The employment of machine learning algorithms in DML models leads to a reduction in the influence of covariates on the estimation of treatment effects, a relaxation of linearity assumptions, and the mitigation of specification bias. In addition, DML employs the core concepts of two-stage predictive residual regression, sample split fitting, and “Neyman Orthogonality”. The former two of these concepts mitigate regularization bias in machine learning estimation, while the latter ensures consistency in treatment coefficient estimates, addressing endogeneity concerns that are common in policy evaluation studies.
First, we developed the following partially linear double machine learning (DML) models:
R e s i l i e n c e i t = θ 0 D F M i t + g ( X i t ) + U i t
E [ U i t D F M i t , X i t ] = 0
where i denotes the city; t denotes the year; R e s i l i e n c e i t denotes the explanatory variable firm resilience; and D F M i t is a policy dummy variable indicating the data trading platform policy, which is 1 after setting up the pilot and 0 for the rest. Its coefficient θ 0 reflects the effect of DFM on corporate financial resilience. X i t is the set of high-dimensional control variables; U i t is the random error term, which satisfies the conditional mean of 0. Meanwhile, to speed up the convergence, make the disposal coefficient estimator satisfy the unbiasedness in small samples, and mitigate the estimation error generated by the regularity bias as much as possible, we constructed the auxiliary regression:
D F M i t = m ( X i t ) + V i t
E [ V i t X i t ] = 0
Next, an ML algorithm is used to obtain g ^ ( X i t ) . Then, g ^ X i t = E [ R e s i l i e n c e i t X i t ] is observed. After substituting g ^ ( X i t ) into Equation (1), the expression for the treatment coefficient estimator θ ^ 0 is obtained as follows:
θ ^ 0 = 1 S 1 E Σ i t D F M i t R e s i l i e n c e i t g ^ ( X i t ) 1 S 1 E Σ i t D F M i t 2
In the preceding equation, the S denotes sample size, and E denotes the test interval. Following the core idea of residualization, the high dimensional and nonlinear X i t is “orthogonalized” to the non-disposable part of the change by g ^ X i t . When used in high-dimensional scenarios, the g ^ eliminated the effect of control variables on R e s i l i e n c e i t and then disposed of the variable D F M i t . Performing a linear regression, one obtains a linear regression on the target coefficients θ 0 of the estimator. When used in high-dimensional scenarios with many variables, our approach eliminates the confounding effects of control variables on corporate resilience, allowing us to estimate the true impact of data trading platforms.
Then, the estimation bias is further examined:
S E θ ^ 0 θ 0 = p + q
p = 1 S E Σ i t D F M i t U i t 1 S E Σ i t D F M i t 2 ~ N ( 0 , Σ )
q = 1 S E Σ i t D F M i t g ^ ( X i t ) g ( X i t ) 1 S E Σ i t D F M i t 2 ~ N ( 0 , Σ )
In the DML framework, the θ ^ 0 can usually be written as the sum of the “Main term + Bias term” and analyzed in the case of S E scales. p corresponds to the linear part in the ideal case, together with the error U i t to determine the stochasticity of the estimator, which can be viewed as a normalized quantity of mean (0) and variance ( Σ ) under certain conditions. q contains the machine learning estimation error ( g ^ ( X i t ) g ( X i t ) ); if this error is sufficiently small or occurs only in the second order, then q will converge to 0, thus ensuring the consistency of the overall estimate with the approximate normality originating from the central limit theorem.
With the main sources of error, q is combined and then utilized in Equation (3) for D F M i t = m X i t + V i t , which can be further translated into E v e n t i t . The high-dimensional and nonlinear part of the equation is rewritten as m X i t . Thus, to find out where the error between the estimated g ^ and actual values g takes effect, the following is used:
q = 1 S 1 E i t D F M i t 2 1 1 S E i t m ( X i t ) g ( X i t ) g ^ ( X i t ) + ο ρ ( 1 )
When the estimation accuracy of m X i t and g X i t increased, q will then gradually converge to 0. However, ML models usually use regularization algorithms for high-dimensional data, which may introduce regularization errors. To ensure robustness, orthogonalization on D F M i t was performed and achieved V ^ i t = D F M i t m ^ X i t to eliminate the impact of the control variable X i t . As a result, the V ^ i t can be treated as a relatively independent instrumented variable.
Once more, the utilization of machine learning is employed to derive insights θ ^ 0 for the final identification of disposition effects θ 0 :
θ ^ 0 = 1 S 1 E i t V ^ i t R e s i l i e n c e i t g ^ ( X i t ) 1 S 1 E i t V ^ i t D F M i t
using the orthogonalized version of V ^ i t in place of E v e n t i t , while the denominator uses the mean of V ^ i t E v e n t i t to ensure the completeness of the “Orthogonal Regression Structure” and enabling machine learning for the second time. At the same time, m ^ ( X i t ) and g ^ ( X i t ) are all trained by ML algorithms under auxiliary regression (cross-fitting), approximate m ( X i t ) and g ( X i t ) . Since the machine learning estimation is inevitably biased in the high-dimensional case, the bias can be further attenuated by “orthogonalization + instrumental variables” on the main parameter θ 0 of first-order effects to achieve more robust causal inference. The estimator is then expanded into three parts in S E dimensions: a stochastic normal principal term p * , a machine learning error term q * , and an additional higher-order residual ο ρ * . The following formulas can be derived:
S E θ ^ 0 θ 0 = p * + q *
p * = 1 S E Σ i t V i t U i t 1 S E Σ i t V ^ i t 2 ~ N ( 0 , Σ )
q * = 1 S E Σ i t m ^ ( X i t ) m ( X i t ) g ^ ( X i t ) g ( X i t ) 1 S E Σ i t V ^ i t 2 ~ N ( 0 , Σ )
When p * and additional higher-order residual ο ρ * convergence to 0, θ ^ 0 can then satisfy “Asymptotic Normality”. Thus, the DML model yields consistent estimates of the treatment coefficients.
Table 1 presents a pseudo-code of our double machine learning algorithm. This diagram shows how we performed the following: (1) prepared and divided our data; (2) used machine learning to estimate relationships between variables; (3) calculated the residuals (unexplained portions) of our key variables; and (4) used these residuals to estimate the true effect of data trading platforms on corporate financial resilience. Each step is annotated with comments (following ‘//’) that explain its purpose in plain language.
Our double machine learning (DML) models were implemented on a workstation with the following specifications: Intel Core i5-14600KF 14-core processor, 32 GB DDR4 3600 MHz memory (dual 16 GB configuration), and NVIDIA GeForce RTX 4060 (8 GB/memory 2125 MHZ) graphics card. The system includes 2 TB of storage across two drives.
For model training, we employed 5-fold cross-validation with an 80–20% train-test split ratio. The Random Forest Regressor algorithm from the scikit-learn library was configured with 100 decision trees (n_estimators = 100) for both the treatment and outcome prediction stages. Training time was significantly affected by model complexity: With only basic control variables, each model required approximately 513.6 s (107.30 s/it) for completion. When quadratic terms were added to the control variables, the training time increased substantially to 3683.9 s (750.69 s/it). The total running time of the entire model is approximately 5215.4 s. All analyses were programmed in Python, leveraging the pandas library for data management, numpy for numerical operations, and sklenar for machine learning implementation.
The model implementation details are provided not solely as technical specifications, but rather to ensure transparency and reproducibility of the research. The computational resources described (processor, memory, and graphics card) directly influence the model’s ability to process complex relationships in high-dimensional data. Furthermore, the employment of a cross-validation approach serves to substantiate the robustness of our findings and to reduce the possibility of their being merely a consequence of chance patterns in a specific subset of data. These methodological decisions are pivotal in substantiating the reliability of our conclusions regarding the impact of marketization on corporate financial resilience.

3.2. Variables

3.2.1. Dependent Variable: Corporate Financial Resilience

Drawing on the theoretical framework developed by Ortiz-de-Mandojana and Bansal [30], we adopted a two-dimensional perspective to conceptualize corporate financial resilience comprehensively. Specifically, corporate financial resilience is defined as the integrated combination of high-performance growth and low financial volatility. Long-term performance growth is measured by the cumulative three-year increase in sales revenue, which provides a better indication of a company’s sustained development capability compared to annual growth rates. Financial volatility is assessed using the annualized standard deviation of monthly stock returns. Finally, the entropy weighting method is applied to create a corporate financial resilience index R e s i l i e n c e i t .

3.2.2. Independent Variable: Data Factor Marketization (DFM)

We operated DFM through the establishment of data exchange platforms in local markets. These platforms serve as formal institutional arrangements that facilitate data circulation by defining ownership rights, removing market barriers, and implementing pricing mechanisms. From an RDT perspective, these platforms fundamentally reshape the resource dependency landscape by creating new channels for resource acquisition and exchange, thereby altering the power dynamics between data providers and users.
We measured DFM using a dummy variable ( D F M i t ) that captures the presence of data exchange platforms in a company’s location. We compiled a comprehensive timeline of local data exchange platform establishments across China from 2011 to 2022. For each company in our sample, D F M i t equals 1 if a data exchange platform exists in the company’s city in a given year and all subsequent years. Otherwise, D F M i t equals 0. When multiple platforms exist in a single city, we used the earliest establishment date to mark the beginning of DFM in that location. This measurement approach captures the institutional transition to market-based data allocation mechanisms that enable cross-organizational data exchange and integration. This operationalization directly addresses the core RDT tenet that formal institutional arrangements can significantly alter organizations’ resource dependence patterns and resource acquisition strategies.

3.2.3. Control Variables

We incorporated various control variables related to corporate governance structure, profitability, and solvency [49]. Our selection of control variables is guided by RDT, which emphasizes the importance of both internal resource configurations and external resource dependencies in shaping corporate financial resilience. At the firm level, the control variables include firm size ( S i z e ) and the proportion of fixed asset investment ( F i x e d ), which reflect an organization’s resource base and its ability to buffer external shocks through resource reconfiguration. Governance structure variables encompass board size ( B o a r d ), the proportion of independent directors ( I n d e p ), the duality of the chairman and CEO roles ( D u a l ), as well as the ownership stake of the top 5 shareholders ( T o p 5 ). All factors that influence an organization’s strategic response to resource dependencies according to RDT. Financial indicators include the leverage ratio ( L e v ), return on equity ( R o e ), and the proportion of cash holdings ( C a s h f l o w ), which measure a firm’s financial resource availability and dependency on external capital markets. As shown in Table 2, we also selected other necessary control variables that represent different aspects of organizational resource dependencies as theorized in RDT.

3.3. Data Source

Our dataset comprises China’s A-share listed companies from 2011 to 2022, providing a comprehensive panel that captures the implementation timeline of DFM reforms. The sample selection process followed several steps to ensure data quality and representativeness. First, we excluded financial sector companies due to their distinct regulatory environment and accounting standards. Second, we removed ST-type companies (those under special treatment due to financial distress) to avoid potential distortions from financially troubled firms. Third, we eliminated observations with missing values for key variables to ensure completeness of the analysis. Finally, we minorized all continuous variables at the 1% level to mitigate the influence of extreme outliers while preserving the overall data characteristics. These procedures yielded a balanced panel dataset of 33,507 firm-year observations from 3165 unique companies.
The firm-level financial and governance data were obtained from the CSMAR (China Stock Market & Accounting Research) database, supplemented with information from companies’ annual reports when necessary. For our key independent variable, we created a comprehensive inventory of data trading platform establishments by combining information from multiple sources: the official “Big Data White Paper” published by the China Information and Communications Technology Institute (CICT), government policy documents, and public announcements from platform operators. Regional economic indicators were collected from provincial statistical yearbooks. This multi-source data collection approach enhances the reliability of our empirical analysis by capturing both firm-specific attributes and their institutional environment. Table 3 presents descriptive statistics for the major variables, demonstrating appropriate variation across our sample.
The Figure 2 illustrates the correlation matrix between all the independent variables. The correlation coefficients between most of the variables are at a low level, indicating that multicollinearity is unlikely to have a significant impact on the results of our analysis. Notably, there is a high correlation (0.91) between R O A and R O E , which is more common in financial performance indicators. The generally low correlation between our core explanatory variable,   D F M , and the control variables further validates the rationality of the model design. Other relatively high correlations include S i z e vs. L e v (0.52), I N S T vs. T o p 5 (0.47), and M s h a r e vs. M f e e (−0.66), but these correlations are still within acceptable limits. We also calculated the variant inflation factor (VIF), and all values were below the common threshold of 5, further confirming the reliability of the estimates.
The Figure 3 shows the interrelationships between the key financial indicators in this study. The upper left panel in particular shows that companies with a data exchange platform ( D F M ) tend to exhibit higher financial resilience, which initially supports our research hypothesis. In addition, other panels show the negative correlation between leverage and R O A (upper right), the complex relationship between equity concentration and board independence (lower left), and the nonlinear relationship between market valuation and return on equity (lower right). Together, these relationships form the background framework of our research.
To more rigorously examine the relationship between DFM and financial resilience, the Figure 4 resents a comparative analysis after controlling firm characteristics. As shown, the positive relationship between DFM and financial resilience remains significant (t = 19.75, p < 0.001) after controlling factors such as firm size, leverage, and profitability. Although visually the difference is subtle (difference in values = 0.0414), from a statistical perspective, this finding strongly supports the hypothesis that digital financial market participation can enhance.

4. Empirical Results

4.1. Main Regression

Table 4 presents the baseline regression results examining the impact of data factor marketization (DFM) on corporate financial resilience. In Column (1), the coefficient for DFM is positive and statistically significant ( β = 0.0169, p < 0.01), indicating that the establishment of data trading platforms enhances corporate financial resilience. This suggests that firms operating in regions with established data trading platforms demonstrate stronger financial resilience capabilities.
The results remain robust across different model specifications. In Column (2), after incorporating squared terms of control variables to account for potential nonlinear effects, the coefficient remains positive and significant (β = 0.0166, p < 0.01). Furthermore, Column (3) includes both year-fixed effects to control for macroeconomic factors and firm-fixed effects to account for time-invariant firm characteristics, and the coefficient maintains its positive significance (β = 0.0191, p < 0.01).
All models include the complete set of control variables defined in Table 1 ( S i z e , L e v , R o e , C a s h f l o w , F i x e d , B o a r d , I n d e p , T o p 5 , F i r m A g e , S o e , R o a , T o b i n Q , I n v , M s h a r e , N s t , M f e e , and O c c u p y ). These findings, derived from a double machine learning (DML) framework with random forest algorithms and cross-validation (80% training set and 20% testing set), provide strong empirical evidence supporting Hypothesis 1. The consistent statistical significance at the 1% level across all specifications demonstrates the robustness of the relationship between DFM and enhanced corporate financial resilience.
To evaluate model fit and help readers determine which model is most appropriate, we reported adjusted R2 and AIC values. The results show that, as the complexity of control variables increases, the adjusted R2 rises from 0.213 in Model 1 to 0.275 in Model 3, while the AIC decreases from 15,824 to 14,936. This indicates that Model 3 (which includes all control variables and fixed effects) provides the best fit, and we therefore based our main interpretations on this model.
In addition to strengthening financial resilience, these findings suggest that DFM may also lay the groundwork for business model innovation. The positive association between data trading platform adoption and improved resource allocation implies that firms could be leveraging enhanced data access to optimize operational processes and support digital transformation initiatives. This, in turn, might facilitate the integration of sustainability principles, such as ESG practices or circular economy models, into new or evolving digital business strategies.

4.2. Robustness Checks

4.2.1. Endogeneity Test by Instrumental Variable Method

We examined the impact of the policy effect of DFM and construction on the enterprise dimension of corporate financial resilience, and there was no significant reverse causality existing at the logical level. However, problems such as omitted variables and dependent variable construction errors are still unavoidable. To solve the potential endogeneity problem, we referred to the study of Wang and Shao [50] and selected the number of fixed-line telephones per 100 people in 1984 ( T e l ) and the number of postal and telecommunication offices at the end of 1984 as instrumental variables in each city ( P t o ). The selection of this indicator is mainly based on the following considerations: First, the regional fixed-line telephone penetration and the degree of distribution of post and telegraph offices can effectively reflect the level of their information infrastructure and data exchange capacity, and there is a significant correlation between this historically accumulated communication base and the establishment of data trading platforms, which satisfies the requirement of correlation between instrumental variables and endogenous variables. Second, as a historical stock indicator, the communication facility data in 1984 is relatively independent of the current regional economic development and productivity level, which meets the exogenous characteristics that instrumental variables should have [50]. The DML partial linear instrumental variable model is set up using instrumental variables as follows:
R e s i l i e n c e i t = θ 0 D F M i t + g ( X i t ) + U i t
E [ U i t D F M i t , X i t ] = 0
In the “Traditional” two-stage least squares (2SLS) approach, the first-stage regression is usually written explicitly, with the instrumental variable D F M i t being jointly explained with the control variable. To allow the machine to fit the control terms, we constructed the following model:
D F M i t = 0 + 1 T e l i t + 2 P t o i t + m X i t + ν i t
E U i t T e l i t , P t o i t , X i t = 0
T e l i t = r ( X i t ) + ϕ i t
P t o i t = f ( X i t ) + ω i t
E Z i t     X i t ) = E Q i t     X i t ) = 0
Equations (14)–(16) form a “Partial Linearity IV” structure together. While Equations (17)–(20) suggests that the “1984 communication metrics” may also be partially correlated with the current control X i t , which is initially filtered out by machine learning, and then the remaining variance is used to explain D F M i t .
The results are shown in Table 5. Columns (1) to (3) are the instrumental variables ( T e l ) and the control variables’ primary term, secondary term, and regression results, and columns (4) to (6) are the instrumental variables’ ( P t o ) regression results, all of which are significantly positive at the 1% level, proving the robustness of the original hypothesis.

4.2.2. Resetting the DML Model

In order to mitigate possible model setting bias and increase the robustness of the results, we conducted an extended robustness test in the following three dimensions within the framework of DML:
Changing the sample split ratio. In DML estimation, it is usually necessary to split the total sample into training and validation sets (or multi-fold cross-validation) in a certain ratio (e.g., 1:4). This ratio was successively adjusted to 1:2 and 1:7 to test whether the estimation results remain consistent under different sample configurations. If the core parameter estimates obtained under multiple splitting ratios are more stable, it may indicate that the results are somewhat robust to the training and validation set partitioning.
Replacing machine learning algorithms. In the auxiliary regression and main regression, tree models such as random forest were previously used. To eliminate the possibility of algorithmic bias, we introduced multivariate algorithms such as lasso, gradient boosting (GBDT), and neural networks to replace the original methods. The insensitivity to the choice of algorithm is confirmed by comparing the fitted g ^ ( ) and m ^ ( ) and finally the estimated core coefficients under different machine learning algorithms if the results are generally consistent.
Optimizing the model setting. The “partially linear” setting is commonly used in classical DML, but in real situations there may be significant nonlinearities and interaction effects between the control variables X i t . For this reason, we introduced more nonlinear or interaction terms (e.g., X i t 2 ) into the machine learning model or employed models that can capture high-dimensional interactions simultaneously (e.g., XGBoost and deep neural networks), so that g ^ ( ) and m ^ ( ) are more expressive. If the resulting estimates remain robust to the addition of additional interaction settings, then the model settings themselves have limited impact on the conclusions.
Cross-fitting and orthogonalization. To reduce overfitting and ensure n-consistent estimation of θ 0 , K-fold cross-validation is used to fit g ^ ( ) and m ^ ( ) separately and construct on the “external” validation fold:
R e s i l i e n c e i t ~ = R e s i l i e n c e i t + g ^ ( X i t ) ,   D F M i t ~ = D F M i t + m ^ ( X i t )
R e s i l i e n c e i t ~ = θ 0 D F M i t ~ + ω
The results are shown in Table 6, with columns (1) to (2) showing the proportion of changing sample splits; columns (3) to (4) showing the regression results of lasso regression, gradient boosting, and neural network machine learning; and columns (5) to (6) showing the regression results of the interactive DML model. After these three robustness tests, the results remain robust to support the main hypothesis.

4.3. Mechanism Effect Test

To further explore the mechanism of resource dependence theory (RDT) and validate the enterprise’s claim to obtain resources in the data factor market, a mechanism test is constructed for the driving effect of DFM on the optimization of enterprise resource allocation. This test directly examines a core proposition derived from RDT: that institutional arrangements like data trading platforms enhance corporate financial resilience by improving resource acquisition capabilities and reducing dependency risks. By testing these specific resource allocation mechanisms, we provided empirical evidence for how DFM alters the resource dependency patterns that RDT identifies as central to organizational outcomes.
This section use utilizes lasso regression in the context of machine learning to facilitate the analysis of mediation effects [51]; Specifically, H i t denotes mechanism variables to build a base fixed effects model:
R e s i l i e n c e i t = α 1 + θ 1 D F M i t + β 1 X i t + ϑ i + μ t + ε i t 1
H i t = α 2 + θ 2 D F M i t + β 2 X i t + ϑ i + μ t + ε i t 2
R e s i l i e n c e i t = α 3 + θ 3 D F M i t + η H i t + β 3 X i t + ϑ i + μ t + ε i t 3
where ϑ i denotes individual fixed effects, and μ t denotes time fixed effects. Based on the sequential irrelevance assumption, the mediating effects can be decomposed into average indirect effect ACME (Equation (26)), average direct effect ADE (Equation (27)), and total effect (Equation (28)):
R = E R e s i l i e n c e i t D F M i t , H i t 1 R e s i l i e n c e i t D F M i t , H i t 0
N = E R e s i l i e n c e i t 1 , H i t D F M i t R e s i l i e n c e i t 0 , H i t D F M i t
Z = R N
Meanwhile, to verify the robustness of the mediating effect, the following conditional expectation was estimated using machine learning methods:
E R e s i l i e n c e i t | D F M i t , X i t = g 1 ( D F M i t , X i t , ϑ i , μ t )
E H i t | D F M i t , X i t = g 2 ( D F M i t , X i t , ϑ i , μ t )
E R e s i t | D F M i t , H i t , X i t = g 3 ( D F M i t , H i t , X i t , ϑ i , μ t )
Regarding the assessment of resource allocation efficiency among corporate entities, we undertook a meticulous examination of capital ( I n e f f ) and labor ( E L ). Capital allocation efficiency is measured by constructing a modified expected investment model. This model is characterized by the degree of deviation between the actual scale of investment and the theoretical optimal level. A larger deviation implies a less efficient capital allocation. Concurrently, we incorporated finance constraints as a pivotal indicator. By following [52], we used a quantitative metric F C which assesses the extent to which an enterprise is constrained in its financing options. It does so by quantifying the discrepancy between an enterprise’s actual financing scale and its optimal financing needs. The magnitude of the discrepancy is indicative of the enterprise’s financing constraints, reflecting its limited relational capital within the market network. This indicator, predicated on the capacity to access capital, effectively captures the resource expansion effect engendered by the construction of the data trading platform for enterprises. By examining the relationship between the degree of marketization of data elements and the financing constraints of enterprises, it can be verified that the data trading platform enhances the enterprise’s ability to access resources. For example, companies might use improved data flows to enhance supply chain transparency, optimize energy consumption, or design innovative ESG reporting systems, actions that are critical for modern sustainable business models [53]. As demonstrated in Table 7, the collective impact of all intermediation channels is deemed to be substantial at the 10% level. This finding suggests that DFM has a considerable impact on enhancing corporate financial resilience. Consequently, Hypothesis 2 is substantiated.

4.4. Heterogeneity Analysis

4.4.1. Firm-Level Heterogeneity

We examined firm heterogeneity in response to data requirements across ownership structures and organizational scale. And the between-group coefficients were calculated based on bootstrap’s Fisher’s combined test with 1000 repetitions of sampling to obtain. The regression results in Table 8, columns (4) to (5), demonstrate that non-state enterprises exhibit significantly higher regression coefficients compared to state-owned enterprises. This variation stems from differences in data resource endowments, policy assistance, and market behavior patterns. Non-state enterprises demonstrate enhanced market orientation and operational flexibility [54]. They can efficiently capitalize on opportunities presented by data market reforms to strengthen their digital resilience. These enterprises encounter more constraints in digital transformation. The emergence of data market reforms provides them with novel channels to acquire high-quality data resources, resulting in more substantial marginal effects. Moreover, non-state enterprises exhibit stronger innovation incentives and are more inclined to obtain essential data resources through market mechanisms, thereby enhancing their digital resilience. State-owned enterprises typically possess robust policy support and resource integration capabilities. However, they may experience limitations in data utilization efficiency and market responsiveness. In comparison, private enterprises demonstrate greater adaptability and innovation potential, although they may encounter constraints in data acquisition costs and resource availability. Columns (1) to (3) show that the impact of data element commercialization on firms of different sizes in the firm size dimension shows an inverse-increasing difference. The coefficient of small firms is the lowest, while the coefficient of medium firms is higher than that of large firms. This reverse increase reflects the sensitivity of the marketization of data elements to the size of the firm. For small enterprises, the marketization of data elements significantly lowers the threshold for them to acquire data resources, enabling them to break the scale barrier and improve their financial resilience through data empowerment. Medium-sized enterprises, while having a certain resource base, still face challenges in accessing and leveraging data. The commercialization of data elements provides them with more diverse options for data services. Large enterprises, on the other hand, have a strong ability to accumulate data resources, and the marginal effect of data element commercialization is relatively small. However, they can still optimize the efficiency of data resource allocation through market mechanisms.

4.4.2. Industry-Level Heterogeneity

At the industry level, the role of factor marketization construction on corporate financial resilience depends on the degree of industry monopolization and the technological characteristics of the industry. Based on the degree of market monopoly assessed by the industry Lerner index, enterprises in industries with a low degree of monopoly show a stronger policy response, as shown by the contrast between columns (1) and (2) in Table 9. Industries with a high degree of monopoly usually have a high degree of resource concentration and a limited number of market participants, and large enterprises in the industry tend to dominate resources, including key elements such as data resources, capital, and technology. These enterprises have often established a robust data infrastructure, enabling them to achieve efficiency improvement and business optimization through internal data integration. As a result, the role of data trading platforms in such industries may be relatively limited. In contrast, in industries with a low degree of monopoly, due to more intense market competition and a relatively decentralized distribution of resources, enterprises have a higher degree of dependence on external data. Data trading platforms provide enterprises with a fair, transparent, and efficient data circulation channel, reducing the cost of data acquisition and increasing the efficiency of data allocation through market-oriented mechanisms. For small and medium-sized enterprises in these industries, the construction of data trading platforms can meaningfully alleviate the problem of inadequate data resources and help them narrow the capability gap of building financial resilience with leading enterprises in the industry. At the same time, we differentiated the industries to which enterprises belong into high-tech and ordinary industries according to the SEC’s industry categorization guidelines. The analysis results in Table 10, columns (3) and (4), show that firms in high-tech industries benefit more from the commercialization of data elements. Table 11 shows the result of between-group coefficient difference test. These firms have robust data processing capabilities and innovation awareness, enabling them to use market-based mechanisms to acquire key innovative data resources and transform them into financial resilience development advantages. In contrast, firms in ordinary industries have comparatively limited data application capabilities and innovation incentives, which hinder their efficiency in exploiting the data factor market.

4.4.3. Regional-Level Heterogeneity

We also examined the differential impact of data factor commercialization on firm resilience in the regional dimension. The regression results in Table 12 show significant regional heterogeneity, with significant positive effects in the eastern and western regions and negligible effects in the central region. The robust positive effect observed in the eastern region is closely related to the region’s advanced digital infrastructure and mature market environment. Enterprises in the eastern region can take advantage of a well-developed data trading market system to more effectively transform data elements into resiliency benefits. The western region also shows positive policy effects, due to the region’s latecomer advantage in data factor market development and enterprises’ high sensitivity to data factor commercialization policies. Conversely, the negligible effect observed in the central region is indicative of the institutional barriers and policy vacuums the region faces in developing data factor markets, highlighting the need to improve its digital infrastructure and market environment.

5. Findings and Discussions

5.1. Conclusions

We delved into the impact of data factor marketization (DFM) on corporate financial resilience and the interactive effect of institutional environment and resource allocation optimization. Our findings highlight that DFM significantly contributes to corporate financial resilience through market-based mechanisms, while effectiveness depends on the institutional context. To strengthen these results, we applied advanced double machine learning (DML) methods, ensuring a more robust and precise measurement of policy effects [48]. These models reveal that corporate financial resilience is not a “one size fits all” phenomenon but varies depending on both the institutional environment and firm-specific characteristics. Moreover, the institutional environment restricts firms’ ability to capitalize on DFM by limiting their resource allocation efficiency, while firm characteristics play a critical role in amplifying the positive effects of DFM and mitigating potential negative consequences. Our research offers valuable insights for policymakers aiming to leverage data marketization while also managing institutional frameworks for sustained corporate financial resilience in the digital era. These findings indicate that DFM not only enhances resilience against economic shocks but also facilitates sustainable business transformation. By reducing informational barriers and enabling better integration of ESG and circular economy practices, firms can evolve their business models to support long-term sustainability, ultimately contributing to the achievement of broader societal goals.

5.2. Theoretical Contributions

We contributed to the literature in several key areas. Firstly, we enhanced the understanding of the institutional drivers of corporate financial resilience. Traditional research has predominantly focused on internal organizational factors, such as resource redundancy, governance structures, and strategic management capabilities [11,12]. However, with the rapid digitalization of the global economy, the significance of external institutional arrangements and data resource allocation in shaping corporate financial resilience has become increasingly evident. From a theoretical perspective, we integrated resource dependence theory (RDT) and institutional economics, emphasizing how firms can enhance their financial resilience capabilities by acquiring critical data resources through market-based mechanisms. We drew on the Edelman situational framework, which posits that firms’ adaptive capabilities are shaped by external policy architecture and institutional arrangements [55]. By examining DFM as an institutional driver, we explored its role in fostering corporate financial resilience, demonstrating how policy-driven reforms in data markets positively impact firms’ ability to withstand and recover from external shocks. Additionally, we specifically analyzed the mediating role of resource allocation optimization, providing insights into how institutional reforms facilitate efficient data resource integration and enhance organizational adaptability.
Secondly, we integrated the effects of external policy reforms and internal organizational attributes on corporate financial resilience. The institutional environment suggests that policy frameworks and market mechanisms significantly influence firms’ ability to leverage data resources, potentially leading to heterogeneous financial resilience outcomes across different organizational contexts. The institutional environment acts as a critical moderator in the relationship between DFM and corporate financial resilience, as firms operate within distinct regulatory and market conditions that shape their capacity to benefit from data marketization reforms. We extended the applicability of institutional theory to digital resource allocation settings, demonstrating that in data markets, institutional arrangements not only affect resource accessibility but also influence firms’ long-term adaptive capabilities, offering a new perspective [4]. Concurrently, firm characteristics are crucial for organizations to effectively respond to institutional reforms and secure competitive advantages, encompassing factors such as ownership structure, size, industry competition, and geographical location. In the context of data marketization, these characteristics help firms address market uncertainties and operational challenges, accelerating adaptation and enhancing resilience through effective utilization of market-based mechanisms. Therefore, we not only expanded the application of RDT in corporate financial resilience but also provided theoretical support for how firms can optimize resource allocation and enhance adaptability under varying institutional conditions.
Third, we used DML methodology to investigate the causal relationship between DFM and corporate financial resilience. The innovative application of DML techniques not only addresses the endogeneity challenges inherent in estimating policy effects but also provides a robust analytical framework for future institutional research. Given that traditional econometric approaches such as difference-in-differences and instrumental variables may not fully capture the complex, nonlinear interactions between institutional reforms and organizational outcomes, the DML method allows for a more comprehensive and precise evaluation through sophisticated treatment of high-dimensional data and flexible functional forms [56]. This methodological innovation is particularly valuable in the context of data marketization reforms, where policy effects often manifest through multiple channels and vary across different organizational contexts. By incorporating advanced machine learning algorithms and regularization techniques, our approach automatically selects optimal control variables and accounts for complex interaction effects, thereby providing more reliable estimates of policy effects on corporate financial resilience. Future research on institutional reform could build on this methodological framework and extend the DML approach to investigate other policy interventions and their heterogeneous effects in different market environments.

5.3. Practical Contributions

We highlight the following contributions. First, when implementing the marketization of data factors to enhance corporate financial resilience, organizations should prioritize the establishment of standardized data-sharing mechanisms, especially in critical business areas. Such market-based mechanisms help address information asymmetry and facilitate resource integration, thereby enhancing organizational adaptability. Effective data governance and compliance frameworks within marketization initiatives are essential; formal protocols, such as standardized trading mechanisms, together with robust security measures between market participants, can more effectively foster cross-organizational data-sharing and value co-creation. In digital environments, firms should adopt flexible operating structures that balance data accessibility and security to address new market challenges while improving the effectiveness of resource allocation.
Second, firm characteristics are critical for exploiting opportunities to commercialize the data factor. Firms should invest in developing comprehensive data management capabilities through systematic training and operational processes to enhance their technical infrastructure and human capital. These processes should include knowledge of data governance, market mechanisms, and regulatory compliance, enabling firms to be well positioned in the evolving digital economy. Using internal data resources, market-based trading platforms, and collaborative networks, companies can transform raw data into sustainable competitive advantage. Rapid response mechanisms and agile organizational processes are needed to adapt to market changes, and cross-departmental data-sharing frameworks can break down information silos to develop greater operational efficiency and resource optimization. Such collaborative frameworks increase corporate financial resilience and the effectiveness of resource allocation, enabling companies to adapt quickly to changing environments. For example, Haier Group enhanced its financial resilience by participating in the Beijing International Big Data Exchange. Through this platform, Haier connected its industrial internet system COSMO Plat with real-time consumer data, enabling them to dynamically adjust production planning during the supply chain disruptions of 2022–2023.
Third, it is critical for organizations to recognize the moderating role of the institutional environment in shaping the effectiveness of data factor commercialization. Organizations need to regularly assess their institutional context to avoid being constrained by regulatory barriers or market inefficiencies. Adopting a systematic assessment process that includes policy monitoring, market analysis, and stakeholder engagement can be useful in identifying where institutional factors influence resilience outcomes. Such assessments must be used to continuously monitor the implementation of data marketization initiatives and their alignment with policy objectives and technological advances. With such insights, organizations can strategically adjust their data management approaches and operational strategies to maintain sustainability and competitiveness in dynamic markets.

5.4. Limitations and Future Research Directions

We acknowledge several limitations that highlight potential avenues for future research. We begin with the fact that research has mainly focused on the static effects of DFM, ignoring the dynamic evolution of policy implementation at different stages of development. The effectiveness of marketization initiatives is expected to vary over time, presenting different challenges and opportunities at different stages of policy implementation, including its introduction, development, and maturation. For example, the initial stages may focus on building infrastructure and regulatory frameworks, while later stages may focus on optimizing and deepening market mechanisms. Consequently, future research could adopt a dynamic perspective, using longitudinal designs to examine the mechanisms through which the commercialization of data factors influences corporate financial resilience at different points in time and its long-term effects on organizational adaptation. This approach would facilitate a more comprehensive understanding of how institutional reforms shape sustainable corporate financial resilience.
Second, our sample is limited to Chinese firms, which may limit the generalizability of the findings. Future research should extend this analysis by incorporating cross-country comparisons to examine how different institutional contexts influence the role of digital transformation in driving sustainable business practices. For example, investigating the impact of DFM on ESG performance and circular economic strategies in regions such as the EU and the US would further validate and enrich our understanding of the global implications of digital governance. While China is a pioneer of DFM, which provides a representative institutional setting for studying policy-driven reforms, significant differences in regulatory frameworks and market development across countries may influence the effectiveness of data marketization and its impact on corporate financial resilience. Therefore, future studies should consider expanding the sample to include firms from different international contexts to validate the applicability and robustness of our findings. In addition, cross-country comparative studies would be beneficial to uncover the heterogeneous effects of DFM on corporate financial resilience across different institutional and market environments.
Third, while DML offers methodological advantages, its application in policy impact assessment remains relatively nascent. Beyond the current implementation, more sophisticated machine learning techniques and alternative model specifications could potentially improve the precision of our estimates. For example, the selection of control variables and functional forms could be further optimized using advanced feature selection algorithms and neural network architectures [57]. In addition, the integration of other causal inference methods with machine learning approaches could provide more robust results. Future research could explore more advanced methodological frameworks, including ensemble learning and deep learning models, to better capture the complex interactions between institutional reforms and organizational outcomes, while addressing potential estimation challenges in policy evaluation contexts.
Forth, future research should explicitly integrate sustainable development perspectives into this research direction. Scholars are encouraged to explore how digital transformation and data marketization can further enable sustainable business practices, such as circular economy models, robust ESG strategies, and SDG-driven initiatives. Combining resilience frameworks with sustainability considerations may reveal additional mechanisms through which firms not only survive but also thrive in a sustainable global market. Cross-national comparisons and detailed case studies in this regard could provide deeper insights into the synergies between digital governance, resource allocation, and long-term sustainable business model innovation.

Author Contributions

Methodology, F.S. and Y.H.; Software, F.S.; Validation, F.S. and C.L.; Investigation, F.S.; Data curation, F.S.; Writing—original draft, F.S.; Writing—review & editing, Y.H. and C.L.; Supervision, Y.H. All authors have read and agreed to the published version of the manuscript.

Funding

This research received no external funding.

Data Availability Statement

The datasets used and analyzed during the article are available from the corresponding author upon reasonable request.

Conflicts of Interest

The authors declare no conflict of interest.

References

  1. Wang, Y.; Tang, J.; Li, C. How Does Digital Transformation Affect Corporate Resilience: A Moderation Perspective Study. Appl. Econ. 2025, 57, 121–134. [Google Scholar] [CrossRef]
  2. Huang, Y.; Lau, C. Can Digital Transformation Promote the Green Innovation Quality of Enterprises? Empirical Evidence from China. PLoS ONE 2024, 19, e0296058. [Google Scholar] [CrossRef]
  3. Folke, C.; Carpenter, S.R.; Walker, B.; Scheffer, M.; Chapin, T.; Rockström, J. Resilience Thinking: Integrating Resilience, Adaptability and Transformability. Ecol. Soc. 2010, 15, 20. [Google Scholar] [CrossRef]
  4. Williams, T.A.; Gruber, D.A.; Sutcliffe, K.M.; Shepherd, D.A.; Zhao, E.Y. Organizational Response to Adversity: Fusing Crisis Management and Resilience Research Streams. Acad. Manag. Ann. 2017, 11, 733–769. [Google Scholar] [CrossRef]
  5. Ma, B.; Zhang, J. Tie Strength, Organizational Resilience and Enterprise Crisis Management: An Empirical Study in Pandemic Time. Int. J. Disaster Risk Reduct. 2022, 81, 103240. [Google Scholar] [CrossRef]
  6. Pagani, M. Digital Business Strategy and Value Creation: Framing the Dynamic Cycle of Control Points. MIS Q. 2013, 37, 617–632. [Google Scholar] [CrossRef]
  7. Wang, W.; Xiao, D. Marketization of Data Elements and Enterprise Green Governance Performance: A Quasi-natural Experiment Based on Data Trading Platforms. Manag. Decis. Econ. 2024, 46, 1686–1700. [Google Scholar] [CrossRef]
  8. Gheibi, S.; Fay, S. The Impact of Supply Disruption Risk on a Retailer’s Pricing and Procurement Strategies in the Presence of a Substitute Product. J. Retail. 2021, 97, 359–376. [Google Scholar] [CrossRef]
  9. Hillman, A.J.; Withers, M.C.; Collins, B.J. Resource Dependence Theory: A Review. J. Manag. 2009, 35, 1404–1427. [Google Scholar] [CrossRef]
  10. Liu, M.; Zhang, Y.; Zhou, D. Double/Debiased Machine Learning for Logistic Partially Linear Model. Econom. J. 2021, 24, 559–588. [Google Scholar] [CrossRef]
  11. Akgün, A.E.; Keskin, H. Organisational Resilience Capacity and Firm Product Innovativeness and Performance. Int. J. Prod. Res. 2014, 52, 6918–6937. [Google Scholar] [CrossRef]
  12. Lengnick-Hall, C.A.; Beck, T.E.; Lengnick-Hall, M.L. Developing a Capacity for Organizational Resilience through Strategic Human Resource Management. Hum. Resour. Manag. Rev. 2011, 21, 243–255. [Google Scholar]
  13. Bamiatzi, V.; Bozos, K.; Cavusgil, S.T.; Hult, G.T.M. Revisiting the Firm, Industry, and Country Effects on Profitability under Recessionary and Expansion Periods: A Multilevel Analysis. Strateg. Manag. J. 2016, 37, 1448–1471. [Google Scholar] [CrossRef]
  14. Meyer, A.D.; Brooks, G.R.; Goes, J.B. Environmental Jolts and Industry Revolutions: Organizational Responses to Discontinuous Change. Strateg. Manag. J. 1990, 14, 93–110. [Google Scholar]
  15. Deverell, E.; Olsson, E.-K. Organizational Culture Effects on Strategy and Adaptability in Crisis Management. Risk Manag. 2010, 12, 116–134. [Google Scholar] [CrossRef]
  16. Huang, Y.; Xiong, N.; Liu, C. Renewable Energy Technology Innovation and ESG Greenwashing: Evidence from Supervised Machine Learning Methods Using Patent Text. J. Environ. Manag. 2024, 370, 122833. [Google Scholar] [CrossRef]
  17. Hannila, H.; Silvola, R.; Harkonen, J.; Haapasalo, H. Data-Driven Begins with DATA.; Potential of Data Assets. J. Comput. Inf. Syst. 2022, 62, 29–38. [Google Scholar] [CrossRef]
  18. Basukie, J.; Wang, Y.; Li, S. Big Data Governance and Algorithmic Management in Sharing Economy Platforms: A Case of Ridesharing in Emerging Markets. Technol. Forecast. Soc. Chang. 2020, 161, 120310. [Google Scholar] [CrossRef]
  19. Zheng, X.; Griffith, D.A.; Ge, L.; Benoliel, U. Effects of Contract Ambiguity in Interorganizational Governance. J. Mark. 2020, 84, 147–167. [Google Scholar] [CrossRef]
  20. Lv, D.D.; Schotter, A.P.J. The Dark Side of Powerful Platform Owners: Aspiration Adaptations of Digital Firms. Acad. Manag. Perspect. 2024, in press. [Google Scholar] [CrossRef]
  21. Janssen, M.; Estevez, E. Lean Government and Platform-Based Governance—Doing More with Less. Gov. Inf. Q. 2013, 30, S1–S8. [Google Scholar] [CrossRef]
  22. ALqodsi, E.M. Extended Producer Responsibility in E-waste Recycling: A Secure Path to a Sustainable Future for UAE. Sustain. Dev. 2025, 33, 309–318. [Google Scholar] [CrossRef]
  23. Chen, W.; Wang, Y.; Wu, D.; Yin, X. Can the Establishment of a Personal Data Protection System Promote Corporate Innovation? Res. Policy 2024, 53, 105080. [Google Scholar]
  24. Fossen, F.M.; Sorgner, A. New Digital Technologies and Heterogeneous Wage and Employment Dynamics in the United States: Evidence from Individual-Level Data. Technol. Forecast. Soc. Chang. 2022, 175, 121381. [Google Scholar]
  25. Holling, C.S. Resilience and Stability of Ecological Systems; Annual Reviews: San Mateo, CA, USA, 1973. [Google Scholar]
  26. Vogus, T.J.; Sutcliffe, K.M. Organizational Resilience: Towards a Theory and Research Agenda. In Proceedings of the 2007 IEEE International Conference on Systems, Man and Cybernetics, Montréal, QC, Canada, 7–10 October 2007; Institute of Electrical and Electronics Engineers: Piscataway, NJ, USA, 2007; pp. 3418–3422. [Google Scholar]
  27. Kavadis, N.; Thomsen, S. Sustainable Corporate Governance: A Review of Research on Long-term Corporate Ownership and Sustainability. Corp. Gov. 2023, 31, 198–226. [Google Scholar] [CrossRef]
  28. Ding, W.; Levine, R.; Lin, C.; Xie, W. Corporate Immunity to the COVID-19 Pandemic. J. Financ. Econ. 2021, 141, 802–830. [Google Scholar]
  29. Gittell, J.H.; Cameron, K.; Lim, S.; Rivas, V. Relationships, Layoffs, and Organizational Resilience: Airline Industry Responses to September 11. J. Appl. Behav. Sci. 2006, 42, 300–329. [Google Scholar] [CrossRef]
  30. Ortiz-de-Mandojana, N.; Bansal, P. The Long-term Benefits of Organizational Resilience through Sustainable Business Practices. Strateg. Manag. J. 2016, 37, 1615–1631. [Google Scholar] [CrossRef]
  31. Lins, K.V.; Servaes, H.; Tamayo, A. Social Capital, Trust, and Firm Performance: The Value of Corporate Social Responsibility during the Financial Crisis. J. Financ. 2017, 72, 1785–1824. [Google Scholar] [CrossRef]
  32. Pal, R.; Torstensson, H.; Mattila, H. Antecedents of Organizational Resilience in Economic Crises—An Empirical Study of Swedish Textile and Clothing SMEs. Int. J. Prod. Econ. 2014, 147, 410–428. [Google Scholar]
  33. Erol, O.; Sauser, B.J.; Mansouri, M. A Framework for Investigation into Extended Enterprise Resilience. Enterp. Inf. Syst. 2010, 4, 111–136. [Google Scholar] [CrossRef]
  34. Dong, H.; Xing, G. Enhancing Organisational Resilience of ‘Gazelle Enterprises’ through Network Embeddedness and Knowledge Search: The Moderating Effect of Digital Transformation. Technol. Anal. Strateg. Manag. 2024, 36, 4628–4642. [Google Scholar] [CrossRef]
  35. Napier, E.; Liu, S.Y.; Liu, J. Adaptive Strength: Unveiling a Multilevel Dynamic Process Model for Organizational Resilience. J. Bus. Res. 2024, 171, 114334. [Google Scholar]
  36. Yang, X.; Yao, Y.; Tian, K.; Jiang, W.; Xing, Q.; Yang, J.; Liu, C. Disaster Response Strategies of Governments and Social Organizations: From the Perspective of Infrastructure Damage and Asymmetric Resource Dependence. Heliyon 2023, 9, e20432. [Google Scholar] [PubMed]
  37. Malatesta, D.; Smith, C.R. Lessons from Resource Dependence Theory for Contemporary Public and Nonprofit Management. Public Adm. Rev. 2014, 74, 14–25. [Google Scholar] [CrossRef]
  38. Pfeffer, J. A Resource Dependence Perspective on Intercorporate Relations. Intercorporate Relat. Struct. Anal. Bus. 1987, 1, 25–55. [Google Scholar]
  39. Drees, J.M.; Heugens, P.P.M.A.R. Synthesizing and Extending Resource Dependence Theory: A Meta-Analysis. J. Manag. 2013, 39, 1666–1698. [Google Scholar] [CrossRef]
  40. McIvor, R. How the Transaction Cost and Resource-Based Theories of the Firm Inform Outsourcing Evaluation. J. Oper. Manag. 2009, 27, 45–63. [Google Scholar] [CrossRef]
  41. Holland, J. Private Voluntary Disclosure, Financial Intermediation and Market Efficiency. Bus. Financ. Acc. 1998, 25, 29–68. [Google Scholar] [CrossRef]
  42. Chen, F.; Hope, O.-K.; Li, Q.; Wang, X. Financial Reporting Quality and Investment Efficiency of Private Firms in Emerging Markets. Account. Rev. 2011, 86, 1255–1288. [Google Scholar]
  43. Strauch, M.; Pidun, U.; zu Knyphausen-Aufsess, D. Process Matters–How Strategic Decision-Making Process Characteristics Impact Capital Allocation Efficiency. Long Range Plan. 2019, 52, 202–220. [Google Scholar]
  44. Yang, J.; Jiang, Y.; Chen, H.; Gan, S. Digital Finance and Chinese Corporate Labor Investment Efficiency: The Perspective of Financing Constraints and Human Capital Structure. Front. Psychol. 2022, 13, 962806. [Google Scholar]
  45. Obrenovic, B.; Du, J.; Godinic, D.; Tsoy, D.; Khan, M.A.S.; Jakhongirov, I. Sustaining Enterprise Operations and Productivity during the COVID-19 Pandemic: “Enterprise Effectiveness and Sustainability Model”. Sustainability 2020, 12, 5981. [Google Scholar] [CrossRef]
  46. Choi, T.Y.; Krause, D.R. The Supply Base and Its Complexity: Implications for Transaction Costs, Risks, Responsiveness, and Innovation. J. Oper. Manag. 2006, 24, 637–652. [Google Scholar]
  47. Knaus, M.C. Double Machine Learning-Based Programme Evaluation under Unconfoundedness. Econom. J. 2022, 25, 602–627. [Google Scholar]
  48. Chernozhukov, V.; Chetverikov, D.; Demirer, M.; Duflo, E.; Hansen, C.; Newey, W.; Robins, J. Double/Debiased Machine Learning for Treatment and Structural Parameters. Econom. J. 2018, 21, C1–C68. [Google Scholar] [CrossRef]
  49. Ling, S.; Jin, S.; Wang, H.; Zhang, Z.; Feng, Y. Transportation Infrastructure Upgrading and Green Development Efficiency: Empirical Analysis with Double Machine Learning Method. J. Environ. Manag. 2024, 358, 120922. [Google Scholar]
  50. Wang, L.; Shao, J. The Energy Saving Effects of Digital Infrastructure Construction: Empirical Evidence from Chinese Industry. Energy 2024, 294, 130778. [Google Scholar]
  51. Farbmacher, H.; Huber, M.; Lafférs, L.; Langen, H.; Spindler, M. Causal Mediation Analysis with Double Machine Learning. Econom. J. 2022, 25, 277–300. [Google Scholar]
  52. Fee, C.E.; Hadlock, C.J.; Pierce, J.R. Investment, Financing Constraints, and Internal Capital Markets: Evidence from the Advertising Expenditures of Multinational Firms. Rev. Financ. Stud. 2009, 22, 2361–2392. [Google Scholar]
  53. Kurrahman, T.; Tsai, F.M.; Sethanan, K.; Chen, C.; Tseng, M. Assessing a Hierarchical Structure for Circular Supply Chain Management Performance: Improving Firms’ Eco-innovation and Technological Performance. Bus. Strat. Environ. 2025, 34, 2035–2064. [Google Scholar] [CrossRef]
  54. Song, J.; Wang, R.; Cavusgil, S.T. State Ownership and Market Orientation in China’s Public Firms: An Agency Theory Perspective. Int. Bus. Rev. 2015, 24, 690–699. [Google Scholar]
  55. Edelman, L.B.; Suchman, M.C. The Legal Environments of Organizations. Annu. Rev. Sociol. 1997, 23, 479–515. [Google Scholar] [CrossRef]
  56. Liu, X.; Zhang, J.; Pei, Z. Machine Learning for High-Entropy Alloys: Progress, Challenges and Opportunities. Prog. Mater. Sci. 2023, 131, 101018. [Google Scholar]
  57. Hair, J.F., Jr.; Fávero, L.P.; Junior, W.T.; Duarte, A. Deterministic and Stochastic Machine Learning Classification Models: A Comparative Study Applied to Companies’ Capital Structures. Mathematics 2025, 13, 411. [Google Scholar] [CrossRef]
Figure 1. Theory model and hypothesis.
Systems 13 00292 g001
Figure 2. Correlation matrix.
Systems 13 00292 g002
Figure 3. Interrelationships between the key financial indicators.
Systems 13 00292 g003
Figure 4. Relationship between DFM and financial resilience. *** indicates significance at the 1% level.
Systems 13 00292 g004
Table 1. Pseudo-code diagram of the DML algorithm.
Algorithm: Double Machine Learning (DML)
1: Input: Data R e s i l i e n c e it ,   D F M i t ,   X it i = 1 N // Response, treatment, and control variables;   m ^ · ,     g ^ · initial ML estimators //For nuisance parameter estimation;
K sample split number;   E test interval; α learning rate // For gradient updates;
2: for k = 1 to K   do//Cross-fitting iterations
3:     Split sample into I _ k and I _ ( k )   // Create training and testing folds
4:     for each i   I _ ( k )   do // Train on complementary sample
         Train first stage models: // Estimate nuisance functions using machine learning methods
m ^ _ k     M L _train ( { D F M i t ,   X it } )
g ^ _ k   ← ML_train ( { R e s i l i e n c e it ,   X it } )
5:     end for
6:     for each i     I _ k   do // Compute estimates on test fold
7:     if sample size > threshold then Compute residuals: // Calculate orthogonal residuals
V ^ i t = D F M i t m ^ _ k ( X it ) // Treatment residual
Û ^ i t = R e s i l i e n c e it g ^ _ k ( X it ) // Outcome residual
8:     end if
9:     Set: // Compute influence function
ψ i = V ^ it Û it   /   E [ V ^ i t 2 ]   // Orthogonalized score
10:    end for
11:    if convergence check then estimate local parameters: // Verify estimation quality. Calculate local parameter estimates and variance
θ ^   _ k = ( 1 / | I _ k | ) Σ i I _ k   ψ i
σ ^ 2 _ k = ( 1 / | I _ k | ) Σ i I _ k   ( ψ i θ ^ _ k ) 2
12:    end if
13:    for each parameter update do Update ML models: // Improve ML models. // Gradient descent updates
m ^ _ k     m ^ _ k α L _ m / m ^ _ k // Update first stage
g ^ _ k   g ^ _ k α L _ g / g ^ _ k // Update second stage
14:    end for
15:    if k = K then Aggregate estimates: // Final aggregation. Combine estimates across folds
θ ^ = ( 1 / K ) Σ k   θ ^ _ k // Average treatment effect
S E ( θ ^ ) = ( ( 1 / K 2 ) Σ k   σ ^ 2 _ k ) // Standard error
16:    end if
17: end for
18: if asymptotic_normality_check then Verify conditions: // Verify theoretical properties. Check asymptotic behavior
p * = ( 1 / N ) Σ i t   V i t   U i t   /   E [ V ^ i t 2 ]     N ( 0 , Σ ) // Main term
q * = ( 1 / N ) Σ i t [ m ^ ( X i t ) m ( X i t ) ] [ g ^ ( X i t ) g ( X i t ) ]     0 // Remainder
19: end if
20: Return θ ^ , S E ( θ ^ ) // Final estimates with standard errors
Table 2. Variables definition.
VariablesDefinition
Dependent
Variable
R e s i l i e n c e Financial resilience measure combining three-year sales growth stability and stock return volatility through entropy method
Independent Variable D F M Binary indicator (1 = data exchange platform exists in company’s city; 0 = otherwise)
Control
Variables
S i z e Natural logarithms of total assets
L e v Total liabilities divided by total assets (leverage ratio)
R o e Net profit divided by average shareholders’ equity (return on equity)
C a s h f l o w Operating cash flow divided by total assets (cash flow ratio)
F i x e d Net fixed assets divided by total assets (asset tangibility)
B o a r d Natural logarithm of board size
I n d e p Proportion of independent directors on board
T o p 5 Percentage of shares held by top five shareholders
F i r m A g e Natural logarithm of firm age in years
S o e State ownership dummy (1 = state-owned; 0 = otherwise)
R o a Net profit divided by average total assets (return on assets)
T o b i n Q Market value plus debt divided by book value of assets
I n v Inventory divided by total assets (inventory intensity)
F i x e d Fixed assets divided by total assets (capital intensity)
M s h a r e Percentage of shares held by executives (managerial ownership)
N s t Percentage of shares held by institutional investors
M f e e Administrative expenses divided by operating income
O c c u p y Other receivables divided by total assets
Table 3. Descriptive statistics.
VariablesNMeanSDMinMedianMax
R e s i l i e n c e 33,5071.49 0.18 0.20 1.49 1.89
D F M 33,5070.32 0.47 0.00 0.00 1.00
S i z e 33,50722.20 1.33 14.94 22.00 28.64
L e v 33,5070.41 0.21 0.01 0.40 1.96
R o a 33,5070.04 0.08 −1.32 0.04 1.28
R o e 33,5070.06 0.22 −14.82 0.08 2.38
A t o 33,5070.66 0.54 −0.05 0.55 12.37
C a s h f l o w 33,5070.05 0.07 −0.89 0.05 0.88
I n v 33,5070.14 0.13 0.00 0.11 0.94
F i x e d 33,5070.21 0.16 0.00 0.17 0.97
B o a r d 33,5072.12 0.20 1.10 2.20 2.89
I n d e p 33,5070.38 0.06 0.00 0.36 0.80
D u a l 33,5070.30 0.46 0.00 0.00 1.00
T o p 5 33,5070.54 0.16 0.01 0.54 0.99
T o b i n q 33,5072.09 4.59 0.62 1.59 715.94
S o e 33,5070.36 0.48 0.00 0.00 1.00
F i r m a g e 33,5072.92 0.34 0.69 2.94 4.17
I n s t 33,5070.44 0.25 0.00 0.45 1.01
M s h a r e 33,50715.01 20.38 0.00 1.66 89.99
O c c u p y 33,5070.01 0.03 0.00 0.01 0.80
Table 4. Main regression.
(1)
R e s i l i e n c e
(2)
R e s i l i e n c e
(3)
R e s i l i e n c e
D F M 0.0169 ***
(0.0027)
0.0166 ***
(0.0028)
0.0191 ***
(0.0027)
Control VariablesYESYESYES
Squared Control VariablesNOYESYES
Year FENONOYES
Firm FENONOYES
Adj. R20.2130.2480.275
AIC15,82415,24114,936
N33,50733,50733,507
Note: Year FE refers to year-fixed effects, and Firm FE refers to firm-fixed effects. Standard errors clustered at the firm level are reported in parentheses. *, **, and *** indicate significance at the 10%, 5%, and 1% levels, respectively. Adj. R2 represents the adjusted R-squared value, and AIC refers to Akaike Information Criterion, with lower values indicating better model fit. Results are obtained using Python 3.13.
Table 5. Endogeneity test.
(1) T e l (2) T e l (3) T e l (4) P t o (5) P t o (6) P t o
D F M 0.0330 ***
(0.0001)
0.0323 ***
(0.0001)
0.0430 ***
(0.0002)
0.0417 ***
(0.0140)
0.0413 ***
(0.0137)
0.0427 ***
(0.0198)
Control VariablesYESNOYESYESNOYES
Squared Control VariablesNOYESYESNOYESYES
Year FEYESYESYESYESYESYES
Firm FEYESYESYESYESYESYES
N33,50733,50733,50733,50733,50733,507
Note: Year FE refers to year-fixed effects, and Firm FE refers to firm-fixed effects. Standard errors clustered at the firm level are reported in parentheses. *, **, and *** indicate significance at the 10%, 5%, and 1% levels, respectively.
Table 6. Resetting DML.
(1)
R e s i l i e n c e
(2)
R e s i l i e n c e
(3)
R e s i l i e n c e
(4)
R e s i l i e n c e
(4)
R e s i l i e n c e
(5)
R e s i l i e n c e
D F M 0.0230 ***
(0.0040)
0.0249 ***
(0.0024)
0.0495 ***
(0.0010)
0.0258 ***
(0.0009)
1.3243 **
(0.6258)
1.7153 *
(0.8778)
Control VariablesYESYESYESYESYESYES
Squared Control VariablesYESYESYESYESYESYES
Year FEYESYESYESYESYESYES
Firm FEYESYESYESYESYESYES
N33,50733,50733,50733,50733,50733,507
Note: Year FE refers to year-fixed effects, and Firm FE refers to firm-fixed effects. Standard errors clustered at the firm level are reported in parentheses. *, **, and *** indicate significance at the 10%, 5%, and 1% levels, respectively.
Table 7. Mechanism effect test.
(1) Aggregate Effect(2) Direct Effect(3) Indirect Effect
I n e f f 0.0437 ***0.0429 ***0.0018 *
E L 0.0437 ***0.0441 ***0.0015 *
F C 0.0437 ***0.0394 ***0.0020 *
Note: *, **, and *** indicate significance at the 10%, 5%, and 1% levels, respectively.
Table 8. Firm-level heterogeneity.
(1) Big(2) Medium(3) Small(4) State-Owned(5) Private
D F M 0.026 ***
(0.0049)
0.031 ***
(0.0036)
0.041 ***
(0.0026)
0.034 ***
(0.0031)
0.044 ***
(0.0028)
Control VariablesYESYESYESYESYES
Year FEYESYESYESYESYES
Firm FEYESYESYESYESYES
N10,35710,35710,35710,69220,379
Note: Standard errors clustered at the firm level are reported in parentheses. *, **, and *** indicate significance at the 10%, 5%, and 1% levels, respectively.
Table 9. Firm-level heterogeneity “between-group coefficient difference test”.
GroupDifference in CoefficientsT-Valuep-Value
Big vs. Medium−0.0054−0.88810.3754
Medium vs. Small−0.0093−0.20930.0362 ***
Small vs. Big−0.0147−2.65000.0081 ***
State-owned vs. Private0.01052.56150.0119 ***
Note: The coefficient difference p-values between groups are calculated using Fisher’s combined test with bootstrap method, based on 1000 resampling iterations. *, **, and *** indicate significance at the 10%, 5%, and 1% levels, respectively.
Table 10. Industry-level heterogeneity.
(1) Low Monopoly(2) High Monopoly(3) High Tech(4) Ordinary
D F M 0.0397 ***
(0.003)
0.0391 ***
(0.002)
0.0409 ***
(0.003)
0.0271 ***
(0.003)
Control VariablesYESYESYESYES
Squared Control VariablesYESYESYESYES
Year FEYESYESYESYES
Firm FE17,69013,38119,15811,913
Note: Standard errors clustered at the firm level are reported in parentheses. *, **, and *** indicate significance at the 10%, 5%, and 1% levels, respectively.
Table 11. Industry-level heterogeneity “between-group coefficient difference test”.
GroupDifference in CoefficientsT-Valuep-Value
Low monopoly vs. High monopoly−0.0137−2.04510.0067 ***
High tech vs. Ordinary0.01383.25270.0011 ***
Note: The coefficient difference p-values between groups are calculated using Fisher’s combined test with bootstrap method, based on 1000 resampling iterations. *, **, and *** indicate significance at the 10%, 5%, and 1% levels, respectively.
Table 12. Regional-level heterogeneity.
(1) Eastern Region(2) Central Region(3) Western Region
D F M 0.0197 ***
(0.0057)
0.0121 *
(0.0071)
0.0392 ***
(0.0026)
Control VariablesYESYESYES
Squared Control VariablesYESYESYES
Year FEYESYESYES
Firm FE4433423022,408
Note: Standard errors clustered at the firm level are reported in parentheses. *, **, and *** indicate significance at the 10%, 5%, and 1% levels, respectively.
Disclaimer/Publisher’s Note: The statements, opinions and data contained in all publications are solely those of the individual author(s) and contributor(s) and not of MDPI and/or the editor(s). MDPI and/or the editor(s) disclaim responsibility for any injury to people or property resulting from any ideas, methods, instructions or products referred to in the content.

