Abstract
Achieving digital transformation in enterprises is vital for advancing the digital economy. Using the World Bank’s China Enterprise Survey data, this study investigates how local digital economic growth impacts enterprise transformation. Findings suggest that higher local digital growth significantly boosts enterprise transformation, thereby improving short-term operations and long-term innovation. Remarkably, threshold regression reveals a stronger impact on larger enterprises and those with higher human capital. Additional analyses demonstrate that effective access to digital dividends enhances enterprises’ production, R&D, and management. These results offer guidance for local governments, supporting digital shifts and helping enterprises tailor transformation strategies.
1. Introduction
In recent years, the global demand for advancing the digital economy has been rising. The “digital economy” encompasses economic activities powered by digital technologies like the internet, mobile devices, artificial intelligence, and the blockchain. This sector has the potential to boost overall economic growth and generate new employment opportunities. Furthermore, serving as a platform for innovation, productivity enhancement, and competitiveness, digitalization has improved access to services and information, particularly in underserved regions [1]. At the micro level, the advancement of the digital economy relies on enterprises as vehicles for digital transformation. According to the 2023 China Enterprise Digital Transformation Index by Accenture, the contribution of enterprise digital transformation to the growth of the digital economy in China remained consistently above 70% between 2015 and 2020. Especially in 2020, post-COVID-19 pandemic, the emergence of new business models such as e-commerce, the platform economy, and online work accelerated, prompting enterprises to pursue digital transformation to adapt to market developments. Consequently, the contribution of enterprise digitalization to the digital economic growth rose to 80%.1 Clearly, the successful execution of enterprise digital transformation is crucial for advancing the digital economy.
How should we drive enterprises to undergo digital transformation? Enterprise digital transformation is a complex and dynamic process in which the interplay of internal and external factors is crucial [2], such as digital environment awareness [3], organizational agility [4], organizational structure [5], business ecosystems [6], managerial efficiency [7], business ecosystems [6], managerial efficiency [8], organizational culture [9], and learning capability [10]. Together, these capabilities help organizations to access key resources for digital transformation in a competitive market. However, empirical observations show that many organizations actively pursuing digital transformation fail to achieve performance improvements, suggesting the potential limitations of existing internally focused frameworks.
This paper argues that the primary prerequisite for successful enterprise digital transformation is the level of support for digital economic development in the external environment in which the enterprise operates; that is, the digitalization level of the region where the enterprise is situated. The digitalization level of a region manifests primarily through the development level of its digital infrastructure and the enabling digital transactions and media. Specifically, first, digital infrastructure characterized by digitalization, networking, and intelligence can greatly enhance the capabilities and efficiencies of enterprises in temporal and spatial information acquisition, dissemination, and data processing within a region [11]. This, in turn, reduces the costs and complexities associated with the application and diffusion of next-generation digital technologies in enterprises. Second, the growth of digital transactions and media cultivates mature digital platforms and ecosystems [12], enabling regional producers and consumers to integrate digital resources at lower costs and deepening the integration of digital technologies with other production factors, thus broadening and deepening enterprise digital transformation [13].
Moreover, the main motivation for companies’ willingness to undergo digital transformation is the potential to reap digital dividends through the effective use of data resources. In the short term, the growth of the local digital economy unleashes digital dividends, fostering synergy between data resources and traditional production factors. This synergy lowers operational costs, boosts production efficiency, and consequently enhances business performance [14]. In the long term, the development of the local digital economy will transform the internal and external environments of enterprise production, operations, and management. This transformation compels enterprises to more effectively capture, integrate, and utilize innovation elements across production, service, distribution, and R&D, ultimately enhancing their innovation capabilities [15,16].
However, realizing digital dividends from enterprise digitalization is not instantaneous. According to a McKinsey report, only 20% of digital transformation efforts succeed, highlighting an 80% failure rate.2 This suggests that many enterprises have not yet established effective mechanisms to systematically capture digital dividends in their digital transformation processes. Utilizing microdata from the “World Bank China Investment Survey”, this study empirically investigates the relationship between local digital economic growth, enterprise digital transformation, and the acquisition of digital dividends. The empirical findings indicate that local digital economic growth significantly aids enterprises in achieving digital transformation, leading to notable improvements in short-term business performance and long-term product innovation. As enterprise size increases and human capital levels rise, the supportive role of local digital economic development in their digital transformation becomes more pronounced. Further mechanism analysis reveals that the acquisition of digital dividends is primarily achieved through the effective empowerment of production operations, research and development, and management processes by the local digital economy.
This research may contribute to the existent literature in three aspects: Firstly, our research not only expands the analysis of the driving factors for enterprise digital transformation but also empirically examines the connection between macro-level digital ecosystem cultivation and micro-level enterprise digital transformation. Previous studies have predominantly explored the driving factors for enterprise digital transformation from the perspectives of individuals and organizations. While the individual dimension includes factors such as the digital leadership capabilities and levels of management [17,18], the digital literacy and skills of employees [19,20,21], organizational dynamic capabilities [2,22], and organizational culture [23,24], few studies have addressed the impact of macro factors, such as government support [25] and public policy [26], on enterprise digital transformation. At the macro level, current studies typically focus on relatively indirect macro factors influencing enterprise digital transformation. At the micro level, few studies have explicitly elucidated the transmission mechanisms through which changes in external digital environments affect the digital transformation behaviors of local enterprises. Based on the practice of digital development in China, this article measures the level of local digital resource supplies and demonstrates that cultivating a local digital ecosystem is indeed an important factor in advancing enterprise digital transformation.
Secondly, this paper empirically tests two crucial threshold conditions for the success of enterprise digital transformation facilitated by local digital economic growth: enterprise size and human resource level. By incorporating a structured analysis perspective, this study provides evidence for local governments in selecting targets for digital transformation support and for different types of enterprises in formulating digital transformation strategies.
Thirdly, this study elucidates the mechanisms behind enterprise digital transformation. The existing literature tends to either analyze the effects of specific digital software or focus on the digital transformation of business areas within enterprises. In contrast, this paper develops a theoretical framework for understanding successful digital transformation mechanisms across three dimensions: business digitalization, technology digitalization, and management digitalization. This approach unveils the “black box” of enterprise digital transformation in the digital economy era. Empirical tests of these mechanisms’ effectiveness provide practical references for enterprises in devising specific digital transformation strategies.
The remaining content of this paper is structured as follows: Section 2 presents the theory and research hypotheses; Section 3 describes the data and methods employed; Section 4 presents the regression results for the relationship between Local Digital Economy Growth, enterprise digital transformation, and digital dividends; and Section 5 and Section 6 provide the discussion and conclusions.
2. Theory and Research Hypothesis
2.1. Local Digital Economic Growth and Enterprise Digital Transformation
In the era of digital economy, enterprises exhibit a strong willingness to undergo digital transformation. With the advent of the digital economy era, a rich and intricate web of connections centered around data has emerged among enterprises, consumers, products, and services [27,28]. Consequently, there has been an explosive, exponential growth in data information [29], significantly increasing the challenge for enterprises to promptly uncover valuable market insights from vast information sources [30]. Under such circumstances, disparities in capabilities related to information acquisition and processing become more pronounced, giving rise to new instances of information asymmetry, which in turn pressure enterprises to reform their governance and operational practices in a bid to achieve digital transformation [31].
It is worth noting that the success of enterprise digital transformation is contingent upon the support of regional digital economic development. The cornerstone of fostering a thriving regional digital economy lies in the extensive promotion and deepening of the application of next-generation information technologies such as big data, cloud computing, and artificial intelligence. This enables enterprises within a region to access, disseminate, and process information across time and space at near-zero costs [11]. On the one hand, the enhancement of digital infrastructure elevates the fluidity of data elements, facilitating the balanced distribution of production factors and optimizing the combination structure. This, in turn, enables the profound integration of data elements with practical factors such as labor, management, and technology [32,33], thereby enhancing enterprises’ ability to innovate through digital transformation using data [34,35]. On the other hand, the increasing convenience of digital transactions and media, particularly the emergence of digital platforms, has overcome the spatiotemporal constraints of traditional offline business activities, significantly boosting the efficiency of commodity transactions between supply and demand sides [36,37]. Consequently, enterprises’ profit margins have notably expanded, greatly motivating their enthusiasm for digital transformation.
However, the digital transformation of enterprises necessitates substantial financial investments. The majority of enterprises find it challenging to bear the high fixed investment costs associated with digitalization, consequently lowering the probability of individual enterprises successfully achieving digital transformation [14]. In this context, on the one hand, the development of the local digital economy, especially the overall supply of digital infrastructure, amortizes the fixed costs of digital transformation of enterprises and reduces the risk of enterprises’ investment in digitalization [38]. On the other hand, the prosperity of the local digital economy reflects, to some extent, the local government’s policy support for the digital economy [39,40]. The stronger the signal of policy support, the lower the perceived uncertainty of digital transformation for enterprises, which enhances their willingness to participate in digital transformation. Based on the aforementioned analysis, the following hypothesis is proposed:
Hypothesis 1.
The development of the local digital economy can drive local enterprises to undergo digital transformation.
2.2. Local Digital Economy Growth and Dividends of Enterprise Digital Transformation
In the digital economy era, there is also a rapid expansion in the market demand for data. According to projections by the International Data Corporation (IDC), the global volume of data is expected to reach 175ZB by 2025, a five-fold increase compared to 2018 [41]. This substantial growth presents enterprises with a compelling incentive to leverage the potential momentum and dividends generated by these data to enhance operational performance.
The impact of local digital economic growth on enterprise performance improvement can be observed through the following processes: First and foremost, with the progressive maturation of local digital ecosystems, digital elements are anticipated to demonstrate exponential growth, thereby playing a pivotal role in mitigating operational costs for enterprises. The widespread adoption of digital technologies has significantly reduced the gap between enterprises and consumers, enabling businesses to access information from both upstream and downstream organizations, as well as customers, at a lower cost of transactions [42]. By employing advanced tools such as big data analysis and artificial intelligence algorithms, enterprises are more able to identify key processes and elements that impede cost control. This strategic approach aims to achieve an optimal state of operational cost efficiency [43].
Secondly, local digital economic development helps enterprises improve production efficiency. In the era of the digital economy, the production and operation of enterprises are closely tied to the supply level of digital infrastructure in their respective regions. In regions with a high-quality digital infrastructure supply, there exists a greater fluidity in the communication of data elements, making it easier for enterprises and entrepreneurs to internally and externally share information about production resources and market demands [33,44]. Additionally, in regions characterized by an abundant digital infrastructure supply, enterprises can more conveniently aggregate data elements, reducing transaction costs such as search costs, replication costs, transportation costs, tracking costs, and verification costs in business transactions, thereby promoting the improvement of resource allocation efficiency [11,32].
Thirdly, emerging digital elements can synergize with traditional production factors to enhance enterprise operational performance. The prominent advantage of the new generation of digital technologies on which the digital economy relies is its ability to systematically and accurately capture all the data and information in production management [45]. Through data computation and information processing, enterprises can achieve more refined, intelligent, and personalized production and management processes. The coordination between data elements and other traditional production factors is significantly improved, which significantly boosts enterprise operational performance [46]. We thus propose the following hypothesis:
Hypothesis 2a.
The growth of the digital economy can enhance the operational performance of local enterprises.
The growth of the local digital economy transforms the internal and external environments of enterprise production, operations, and management, thereby compelling enterprises to strive for innovation in various aspects such as production, services, distribution, and research and development [47]. The impact of local digital economic growth on enterprise innovation performance manifests in two aspects: direct effects and indirect effects. In terms of direct effects, the digital economy itself possesses strong innovative attributes, with a concentration of knowledge density and abundant innovative resources [15]. The continuous entry of innovative products from digital economic development in the form of intermediate products into the production system further drives technological and product innovation downstream in the industry chain. Regarding indirect effects, the development of the digital economy can reduce innovation risks, enhance the efficiency of market innovation resource allocation, and consequently elevate the level of enterprise innovation [48].
It is noteworthy that digital innovation in enterprises differs from traditional innovation’s research and development processes. Digital innovation emphasizes enterprises digitizing production factors through digital technology and updating and transforming organizational production structures [49]. Through integrated innovation development with other technological fields, digital technology can continuously generate new technological innovation outcomes and innovate and transform the production and research and development systems of traditional enterprises, thereby nurturing new products and business models [50]. Therefore, we propose the following hypothesis.
Hypothesis 2b.
The enhancement of the local digital economy can facilitate local enterprises in elevating their innovation capacity.
2.3. The Mechanisms for Enterprises to Obtain Digital Dividends
In the context of digitalization, data elements and related technologies empower enterprises in key business operations, processes, and departments, driving their digital transformation.
Firstly, the development of the digital economy promotes digital procurement within enterprises. Leveraging comprehensive digital intelligent infrastructure in their regions allows enterprises to efficiently break through temporal and geographical boundaries at low costs, engaging in extensive global sourcing and rapid deployment. Through online bidding or tendering, enterprises can effectively select suppliers with reasonable prices, satisfactory quality, and good reputations [51]. IoT infrastructure facilitates the visualization and online collaboration of procurement business, overcoming the time-consuming and inefficient aspects of traditional manual reporting, manual verification, and review methods. This enables procurement departments to fully utilize the advantages of digital technologies such as big data and the blockchain for negotiating, approving, and signing supply contracts [52]. The establishment of digital platforms and ecosystems in the procurement execution phase creates a refined digital environment, significantly reducing the costs and difficulties of data-driven, normalized, and standardized key nodes in the procurement process [53].
Secondly, digital economic development facilitates digital production within enterprises. The widespread coverage of digital infrastructure and media reduces the costs of generating, replicating, and disseminating data elements, enabling real-time online sharing [12]. This allows enterprises to automate, standardize, and continuously acquire data and related technological elements, making the digital transformation of production feasible with reduced marginal inputs. As the local digital economy deepens, emerging digital technologies become modularized and universal, applicable in a wider range of production scenarios [54]. This saves costs and time required to become familiar with technological mechanisms during the digital transformation of production, enabling enterprises to quickly adapt to changes and advancements in digital production, ultimately creating digital production benefits.
Thirdly, the high level of local digital economic growth promotes digital marketing within enterprises. As marketing entities in the digital environment, enterprises can track and describe user behavior through intelligent marketing methods such as online search engines and big data platforms at lower costs and complexities, forming precise and clear user profiles to enhance the performance of digital marketing tools and improve decision-making efficiency [55,56]. Leveraging the “connection dividend” brought by digital scenarios such as mobile internet, the IoT, and open media platforms, user groups can easily communicate with similar-demand individuals and participate deeply in the entire process of product application, promotion, and improvement optimization through online experiences and community reviews [57,58]. This effectively bridges the information gap between consumers and enterprises, ensuring the seamless alignment of user needs with enterprise resources, providing a favorable market environment for digital marketing. Therefore, the following hypothesis is proposed:
Hypothesis 3a.
Digital economic development can drive local enterprise digital transformation in key business areas, including procurement, production, and marketing.
The regional development of the digital economy will stimulate the digital transformation of enterprises in the field of technological research and development. This is because, leveraging local digital economic growth, integrating digital technologies into the innovation research and development process is beneficial in reducing enterprise innovation costs. Specifically, regional digital economic development establishes an integrated and shared platform for research and development resources for various innovation entities. The openness of this platform promotes the open-sourcing of innovation elements, thereby achieving economies of scale for innovation elements and reducing enterprise R&D input costs [59]. Through open digital platforms, enterprises can more efficiently access innovative knowledge, enhancing the breadth and depth of knowledge accumulation within enterprises and laying the foundation for the transformation of knowledge elements into creative technologies. Additionally, with the continuous improvement of regional digital infrastructure, digital technologies have gained a richer set of application tools and scenarios, lowering the experimental costs and R&D complexities for enterprises [60,61]. Based on these points, the following hypothesis is posited:
Hypothesis 3b.
The development of the digital economy can propel the technological digital transformation of enterprises.
Local digital economic growth can exert a more crucial influence on enterprises in terms of transformation of management, which also constitutes a key determinant of the success or failure of enterprise digital transformation. Within enterprises, the aggregation of digital elements leads the transformation of business models from operation-driven to data-driven [62]. In the digital environment, various resources and production factors are efficiently encoded and automated at lower costs, making implicit information explicit and enhancing organizations’ capabilities to perceive data ecosystems [63]. However, the complexity arising from rapid data growth and interconnectedness, as well as uncertainties caused by redundant and missing data, pose significant challenges to enterprise management. Consequently, enterprises are highly motivated to integrate mature digital technologies with their own management practices to fully harness the value of data within their local regions.
Externally, the digital ecosystem also profoundly influences the strategic, structural, and process aspects of inter-organizational resource integration within businesses, significantly reducing the transaction costs associated with external business interactions and fostering the collaborative division of labor among organizations [64]. The openness, standardization, and formatting of business networks facilitated by digital elements not only contribute to the establishment of fair and close cooperative relationships but also reduce delays in intra-organizational and inter-organizational collaboration, thereby enhancing collaborative efficiency [65]. Thus, we propose the following hypothesis:
Hypothesis 3c.
The improvement of the local digital economy can drive the managerial digital transformation of enterprises.
Based on the theoretical discussions above, we contend that local digital elements can empower enterprises in terms of business, technology, and management, assisting them in achieving digital transformation and reaping digital dividends. Our theoretical analysis and its logical framework are summarized in Figure 1. In the subsequent sections of this paper, we will empirically examine the relationship between the development level of the digital economy, enterprise digital transformation, and the mechanisms for acquiring digital dividends.
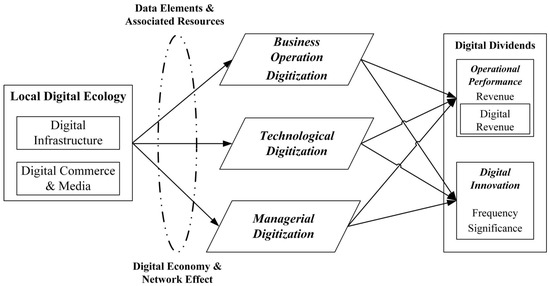
Figure 1.
The theoretical framework of this article.
3. Method
3.1. Sample Selection and Data Sources
The empirical section of this study employs the following data: (1) Enterprise-level data, which were obtained from the World Bank’s “China Investment Survey” (WBS12) conducted in 2012, the most recent survey to date. This survey reports on the usage of enterprise internet systems, various benefits derived from software and hardware information devices, sales of digital products, production of digital products, and information sharing in the supply chain. These findings serve as a data source for constructing digital indicators and digital dividend indicators in the context of enterprise digitization, providing empirical support for the systematic development of this paper. (2) The level of local digital economic growth in each province, composed of digital infrastructure, digital commerce and digital media, following the calculations in Jolliff and Nicholson [66] and Xu and Zhang [67]. (3) Other provincial-level information was obtained from the “China Statistical Yearbook” of various years. These data were all integrated at the enterprise level, and after removing samples with missing or distorted information, a total of 1455 enterprise-level samples were obtained. The detailed definitions and measurement indicators of enterprise-level digital transformation and digital dividend variables are presented in Appendix A.
3.2. Variable Definition and Description
3.2.1. Local Digital Economic Growth
This is a key variable of our study, measured by the annual increment of the scale of digital resources in the province where an enterprise is located. According to the report released by the Chinese Academy of Information and Communications Technology (2021), the measurement of digital scale mainly includes digital industrialization and industrial digitization; the former mainly refers to the products and services in industries that are completely brought about by digital transformation, and all the new output of this industry belongs to the category of digital elements. The industrial digitization part mainly refers to the new output brought about by the application of digital technology in traditional industries. Based on this, following Jolliff and Nicholson [66] and Xu and Zhang [67], we defined the main scope of digital factors with three measurable components: digital infrastructure, digital media, and digital commerce. Among them, digital infrastructure belongs to the category of digital industrialization, while digital media and digital commerce belong to the category of industrial digitization. Accordingly, we identified the specific industries corresponding to these digital elements, including 8 major categories and 83 subcategories of industry classification under the “National Economic Industry Classification (2017)”, and summarized them in Table 1. Then, based on this categorization, we calculated the level of local digital economic growth in each province. The detailed methodology for calculating local digital economic growth, including value-added structure coefficients and digital economy adjustment coefficients, is presented in Appendix B.

Table 1.
Industries corresponding to digital economic growth.
3.2.2. Enterprise Digital Transformation
In this study, the “digital transformation of enterprises” was defined based on whether a company utilizes internet systems or not.
Table 2 provides a summary of the main variables used in this study. The descriptive statistics of the variables are presented in Table 3.
Table 2.
Variable definitions.
Table 3.
Descriptive statistics of variables.
3.2.3. Control Variables
This research incorporated macro control variables at the provincial level, including industrial structure, economic scale, and population size, to eliminate potential regional influences on the digital economy and corporate digital transformation. Specifically, (1) the proportions of the secondary and tertiary industries reflect the balance between industry and services in a region, jointly characterizing the industrial structure. Regions with a higher-proportion service sector are more likely to have the infrastructure and market demand for digital technology diffusion [69]. (2) Regional GDP (logged) controls for economic scale differences, as economically developed regions typically have more advanced digital infrastructure and policy support, which may indirectly impact corporate digital transformation [70]. (3) Population size (logged) captures regional market demand potential, with densely populated areas exhibiting higher demands for digital services, potentially accelerating the maturity of the local digital ecosystem [71]. These variables collectively controlled for the heterogeneity of regional economic structures and resource endowments, ensuring that the estimated results of the core explanatory variable (digital economic growth) were not confounded by macro-environmental factors [72,73].
At the enterprise level, this study controlled for characteristics such as size, age, export orientation, subsidiary attributes, and executive experience. Enterprise size (logged number of employees) reflects resource endowment, with larger enterprises typically having stronger capabilities for digital investment [74]. Enterprise age (logged years since establishment) may affect organizational change inertia, as mature enterprises may face higher resistance to digital transformation [16]. The proportion of export sales measures the degree of enterprise internationalization, with export-oriented enterprises being more inclined to adopt digital technologies due to competitive pressures [75]. A subsidiary dummy variable distinguished whether an enterprise was a group affiliate; subsidiaries may leverage group resources for digital transformation support [76,77]. Executive tenure (logged) represents management stability, with longer tenures potentially indicating a better ability to drive long-term digital strategies [78,79]. Additionally, the model included industry fixed effects and provincial fixed effects to control for industry technological differences and unobservable regional factors, ensuring the validity of the estimated results.
As depicted in Table 3, out of the 1455 samples included in this study, 994 companies had successfully undergone digital transformation, accounting for 68.32% of the total sample.
4. Results
4.1. Local Digital Economic Growth and Enterprise Digital Transformation
4.1.1. Baseline Regression
To examine the relationship between local digital economic growth and enterprise digital transformation, this study constructs the following Probit model (1):
where i denotes the enterprise, j denotes the province, and t denotes the year. The dependent variable ICTijt represents whether enterprise i in province j achieved digital transformation in year t. The explanatory variable lnDEjt represents the natural logarithm of the scale of newly added digital elements in province j during year t. β is the coefficient of interest in this study. Σcontrol represents all the control variables. To alleviate endogeneity, the control variables at the provincial level are lagged by one period. ΣInd represents the industry fixed effects, ΣPro represents provincial fixed effects, and εit denotes the random error. The standard errors in this study are clustered at the industry level. The regression results are presented in Table 4. In column (1), β is significantly positive at the 1% level, indicating that an increase in the level of local digital economic growth plays a significant role in promoting digital transformation among enterprises within a locality. Furthermore, we calculate the marginal effect of the regression coefficient. As seen in column (2), the marginal effect of β is 0.63. This implies that for every 1% expansion in the scale of digital elements in the region, the probability of enterprises in that region achieving digital transformation increases by 0.63 percentage points. If the level of local economic growth in the region improves by a factor of 1, the probability of achieving digital transformation in that region will increase by over 60%. Thus, Hypothesis 1 is confirmed. Supplementary regression results and robustness checks are available in Appendix C.
Table 4.
Local digital economic growth and corporate digital transformation.
4.1.2. Threshold Regression Analysis
The degree to which the level of digital economic growth promotes the digital transformation of enterprises becomes more apparent as the resources endowed to the enterprises increase. Through digital transformation, enterprises can fully unleash the productivity of various aspects and entities involved in production and operational management, reduce transaction costs, mitigate resource misallocation, and achieve economies of scale [46,80]. Furthermore, the scale effect of digital transformation can only be realized when enterprises reach a certain size where they have sufficient business resources and a diverse range of business types, allowing them to effectively share the costs of digital transformation [81,82]. Once an enterprise’s resource scale accumulates to a critical threshold, it triggers positive feedback, continuously strengthening the effects of acquiring, analyzing, and applying digital elements, thereby unleashing greater digital value [83,84]. Therefore, the larger the scale of an enterprise, the more capable it is of utilizing regional digital elements to promote its own digital transformation.
To empirically test the above thesis, this study constructs the following dual-threshold regression model, building upon the framework proposed by Hansen [85]:
In the above equation, 1(·) denotes an indicator function, which takes the value of 1 when the expression within the parentheses is true, and 0 otherwise. φ1 and φ2 represent two threshold values (φ1 < φ2), which divide the sample interval into three regimes. The remaining variables and symbols are consistent with model (1).
Then, we conduct threshold effect tests using the bootstrap sampling method with 300 repetitions. The results, as shown in Table 5, indicate that, in columns (1)–(2), the F-values for the first and second thresholds are significant at the 1% and 5% levels, respectively, suggesting the presence of significant threshold effects in model (2) when using enterprise size as the threshold. Furthermore, from Table 5, the threshold values for model (2) are found to be 3 and 4.44. Additionally, from Figure 2A,B, it is evident that both threshold values are significantly lower than the critical value at the 5% significance level, indicating the validity and effectiveness of these two threshold values.
Table 5.
Threshold effect tests and threshold value estimation.
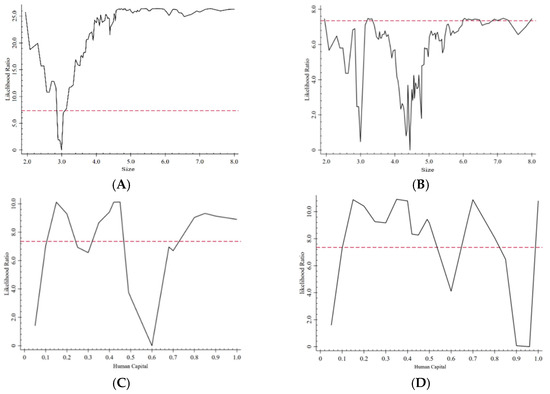
Figure 2.
The dual-threshold estimation results. Note: (A,B) represent the estimated results corresponding to the threshold values of 3 and 4.44, respectively; (C,D) represent the estimated results corresponding to the threshold values of 0.6 and 0.96, respectively.
The threshold regression results are presented in Table 6. In column (1), β1, β2, and β3 are all significantly positive at the 1% level, and the fitted values increase sequentially. Combining this with column (2), it can be observed that the marginal effects of β1, β2, and β3 also increase. Therefore, it can be concluded that, as the sizes of enterprises increase, the enterprises are more capable of utilizing local digital resources for their digital transformation.
Table 6.
Threshold regression results.
Moreover, human capital within enterprises can play a particularly important role during the process of digital transformation [86]. The digital transformation of enterprises is an innovative process that involves technological research and development, as well as its application. In this process, employees also need to engage in technical learning and knowledge updates to provide human support for digital transformation. Specifically, for an enterprise lacking high-quality human capital, even with the adoption of mature digital technologies and access to local data elements, extracting valuable business insights from complex data becomes challenging. Conversely, enterprises with a higher proportion of highly educated employees in their human capital structure possess stronger overall learning capabilities. This enables them to fully leverage the advantages of the local digital economy and significantly enhance the efficiency of digital technology updates, thereby facilitating a more streamlined achievement of digital transformation [87]. This suggests that, the higher the level of human capital within an enterprise, the more capable it is of utilizing regional digital elements to promote its own digital transformation.
This study uses the “proportion of employees with a high school education or above” as a proxy variable to measure the quality of human capital within enterprises. The above theory is empirically tested using the same model as model (2). Similarly, as seen in columns (3)–(4) of Table 5, the F-values for the first and second thresholds are both significant at the 1% level, indicating the presence of significant threshold effects. Moreover, the threshold values for model (2) are found to be 0.6 and 0.96. From Figure 2C,D, we can observe that both threshold values are significantly lower than the critical value at the 5% significance level, confirming the validity of these thresholds.
The regression results, as shown in column (3)–(4) of Table 6, indicate that β1, β2, and β3 are all significantly positive at the 1% level, and the fitted values increase sequentially. The marginal effects also increase accordingly. This suggests that as the quality of human capital within an enterprise improves, it possesses a stronger ability to fully utilize local digital resources for its digital transformation.
4.2. Local Digital Economic Growth and the Digital Dividends of Enterprises
To examine the relationship between the level of local digital economic growth and enterprise performance, we construct the following OLS model (3):
where the dependent variable Performanceijt represents enterprise i in province j in year t, measured by the variables “revenue” and “digital revenue”, respectively; the remaining parts are consistent with model (1). The regression results are shown in column (1)–(2) of Table 7, with β significant at the 5% level. This implies that local digital economic growth indeed significantly promotes an increase in firm revenue and the proportion of revenue generated by digital products. In a nutshell, as the local digital economy continues to advance, enterprises can swiftly undergo digital transformation and attain short-term enhancements in operational performance. Therefore, Hypothesis 2a is validated.
Table 7.
Local digital economic growth and digital dividends of enterprises.
Then, to examine the relationship between the level of digital economy and enterprise innovation capacity, we construct the following Ologit model (4).
where the dependent variable Innovationijt represents the innovation capacity of enterprise i in province j in year t, measured by the variables “frequency of digital innovation in production” and “significance of digital innovation in production”, respectively. The regression results are shown in columns (3)–(4) of Table 7, with β significant at the 5% level. The findings suggest that as the local digital economy continues to advance, enterprises show a greater inclination to leverage digital technologies for innovation in production processes, leading to a significant increase in the extent of production innovation driven by the digital economy. Thus, Hypothesis 2b is confirmed.
4.3. Instrumental Variable Regression
An important concern that affects the core argument of this study is that the digital transformation of enterprises may also contribute to the gradual development of the local digital economy. To address the potential issue of reverse causality, this study conducts instrumental variable regression for model (1) and model (2). Taking into account the crucial role of accumulated digital talent in the development of the digital economy, which is unrelated to the current digital transformation decisions of enterprises, this study selects “the number of employees per 10,000 people engaged in ICT-related services in each locality in 2003”3 as the instrumental variable. The reason for selecting this instrumental variable is twofold. Firstly, the presence of professionals engaged in ICT-related industries in a region’s historical context forms the foundation for the current development of local digital economies, exhibiting a certain degree of correlation with local digital economic growth. Secondly, the historical presence of professionals engaged in ICT-related industries in a province bears no direct relationship with the digital transformation decisions of enterprises in that region, aligning with the exogeneity assumption.
In the first-stage regression, the instrumental variable is significantly positive at the 1% level with respect to the natural logarithm of the level of local digital economic growth.4 The second-stage regression results, as shown in Table 8, indicate that the p-value of the instrumental variable LM test is 0.00, strongly rejecting the null hypothesis and indicating a significant correlation between the instrumental variable and the endogenous variable. The F-statistic for the instrumental variable is greater than 10, suggesting the absence of weak instrument problems. In columns (1)–(5), β remains significantly positive at the 5% or 1% level, consistent with the regression results in Table 4 and Table 7. Therefore, it can be concluded that the empirical results of this study remain robust after considering potential endogeneity.5
Table 8.
Instrumental variable regression.
4.4. Heterogeneity Analysis
Compared to digital commerce and media, digital infrastructure is more conducive to promoting enterprise digital transformation. This is because digital infrastructure, which encompasses fundamental digital technologies, organizational structures, and related services and facilities, occupies a primary and foundational position in supporting the operations of enterprises and industries in a region. Its essential form includes not only hardware, such as computers, mobile devices, and application platforms, but also digital technologies, such as cloud computing and the Internet of Things (IoT), along with their associated software [66]. Especially in China, the scale of digital infrastructure is much larger than that of digital commerce and media [67]. Therefore, digital infrastructure is more accessible to enterprises and plays a more significant marginal effect in promoting enterprise digital transformation.
To further validate the above propositions, this study uses models (1), (4), and (5) to verify and summarizes the regression results in Figure 3. As shown in Figure 3, the improvement in the level of local digital infrastructure indeed increases the probability of enterprise digital transformation and significantly helps enterprises to gain digital dividends.
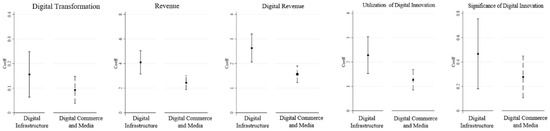
Figure 3.
Digital infrastructure, commerce and media, and enterprise digital transformation.
4.5. The Empowerment Effect of Local Digital Economic Growth
To examine whether local digital economic growth can effectively empower various aspects of enterprise operations, such as production, research and development, and management, this study constructs the following empirical model (5):
In the equation above, the dependent variable Outputijt represents specific aspects of enterprise operations, while the other variables and symbols are consistent with model (1). When examining business digitalization, this study uses “digital procurement”, “digital production”, and “digital sales” as the respective dependent variables. Probit and Ologit models are employed for regression analysis. The regression results, as presented in Table 9, indicate that, in columns (1)–(3), β is significantly positive at the 1% level. This suggests that an increase in the level of local digital economic growth can significantly promote digital transformation in key business aspects such as procurement, production, and sales. Thus, Hypothesis 3a is confirmed.
Table 9.
The empowerment effect of the local digital economy.
Similarly, when examining technological digitalization, this study uses “digital research and development” as the dependent variable. As shown in column (4) of Table 9, β is significantly positive at the 1% level, suggesting that an increase in the level of local digital economic can also facilitate enterprises’ engagement in technological research and development activities leveraging digital resources and digital scenarios. Thus, Hypothesis 3b is confirmed.
When examining managerial digitalization, this study uses “digital operations management”, “digital relationship management”, and “supply chain information sharing” as the dependent variables. The regression results, as shown in columns (5)–(7) of Table 9, indicate that β is significantly positive at the 1% level for all variables, suggesting that an increase in the level of local digital economic growth can prompt enterprises to incorporate digital technologies into various business processes such as organizational and personnel management, inventory management, supplier management, and customer relationship management, enabling information sharing among different departments within an organization and with external organizations. Therefore, Hypothesis 3c is confirmed.
4.6. Enterprise Digital Transformation and Acquisition of Digital Dividends
Next, we construct model (6) to examine whether enterprises effectively acquire dividends from digital empowerment. The model is as follows:
In this model, the variables are consistent with those in model (1). The regression results are presented in Table 10 and Table 11, respectively. In columns (1)−(3) of both tables, γ is significantly positive at the 1% or 5% level, which indicates that business digital transformation indeed contributes to the improvement of short-term performance and long-term innovation capabilities for enterprises. Similarly, in columns (5)−(7) of both tables, γ is significantly positive at the 1% level, suggesting that managerial digital transformation also significantly enhances short-term performance and long-term innovation capabilities for enterprises.
Table 10.
Digital empowerment and short-term performance.
Table 11.
Digital empowerment and long-term innovation capabilities.
It is worth noting that, in column (4) of Table 10, γ gains no significance, while in column (4) of Table 11, γ is significant at the 1% level. This may be due to the fact that technological digital transformation requires substantial initial investment and has a longer investment return period, making it difficult to generate performance improvements in the short term. Nevertheless, in the long run, the digitization of research and development activities can effectively accelerate the acquisition, absorption, transfer, and sharing of knowledge within enterprises, enriching the sources of knowledge and building a strong knowledge base for continuous innovation, thus enhancing the product innovation capabilities of enterprises.
5. Discussion
5.1. Main Findings and Theoretical Implications
First, we consider Local Digital Economy Growth (LDEG) as a Critical External Driver. Our results confirm that LDEG—particularly digital infrastructure (e.g., 5G networks, cloud platforms) and regional policy ecosystems—directly accelerates enterprise digital transformation (DT). This finding addresses a gap in the prior literature, which predominantly focuses on internal firm-level factors (e.g., financial resources, organizational agility [2,24,88]) or indirect macro-level drivers (e.g., subsidies, tax incentives [25,89,90]). By contrast, we demonstrate that LDEG reduces DT’s fixed costs and risks by providing shared technological resources [91], thereby enabling firms to transition from traditional to digital-native operations [92,93].
Second, we consider the threshold conditions for successful DT. We identify firm size (resource slack) and human capital (absorptive capacity) as critical boundary conditions. These thresholds clarify why firms with ≥1024 employees or ≥23% graduate employees benefit disproportionately from LDEG (see Section 5.2). This structural perspective advances prior homogenized analyses of DT drivers and offers actionable criteria for policymakers to target their support towards (e.g., prioritizing SMEs below thresholds for subsidized cloud infrastructure).
Third, we further explore how LDEG catalyzes enterprise DT by enhancing short-term performance and long-term innovation capabilities. Our results indicate that changes in the external digital environment promote digital transformation through three dimensions—business, technology, and management digitalization—ultimately leading to digital dividends such as improved short-term performance and long-term innovation capabilities. These findings uncover the “black box” of enterprise digital transformation in the digital economy era and offer valuable insights for firms developing specific digital transformation strategies.
Fourth, distinct from existing empirical research that mainly focuses on listed companies and multinational enterprises [94,95], our research extends its scope to include small and medium-sized enterprises (SMEs), thereby enhancing the generalizability of the findings presented in this paper. For some SMEs, their digital transformation may be constrained by factors such as their own scale and talent resources [18,96,97]. Therefore, it is crucial for them to seek their optimal investment scale based on their own circumstances and avoid blindly engaging in excessive digital investments. Consequently, SMEs often rely more on robust support from external digital infrastructure, digital platforms, and digital ecosystems to successfully undergo digital transformation and reap digital dividends [98]. Based on the findings of this study, it is imperative for governments to optimize the digital infrastructure construction environment, accelerate the cultivation and growth of public service platforms for digital infrastructure, and continuously expand the coverage of the digital economy. By relying on market forces, governments can consistently empower SMEs in their production and manufacturing processes and facilitate market integration.
5.2. Practical Implications
From the enterprise perspective, first, enterprises should fully utilize regional digital economy resources to create opportunities for successful digital transformation. It is crucial for firms to leverage external complementary conditions, pay close attention to the development of the digital economy within their regional economic systems, and enhance their capacity to absorb, analyze, and apply digital resources. For example, enterprises can take full advantage of local government support policies for digital economy development and integrate their digital equipment investments with regional digital economy foundations.
Second, enterprises must develop digital transformation strategies that align with their specific circumstances. Our findings suggest that firm size and human capital levels have significant threshold effects on the digital transformation process facilitated by digital economy development. Thus, transformation strategies should be adapted to enterprises’ development stages. SMEs, in particular, should avoid excessive digital investments and instead seek optimal investment scales that match their resources and capabilities.
Third, enterprises should use digital transformation as an opportunity to upgrade their business, technology, and management systems comprehensively. Firms should leverage digital technologies to innovate traditional business models, enhance autonomous innovation capabilities, and integrate internal and external knowledge to improve production and innovation efficiency. By adopting an internet mindset, enterprises can transform traditional management approaches, mobilize internal innovation initiatives, and effectively combine internal and externally acquired knowledge and information to drive sustainable growth in the digital economy era.
Another practical implication is for governments, whereby, although this study is primarily based on surveys of Chinese enterprises, its findings hold significant implications for other developing countries worldwide. Many developing countries and regions in Asia, Africa, and Latin America face challenges such as limited digital transformation capabilities and difficulties in bridging the “digital divide” with developed countries [99]. In this context, government intervention through the vigorous development of regional digital economies, particularly by promoting large-scale digital infrastructure construction, can play a crucial role in facilitating domestic enterprises’ digital transformation. For example, Gaglio et al. [100] found, based on a survey of micro- and small enterprises (MSEs) in South Africa, that government initiatives aimed at promoting inclusive digitalization contribute to enabling firms to achieve digital innovation using social media and mobile internet access for business purposes, thereby enhancing productivity efficiency. In policy practice, the Office of the Prime Minister of Malaysia launched the “Malaysia Digital Economy Blueprint” in 2021, emphasizing government policy support in areas such as promoting the application of artificial intelligence and the commercial adoption of data science.6 These examples, along with our own research findings, suggest that the prosperity of the regional digital economy is likely to have a strong impact on local enterprises’ digital transformation and their ability to harness digital dividends.
5.3. Limitations and Future Research Directions
This study also has some limitations that warrant further investigation in the future. Firstly, the sample in this study is limited to China and does not encompass the digital transformation of enterprises in other developing countries. Therefore, future research could focus on gathering data from more developing countries and conducting crossnational comparative analyses of digital transformation fostered by different digital environments. Secondly, there is a lack of consensus on measuring regional digital economic growth and enterprise digital transformation. The measurement criteria adopted in this study are primarily based on the methodologies of the US Bureau of Economic Analysis (BEA) and the National Bureau of Statistics of China. Future studies could consider employing more diverse and accurate measurements using machine learning methods to assess regional digital economies and enterprise digital transformation.
6. Conclusions
Drawing on micro-level data from the “World Bank China Investment Survey”, we empirically examined the interplay between regional digital economic growth, enterprise digital transformation, and the realization of digital dividends. The results underscore that regional digital progress can catalyze enterprise digital transformation, leading to notable enhancements in short-term operational performance and long-term product innovation. Moreover, as firms scale up and bolster human capital, the catalytic impact of regional digital economic growth on their digital transformation becomes increasingly pronounced. The study’s findings not only provide a policy framework for governments, particularly in less digitally developed nations, drawing from China’s success, but also offer practical insights for enterprises to craft and leverage tailored digital transformation strategies.
Author Contributions
Conceptualization, Y.Y. and G.T.R.L.; methodology, Y.Y.; software, Y.Y.; validation, Y.Y. and G.T.R.L.; formal analysis, Y.Y.; investigation, Y.Y.; resources, Y.Y.; data curation, Y.Y.; writing—original draft preparation, Y.Y.; writing—review and editing, G.T.R.L.; visualization, Y.Y.; supervision, G.T.R.L.; project administration, G.T.R.L. All authors have read and agreed to the published version of the manuscript.
Funding
This research received no external funding.
Data Availability Statement
The author is willing to share all the data of the article publicly. If you need to obtain the data, please send an email to Yunqi Yang at yangyunqi0077@gmail.com.
Acknowledgments
Thanks to the doctoral supervisor of the first author of this article for guidance.
Conflicts of Interest
The authors declare no conflicts of interest.
Appendix A. The Correspondence Between the WBS12 and Enterprise-Level Digital Indicators
Appendix A.1. Enterprise Digital Transformation
The WBS12 survey provides a comprehensive report on the utilization of internet systems by the investigated enterprises. Additionally, the questionnaire presents detailed information on the proportion of ICT-related expenditures in the annual fixed asset investments of the enterprises.
Building upon the ICT and other information technology investments as foundations of digital transformation, this study considers the application of internet systems by enterprises as a variable representing digital transformation in the realm of information technology (enterprise digital transformation). Furthermore, to mitigate measurement bias, this study also constructs the ICT-related expenditure rate under enterprise fixed asset investments as a variable representing digital transformation in the domain of information networks (ICT-related expenditure).
Appendix A.2. Digital Revenue
The WBS12 survey provides a detailed report on the operating revenue and profit generated by the investigated enterprises through the application of internet-related technologies.
Appendix A.3. Frequency of Digital Innovation in Production
The WBS12 survey provides a comprehensive report on the “frequency of utilizing internet technologies for product/service optimization” by enterprises, assigning values (ranging from 1 to 5) in the order of “none”, “rarely”, “some”, “high”, and “very high”. This is considered as one of the measurement indicators for the innovative performance achieved through digital transformation in this study.
Appendix A.4. Significance of Digital Innovation in Production
The WBS12 survey provides a detailed report on the “degree of utilizing emerging technologies for product optimization to foster innovation” by enterprises, assigning values (ranging from 0 to 2) in the order of “moderate impact”, “some impact”, and “significant impact”. This serves as another measurement indicator for the innovative performance of enterprises in this study.
Appendix A.5. Digital Procurement
The WBS12 survey reports on the adoption of internet technologies for procurement by enterprises, which is utilized as a measurement indicator for digital procurement in this study.
Appendix A.6. Digital Production
The WBS12 survey provides a comprehensive report on the “frequency of utilizing internet technologies for production operations” by enterprises, assigning values (ranging from 1 to 5) in the order of “none”, “rarely”, “some”, “high”, and “very high”. This serves as a measurement indicator for digital production in this study.
Appendix A.7. Digital Sales
The WBS12 survey provides a comprehensive report on the “frequency of utilizing internet technologies for marketing activities” by enterprises, assigning values (ranging from 1 to 5) in the order of “none”, “rarely”, “some”, “high”, and “very high”. This serves as a measurement indicator for digital sales in this study.
Appendix A.8. Digital R&D
The WBS12 survey reports on the adoption of internet technologies for research and development (R&D) activities by enterprises, which is utilized as a measurement indicator for digital R&D in this study.
Appendix A.9. Digital Operation Management
The WBS12 survey provides a report on the adoption of enterprise resource planning (ERP), supply chain management (SCM), customer relationship management (CRM), and other professional management software by enterprises. This serves as a measurement indicator for digital operation management in this study.
Appendix A.10. Digital Relationship Management
The WBS12 survey provides a detailed report on the “frequency of utilizing internet technologies for partnership relationship management” by enterprises, assigning values (ranging from 1 to 5) in the order of “none”, “rarely”, “some”, “high”, and “very high”. This serves as a measurement indicator for digital partnership relationship management in this study.
Appendix A.11. Supply Chain Information Sharing
The WBS12 survey provides a detailed report on the “frequency of sharing raw material inventory information and demand forecasting information with suppliers” and the “frequency of sharing finished goods inventory information and production planning information with customers” by enterprises. These frequencies are assigned values (ranging from 0 to 4) in the order of “never”, “seldom”, “sometimes”, “usually”, and “always”. This serves as a measurement indicator for supply chain information sharing in this study.
Table A1.
Supplementary datasets.
Table A1.
Supplementary datasets.
| Variable | Digital Transformationt | |
|---|---|---|
| WBS2003 | WBS2005 | |
| (1) | (2) | |
| Ln (Digital Economic Growth)t−1 | 0.071 *** | 0.010 *** |
| (0.012) | (0.001) | |
| Ln (Size)t | 0.196 *** | 0.021 *** |
| (0.017) | (0.001) | |
| Ln (Age)t | 0.103 | 0.020 *** |
| (0.083) | (0.007) | |
| Export Salest | −0.091 *** | 0.001 |
| (0.025) | (0.001) | |
| Subsidiaryt | −0.094 | −0.006 |
| (0.075) | (0.006) | |
| Ln (Executive Tenure)t | −0.940 *** | −0.022 * |
| (0.250) | (0.013) | |
| Proportion of Second Industryt−1 | −0.417 | 0.026 * |
| (0.258) | (0.013) | |
| Proportion of Tertiary Industryt−1 | 0.076 | −0.004 |
| (0.112) | (0.009) | |
| Ln (GDP)t−1 | 0.575 * | 0.029 * |
| (0.304) | (0.017) | |
| Ln (Population)t−1 | 0.077 *** | 0.036 ** |
| (0.021) | (0.018) | |
| Industry Fixed Effects | Yes | Yes |
| Provincial Fixed Effects | Yes | Yes |
| Observations | 10,896 | 12,025 |
| R-Squared | 0.400 | 0.349 |
*** p < 0.01; ** p < 0.05; * p < 0.1.
Appendix B. Calculation of Local Digital Economy
Appendix B.1. Digital Industrialization and Industry Value-Added Structure Coefficient
Digital industrialization refers to the products and services brought about by digital technology. Without digital technology, these products would not exist. Some examples include the electronic information manufacturing industry, information and communication industry, software service industry, and internet industry, all of which emerged with the advent of digital technology. Industries related to the digital economy, filtered based on the connotation of the digital economy, permeate various sectors and subcategories of the national economy. Current statistical data primarily provide added value data at the category level for national economic industries. The “China Input–Output Table” offers relatively detailed data for 139 industries (the provincial-level input–output tables cover 42 sectors). However, it is impossible to fully determine the added value data for the major categories and more finely classified categories of national economic industries related to the digital economy. Therefore, it is necessary to introduce the “industry value-added structure coefficient” to estimate the added value data for industries related to the digital economy, which can be expressed using the following formula:
In this formula, the industry value added of industry ij refers to the value added by the i-th subclass within the j-th industry, while the industry value added of industry j represents the aggregated value added of all the subclasses within industry j. Thus, the added value of the major industry categories in national economic statistics can be used to estimate the added value of the subcategories related to the digital economy within these industries.
Appendix B.2. Industrial Digitalization, Digital Economy Adjustment Coefficient, and Industry Added Value Rate
Industrial digitalization refers to the growth in output and efficiency improvements that occur when existing industries leverage digital technology. Without digital technology, these enhancements would not be possible. In practical data statistics, this refers to national economic industries related to the digital economy, where certain major industry categories include subcategories related to the digital economy. For example, internet wholesale in the wholesale industry and internet retail in the retail industry. Therefore, it is not appropriate to simply sum the added values of all the industries related to the digital economy to calculate the total added value of the digital economy.
Drawing upon established methods for constructing detachment coefficients in input–-output analysis [101,102] this paper introduces the concept of “digital economy adjustment coefficients”. The digital economy adjustment coefficient represents the proportion of the digital economy value added to the total value added within an industry, and it can be expressed using the following formula:
The industry added value rate refers to the ratio of the added value of various industries in the national economy to the total output of the corresponding industries. It can be expressed using the following formula:
Drawing on the estimation method of the BEA [66], we assume that in each industry related to the digital economy, the proportion of intermediate consumption in the digital economy to the total output of the digital economy is the same as the proportion of intermediate consumption to the total output in its respective industry. Thus, the added value of the digital economy in each industry is the product of the total output of the digital economy in that industry and the industry’s added value rate. This can be expressed using the following formula:
Combining Formulas (A3) and (A4), we can derive the following relationship:
From the above discussion, the digital economy adjustment coefficient represents both the proportion of the added value of the digital economy to the total added value of the industry and the proportion of the total output of the digital economy to the total output of the industry. Therefore, output data can be used to estimate the added value data.
Appendix B.3. Calculation of Digital Infrastructure
- (1)
- Digital infrastructure comprises three main components: computer hardware, software, and telecommunications equipment and services. It forms the essential foundation for the operation and development of the digital economy, supporting its functioning and growth.
According to the “National Economy Industry Classification 2017”, the industries that produce these products include Category I “Information Transmission, Software, and Information Technology Services” and Subsector 39 of Category C “Manufacturing”, which is “Computer, Communications, and Other Electronic Equipment Manufacturing”.
- (2)
- Calculate the coefficients for each subcategory:
- Value added and output of “Computer, Communications, and Other Electronic Equipment Manufacturing”
The value-added structure coefficient of “Computer, Communications, and Other Electronic Equipment Manufacturing” within the category of “Manufacturing” represents the proportion of value added from this particular industry to the total value added of the manufacturing sector. It also serves as the “manufacturing digital economy adjustment coefficient” based on the selection of digital economic industries within digital infrastructure. Since the “China Input–Output Table” is not updated annually, this study utilizes relevant data from the 2007, 2012, and 2017 provincial “Input–Output Tables” to derive the manufacturing digital economy adjustment coefficients for those years. For the remaining years, the digital economy adjustment coefficients can be estimated using available data. The specific calculation method is as follows:
By comparing the known value added of “Computer, Communications, and Other Electronic Equipment Manufacturing” with the value added of “Manufacturing”, the manufacturing digital economy adjustment coefficients for 2007, 2012, and 2017 can be obtained. The missing values of the manufacturing digital economy adjustment coefficients for the years 2007–2017 are estimated and, in conjunction with the value-added data of the manufacturing sector, the value added of “Computer, Communications, and Other Electronic Equipment Manufacturing” for the years 2007–2017 is obtained.
The estimation method for the added value of the manufacturing industry from 2007 to 2017 primarily relies on the relationship between the manufacturing and industrial sectors (where the industrial sector is the broad category and the manufacturing sector is a subcategory). The data for “Industrial Value Added” for each province from 2007 to 2017 can be obtained from the corresponding year’s “China Statistical Yearbook”. This study assumes that the change rate of the manufacturing added value is generally consistent with the change rate of the industrial added value for the same year, thereby obtaining the “manufacturing added value” for the corresponding years.
This study primarily utilizes statistical data such as operating income (or sales revenue) from various industries to proxy the output data of these industries in order to estimate the missing output values of the digital economy sectors for different provinces in various years. When estimating the missing manufacturing output, we use the “Main Business Income of Industrial Enterprises Above a Designated Size (in CNY 100 million)” from 2007 to 2017 for each province, as collected from the “China Statistical Yearbook”. By combining this with the known ratios of manufacturing added value to industrial added value for the years 2007, 2012, and 2017, and assuming that this ratio equals the proportion of manufacturing enterprise revenue to industrial enterprise operating income (and remains constant in the short term), we can derive the “Main Business Income of Manufacturing Enterprises Above a Designated Size” for the corresponding years. Using the known output of the manufacturing sector for specific years and the calculated growth rates of the main business income of manufacturing enterprises for each province, we can estimate the manufacturing output from 2007 to 2017.
The main business income data for the “Manufacture of Computers, Communication Equipment, and Other Electronic Equipment” are sourced from the Operational Monitoring and Coordination Bureau of the Ministry of Industry and Information Technology, the National Development and Reform Commission, the Ministry of Industry and Information Technology of the People’s Republic of China, and various provincial communications administrations. By calculating the annual change rate of the main business income and combining it with the known change rate of the output value for the “Manufacture of Computers, Communication Equipment, and Other Electronic Equipment” for specific years, we can estimate the output value of this sector for each province from 2007 to 2017. The ratio of the output of the “Manufacture of Computers, Communication Equipment, and Other Electronic Equipment” to the manufacturing output for each province from 2007 to 2017 represents the manufacturing industry digital economy adjustment coefficient for the corresponding years.
- 2.
- Added value and output of the “Information Transmission, Software, and Information Technology Services”
The methodology employed here is fundamentally similar to that used for the hardware sector, specifically the “Computer, Communications, and Other Electronic Equipment Manufacturing” industry. The main business income data for the “Information Transmission, Software, and Information Technology Services” industry are sourced from the National Bureau of Statistics and the Ministry of Industry and Information Technology of the People’s Republic of China. By calculating the growth rate of business income and combining it with the known changes in output and added value for specific years, we can estimate the added value and output of the “Information Transmission, Software, and Information Technology Services” industry for each province from 2007 to 2017.
Adding the added value and output of the “Information Transmission, Software, and Information Technology Services” industry to those of the “Manufacture of Computers, Communication Equipment, and Other Electronic Equipment” yields the total added value and output of digital infrastructure for each province from 2007 to 2017.
Appendix B.4. Calculation of Digital Commerce
- (1)
- Digital commerce includes transactions conducted through digital orders, platform-enabled transactions, or digital delivery, as well as related online trade brokerage activities. The BEA broadly considers all transactions of goods and services conducted through computer networks as digital commerce or e-commerce. According to the “2017 National Economic Industry Classification Notes”, e-commerce refers to business activities that sell goods or provide services through information networks such as the internet. E-commerce activities include the following three types: (1) e-commerce platform operations, (2) the in-platform sales of goods (commodities) or provision of services through e-commerce platforms, and (3) e-commerce business activities involving the sale of goods (commodities) or provision of services through self-built websites or other online services.
Since e-commerce activities involve multiple different categories and subcategories in the National Economic Industry Classification, in the “National Economic Industry Classification 2017”, they are classified into related industry categories based on their main activities. For example, online real estate intermediaries are classified under 7030 (Real Estate Intermediary Services), and online railway, aviation, and other passenger ticketing agents are classified under 5822 (Passenger Ticketing Agents). Accurately filtering and measuring e-commerce activities included in the subcategories of the “National Economic Industry Classification 2017” is challenging. To ensure international comparability with the BEA’s measurement results, this section includes B2B wholesale and B2C retail aspects in the selection of industries related to digital commerce.
According to the screening of the national economic industries corresponding to digital commerce mentioned above, and in line with the “National Economic Industry Classification 2017”, the industries corresponding to digital commerce include the following three subcategories of “Internet wholesale”, “Internet retail”, and “Trade agency” within Category F “Wholesale and Retail Trade”.
- (2)
- Estimating missing values.
Drawing from the BEA’s accounting method for e-commerce value added, we assume that the proportion of total output from industries related to digital commerce within wholesale and retail trade equals the proportion of value added from these industries within wholesale and retail trade. This section utilizes data from the “China Economic Census Yearbook” to establish the ratio of the sum of main business income from internet wholesale, internet retail, and online trade brokerage to the total main business income within wholesale and retail trade. This ratio represents the proportion of total output from internet wholesale, internet retail, and online trade brokerage to total output within wholesale and retail trade. Assuming that this ratio remains stable in the short term, we can derive the digital economy adjustment coefficient for wholesale and retail trade. By combining historical value-added data from wholesale and retail trade collected from the “China Statistical Yearbook”, we can obtain the value-added data for digital commerce from 2007 to 2017.
Estimating the output of digital commerce follows a similar approach to digital infrastructure. Initially, we utilize the business income of wholesale and retail trade (sourced from the Trade and External Economic Statistics Department of the National Bureau of Statistics, “China Trade and External Economic Statistics Yearbook”, “China Retail and Catering Chain Enterprise Statistics Yearbook”, and “Large and Medium-Sized Wholesale, Retail, and Accommodation and Catering Enterprises Statistical Yearbook”.) to calculate growth rates. By combining these rates with known output data from wholesale and retail trade for specific years, we can estimate the missing values of wholesale and retail trade output for each province from 2007 to 2017.
Appendix B.5. Calculation of Digital Media
- (1)
- Digital media refers to content created, accessed, stored, or browsed by users on digital devices.
In the BEA’s estimation of output and value added for digital media, digital media is divided into three parts: data streaming services, internet publishing, and internet broadcasting. Through filtering industries that produce digital media products within the National Economic Industry Classification, according to the “National Economic Industry Classification 2017”, the industries corresponding to digital media include Category R “Culture, Sports, and Entertainment” with the 87th class “Radio, Television, Film, and Sound Production”, as well as the three subcategories “Audiovisual Publishing”, “Electronic Publishing”, and “Digital Publishing”.
- (2)
- The estimation of the value added for digital media.
Firstly, this study collected and compiled provincial value-added data for the cultural, sports, and entertainment industries from 2007 to 2017. The data primarily originated from detailed annual statistical yearbooks on economic accounting by industry for each province in China. Concurrently, this study gathered and organized provincial revenue data for the cultural, sports, and entertainment industries, sourced from the annual “China Tertiary Industry Statistical Yearbook”, “China Cultural and Related Industries Statistical Yearbook”, and “China Cultural and Tourism Statistical Yearbook”.
Next, we assume that the combined output of “Audiovisual Products Publishing”, “Electronic Publications Publishing”, and “Digital Publishing” within the “Culture, Sports, and Entertainment” industry represents the same proportion of total output as their respective values added within these industries. This study utilizes data from annual editions of the “China Publishing Yearbook” to establish the ratio of sales revenue from “Audiovisual Products Publishing”, “Electronic Publications Publishing”, and “Digital Publishing” to total publishing industry sales from 2007 to 2017. This ratio determines the proportion of total output from “Audiovisual Products Publishing”, “Electronic Publications Publishing”, and “Digital Publishing” within the “Culture, Sports, and Entertainment” industry. Assuming this proportion remains stable in the short term, we can derive the digital economy adjustment coefficient for these three subcategories. By combining the collected historical value-added data for the “Culture, Sports and Entertainment” industry, the value-added data for the three subcategories from 2007 to 2017 are obtained for each province.
Lastly, we assume that the total output of “Broadcasting, Television, Film, and Recording Production” within the “Culture, Sports, and Entertainment” industry represents the same proportion of total output as their respective values added within these industries. This study uses data from annual editions of the “China Tertiary Industry Statistical Yearbook” to establish the ratio of business income from “Broadcasting, Television, Film, and Recording Production” to the total revenue of cultural and sports activities is calculated for each province from 2013 to 2017. This ratio determines the proportion of total output from “Broadcasting, Television, Film, and Recording Production” within the “Culture, Sports, and Entertainment” industry. Assuming this proportion remains stable in the short term, we can derive the digital economy adjustment coefficient for “Broadcasting, Television, Film, and Recording Production”. By combining this with collected historical value-added data for the “Culture, Sports, and Entertainment” industry, we obtain the value-added data for “Broadcasting, Television, Film, and Recording Production” for each province from 2007 to 2017.
Appendix C. Robustness Tests
Appendix C.1. Measurement Bias in Core Variables
This study employed a different measurement approach for the dependent variable to mitigate the potential bias introduced by measurement errors. Specifically, we replaced the variable “whether the enterprise uses internet systems” with “the proportion of ICT-related expenditure in the enterprise’s annual fixed asset investment”. Subsequently, regression analysis was conducted using model (1). The results, as shown in column (1) of Appendix C Table A2, indicate that β remains significantly positive at the 1% level, consistent with the regression results in Table 4.
Furthermore, the measurement of enterprises’ operation performance was replaced with “operating profit” and “digital operating profit” in this study. The regression results, presented in columns (2)–(3) of Appendix C Table A2, show that β is significantly positive at the 5% and 1% levels, respectively, consistent with the regression results in Table 7. Therefore, it can be concluded that the regression results of this study remain robust after replacing the core dependent variables.
Table A2.
Different measurement approach for dependent variable.
Table A2.
Different measurement approach for dependent variable.
| Variable | ICT-Related Expendituret | Operating Profitt | Digital Operating Profitt |
|---|---|---|---|
| (1) | (2) | (3) | |
| Ln (Digital Economic Growth)t−1 | 3.2930 *** (8.0678) | 0.0717 ** (2.5672) | 0.1557 *** (3.3896) |
| Control Variables | Yes | Yes | Yes |
| Industry Fixed Effects | Yes | Yes | Yes |
| Provincial Fixed Effects | Yes | Yes | Yes |
| Observations | 1455 | 1010 | 1344 |
| R-Squared | 0.2230 | 0.0563 | 0.1569 |
*** p < 0.01; ** p < 0.05.
Accounting for economic scale differences among provinces in China, this study further transformed the measurement of the explanatory variable. We introduced a new core explanatory variable, namely the “proportion of local digital economic growth to GDP”. This adjustment aimed to capture the systematic variations in the level of digital economic development across provinces. The regression results are presented in Appendix C Table A3, where, in columns (1)–(5), β remains significantly positive at the 5% and 1% levels. These findings align with the regression results reported in Table 4 and Table 7. Thus, it can be concluded that, even after replacing the core explanatory variable, the regression results of this study remain robust.
Table A3.
Different measurement approach for independent variable.
Table A3.
Different measurement approach for independent variable.
| Variable | Digital Transformationt | Revenuet | Digital Revenuet | Frequency of Digital Production Innovationt | Significance of Digital Production Innovationt |
|---|---|---|---|---|---|
| (1) | (2) | (3) | (4) | (5) | |
| Digital Economic Growth/GDP | 0.6969 *** (4.9867) | 0.1290 ** (2.8645) | 0.0431 ** (2.9728) | 1.1330 *** (7.1148) | 0.7268 *** (7.6079) |
| Control Variables | Yes | Yes | Yes | Yes | Yes |
| Industry Fixed Effects | Yes | Yes | Yes | Yes | Yes |
| Provincial Fixed Effects | Yes | Yes | Yes | Yes | Yes |
| Observations | 1455 | 1455 | 1369 | 1440 | 1259 |
| R-Squared | 0.1285 | 0.6390 | 0.1976 | 0.079 | 0.0728 |
*** p < 0.01; ** p < 0.05.
Appendix C.2. Propensity Score Matching (PSM)
The digital transformation of enterprises may be influenced not only by the local supply level of digital elements but also by the characteristics of the enterprises themselves. To address this potential problem, we employed propensity score matching to construct the sample. Five enterprise-level variables, namely “asset size”, “operating revenue”, “number of employees”, “employee education level”, and “industry affiliation”, were selected as matching variables. The “one-to-one without replacement” nearest neighbor matching method was used to obtain a control group that closely matched the characteristics of the enterprises involved in digital transformation. Subsequently, regression analysis was conducted using model (1). The regression results, as shown in Appendix C Table A4, indicate that, in columns (1)–(5), β remains significantly positive at the 5% and 1% levels, consistent with the regression results in Table 4 and Table 7. Therefore, it can be concluded that the empirical results of this study remain robust after controlling for the influence of enterprise characteristics.
Table A4.
Propensity score matching.
Table A4.
Propensity score matching.
| Variable | Digital Transformationt | Revenuet | Digital Revenuet | Frequency of Digital Production Innovationt | Significance of Digital Production Innovationt |
|---|---|---|---|---|---|
| (1) | (2) | (3) | (4) | (5) | |
| Ln (Digital Economic Growth)t−1 | 1.2786 ** (2.1808) | 0.4442 ** (2.2571) | 0.1645 ** (2.5455) | 3.9134 *** (7.9345) | 2.4090 *** (5.3294) |
| Control Variables | Yes | Yes | Yes | Yes | Yes |
| Industry Fixed Effects | Yes | Yes | Yes | Yes | Yes |
| Provincial Fixed Effects | Yes | Yes | Yes | Yes | Yes |
| Observations | 758 | 758 | 695 | 752 | 630 |
| R-Squared | 0.1448 | 0.5602 | 0.1599 | 0.0702 | 0.0778 |
*** p < 0.01; ** p < 0.05.
Notes
| 1 | |
| 2 | |
| 3 | Given that 2003 marked the inception of official disclosure of statistical information related to China’s internet industry, selecting it as the instrumental variable allows for a more comprehensive reflection of the historical accumulation of digital talent across different regions. |
| 4 | In light of length constraints, a table of first-stage regression results is not presented in the text of this paper. |
| 5 | We further conducted robustness tests on this portion of the results, such as propensity score matching (PSM), and performed sensitivity analysis by replacing core variables to further alleviate endogeneity concerns in the regression results. Due to space limitations, these empirical findings are presented in Appendix C. |
| 6 | https://www.ekonomi.gov.my/sites/default/files/2021-07/National-4IR-Policy.pdf (accessed on 1 July 2021). |
References
- Pan, W.; Xie, T.; Wang, Z.; Ma, L. Digital economy: An innovation driver for total factor productivity. J. Bus. Res. 2022, 139, 303–311. [Google Scholar] [CrossRef]
- Chaudhuri, A.; Subramanian, N.; Dora, M. Circular economy and digital capabilities of SMEs for providing value to customers: Combined resource-based view and ambidexterity perspective. J. Bus. Res. 2022, 142, 32–44. [Google Scholar] [CrossRef]
- Matarazzo, M.; Penco, L.; Profumo, G.; Quaglia, R. Digital transformation and customer value creation in Made in Italy SMEs: A dynamic capabilities perspective. J. Bus. Res. 2021, 123, 642–656. [Google Scholar] [CrossRef]
- Hadjielias, E.; Christofi, M.; Christou, P.; Hadjielia Drotarova, M. Digitalization, agility, and customer value in tourism. Technol. Forecast. Soc. Change 2022, 175, 121334. [Google Scholar] [CrossRef]
- Kiron, D.; Kane, G.C.; Palmer, D.; Phillips, A.N.; Buckley, N. Aligning the organization for its digital future. MIT Sloan Manag. Rev. 2016, 58, 1–29. [Google Scholar]
- Senyo, P.K.; Liu, K.; Effah, J. Digital business ecosystem: Literature review and a framework for future research. Int. J. Inf. Manag. 2019, 47, 52–64. [Google Scholar] [CrossRef]
- Pozzi, A.; Schivardi, F. Demand or productivity: What determines firm growth? RAND J. Econ. 2016, 47, 608–630. [Google Scholar] [CrossRef]
- Schivardi, F.; Schmitz, T. The IT revolution and southern europe’s two lost decades. J. Eur. Econ. Assoc. 2020, 18, 2441–2486. [Google Scholar] [CrossRef]
- Ghafoori, A.; Gupta, M.; Merhi, M.I.; Gupta, S.; Shore, A.P. Toward the role of organizational culture in data-driven digital transformation. Int. J. Prod. Econ. 2024, 271, 109205. [Google Scholar] [CrossRef]
- Tortorella, G.L.; Cawley Vergara, A.M.; Garza-Reyes, J.A.; Sawhney, R. Organizational learning paths based upon industry 4.0 adoption: An empirical study with Brazilian manufacturers. Int. J. Prod. Econ. 2020, 219, 284–294. [Google Scholar] [CrossRef]
- Goldfarb, A.; Tucker, C. Digital economics. J. Econ. Lit. 2019, 57, 3–43. [Google Scholar] [CrossRef]
- Helfat, C.E.; Raubitschek, R.S. Dynamic and integrative capabilities for profiting from innovation in digital platform-based ecosystems. Res. Policy 2018, 47, 1391–1399. [Google Scholar] [CrossRef]
- Peng, H.; Lu, Y.; Gupta, S. Promoting value emergence through digital platform ecosystems: Perspectives on resource integration in China. Technol. Forecast. Soc. Change 2023, 189, 122338. [Google Scholar] [CrossRef]
- Wu, L.; Hitt, L.; Lou, B. Data analytics, innovation, and firm productivity. Manag. Sci. 2020, 66, 2017–2039. [Google Scholar] [CrossRef]
- Kohli, R.; Melville, N.P. Digital innovation: A review and synthesis. Inf. Syst. J. 2019, 29, 200–223. [Google Scholar] [CrossRef]
- Guo, X.; Li, M.; Wang, Y.; Mardani, A. Does digital transformation improve the firm’s performance? From the perspective of digitalization paradox and managerial myopia. J. Bus. Res. 2023, 163, 113868. [Google Scholar] [CrossRef]
- Kane, G.C.; Phillips, A.N.; Copulsky, J.; Andrus, G. How digital leadership is (n’t) different. MIT Sloan Manag. Rev. 2019, 60, 34–39. [Google Scholar]
- Malodia, S.; Mishra, M.; Fait, M.; Papa, A.; Dezi, L. To digit or to head? Designing digital transformation journey of SMEs among digital self-efficacy and professional leadership. J. Bus. Res. 2023, 157, 113547. [Google Scholar] [CrossRef]
- Shakina, E.; Parshakov, P.; Alsufiev, A. Rethinking the corporate digital divide: The complementarity of technologies and the demand for digital skills. Technol. Forecast. Soc. Change 2021, 162, 120405. [Google Scholar] [CrossRef]
- Zahoor, N.; Zopiatis, A.; Adomako, S.; Lamprinakos, G. The micro-foundations of digitally transforming SMEs: How digital literacy and technology interact with managerial attributes. J. Bus. Res. 2023, 159, 113755. [Google Scholar] [CrossRef]
- Zhao, L.; He, Q.; Guo, L.; Sarpong, D. Organizational digital literacy and enterprise digital transformation: Evidence from Chinese listed companies. IEEE Trans. Eng. Manag. 2023, 71, 11884–11897. [Google Scholar] [CrossRef]
- Ciampi, F.; Faraoni, M.; Ballerini, J.; Meli, F. The co-evolutionary relationship between digitalization and organizational agility: Ongoing debates, theoretical developments and future research perspectives. Technol. Forecast. Soc. Change 2022, 176, 121383. [Google Scholar] [CrossRef]
- Leonardi, P.M.; Treem, J.W. Behavioral visibility: A new paradigm for organization studies in the age of digitization, digitalization, and datafication. Organ. Stud. 2020, 41, 1601–1625. [Google Scholar] [CrossRef]
- Proksch, D.; Rosin, A.F.; Stubner, S.; Pinkwart, A. The influence of a digital strategy on the digitalization of new ventures: The mediating effect of digital capabilities and a digital culture. J. Small Bus. Manag. 2024, 62, 1–29. [Google Scholar] [CrossRef]
- Yu, F.; Du, H.; Li, X.; Cao, J. Enterprise digitalization, business strategy and subsidy allocation: Evidence of the signaling effect. Technol. Forecast. Soc. Change 2023, 190, 122472. [Google Scholar] [CrossRef]
- Xie, Y.; Wu, D. How does competition policy affect enterprise digitization? Dual perspectives of digital commitment and digital innovation. J. Bus. Res. 2024, 178, 114651. [Google Scholar] [CrossRef]
- Veile, J.W.; Schmidt, M.-C.; Voigt, K.-I. Toward a new era of cooperation: How industrial digital platforms transform business models in Industry 4.0. J. Bus. Res. 2022, 143, 387–405. [Google Scholar] [CrossRef]
- Jia, Y.; Su, J.; Cui, L.; Wu, L.; Tan, K.H. Platform business model innovation in the digitalization era: A “driver-process-result” perspective. J. Bus. Res. 2023, 160, 113818. [Google Scholar] [CrossRef]
- Schrage, M. How the big data explosion has changed decision making. Harv. Bus. Rev. 2016, 25, 1–6. [Google Scholar]
- Yaqoob, I.; Hashem, I.A.T.; Gani, A.; Mokhtar, S.; Ahmed, E.; Anuar, N.B.; Vasilakos, A.V. Big data: From beginning to future. Int. J. Inf. Manag. 2016, 36, 1231–1247. [Google Scholar] [CrossRef]
- Fosso Wamba, S.; Akter, S.; Trinchera, L.; De Bourmont, M. Turning information quality into firm performance in the big data economy. Manag. Decis. 2019, 57, 1756–1783. [Google Scholar] [CrossRef]
- Fürstenau, D.; Baiyere, A.; Kliewer, N. A dynamic model of embeddedness in digital infrastructures. Inf. Syst. Res. 2019, 30, 1319–1342. [Google Scholar] [CrossRef]
- Schade, P.; Schuhmacher, M.C. Digital infrastructure and entrepreneurial action-formation: A multilevel study. J. Bus. Ventur. 2022, 37, 106232. [Google Scholar] [CrossRef]
- Rai, A.; Constantinides, P.; Sarker, S. Next generation digital platforms: Toward human-AI hybrids. MIS Q. 2019, 43, iii–ix. [Google Scholar]
- Ojha, D.; Patel, P.C.; Parida, V. Virtual integration in SMEs: The digitalization circuitry of dynamic strategic planning for SMEs. Int. J. Inf. Manag. 2023, 73, 102657. [Google Scholar] [CrossRef]
- Taeuscher, K.; Rothe, H. Optimal distinctiveness in platform markets: Leveraging complementors as legitimacy buffers. Strateg. Manag. J. 2021, 42, 435–461. [Google Scholar] [CrossRef]
- Wormald, A.; Shah, S.K.; Braguinsky, S.; Agarwal, R. Pioneering digital platform ecosystems: The role of aligned capabilities and motives in shaping key choices and performance outcomes. Strateg. Manag. J. 2023, 44, 1653–1697. [Google Scholar] [CrossRef]
- Skare, M.; de Obesso, M.d.l.M.; Ribeiro-Navarrete, S. Digital transformation and European small and medium enterprises (SMEs): A comparative study using digital economy and society index data. Int. J. Inf. Manag. 2023, 68, 102594. [Google Scholar] [CrossRef]
- Pittaway, J.J.; Montazemi, A.R. Know-how to lead digital transformation: The case of local governments. Gov. Inf. Q. 2020, 37, 101474. [Google Scholar] [CrossRef]
- Rodrigues, M.; Franco, M. Digital entrepreneurship in local government: Case study in Municipality of Fundão, Portugal. Sustain. Cities Soc. 2021, 73, 103115. [Google Scholar] [CrossRef]
- Reinsel, D.; Gantz, J.; Rydning, J. The Digitization of the World: From Edge to Core. Available online: https://www.seagate.com/files/www-content/our-story/trends/files/idc-seagate-dataage-whitepaper.pdf (accessed on 10 March 2025).
- Grewal, D.; Herhausen, D.; Ludwig, S.; Ordenes, F.V. The future of digital communication research: Considering dynamics and multimodality. J. Retail. 2022, 98, 224–240. [Google Scholar] [CrossRef]
- Yang, M.; Fu, M.; Zhang, Z. The adoption of digital technologies in supply chains: Drivers, process and impact. Technol. Forecast. Soc. Change 2021, 169, 120795. [Google Scholar] [CrossRef]
- Zhou, F.; Wen, H.; Lee, C.-C. Broadband infrastructure and export growth. Telecommun. Policy 2022, 46, 102347. [Google Scholar] [CrossRef]
- Spring, M.; Faulconbridge, J.; Sarwar, A. How information technology automates and augments processes: Insights from Artificial-Intelligence-based systems in professional service operations. J. Oper. Manag. 2022, 68, 592–618. [Google Scholar] [CrossRef]
- Peng, Y.; Tao, C. Can digital transformation promote enterprise performance?—From the perspective of public policy and innovation. J. Innov. Knowl. 2022, 7, 100198. [Google Scholar] [CrossRef]
- Sarwar, Z.; Gao, J.; Khan, A. Nexus of digital platforms, innovation capability, and strategic alignment to enhance innovation performance in the Asia Pacific region: A dynamic capability perspective. Asia Pac. J. Manag. 2024, 41, 867–901. [Google Scholar] [CrossRef]
- Trocin, C.; Hovland, I.V.; Mikalef, P.; Dremel, C. How Artificial Intelligence affords digital innovation: A cross-case analysis of Scandinavian companies. Technol. Forecast. Soc. Change 2021, 173, 121081. [Google Scholar] [CrossRef]
- Nasiri, M.; Saunila, M.; Ukko, J.; Rantala, T.; Rantanen, H. Shaping digital innovation via digital-related capabilities. Inf. Syst. Front. 2023, 25, 1063–1080. [Google Scholar] [CrossRef]
- Kitsios, F.; Kamariotou, M. Digital innovation and entrepreneurship transformation through open data hackathons: Design strategies for successful start-up settings. Int. J. Inf. Manag. 2023, 69, 102472. [Google Scholar] [CrossRef]
- Cui, R.; Li, M.; Zhang, S. AI and procurement. Manuf. Serv. Oper. Manag. 2022, 24, 691–706. [Google Scholar] [CrossRef]
- Govindan, K.; Jain, P.; Singh, R.K.; Mishra, R. Blockchain technology as a strategic weapon to bring procurement 4.0 truly alive: Literature review and future research agenda. Transport. Res. E-Log. 2024, 181, 103352. [Google Scholar] [CrossRef]
- Sjödin, D.; Kamalaldin, A.; Parida, V.; Islam, N. Procurement 4.0: How industrial customers transform procurement processes to capitalize on digital servitization. IEEE Trans. Eng. Manag. 2021, 70, 4175–4190. [Google Scholar] [CrossRef]
- Strohmaier, R.; Rainer, A. Studying general purpose technologies in a multi-sector framework: The case of ICT in Denmark. Struct. Change Econ. Dyn. 2016, 36, 34–49. [Google Scholar] [CrossRef]
- Ngai, E.W.T.; Wu, Y. Machine learning in marketing: A literature review, conceptual framework, and research agenda. J. Bus. Res. 2022, 145, 35–48. [Google Scholar] [CrossRef]
- Fuller, R.; Stocchi, L.; Gruber, T.; Romaniuk, J. Advancing the understanding of the pre-purchase stage of the customer journey for service brands. Eur. J. Mark. 2023, 57, 360–386. [Google Scholar] [CrossRef]
- Huang, M.-H.; Rust, R.T. A framework for collaborative artificial intelligence in marketing. J. Retail. 2022, 98, 209–223. [Google Scholar] [CrossRef]
- Wu, P.; Ngai, E.W.T.; Wu, Y. Impact of praise cashback strategy: Implications for consumers and e-businesses. Prod. Oper. Manag. 2023, 32, 2825–2845. [Google Scholar] [CrossRef]
- Wang, N.; Wan, J.; Ma, Z.; Zhou, Y.; Chen, J. How digital platform capabilities improve sustainable innovation performance of firms: The mediating role of open innovation. J. Bus. Res. 2023, 167, 114080. [Google Scholar] [CrossRef]
- Bonina, C.; Koskinen, K.; Eaton, B.; Gawer, A. Digital platforms for development: Foundations and research agenda. Inf. Syst. J. 2021, 31, 869–902. [Google Scholar] [CrossRef]
- Li, H.; Zhang, C.; Kettinger, W.J. Digital Platform Ecosystem Dynamics: The Roles of Product Scope, Innovation, and Collaborative Network Centrality. MIS Q. 2022, 46, 739. [Google Scholar] [CrossRef]
- Tabrizi, B.; Lam, E.; Girard, K.; Irvin, V. Digital transformation is not about technology. Harv. Bus. Rev. 2019, 13, 1–6. [Google Scholar]
- Chae, B.K. A General framework for studying the evolution of the digital innovation ecosystem: The case of big data. Int. J. Inf. Manag. 2019, 45, 83–94. [Google Scholar] [CrossRef]
- Cozzolino, A.; Corbo, L.; Aversa, P. Digital platform-based ecosystems: The evolution of collaboration and competition between incumbent producers and entrant platforms. J. Bus. Res. 2021, 126, 385–400. [Google Scholar] [CrossRef]
- Hofacker, C.; Golgeci, I.; Pillai, K.G.; Gligor, D.M. Digital marketing and business-to-business relationships: A close look at the interface and a roadmap for the future. Eur. J. Mark. 2020, 54, 1161–1179. [Google Scholar] [CrossRef]
- Jolliff, W.; Nicholson, J.R. Measuring the Digital Economy: An Update Incorporating Data from the 2018 Comprehensive Update of the Industry Economic Accounts; Bureau of Economic Analysis: Washington, DC, USA, 2019. [Google Scholar]
- Xu, X.; Zhang, M. Research on the Measurement of the Scale of China’s Digital Economy: Based on the Perspective of International Comparison. China Ind. Econ. 2020, 5, 23–41. [Google Scholar] [CrossRef]
- GB/T 4754-2017; Industrial Classification for National Economic Activities. Standardization Administration of China: Beijing, China, 2017.
- Zheng, X.; Zhang, X.; Fan, D. Digital transformation, industrial structure change, and economic growth motivation: An empirical analysis based on manufacturing industry in Yangtze River Delta. PLoS ONE 2023, 18, e0284803. [Google Scholar] [CrossRef]
- Chen, N.; Sun, D.; Chen, J. Digital transformation, labour share, and industrial heterogeneity. J. Innov. Knowl. 2022, 7, 100173. [Google Scholar] [CrossRef]
- Zhang, P.; Yang, H.; Chen, C.; Wang, T.; Jia, X. The impact of population aging on corporate digital transformation: Evidence from China. Technol. Forecast. Soc. Change 2025, 214, 124070. [Google Scholar] [CrossRef]
- Kolagar, M.; Parida, V.; Sjödin, D. Ecosystem transformation for digital servitization: A systematic review, integrative framework, and future research agenda. J. Bus. Res. 2022, 146, 176–200. [Google Scholar] [CrossRef]
- Deng, X.; Hou, Q.; Shen, J. Can digital transformation reduce R&D investment disruption during the top executive transition period? Manag. Decis. Econ. 2024, 45, 1901–1926. [Google Scholar] [CrossRef]
- Wu, C.-H.; Chou, C.-W.; Chien, C.-F.; Lin, Y.-S. Digital transformation in manufacturing industries: Effects of firm size, product innovation, and production type. Technol. Forecast. Soc. Change 2024, 207, 123624. [Google Scholar] [CrossRef]
- Zhang, B.-B.; Wang, Y.; Chen, Y.; Zhou, J. Digital transformation by firms and the cleanliness of China’s export products. Energy Econ. 2024, 134, 107592. [Google Scholar] [CrossRef]
- Beugelsdijk, S.; Jindra, B. Product innovation and decision-making autonomy in subsidiaries of multinational companies. J. World Bus. 2018, 53, 529–539. [Google Scholar] [CrossRef]
- Ekman, P.; Thilenius, P.; Thompson, S.; Whitaker, J. Digital transformation of global business processes: The role of dual embeddedness. Bus. Process Manag. J. 2020, 26, 570–592. [Google Scholar] [CrossRef]
- Firk, S.; Hanelt, A.; Oehmichen, J.; Wolff, M. Chief digital officers: An analysis of the presence of a centralized digital transformation role. J. Manag. Stud. 2021, 58, 1800–1831. [Google Scholar] [CrossRef]
- Zhu, Z.; Song, T.; Huang, J.; Zhong, X. Executive cognitive structure, digital policy, and firms’ digital transformation. IEEE Trans. Eng. Manag. 2022, 71, 2579–2592. [Google Scholar] [CrossRef]
- Llopis-Albert, C.; Rubio, F.; Valero, F. Impact of digital transformation on the automotive industry. Technol. Forecast. Soc. Change 2021, 162, 120343. [Google Scholar] [CrossRef]
- Chan, C.M.L.; Teoh, S.Y.; Yeow, A.; Pan, G. Agility in responding to disruptive digital innovation: Case study of an SME. Inf. Syst. J. 2019, 29, 436–455. [Google Scholar] [CrossRef]
- Wenke, K.; Zapkau, F.B.; Schwens, C. Too small to do it all? A meta-analysis on the relative relationships of exploration, exploitation, and ambidexterity with SME performance. J. Bus. Res. 2021, 132, 653–665. [Google Scholar] [CrossRef]
- Cenamor, J.; Parida, V.; Wincent, J. How entrepreneurial SMEs compete through digital platforms: The roles of digital platform capability, network capability and ambidexterity. J. Bus. Res. 2019, 100, 196–206. [Google Scholar] [CrossRef]
- Gao, J.; Zhang, W.; Guan, T.; Feng, Q.; Mardani, A. The effect of manufacturing agent heterogeneity on enterprise innovation performance and competitive advantage in the era of digital transformation. J. Bus. Res. 2023, 155, 113387. [Google Scholar] [CrossRef]
- Hansen, B.E. Threshold effects in non-dynamic panels: Estimation, testing, and inference. J. Econom. 1999, 93, 345–368. [Google Scholar] [CrossRef]
- Blanka, C.; Krumay, B.; Rueckel, D. The interplay of digital transformation and employee competency: A design science approach. Technol. Forecast. Soc. Change 2022, 178, 121575. [Google Scholar] [CrossRef]
- Tambe, P.; Hitt, L.; Rock, D.; Brynjolfsson, E. Digital Capital and Superstar Firms. Available online: https://www.nber.org/papers/w28285 (accessed on 10 March 2025).
- Li, L.; Tang, W.; Zhou, H.; Yang, S. Digitalization and firm performance: The moderating role of top management team attributes. IEEE Trans. Eng. Manag. 2023, 71, 6595–6605. [Google Scholar] [CrossRef]
- Gruber, H. Proposals for a digital industrial policy for Europe. Telecommun. Policy 2019, 43, 116–127. [Google Scholar] [CrossRef]
- Cheng, Z.; Masron, T.A. Economic policy uncertainty and corporate digital transformation: Evidence from China. Appl. Econ. 2023, 55, 4625–4641. [Google Scholar] [CrossRef]
- Agrawal, A.; Tambe, P. Private equity and workers’ career paths: The role of technological change. Rev. Financ. Stud. 2016, 29, 2455–2489. [Google Scholar] [CrossRef]
- Majchrzak, A.; Markus, M.L.; Wareham, J. Designing for digital transformation: Lessons for information systems research from the study of ICT and societal challenges. MIS Q. 2016, 40, 267–278. [Google Scholar] [CrossRef]
- Sebastian, I.M.; Weill, P.; Woerner, S.L. Driving growth in digital ecosystems. MIT Sloan Manag. Rev. 2020, 62, 58–62. [Google Scholar]
- Song, Y.; Du, C.; Du, P.; Liu, R.; Lu, Z. Digital transformation and corporate environmental performance: Evidence from Chinese listed companies. Technol. Forecast. Soc. Change 2024, 201, 123159. [Google Scholar] [CrossRef]
- Lo, F.-Y.; Bui, Q.-T.; Huarng, K.-H. The pace of international expansion for digital multinational enterprises. Technol. Forecast. Soc. Change 2023, 193, 122629. [Google Scholar] [CrossRef]
- Radicic, D.; Petković, S. Impact of digitalization on technological innovations in small and medium-sized enterprises (SMEs). Technol. Forecast. Soc. Change 2023, 191, 122474. [Google Scholar] [CrossRef]
- Li, L.; Su, F.; Zhang, W.; Mao, J.Y. Digital transformation by SME entrepreneurs: A capability perspective. Inf. Syst. J. 2018, 28, 1129–1157. [Google Scholar] [CrossRef]
- Lafuente, E.; Rabetino, R.; Leiva, J.C. Learning from success and failure: Implications for entrepreneurs, SMEs, and policy. Small Bus. Econ. 2025, 64, 1–10. [Google Scholar] [CrossRef]
- Myovella, G.; Karacuka, M.; Haucap, J. Determinants of digitalization and digital divide in Sub-Saharan African economies: A spatial Durbin analysis. Telecommun. Policy 2021, 45, 102224. [Google Scholar] [CrossRef]
- Gaglio, C.; Kraemer-Mbula, E.; Lorenz, E. The effects of digital transformation on innovation and productivity: Firm-level evidence of South African manufacturing micro and small enterprises. Technol. Forecast. Soc. Change 2022, 182, 121785. [Google Scholar] [CrossRef]
- Cottle, R.; Johnson, E.; Wets, R. George B. Dantzig (1914–2005). Not. AMS 2007, 54, 344–362. [Google Scholar]
- Lenzen, M. Environmentally important paths, linkages and key sectors in the Australian economy. Struct. Change Econ. Dyn. 2003, 14, 1–34. [Google Scholar] [CrossRef]
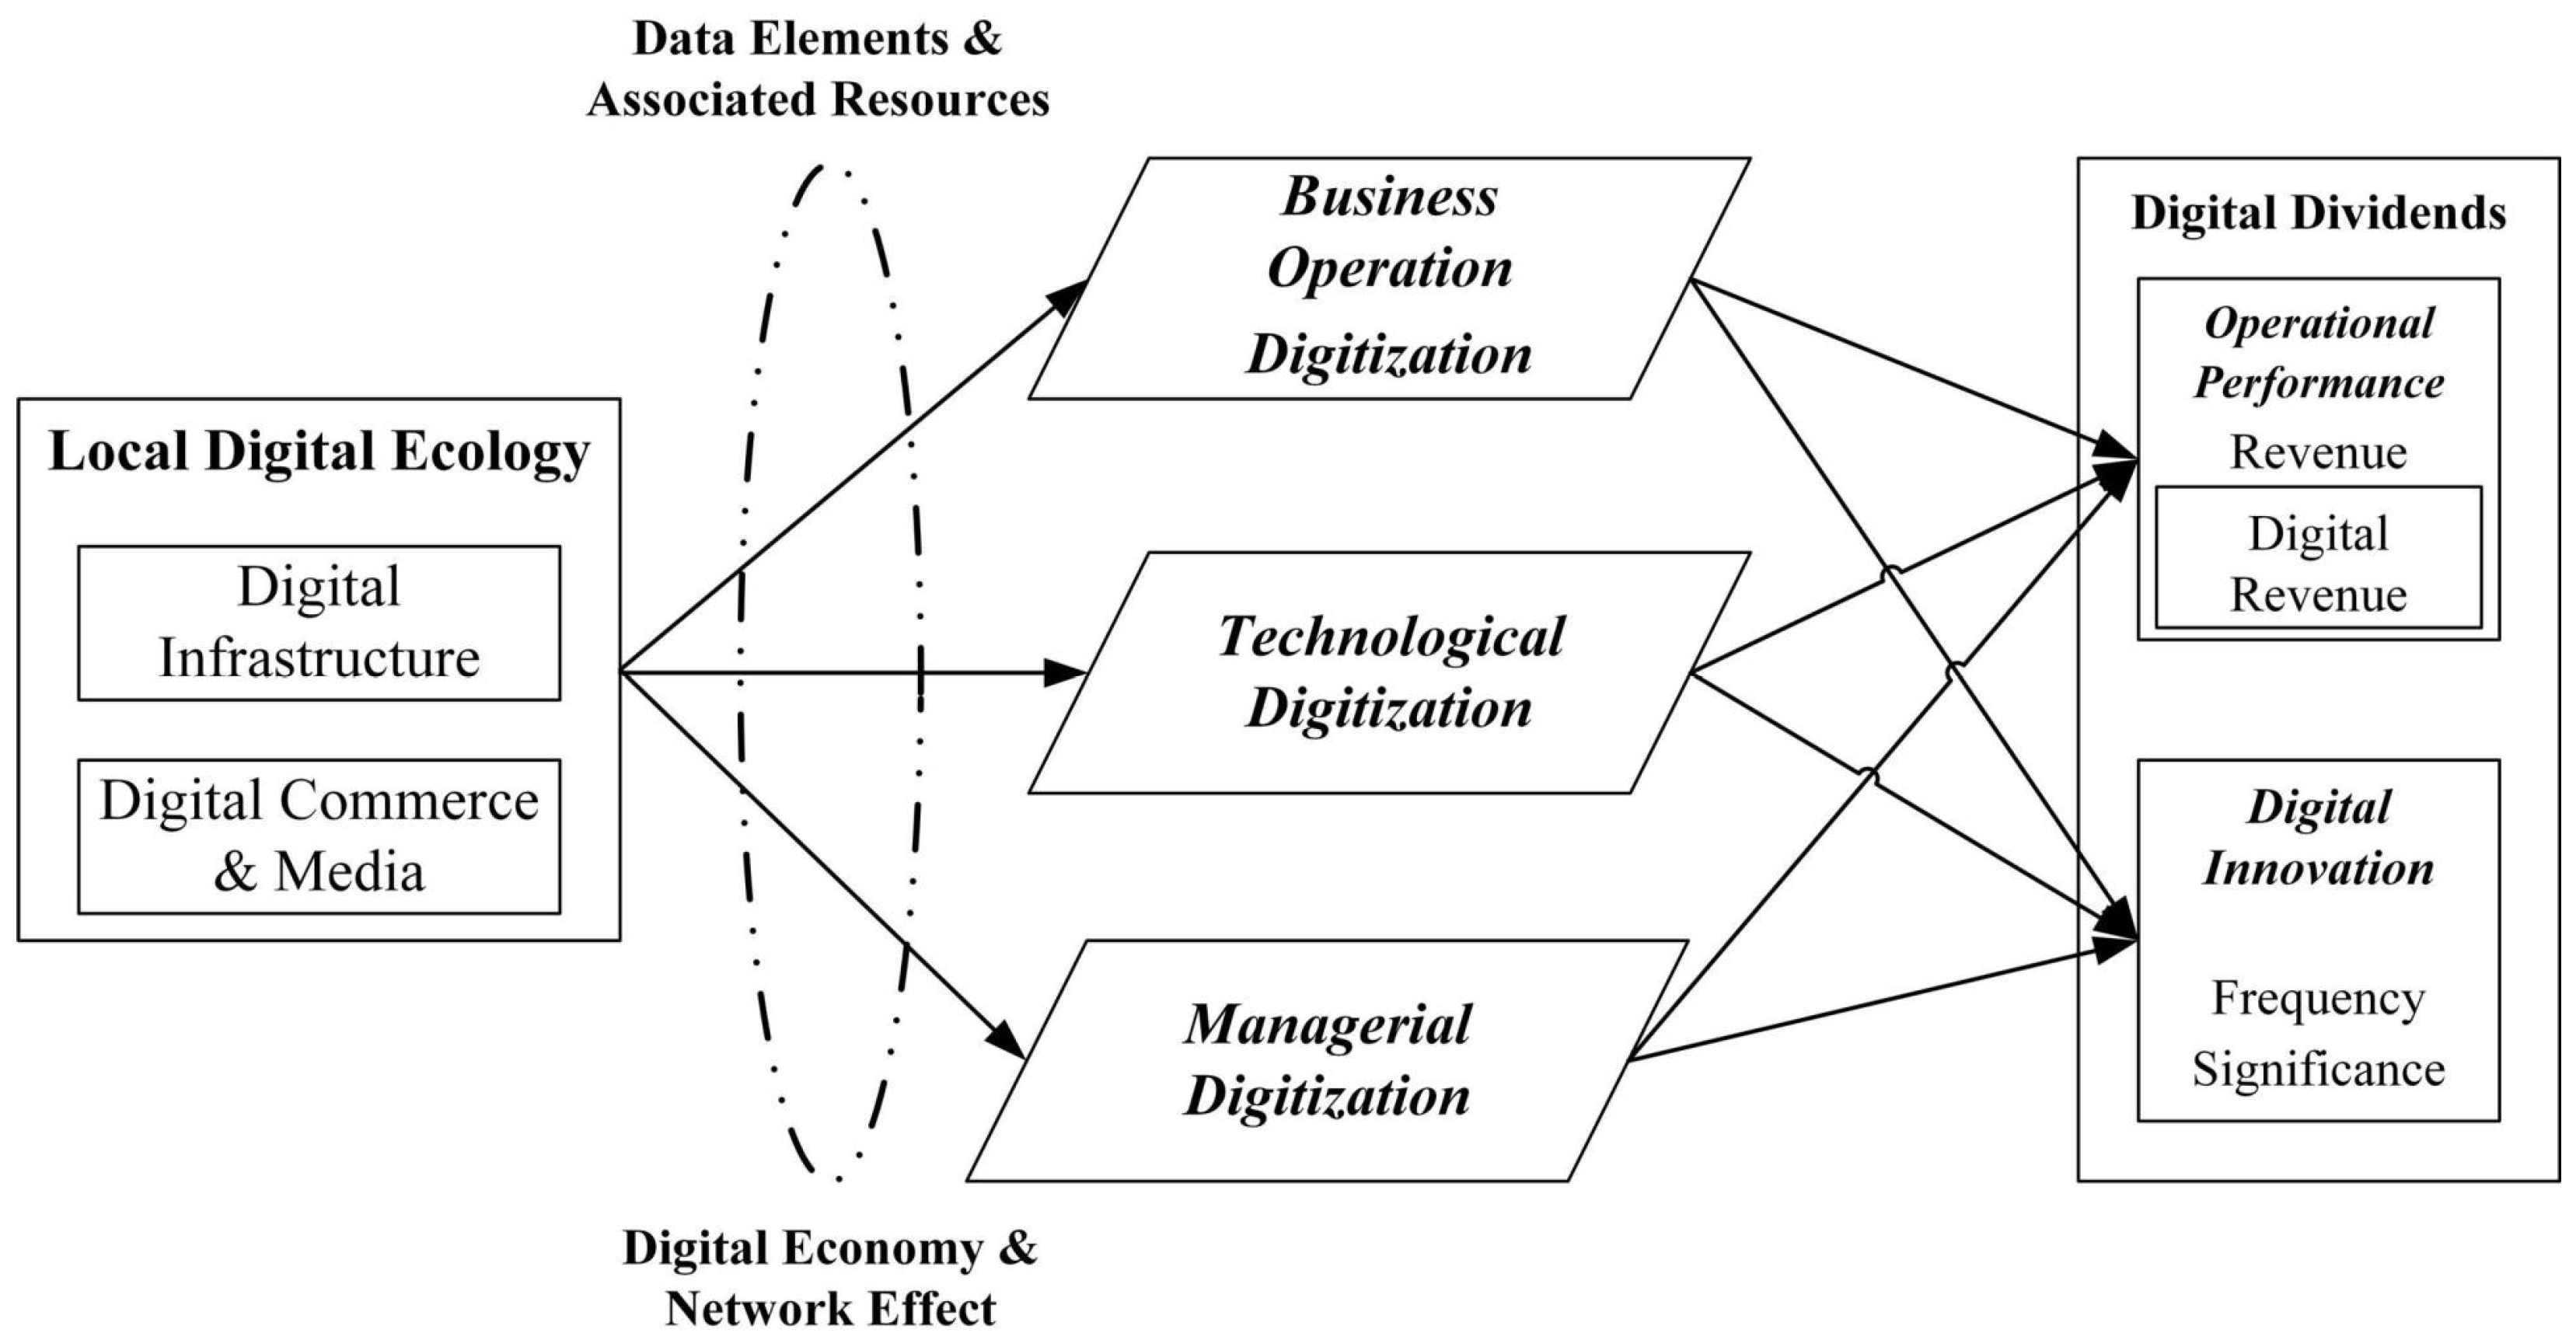
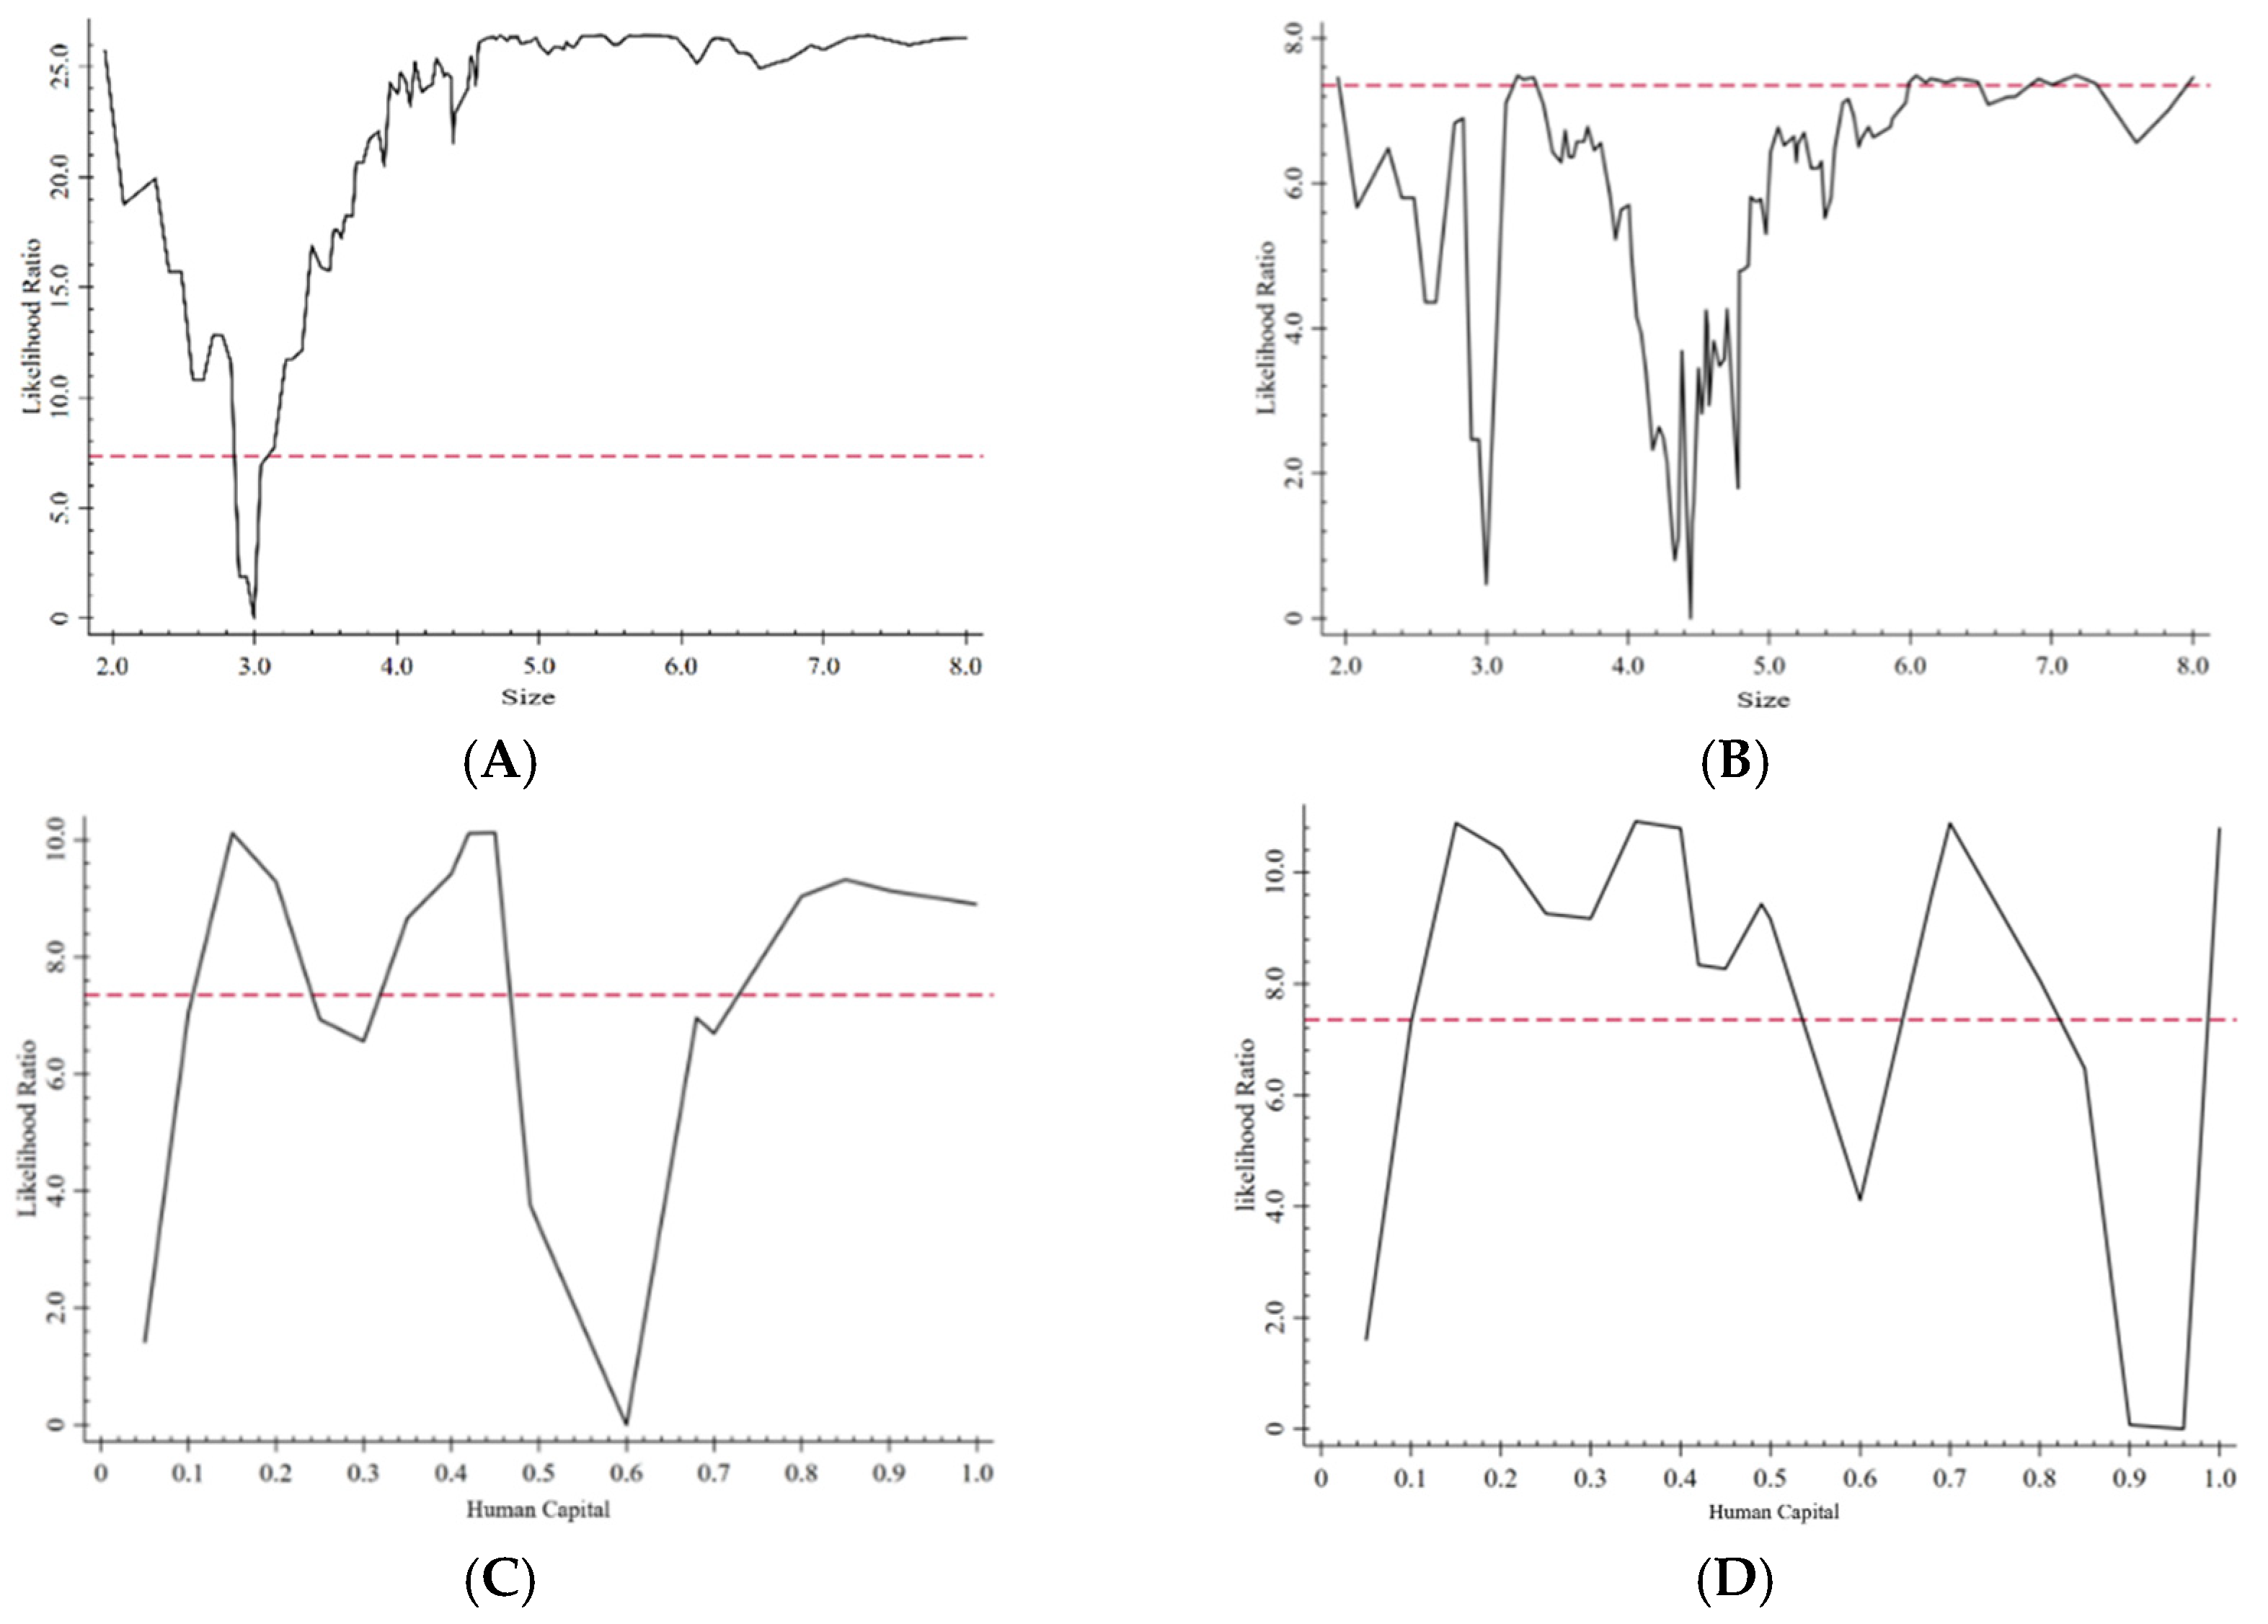
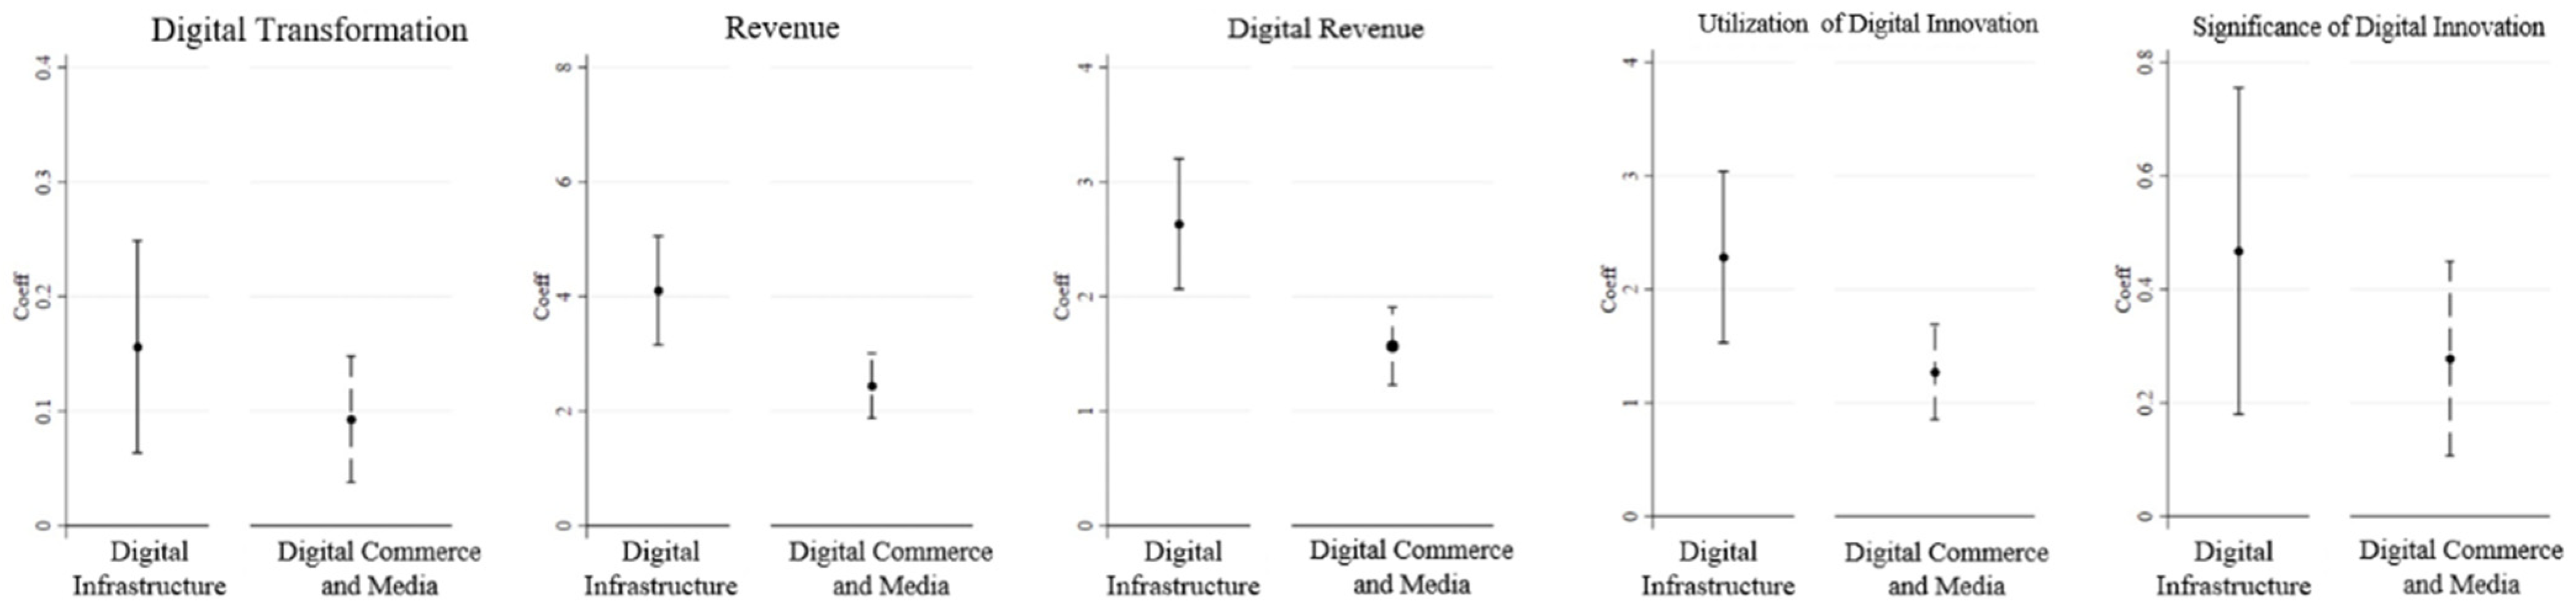
Disclaimer/Publisher’s Note: The statements, opinions and data contained in all publications are solely those of the individual author(s) and contributor(s) and not of MDPI and/or the editor(s). MDPI and/or the editor(s) disclaim responsibility for any injury to people or property resulting from any ideas, methods, instructions or products referred to in the content. |
© 2025 by the authors. Licensee MDPI, Basel, Switzerland. This article is an open access article distributed under the terms and conditions of the Creative Commons Attribution (CC BY) license (https://creativecommons.org/licenses/by/4.0/).