
Smart Cities in the Global Context: Geographical Analyses of Regional Differentiations


Abstract
:1. Introduction
- How do smart cities differentiate across regions?
- How do smart city dimensions relate to each other?
- Which associations exist among smart city dimensions and regions?
- Which factors contribute to the regional differentiations of smart cities?
2. Materials and Methods
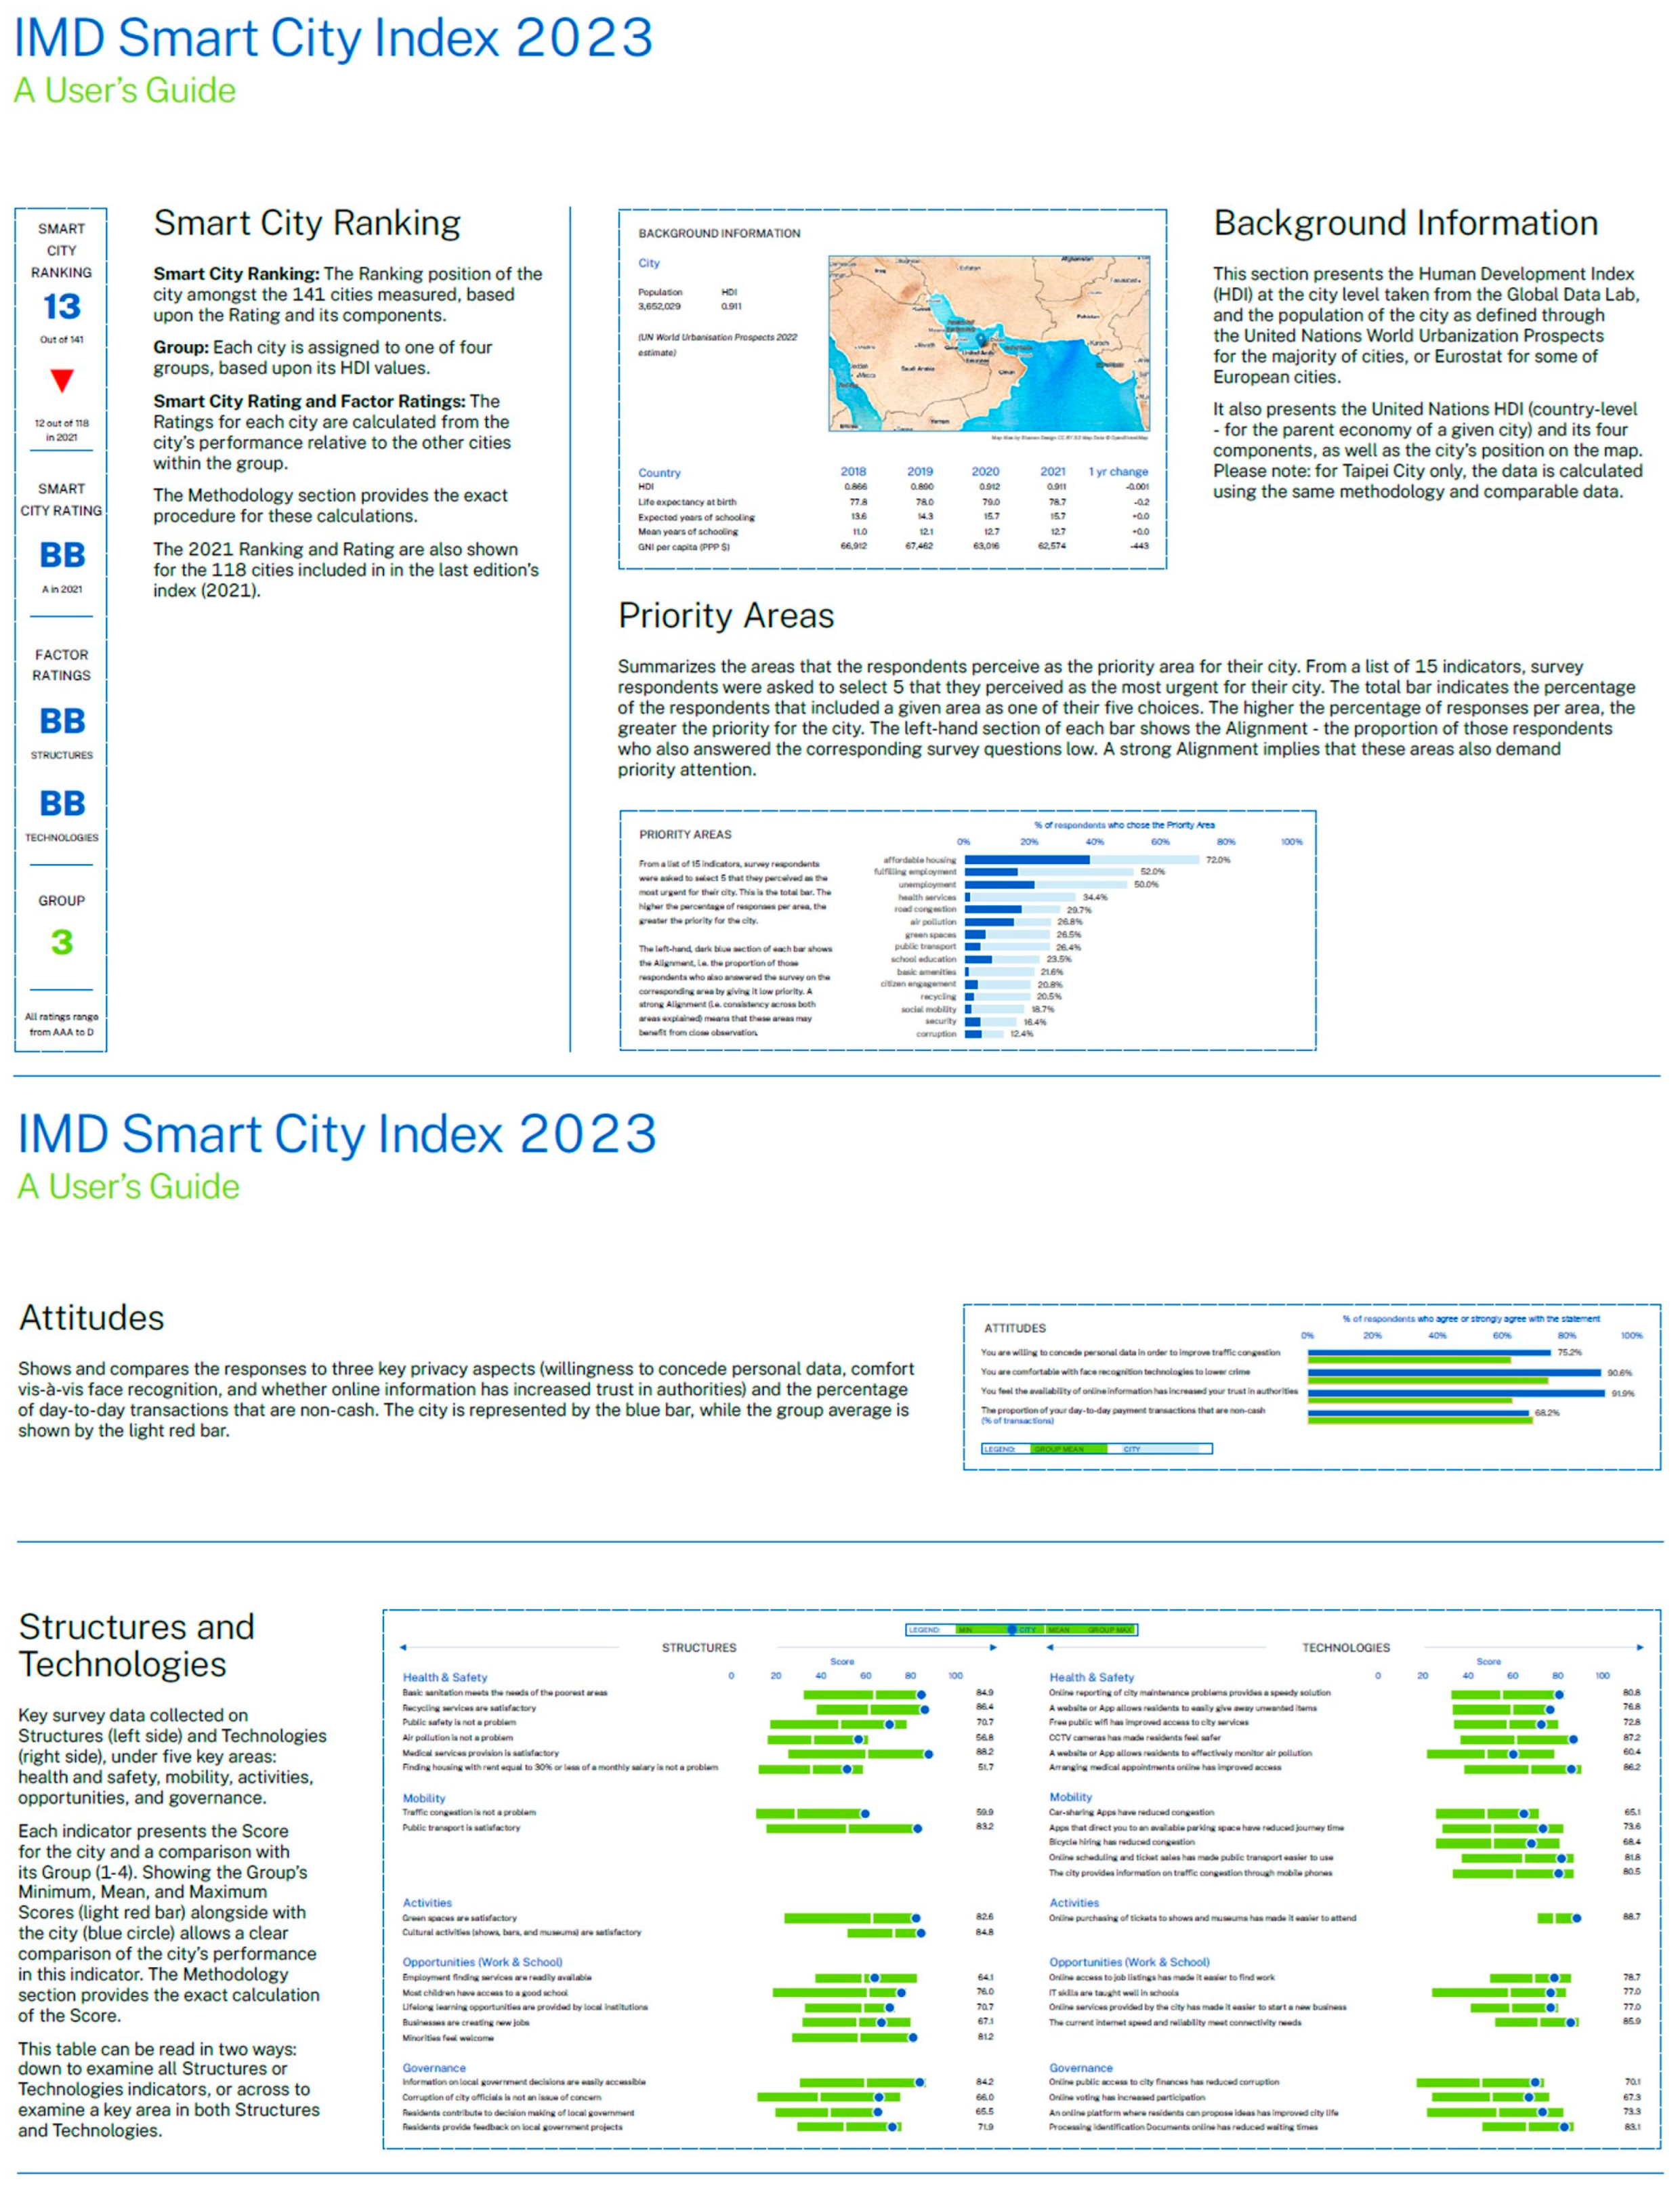
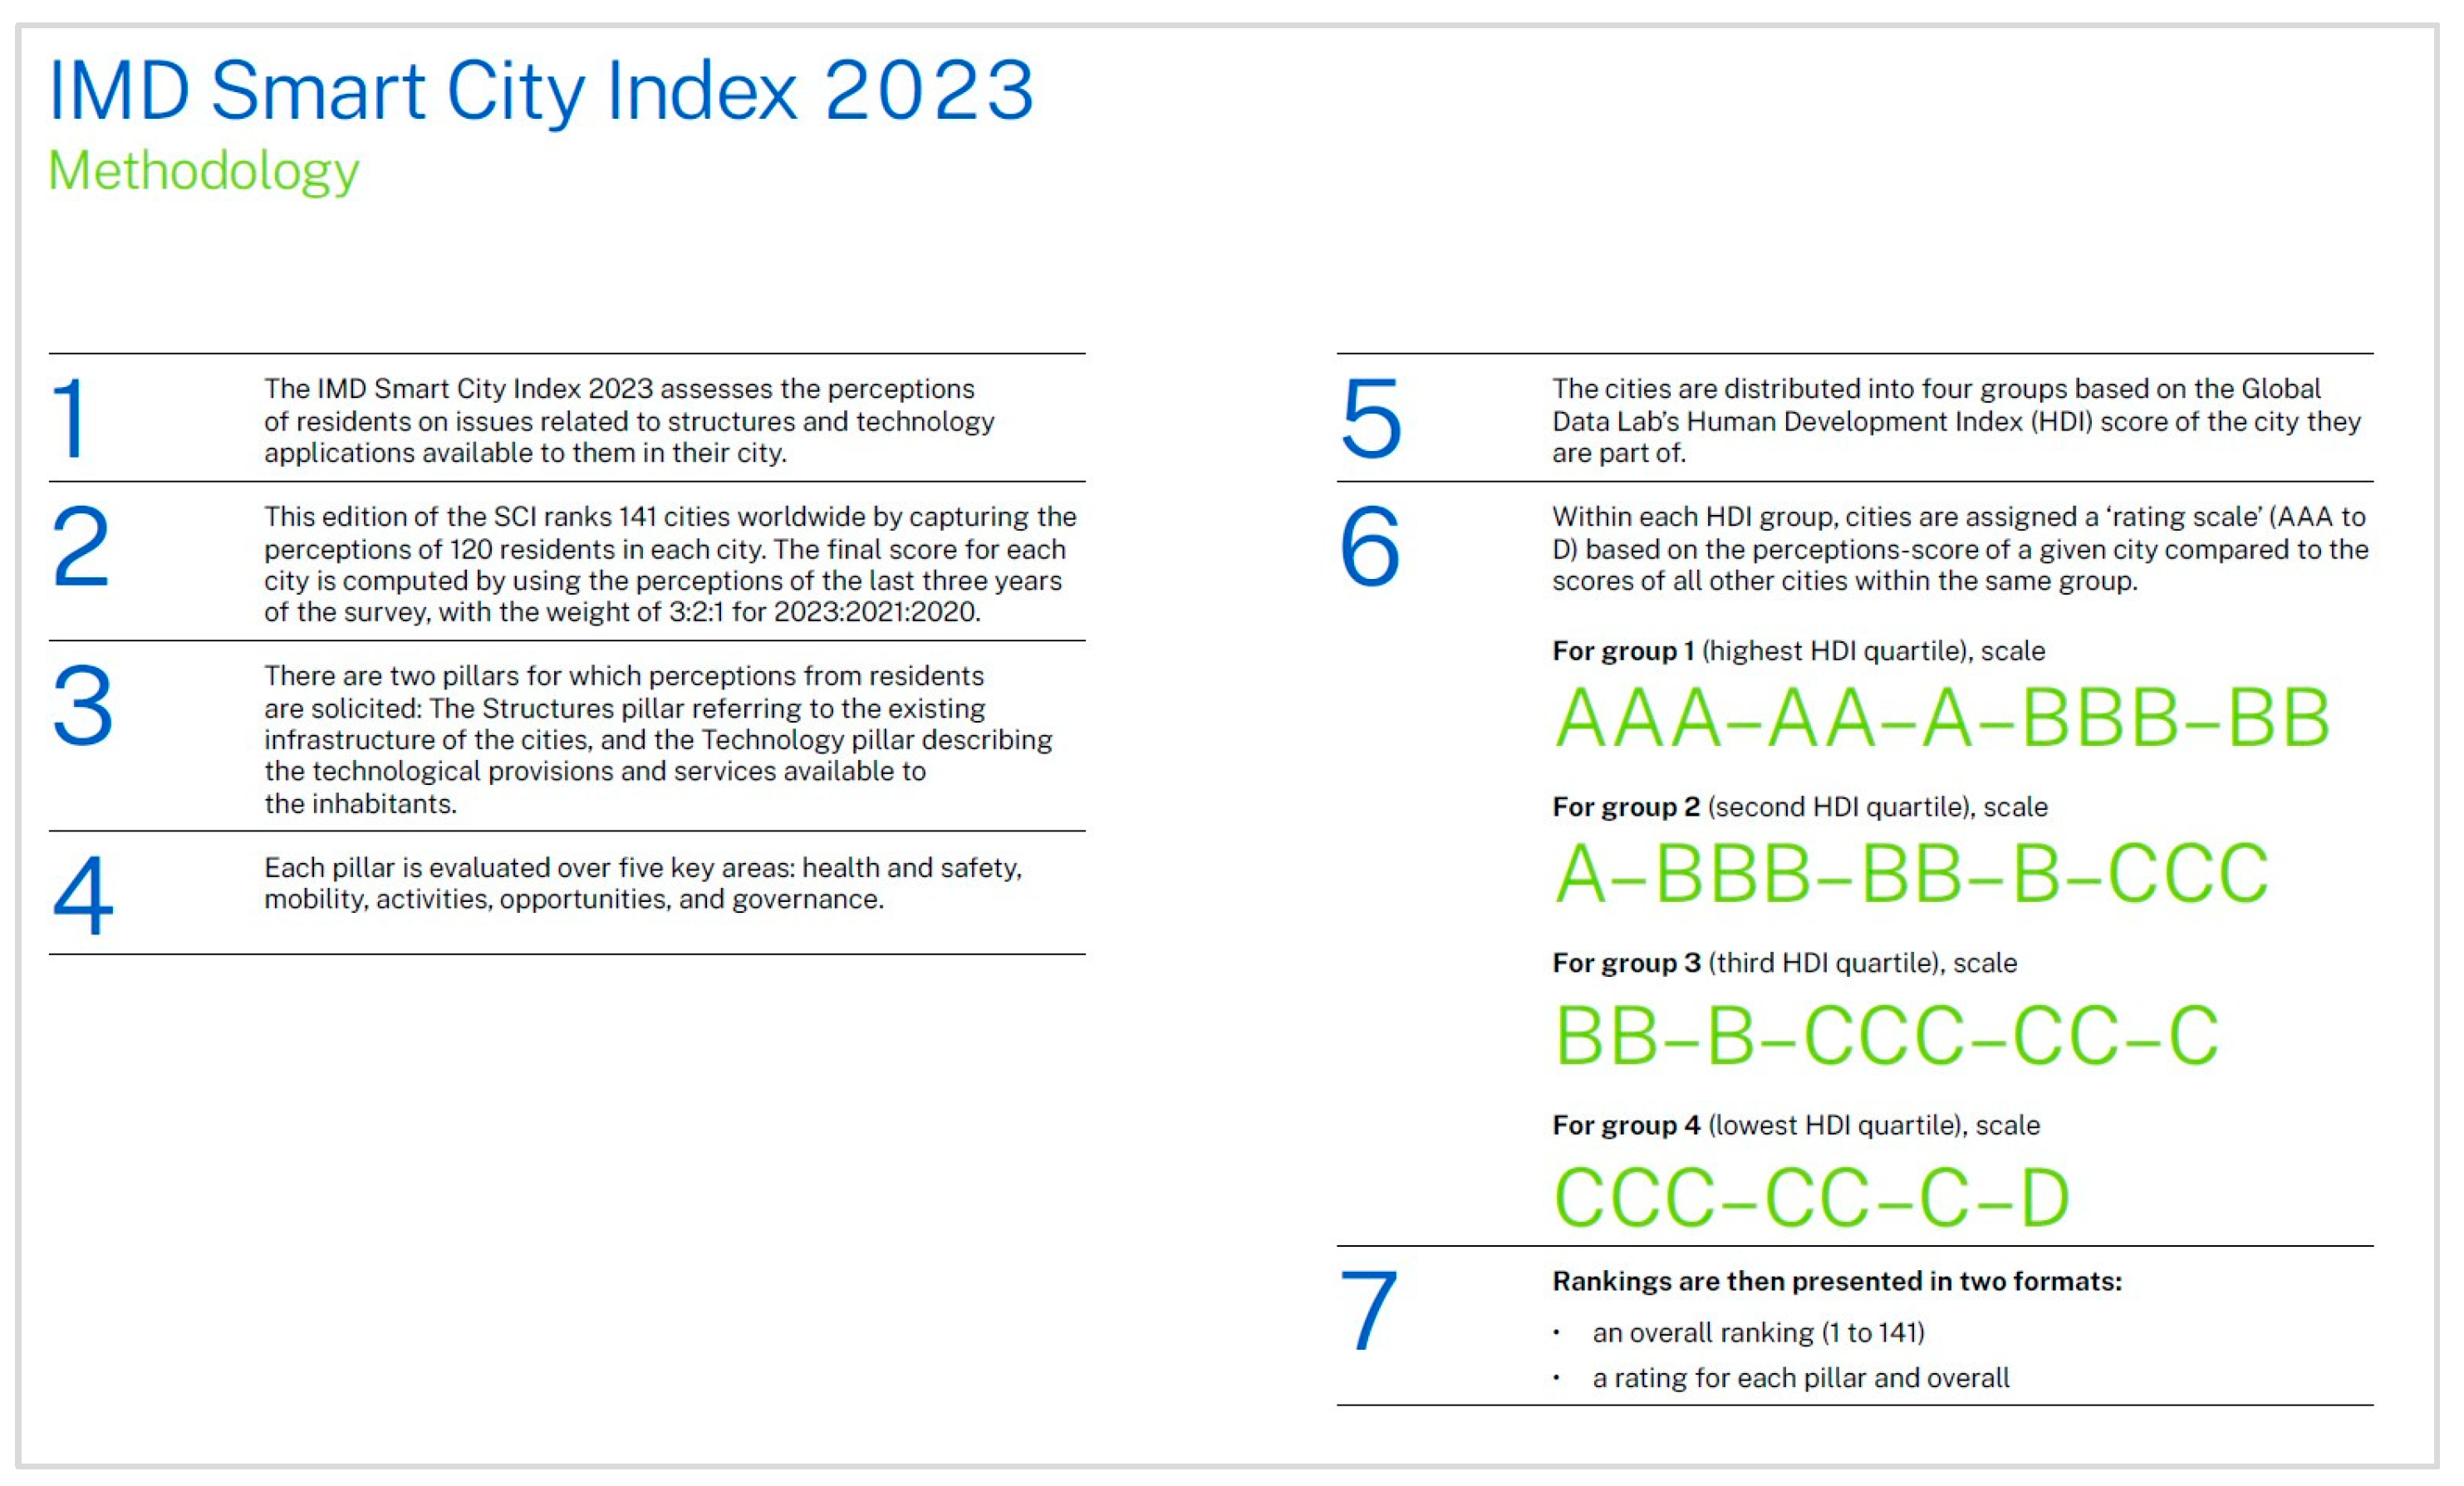
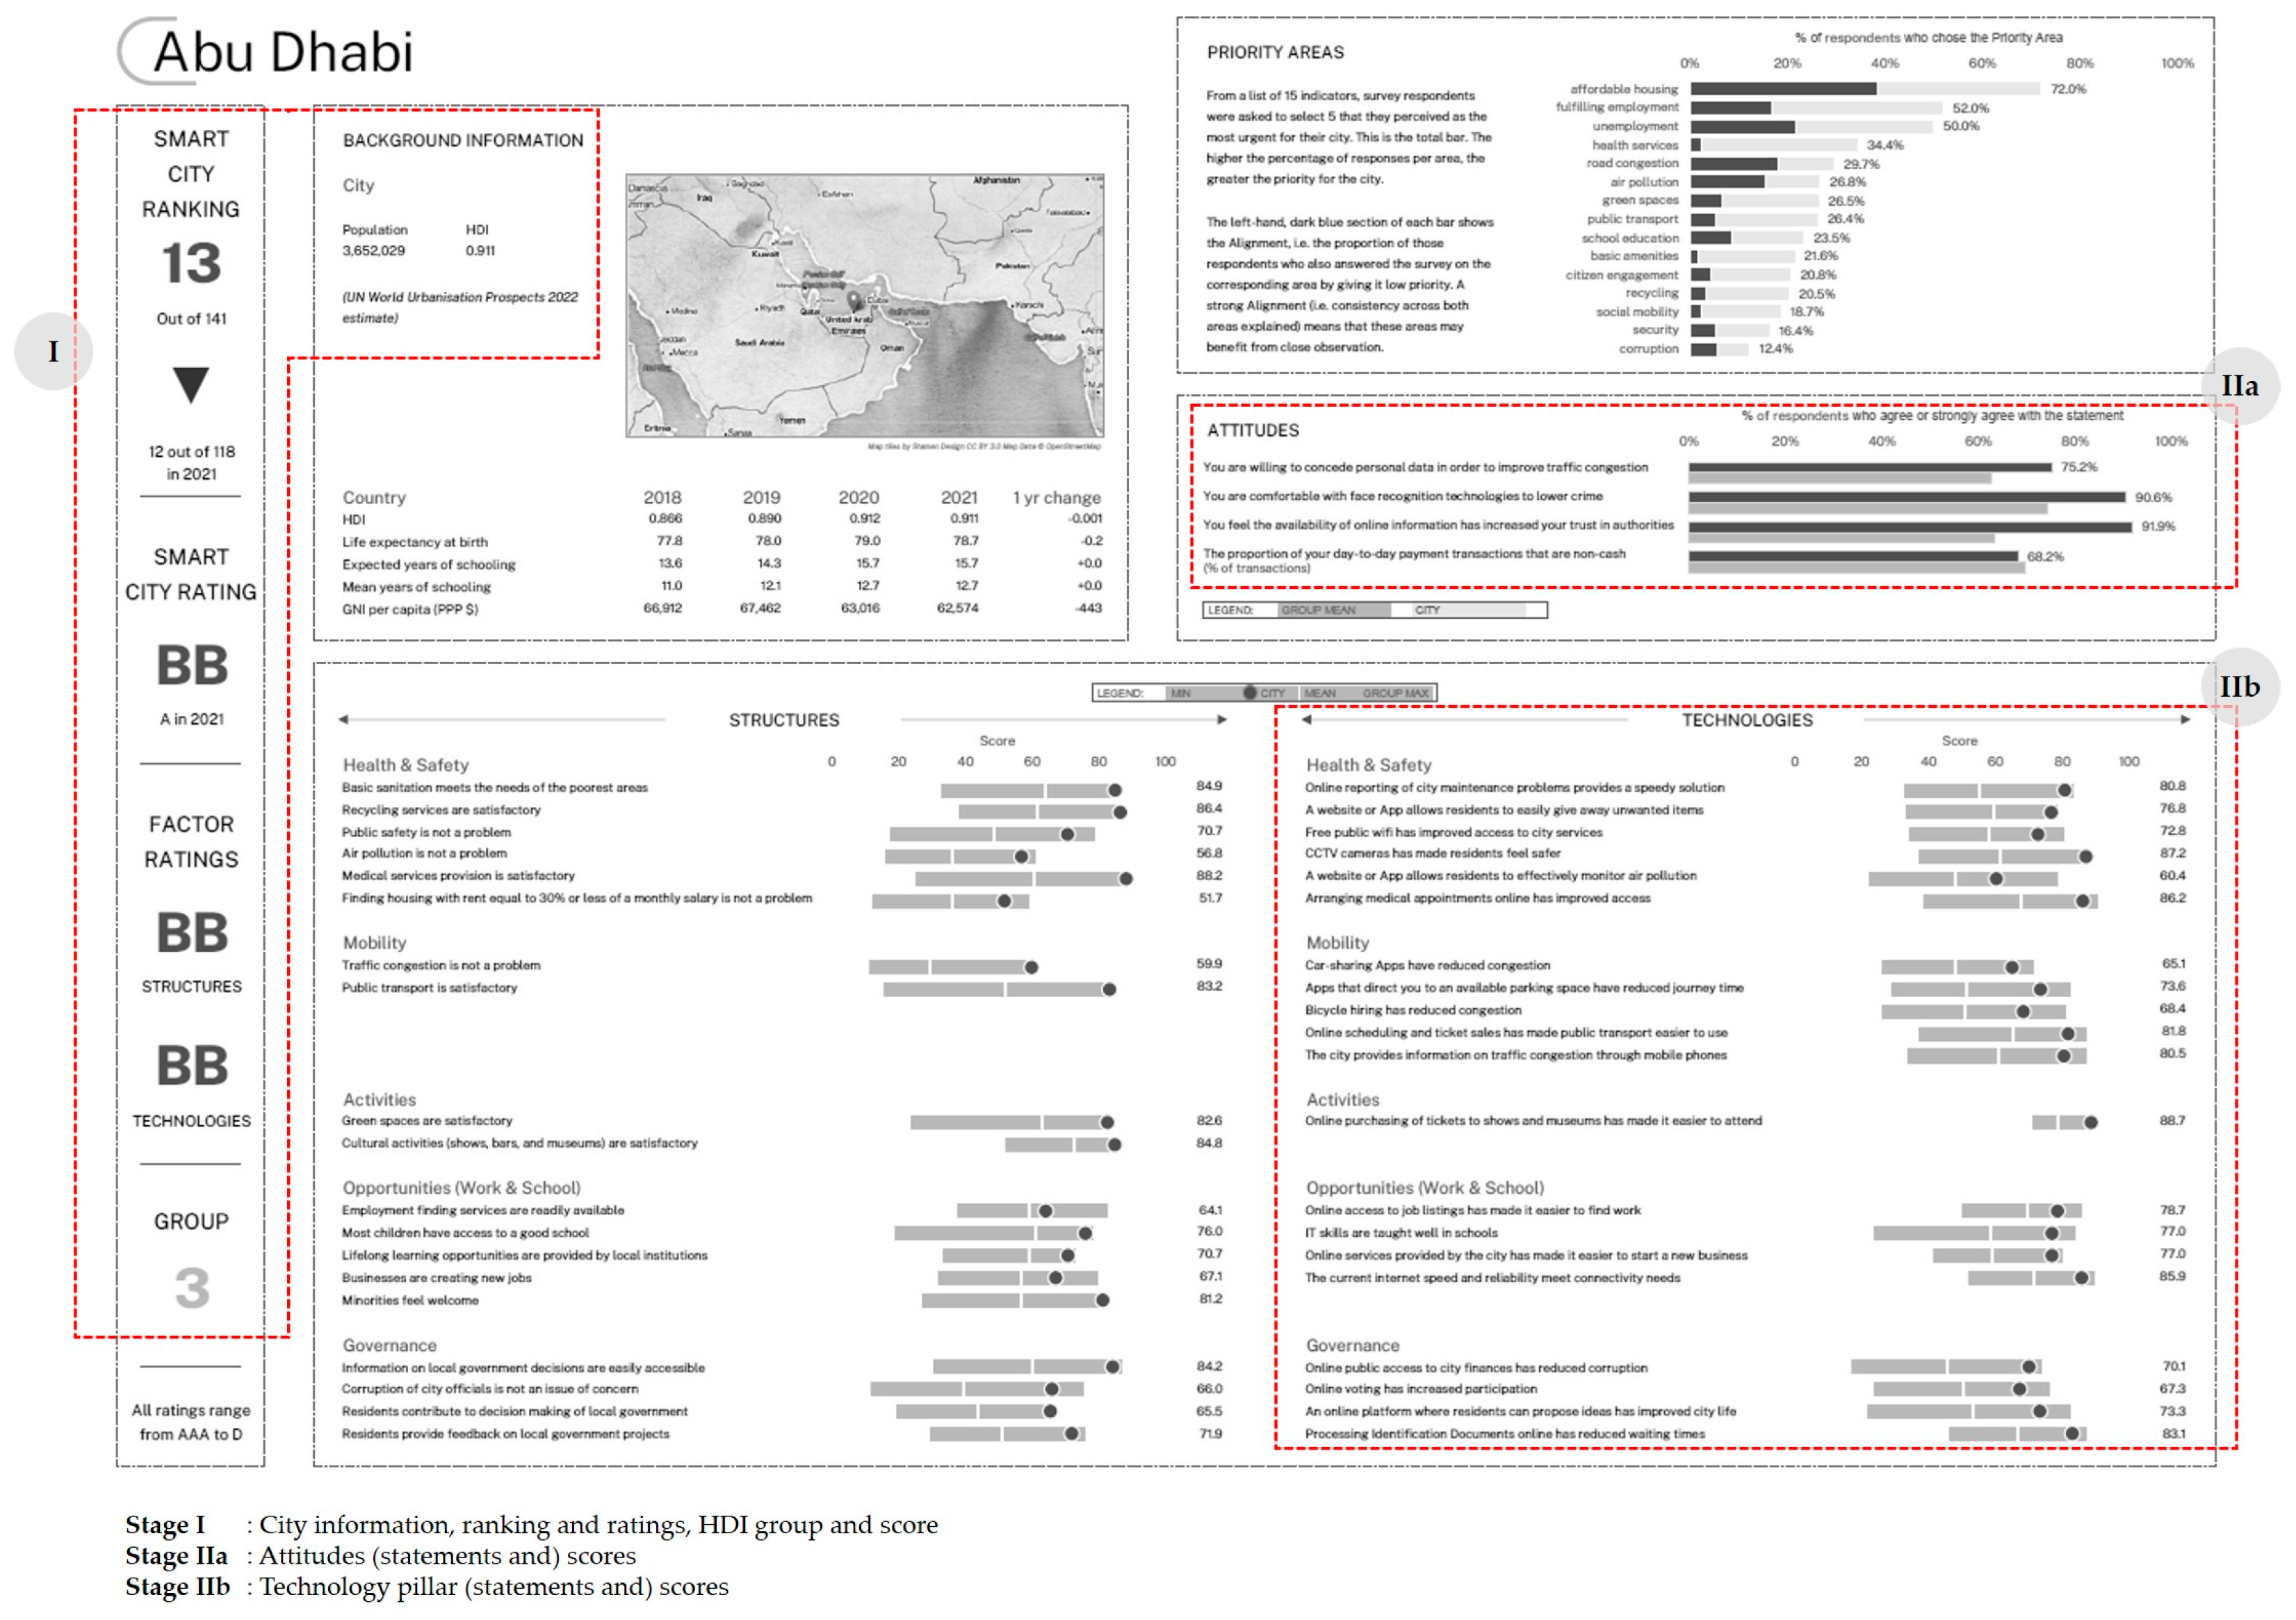
2.1. Data Source: IMD Smart City Index 2023
2.2. Data Process
2.3. Data Analysis
3. Results
4. Discussion
4.1. Interpretation of Key Findings
4.2. Implications of the Findings
5. Conclusions
Author Contributions
Funding
Data Availability Statement
Acknowledgments
Conflicts of Interest
Abbreviations
| ICT | Information and Communication Technology |
| HDI | Human Development Index |
| GNI | Gross National Income |
| UNSD | United Nations Department of Economic and Social Affairs Statistics Division |
| SCI | IMD Smart City Index |
| SCI-2023 | IMD Smart City Index 2023 |
| IMD | International Institute for Management Development |
| WeGO | World Smart Sustainable Cities Organization |
| UNESCO | United Nations Educational, Scientific and Cultural Organization |
| UN-Habitat | United Nations Human Settlements Programme |
| GIS | Geographical Information System |
| GDP | Gross Domestic Product |
| R&D | Research and Development |
Appendix A


| Research | Main Scope/Focus | Case Study Scale | Methodology | Findings |
|---|---|---|---|---|
| [44] | To analyse how smart city development correlates with the socio-economic indicators. | OECD countries and key partners, grouped into four clusters (based on GDP per capita). Special focus on China and the USA. | Comparative study utilising cluster analysis. |
|
| [45] | To evaluate the smart city development level of Salatiga, Indonesia, across smart city dimensions. | The city of Salatiga, a medium-sized city in Central Java, Indonesia. | Calculate scores for each smart city dimension in Cohen Smart City Wheel. |
|
| [46] | To explore how geography, culture, strategy, and governance influence the development and implementation of smart city projects globally. | Regional scale with examples from the following areas: - Europe and North America - Latin America - East and South Asia | Qualitative conceptual analysis. |
|
| [47] | To assess and compare the smartness levels of Brazilian state capital cities. | All 27 Brazilian capital cities, grouped into performance clusters: Leading, Following, and Developing. | Adapted a multi-dimensional, comprehensive smart city assessment model previously used in Australia. |
|
| [48] | To identify the spatial and socio-economic configurations that explain why some cities are more advanced than others in developing smart city initiatives. | 22 cities in Switzerland with at least one smart city project. | Fuzzy-set Qualitative Comparative Analysis. |
|
| [49] | To analyse how smart city characteristics, influence urban attractiveness, measured by housing market prices. | 103 Italian NUTS-3 province capitals. | OLS regression and K-means cluster analysis based on Giffinger et al.’s six-dimension smart city model. |
|
| [50] | To develop a data-driven, reproducible ranking of the European Union capital cities based on how smart and sustainable they are. | All 28 European Union capital cities. | Hierarchical clustering, principal component analysis and correlation analysis, using the UNECE-ITU smart sustainable cities framework. |
|
| [51] | To evaluate and rank selected cities in terms of smart and sustainable city performance using a weighted, multi-criteria framework. | 44 cities worldwide, selected from the Global Power City Index. | ANP (Analytic Network Process) and TOPSIS (Technique for Order Preference by Similarity to Ideal Solution). |
|
| [52] | To develop a robust evaluation framework to assess smart city performance across multiple dimensions, addressing the limitations of traditional indices. | 17 cities worldwide. | PROMETHEE II, an MCDA (Multi-Criteria Decision Analysis). |
|
| [53] | To enhance traditional smart region ranking methodologies by introducing a relational dimension based on regional collaboration, focusing on how inter-regional ties influence smartness profiles. | 266 NUTS-2 regions across EU28, with specific attention to Piedmont (Italy) as a test case. | PCA (Principal Component Analysis) to derive region-to-region distance matrices. |
|
| [54] | To analyse how specific technological factors influence the development of smart cities in Kazakhstan using spatial econometric techniques. | Cities in Kazakhstan. | SAR (Spatial Autoregressive Model). |
|
| [55] | To critically examine the smart city development in China through the case of Shenzhen, evaluating how it aligns with or diverges from international smart city paradigms. | Shenzhen, China—as a model for China’s smart city development. | Mixed-method case study. |
|
| [56] | To explore how geography—specifically the Global North vs. Global South divide—influences smart city development. | 135 cities (87 Global North; 48 Global South) that participated in IBM’s Smarter Cities Challenge. | Quantitative and qualitative comparative analysis. |
|
| [57] | To analyse top-ranked global smart cities and identify the key policies and characteristics that contribute to their smartness. | Comparative analysis of top smart cities globally using data from three main indices. | Qualitative analysis. |
|
| [58] | To investigate the relationship between smart cities, subjective well-being, and urban liveability, with a focus on whether smart city development enhances happiness and sustainability. | Global comparative analysis of 59 cities using three indices. | Linear and multiple regression analyses. |
|
| [59] | To examine global patterns and the key enablers of e-governance in smart cities by clustering cities based on governance indicators and analysing economic, social, political, and ICT-related factors. | 68 smart cities from different countries and regions, one per country, based on the IMD Smart City Index 2023 data. | Cluster analysis and VAR/VEC modelling. |
|
| Continental Regions Subregions Intermediary Regions | Economic | Social | Technological | |||||||||||||
|---|---|---|---|---|---|---|---|---|---|---|---|---|---|---|---|---|
| Population (000, 2024) | GDP: Gross Domestic Product (Million Current US$) | GDP Growth Rate (Annual %, 2015) | GDP per Capita (Current US$) | Unemployment Rate (% of Labour Force) | Urban Population (% of Total Population, 2015) | Urban Population Growth Rate (Average Annual %, 2015) | Life Expectancy at Birth (Females, Years) | Life Expectancy at Birth (Males, Years) | Under Five Mortality Rate (per 1000 Live Births) | Education: Upr. sec. Gross Enrol. Ratio (f per 100 pop.) | Education: Upr. sec. Gross Enrol. Ratio (m per 100 pop.) | Individuals Using the Internet (per 100 Inhabitants) | Research & Development Expenditure (% of GDP) | Researchers in Full Time Equivalent (per Million, 2021) ** | Patents Resident Filings (per Million Population, 2022) *** | |
| Africa | 1,515,141 | 2,870,757 | 3.5 | 2014.8 | 6.6 | 41.2 | 3.7 | 66.1 | 62.0 | 62.4 | 16,200 | |||||
| Northern Africa | 272,131 | 855,580 | 3 | 3298.4 | 11.3 | 51.4 | 2.3 | 74.6 | 70 | 26.9 | 69.9 | 64.6 | 69.3 | 0.7 | ||
| Sub-Saharan Africa | 1,243,010 | 2,015,177 | 3.8 | 1729.1 | 5.8 | 38.8 | 4.1 | 64.4 | 60.3 | 67.6 | 33.6 | 38.3 | 37.0 | 0.3 | ||
| Eastern Africa | 500,704 | 512,915 | 5 | 1087.4 | 4.3 | 26.6 | 4.6 | 68.6 | 63.1 | 48.5 | 33.6 | 38.3 | 29.7 | |||
| Middle Africa | 212,916 | 287,184 | 4.1 | 1464.6 | 6.8 | 47.9 | 4.3 | 64.4 | 60.0 | 72.1 | 35.0 | |||||
| Southern Africa | 73,139 | 44,845 | 2.1 | 6484.7 | 27.6 | 62.1 | 2.3 | 69.5 | 62.6 | 33.6 | 33.6 | 38.3 | 75.9 | |||
| Western Africa | 456,251 | 770,232 | 3.9 | 1795.1 | 3.3 | 44.5 | 4.3 | 59.4 | 57.5 | 89.2 | 33.6 | 38.3 | 39.9 | |||
| Asia | 4,806,898 | 38,004,625 | 3.6 | 8048.6 | 48.0 | 2.4 | 77.4 | 72.3 | 25.8 | 1,226,700 | ||||||
| Eastern Asia | 1,656,115 | 25,047,265 | 2.4 | 15,063.0 | 4.7 | 59.8 | 2.4 | 82 | 76.1 | 7.7 | 92.1 | 89.3 | 79.2 | 2.7 | 2249.9 | |
| South-Eastern Asia | 695,149 | 3,630,588 | 5.6 | 5330.3 | 2.5 | 47.2 | 2.5 | 75.3 | 69.3 | 22.1 | 69.9 | 66.6 | 78.3 | 1.1 | 812.1 | |
| Southern Asia | 2,064,056 | 4,761,901 | 6.3 | 2372.0 | 5.1 | 34.5 | 2.5 | 73.8 | 70.3 | 33.3 | 62.9 | 65.9 | 50.5 | 0.6 | 311.2 | |
| Western Asia | 309,351 | 4,170,551 | 6.6 | 14,216.8 | 7.6 | 70.4 | 2.7 | 78.1 | 73.2 | 20.8 | 77.4 | 82.2 | 78.5 | 1.1 | 1215.4 | |
| Central Asia | 82,226 | 394,320 | 4.0 | 5118.4 | 4.6 | 48.1 | 1.7 | 76.1 | 69.4 | 16.6 | 87.2 | 88.3 | 81.3 | 0.1 | 471.5 | |
| Oceania | 46,089 | 2,080,031 | 3.1 | 46,473.3 | 3.7 | 68.1 | 1.5 | 81.6 | 77.1 | 18.2 | 115.5 | 117.0 | 78.5 | 1.7 | 3324.5 | 18,600 |
| Australia & New Zealand | 31,927 | 2,022,422 | 3 | 64,485.0 | 3.7 | 85.6 | 1.5 | 85.5 | 82 | 3.4 | 178 | 180 | 95.1 | 1.8 | 4695.9 | |
| Melanesia | 12,945 | 48,795 | 6.0 | 3930.9 | 19.2 | 2.2 | 69.8 | 64.7 | 35.5 | |||||||
| Micronesia | 527 | 1304 | 0 | 4104.8 | 67.9 | 1.0 | 74.6 | 68.8 | 29.1 | 40.5 | ||||||
| Polynesia | 690 | 7509 | 4.4 | 11,311.6 | 44.5 | 0.6 | 79.8 | 75.1 | 11.6 | |||||||
| Europe | 745,084 | 23,858,902 | 3.0 | 32,000.5 | 73.9 | 0.3 | 82.7 | 75.9 | 4.1 | 110.1 | 109.8 | 91.6 | 2.0 | 3816.6 | 178,700 | |
| Eastern Europe | 285,003 | 4,150,508 | −0.2 | 14,330.6 | 4 | 69.3 | 0 | 79.8 | 70 | 5.1 | 110 | 110 | 91.6 | 2 | ||
| Northern Europe | 108,964 | 5,652,647 | 4.3 | 53,207.2 | 5.4 | 81.4 | 0.9 | 83.6 | 79.5 | 3.7 | 110 | 110 | 91.6 | 2 | ||
| Southern Europe | 151,254 | 4,226,047 | 4.7 | 27,853.1 | 9.4 | 70.6 | 0.2 | 85.1 | 80.2 | 3.4 | 110 | 110 | 91.6 | 2 | ||
| Western Europe | 199,863 | 9,829,701 | 2.5 | 49,648.0 | 4.7 | 79.4 | 0.6 | 84.7 | 80 | 3.6 | 110 | 110 | 91.6 | 2 | ||
| The Americas | 1,048,761 | 34,020,481 | 2.4 | 32,841.7 | 5.4 | 0.9 | 80.3 | 74.7 | 12.7 | |||||||
| Latin America & the Caribbean | 663,466 | 6,127,970 | 4.0 | 9298.5 | 6.1 | 79.9 | 1.5 | 78.8 | 72.9 | 15.6 | 89.5 | 80.8 | 81.0 | 0.5 | 625.4 | 41,500 |
| Caribbean | 44,445 | 483,941 | 3.7 | 11,135.4 | 6.9 | 70.0 | 1.4 | 76.5 | 70.1 | 35.1 | 74.3 | |||||
| Central America | 183,410 | 1,785,939 | 4.2 | 9974.0 | 3.6 | 73.7 | 1.9 | 77.9 | 72.4 | 13.7 | 89.5 | 80.8 | 81 | |||
| South America | 435,611 | 3,858,090 | 3.9 | 8838.5 | 7 | 83.5 | 1.3 | 79.3 | 73.5 | 14.4 | 89.5 | 80.8 | 81 | |||
| Northern America | 385,295 | 27,892,511 | 2 | 74,012.0 | 4.2 | 81.6 | 1 | 82.3 | 77.4 | 5.8 | 101 | 100 | 97.3 | 3.3 | 4513.9 | |
| World | 8,161,973 | 100,834,796 | 3.1 | 12,647.1 | 6.0 | 53.9 | 2.0 | 76.0 | 70.7 | 36.0 | 69.2 | 70.2 | 67.4 | 1.9 | 1352.5 | 1,823,000 |
| Global Regions | Number of Smart Cities * | Number of Countries with Smart City * (B) | Number of Countries ** (C) | Share of Countries with Smart City (B/C%) |
|---|---|---|---|---|
| Global South | 58 | 33 | 139 | 23.75 |
| Global North | 83 | 38 | 108 | 35.19 |
| Continental Regions Subregions Intermediary Regions | Number of Smart Cities * | Number of Countries with Smart City (A) * | Number of Countries (B) ** | Share of Countries with Smart City (A/B%) |
|---|---|---|---|---|
| Africa | 9 | 8 | 60 | 13.3 |
| Northern Africa | 4 | 4 | 7 | 57.1 |
| Sub-Saharan Africa | ||||
| Eastern Africa | 1 | 1 | 22 | 4.5 |
| Middle Africa | - | - | 9 | 0.0 |
| Southern Africa | 1 | 1 | 5 | 20.0 |
| Western Africa | 3 | 2 | 17 | 11.8 |
| Asia | 45 | 22 | 50 | 44.0 |
| Eastern Asia | 16 | 4 | 7 | 57.1 |
| South-Eastern Asia | 9 | 6 | 11 | 54.5 |
| Southern Asia | 5 | 2 | 9 | 22.2 |
| Western Asia | 15 | 10 | 18 | 55.6 |
| Central Asia | - | - | 5 | 0.0 |
| Oceania | 6 | 2 | 29 | 6.9 |
| Australia & New Zealand | 6 | 2 | 6 | 33.3 |
| Melanesia | - | - | 5 | 0.0 |
| Micronesia | - | - | 8 | 0.0 |
| Polynesia | - | - | 10 | 0.0 |
| Europe | 56 | 29 | 51 | 56.9 |
| Eastern Europe | 7 | 6 | 10 | 60.0 |
| Northern Europe | 19 | 11 | 16 | 68.8 |
| Southern Europe | 11 | 6 | 16 | 37.5 |
| Western Europe | 19 | 6 | 9 | 66.7 |
| Americas | 25 | 10 | 57 | 17.5 |
| Latin America & the Caribbean | ||||
| Caribbean | - | - | 28 | 0.0 |
| Central America | 3 | 5 | 8 | 37.5 |
| South America | 8 | 2 | 16 | 31.3 |
| Northern America | 14 | 2 | 5 | 40.0 |
| Total/Average | 141 | 71 | 247 | 28.7 |
| Continental Regions Subregions Intermediary Regions | Classification of Cities According to Population Sizes * | |||||
|---|---|---|---|---|---|---|
| Small Cities (100 k–500 k pop.) | Mid-Sized Cities (500 k–1 m pop.) | Large Cities (1 m–5 m pop.) | Metropolitan Cities (5 m–10 m pop.) | Megacities (10 m–20 m pop.) | Megacities More Than 20 m pop. | |
| Africa | 1 | - | 6 | 1 | 1 | - |
| Northern Africa | 1 | - | 2 | 1 | - | - |
| Sub-Saharan Africa | ||||||
| Eastern Africa | - | - | 1 | - | - | - |
| Southern Africa | - | - | 1 | - | - | - |
| Western Africa | - | - | 2 | - | 1 | - |
| Asia | 1 | 2 | 19 | 10 | 9 | 4 |
| Eastern Asia | - | - | 4 | 6 | 4 | 2 |
| South-Eastern Asia | - | - | 5 | 2 | 2 | - |
| Southern Asia | - | - | 1 | - | 2 | 2 |
| Western Asia | 1 | 2 | 9 | 2 | 1 | - |
| Oceania | 1 | 1 | 4 | - | - | - |
| Australia & New Zealand | 1 | 1 | 4 | - | - | - |
| Europe | 6 | 27 | 22 | 1 | - | - |
| Eastern Europe | - | 2 | 5 | - | - | - |
| Northern Europe | 2 | 12 | 4 | 1 | - | - |
| Southern Europe | 1 | 5 | 5 | - | - | - |
| Western Europe | 3 | 8 | 8 | - | - | - |
| Americas | - | 8 | 9 | 4 | 2 | 2 |
| Latin America & the Caribbean | ||||||
| Central America | - | 1 | 1 | - | - | 1 |
| South America | - | - | 2 | 3 | 2 | 1 |
| Northern America | - | 7 | 6 | 1 | - | - |
| Total | 9 | 38 | 60 | 16 | 12 | 6 |
| Intermediary Regions | Differences in Ratings * | Total Number of Cities | |||
|---|---|---|---|---|---|
| −1.00 | 0.00 | 1.00 | 2.00 | ||
| Northern Africa | 0 | 4 | 0 | 0 | 4 |
| Eastern Africa | 0 | 1 | 0 | 0 | 1 |
| Southern Africa | 0 | 1 | 0 | 0 | 1 |
| Western Africa | 1 | 2 | 0 | 0 | 3 |
| Eastern Asia | 3 | 12 | 1 | 0 | 16 |
| South-Eastern Asia | 1 | 8 | 0 | 0 | 9 |
| Southern Asia | 1 | 4 | 0 | 0 | 5 |
| Western Asia | 1 | 11 | 3 | 0 | 15 |
| Australia & New Zealand | 0 | 3 | 3 | 0 | 6 |
| Eastern Europe | 2 | 4 | 1 | 0 | 7 |
| Northern Europe | 3 | 8 | 6 | 2 | 19 |
| Southern Europe | 1 | 9 | 1 | 0 | 11 |
| Western Europe | 2 | 9 | 6 | 2 | 19 |
| Central America | 0 | 3 | 0 | 0 | 3 |
| South America | 2 | 6 | 0 | 0 | 8 |
| Northern America | 2 | 8 | 4 | 0 | 14 |
| Total number of cities | 19 | 93 | 25 | 4 | 141 |
| Continental Regions Subregions Intermediary Regions | Max. Rank | Min. Rank | First 10 | First 20 | Last 20 | Last 10 | Total Cities |
|---|---|---|---|---|---|---|---|
| Africa | 108 | 138 | - | - | 8 | 4 | 9 |
| Northern Africa | 108 | 137 | - | - | - | - | 4 |
| Sub-Saharan Africa | 125 | 138 | - | - | 4 | 2 | 5 |
| Eastern Africa | 131 | 131 | - | - | 1 | - | 1 |
| Middle Africa | - | - | - | - | - | - | - |
| Southern Africa | 125 | 125 | - | - | 1 | - | 1 |
| Western Africa | 132 | 138 | - | - | 2 | 2 | 3 |
| Asia | 7 | 140 | 1 | 6 | 3 | 3 | 45 |
| Eastern Asia | 12 | 98 | 3 | - | - | 16 | |
| South-Eastern Asia | 7 | 115 | 1 | 1 | - | - | 9 |
| Southern Asia | 105 | 120 | - | - | - | - | 5 |
| Western Asia | 13 | 140 | - | 2 | - | 3 | 15 |
| Central Asia | - | - | - | - | - | - | - |
| Oceania | 3 | 31 | 1 | 2 | - | - | 6 |
| Australia & New Zealand | 3 | 21 | 1 | 2 | - | - | 6 |
| Melanesia | - | - | - | - | - | - | - |
| Micronesia | - | - | - | - | - | - | - |
| Polynesia | - | - | - | - | - | - | - |
| Europe | 1 | 122 | 8 | 12 | 1 | 56 | |
| Eastern Europe | 14 | 111 | - | 1 | - | - | 7 |
| Northern Europe | 2 | 95 | 5 | - | - | - | 19 |
| Southern Europe | 27 | 122 | 1 | - | 11 | ||
| Western Europe | 1 | 101 | 3 | 6 | - | - | 19 |
| Americas | 21 | 141 | - | - | 8 | 3 | 25 |
| Latin America & the Caribbean | 118 | 141 | - | - | 5 | 3 | 11 |
| Caribbean | - | - | - | - | - | - | - |
| Central America | 121 | 141 | - | - | - | 1 | 3 |
| South America | 118 | 136 | - | - | 5 | 2 | 8 |
| Northern America | 21 | 98 | - | - | - | - | 14 |
References
- United Nations Department of Economic and Social Affairs Population Division. World Urbanisation Prospects 2018—Highlights (ST/ESA/SER.A/421). 2019. Available online: https://population.un.org/wup/assets/WUP2018-Highlights.pdf (accessed on 12 January 2025).
- Etezadzadeh, C. Smart City—Future City? Smart City 2.0 as a Livable City and Future Market; Springer: Wiesbaden, Germany, 2016. [Google Scholar] [CrossRef]
- Patrao, C.; Moura, P.; Almeida, A. Review of Smart City Assessment Tools. Smart Cities 2020, 3, 1117–1132. [Google Scholar] [CrossRef]
- Caragliu, A.; Del Bo, D.; Nijkamp, P. Smart cities in Europe. J. Urban Technol. 2011, 18, 65–82. [Google Scholar] [CrossRef]
- Bibri, S.E.; Krogstie, J. Smart sustainable cities of the future: An extensive interdisciplinary literature review. Sustain. Cities Soc. 2017, 31, 183–212. [Google Scholar] [CrossRef]
- Nam, K.; Dutt, C.; Chathoth, P.; Khan, M. Blockchain technology for smart city and smart tourism: Latest trends and challenges. Asia Pac. J. Tour. Res. 2021, 26, 454–468. [Google Scholar] [CrossRef]
- Keshavarzi, G.; Yildirim, Y.; Arefi, M. Does scale matter? An overview of the “smart cities” literature. Sustain. Cities Soc. 2021, 74, 103151. [Google Scholar] [CrossRef]
- Anthopoulos, L.G. Smart Cities and Their Roles in City Competition: A Classification. Int. J. Electron. Gov. Res. 2014, 10, 63–77. [Google Scholar] [CrossRef]
- Cocchia, A. Smart and Digital City: A Systematic Literature Review. In Smart City: How to Create Public and Economic Value with High Technology in Urban Space; Dameri, R.P., Rosenthal-Sabroux, C., Eds.; Springer: Cham, Germany, 2014; pp. 13–44. [Google Scholar] [CrossRef]
- Ingwersen, P.; Serrano-Lopez, A.E. Smart city research 1990–2016. Scientometrics 2018, 117, 1205–1236. [Google Scholar] [CrossRef]
- Bakıcı, T.; Almirall, E.; Wareham, J. A smart city initiative: The case of Barcelona. J. Knowl. Econ. 2013, 4, 135–148. [Google Scholar] [CrossRef]
- Petrica, N. Smart City-Organizational and Management Perspectives. In Proceedings of the International Management Conference, Faculty of Management, Academy of Economic Studies, Bucharest, Romania, 2–4 November 2017; pp. 898–904. Available online: https://ideas.repec.org/a/rom/mancon/v11y2017i1p898-904.html (accessed on 30 March 2025).
- Harrison, C.; Eckman, B.; Hamilton, R.; Hartswick, P.; Kalagnanam, J.; Paraszczak, J.; Williams, P. Foundations for smarter cities. IBM J. Res. Dev. 2010, 54, 1–16. [Google Scholar] [CrossRef]
- Frick, K.; Kumar, T.; Mendonça Abreu, G.; Post, A. Benchmarking “Smart City” Technology Adoption in California: Developing and Piloting a Data Collection Approach. Berkley Institute of Transportation Studies, Report No. UC-ITS-2020-31. 2021. Available online: https://escholarship.org/uc/item/3797p0ws (accessed on 22 February 2025).
- Mohanty, S.P.; Choppali, U.; Kougianos, E. Everything you wanted to know about smart cities: The Internet of things is the backbone. IEEE Consum. Electron. Mag. 2016, 5, 60–70. [Google Scholar] [CrossRef]
- Marsal-Llacuna, M.L.; Colomer-Llinas, J.; Meléndez-Frigola, J. Lessons in urban monitoring taken from sustainable and livable cities to better address the Smart Cities initiative. Technol. Forecast. Soc. Change 2015, 90 Pt B, 611–622. [Google Scholar] [CrossRef]
- Georgescu, M.; Pavaloaia, V.; Popescul, D.; Tugui, A. The Race for Making up the List of Emergent Smart Cities. An Eastern European Country’s Approach. Transform. Bus. Econ. 2015, 14, 529–549. [Google Scholar]
- Kitchin, R. Making sense of smart cities: Addressing present shortcomings. Camb. J. Reg. Econ. Soc. 2014, 8, 131–136. [Google Scholar] [CrossRef]
- Yigitcanlar, T.; Desouza, K.; Butler, L.; Roozkhosh, F. Contributions and Risks of Artificial Intelligence (AI) in Building Smarter Cities: Insights from a Systematic Review of the Literature. Energies 2020, 13, 1473. [Google Scholar] [CrossRef]
- Ferreira, A.I.M. The Smart City: The Exponent of a Civilization Transition in the Context of a Global Crisis. In How Smart Is Your City? Technological Innovation, Ethics and Inclusiveness; Ferreira, A.I.M., Ed.; Springer Nature: Cham, Germany, 2021; pp. 1–16. [Google Scholar] [CrossRef]
- Park, J.; Yoo, S. Evolution of the smart city: Three extensions to governance, sustainability, and decent urbanisation from an ICT-based urban solution. Int. J. Urban Sci. 2023, 27 (Suppl. S1), 10–28. [Google Scholar] [CrossRef]
- Giffinger, R.; Fertner, C.; Kramar, H.; Kalasek, R.; Pichler-Milanovic, N.; Meijers, E.J. Ranking of European Medium-Sized Cities; Final Report; Centre of Regional Science, Vienna University of Technology: Vienna, Austria, 2007. [Google Scholar] [CrossRef]
- Zygiaris, S. Smart city reference model: Assisting planners to conceptualize the building of smart city innovation ecosystems. J. Knowl. Econ. 2013, 4, 217–231. [Google Scholar] [CrossRef]
- Lara, A.; Da Costa, E.; Furlani, T.Z.; Yigitcanlar, T. Smartness that matters: Towards a comprehensive and human-centred characterisation of smart cities. J. Open Innov. Technol. Mark. Complex. 2016, 2, 1–13. [Google Scholar] [CrossRef]
- Samarakkody, A.; Amaratunga, D.; Haigh, R. Characterising Smartness to Make Smart Cities Resilient. Sustainability 2022, 14, 12716. [Google Scholar] [CrossRef]
- Yigitcanlar, T.; Kamruzzaman, M.; Foth, M.; Sabatini-Marques, J.; da Costa, E.; Ioppolo, G. Can cities become smart without being sustainable? A systematic review of the literature. Sustain. Cities Soc. 2019, 45, 348–365. [Google Scholar] [CrossRef]
- Silva, B.; Khan, M.; Han, K. Towards sustainable smart cities: A review of trends, architectures, components, and open challenges in smart cities. Sustain. Cities Soc. 2018, 38, 697–713. [Google Scholar] [CrossRef]
- Kasznar, A.; Hammad, A.; Najjar, M.; Linhares Qualharini, E.; Figueiredo, K.; Soares, C.; Haddad, A. Multiple Dimensions of Smart Cities’ Infrastructure: A Review. Buildings 2021, 11, 73. [Google Scholar] [CrossRef]
- Kozlowski, W.; Suwar, K. Smart City: Definitions, Dimensions, and Initiatives. Eur. Res. Stud. J. 2021, XXIV Pt 1, 509–520. [Google Scholar] [CrossRef]
- Lombardi, P.; Giordano, S.; Farouh, H.; Yousef, W. Modelling the smart city performance. Innov. Eur. J. Soc. Sci. Res. 2012, 25, 137–149. [Google Scholar] [CrossRef]
- Bogdanov, O.; Jeremic, V.; Jednak, S.; Cudanov, M. Scrutinizing the Smart City Index: A multivariate statistical approach. Zb. Rad. Ekon. Fak. U Rijeci 2019, 37, 777–799. [Google Scholar] [CrossRef]
- Parra-Pulido, R.; Hernandez-Pena, Y.; Zafra-Mejía, C. Systematic Review of Dimensions and Indicators in Sustainable and Smart Cities: Trends, Interdependencies, and Continental Variations. Urban Sci. 2024, 8, 202. [Google Scholar] [CrossRef]
- Al Sharif, R.; Pokharel, S. Smart City Dimensions and Associated Risks: Review of Literature. Sustain. Cities Soc. 2022, 77, 103542. [Google Scholar] [CrossRef]
- Pira, M. A novel taxonomy of smart sustainable city indicators. Humanit. Soc. Sci. Commun. 2021, 8, 197. [Google Scholar] [CrossRef]
- Holguin Rengifo, Y.; Herrera Vargas, J.; Valencia-Arias, A. Proposal for a Comprehensive Tool to Measure Smart Cities under the Triple-Helix Model: Capacities Learning, Research, and Development. Sustainability 2023, 15, 13549. [Google Scholar] [CrossRef]
- Gazzeh, K. Ranking Sustainable Smart City Indicators Using Combined Content Analysis and Analytic Hierarchy Process Techniques. Smart Cities 2023, 6, 2883–2909. [Google Scholar] [CrossRef]
- Batty, M.; Axhausen, K.W.; Giannotti, F.; Pozdnoukhov, A.; Bazzani, A.; Wachowicz, M.; Ouzounis, G.; Portugali, Y. Smart cities of the future. Eur. Phys. J. Spec. Top. 2012, 214, 481–518. [Google Scholar] [CrossRef]
- Cohen, B. Blockchain Cities and the Smart Cities Wheel. 2018. Available online: https://boydcohen.medium.com/blockchain-cities-and-the-smart-cities-wheel-9f65c2f32c36 (accessed on 22 February 2025).
- Li, G.; Wang, Y.; Luo, J.; Li, Y. Evaluation on Construction Level of Smart City: An Empirical Study from Twenty Chinese Cities. Sustainability 2018, 10, 3348. [Google Scholar] [CrossRef]
- Barbierato, E.; Gatti, A. Decoding Urban Intelligence: Clustering and Feature Importance in Smart Cities. Future Internet 2024, 16, 362. [Google Scholar] [CrossRef]
- Gupta, S.; Mustafa, S.Z.; Kumar, H. Smart People for Smart Cities: A Behavioral Framework for Personality and Roles. In Advances in Smart Cities: Smarter People, Governance, and Solutions; Kar, A.K., Gupta, M.P., Ilavarasan, P.V., Dwivedi, K.Y., Eds.; Chapman and Hall/CRC: New York, NY, USA, 2017; pp. 23–30. ISBN 978-1-4987-9571-5. [Google Scholar]
- Albino, V.; Berardi, U.; Dangelico, R.M. Smart Cities: Definitions, Dimensions, Performance, and Initiatives. J. Urban Technol. 2015, 2, 3–21. [Google Scholar] [CrossRef]
- Meijer, A.; Bolivar, M.P. Governing the smart city: A review of the literature on smart urban governance. Int. Rev. Adm. Sci. 2016, 82, 392–408. [Google Scholar] [CrossRef]
- Tsymbal, L.; Uninets, I. Development of Smart Cities: Country Analysis. Manag. Theory Stud. Rural Bus. Infrastruct. Dev. 2022, 44, 482–488. [Google Scholar] [CrossRef]
- Qonita, M.; Giyarsih, S.R. Smart city assessment using the Boyd Cohen smart city wheel in Salatiga, Indonesia. GeoJournal 2023, 88, 479–492. [Google Scholar] [CrossRef]
- Marchesani, F. Geographic Patterns in Smart City Implementation. In the Global Smart City; Emerald Publishing: Leeds, UK, 2023; pp. 55–74. [Google Scholar] [CrossRef]
- Fachinelli, A.; Yigitcanlar, T.; Sabatini-Marques, J.; Cortese, T.; Sotto, D.; Libardi, B. Urban Smartness and City Performance: Identifying Brazilian Smart Cities through a Novel Approach. Sustainability 2023, 15, 10323. [Google Scholar] [CrossRef]
- Duygan, M.; Fischer, M.; Parli, P.; Ingold, K. Where do Smart Cities grow? The spatial and socio-economic configurations of smart city development. Sustain. Cities Soc. 2022, 77, 103578. [Google Scholar] [CrossRef]
- Boscacci, F.; Maltese, I.; Mariotti, I. Smartness and Italian Cities. A Cluster Analysis. TeMA 2014, Special Issue INPUT 2014, 141–152. Available online: http://www.serena.unina.it/index.php/tema/article/view/2512/0 (accessed on 30 March 2025).
- Akande, A.; Cabral, P.; Gomes, P.; Casteleyn, S. The Lisbon ranking for smart sustainable cities. Sustain. Cities Soc. 2019, 44, 475–487. [Google Scholar] [CrossRef]
- Ozkaya, G.; Erdin, C. Evaluation of smart and sustainable cities through a hybrid MCDM approach based on ANP and TOPSIS technique. Heliyon 2020, 6, e05052. [Google Scholar] [CrossRef] [PubMed]
- Sotirelis, P.; Nakopoulos, P.; Valvi, T.; Grigoroudis, E.; Carayannis, E. Measuring Smart City Performance: A Multiple Criteria Decision Analysis Approach. J. Knowl. Econ. 2022, 13, 2957–2985. [Google Scholar] [CrossRef]
- Occelli, S.; Sciullo, A. Mapping Smart Regions. An Exploratory Approach. TeMA 2014, Special Issue INPUT 2014, 719–728. Available online: http://www.serena.unina.it/index.php/tema/article/view/2511 (accessed on 30 March 2025).
- Nurbatsin, A.; Kireyeva, A.; Gamidullaeva, L.; Abdykadyr, T. Spatial analysis and technological influences on smart city development in Kazakhstan. J. Infrastruct. Policy Dev. 2024, 8, 3012. [Google Scholar] [CrossRef]
- Hu, R. The State of Smart Cities in China: The Case of Shenzhen. Energies 2019, 12, 4375. [Google Scholar] [CrossRef]
- Alizadeh, T. Global Trends of Smart Cities: A Comparative Analysis of Geography, City Size, Governance, and Urban Planning; Elsevier: Amsterdam, The Netherlands, 2021. [Google Scholar] [CrossRef]
- Carboni, S. Smart Cities in comparison: An analysis of the best Smart Cities. Smart Cities Reg. Dev. J. 2024, 8, 65–78. Available online: https://www.scrd.eu/index.php/scrd/article/view/480 (accessed on 14 April 2025). [CrossRef]
- Chen, C.-W. Can smart cities bring happiness to promote sustainable development? Contexts and clues of subjective well-being and urban livability. Dev. Built Environ. 2023, 13, 100108. [Google Scholar] [CrossRef]
- Kuzior, A.; Pakhnenko, O.; Tiutiunyk, I.; Lyeonov, S. E-Governance in Smart Cities: Global Trends and Key Enablers. Smart Cities 2023, 6, 1663–1689. [Google Scholar] [CrossRef]
- International Institute for Management Development. IMD Smart City Index Report 2023. 2023. Available upon Request from IMD Smart City Observatory. Available online: https://www.imd.org/smart-city-observatory/home/ (accessed on 30 March 2025).
- United Nations Department of Economic and Social Affairs Statistics Division. Standard Country or Area Codes for Statistical Use (M49). Available online: https://unstats.un.org/unsd/methodology/m49/ (accessed on 12 January 2025).
- Lazaroiu, G.; Roscia, M. Definition Methodology for the Smart Cities Model. Energy 2012, 47, 326–332. [Google Scholar] [CrossRef]
- IESE Business School University of Navvara. IESE Cities in Motion Index. 2024. Available online: https://www.iese.edu/media/research/pdfs/ST-0649-E (accessed on 12 January 2025).
- Eden Strategy Institute. Top 50 Smart City Governments Ranking. 2018. Available online: https://www.edenstrategyinstitute.com/wp-content/uploads/2018/07/Eden-OXD_Top50SmartCityGovernments.pdf (accessed on 22 February 2025).
- Mohan, A.; Dubey, G.; Ahmed, F.; Sidhu, A. Smart Cities Index: A Tool for Evaluating Cities. 2017. Available online: https://shaktifoundation.in/wp-content/uploads/2014/02/Smart-Cities-Index.pdf (accessed on 22 February 2025).
- Aragao, F.; Chiroli, D.; Zola, F.; Aragao, E.; Marinho, L.; Correa, A.; Colmenero, J. Smart Cities Maturity Model—A Multicriteria Approach. Sustainability 2023, 15, 6695. [Google Scholar] [CrossRef]
- Sharifi, A. A critical review of selected smart city assessment tools and indicator sets. J. Clean. Prod. 2019, 233, 1269–1283. [Google Scholar] [CrossRef]
- Lai, C.; Cole, A. Measuring progress of smart cities: Indexing the smart city indices. Urban Gov. 2023, 3, 45–57. [Google Scholar] [CrossRef]
- Zuccardi Merli, M.; Bonollo, E. Performance Measurement in the Smart Cities. In Smart City: How to Create Public and Economic Value with High Technology in Urban Space; Dameri, R.P., Rosenthal-Sabroux, C., Eds.; Springer: Cham, Germany, 2014; pp. 139–156. [Google Scholar] [CrossRef]
- Alderete, M.V. Exploring the Smart City Indexes and the Role of Macro Factors for Measuring Cities Smartness. Soc. Indic. Res. 2020, 147, 567–589. [Google Scholar] [CrossRef]
- Shi, F.; Shi, W. A Critical Review of Smart City Frameworks: New Criteria to Consider When Building Smart City Framework. ISPRS Int. J. Geo-Inf. 2023, 12, 364. [Google Scholar] [CrossRef]
- Toh, C.K. Smart city indexes, criteria, indicators and rankings: An in-depth investigation and analysis. IET Smart Cities 2022, 4, 211–228. [Google Scholar] [CrossRef]
- Rozalowska, B. The functioning of smart city in the context of global city rankings. Sci. Pap. Silesian Univ. Technol.—Organ. Manag. Ser. 2020, 146, 413–425. [Google Scholar] [CrossRef]
- Hammoumi, L.; Maanan, M.; Rhinane, H. Characterizing Smart Cities Based on Artificial Intelligence. Smart Cities 2024, 7, 1330–1345. [Google Scholar] [CrossRef]
- Lanvin, B. Asian and European Citizens See Their Cities as the ‘Smartest’, Finds 2023 IMD Smart City Index. April 2023. Available online: https://www.imd.org/news/competitiveness/asian-and-european-citizens-see-their-cities-as-the-smartest-finds-2023-imd-smart-city-index/ (accessed on 17 February 2025).
- Liu, Z.; Wu, J. A Review of the Theory and Practice of Smart City Construction in China. Sustainability 2023, 15, 7161. [Google Scholar] [CrossRef]
- Gelmez, E.; Özceylan, E. Evaluation of the Smart Cities Listed in Smart City Index 2021 by Using Entropy Based Copras and Aras Methodology. Found. Comput. Decis. Sci. 2023, 48, 153–180. [Google Scholar] [CrossRef]
- WeGO. IMD Smart City Index 2023 Published, in Partnership with WeGO. Available online: https://we-gov.org/news-2023/imd-samrt-city-index-2023-published-in-partnership-with-wego/ (accessed on 19 February 2025).
- Global Data Lab. Subnational HDI (v8.1). Available online: https://globaldatalab.org/shdi/table/shdi/ (accessed on 22 February 2025).
- United Nations Development Programme. Human Development Index (HDI). Available online: https://hdr.undp.org/data-center/human-development-index#/indicies/HDI (accessed on 12 January 2025).
- UNESCO. Organization for Women in Science for the Developing World. Countries in the Global South (by Region). Available online: https://owsd.net/sites/default/files/OWSD%20138%20Countries%20-%20Global%20South.pdf (accessed on 12 January 2025).
- United Nations Human Settlements Programme. Global State of Metropolis 2020—Population Data Booklet. 2020. Available online: https://unhabitat.org/sites/default/files/2020/09/gsm-population-data-booklet-2020_3.pdf (accessed on 15 February 2025).
- UNdata. UNdata—A World of Information. Available online: https://data.un.org/Default.aspx (accessed on 12 January 2025).
- United Nations Department of Economic and Social Affairs Statistics Division. World Statistics Pocketbook, 2024 Edition. 2024. Available online: https://unstats.un.org/UNSDWebsite/Publications/StatisticalPocketbook/ (accessed on 17 February 2025).
- Zou, K.; Tuncali, K.; Silverman, S. Correlation and Simple Linear Regression. Radiology 2003, 227, 617–628. [Google Scholar] [CrossRef]
- Schober, P.; Boer, C.; Schwarte, L. Correlation Coefficients: Appropriate Use and Interpretation. Anesth. Analg. 2018, 126, 1763–1768. [Google Scholar] [CrossRef] [PubMed]
- Hardle, W.; Simar, L. Applied Multivariate Statistical Analysis; Springer: Berlin, Germany, 2003. [Google Scholar] [CrossRef]
- Everitt, B.; Dunn, G. Applied Multivariate Data Analysis; Arnold: London, UK, 2001. [Google Scholar] [CrossRef]
- Alt, N. Exploring Hyberspace: A Non-Mathematical Explanation of Multivariate Analysis; McGraw-Hill: London, UK, 1990; ISBN 978-0077073381. [Google Scholar]
- Greenacre, M. Correspondence Analysis in Practice; Academic Press Ltd.: London, UK, 1993; ISBN 978-0122990526. [Google Scholar]
- Greenacre, M.; Blasius, J. Correspondence Analysis in the Social Sciences; Academic Press Ltd.: London, UK, 1994; ISBN 978-0121045708. [Google Scholar]
- Greenacre, M.; Hastie, T. Geometric Interpretation of Correspondence Analysis. J. Am. Stat. Assoc. 1987, 82, 437–447. [Google Scholar] [CrossRef]
- de Nooy, W. Fields and Networks: Correspondence Analysis and Social Network Analysis in the Framework of Field Theory. Poetics 2003, 31, 305–327. [Google Scholar] [CrossRef]


| Pillar/Category and Domains in the SCI-2023 [60] | Statements in the SCI-2023 [60] | Smart City Dimensions | ||||||
|---|---|---|---|---|---|---|---|---|
| Smart People | Smart Governance | Smart Economy | Smart Living | Smart Environment | Smart Mobility | |||
| Attitudes | You are willing to concede personal data in order to improve traffic congestion | X | X | |||||
| You are comfortable with face recognition technologies to lower crime | X | X | ||||||
| You feel the availability of online information has increased your trust in authorities | X | X | ||||||
| The proportion of your day-to-day payment transactions that are non-cash | X | X | ||||||
| Technology | Health & Safety | Online reporting of city maintenance problems provides a speedy solution | X | X | ||||
| A website or App allows residents to easily give away unwanted items | X | X | X | |||||
| Free public wifi has improved access to city services | X | X | ||||||
| CCTV cameras has made residents feel safer | X | X | ||||||
| A website or App allows residents to effectively monitor air pollution | X | X | ||||||
| Arranging medical appointments online has improved access | X | |||||||
| Mobility | Car-sharing Apps have reduced congestion | X | ||||||
| Apps that direct you to an available parking space have reduced journey time | X | |||||||
| Bicycle hiring has reduced congestion | X | |||||||
| Online scheduling and ticket sales has made public transport easier to use | X | |||||||
| The city provides information on traffic congestion through mobile phones | X | |||||||
| Activities | Online purchasing of tickets to shows and museums has made it easier to attend | X | X | |||||
| Opportunities (Work & School) | Online access to job listings has made it easier to find work | X | ||||||
| IT skills are taught well in schools | X | X | ||||||
| Online services provided by the city has made it easier to start a new business | X | |||||||
| The current internet speed and reliability meet connectivity needs | X | |||||||
| Governance | Online public access to city finances has reduced corruption | X | ||||||
| Online voting has increased participation | X | |||||||
| An online platform where residents can propose ideas has improved city life | X | |||||||
| Processing Identification Documents online has reduced waiting times | X | |||||||
Disclaimer/Publisher’s Note: The statements, opinions and data contained in all publications are solely those of the individual author(s) and contributor(s) and not of MDPI and/or the editor(s). MDPI and/or the editor(s) disclaim responsibility for any injury to people or property resulting from any ideas, methods, instructions or products referred to in the content. |
© 2025 by the authors. Licensee MDPI, Basel, Switzerland. This article is an open access article distributed under the terms and conditions of the Creative Commons Attribution (CC BY) license (https://creativecommons.org/licenses/by/4.0/).
Share and Cite
Tijjani, K.S.; Sarıkaya Levent, Y.; Levent, T. Smart Cities in the Global Context: Geographical Analyses of Regional Differentiations. Systems 2025, 13, 296. https://doi.org/10.3390/systems13040296
Tijjani KS, Sarıkaya Levent Y, Levent T. Smart Cities in the Global Context: Geographical Analyses of Regional Differentiations. Systems. 2025; 13(4):296. https://doi.org/10.3390/systems13040296
Chicago/Turabian StyleTijjani, Kabeer Saleh, Yasemin Sarıkaya Levent, and Tolga Levent. 2025. "Smart Cities in the Global Context: Geographical Analyses of Regional Differentiations" Systems 13, no. 4: 296. https://doi.org/10.3390/systems13040296
APA StyleTijjani, K. S., Sarıkaya Levent, Y., & Levent, T. (2025). Smart Cities in the Global Context: Geographical Analyses of Regional Differentiations. Systems, 13(4), 296. https://doi.org/10.3390/systems13040296