Abstract
In recent years, there has been rapid development in Chinese small and medium-sized livestock farms, accompanied by an increase in operational risks within the supply chain. To ensure the stability and sustainability of supply chain operations in small and medium-sized livestock farms, it is essential to thoroughly analyze their potential hazards and formulate effective prevention strategies. This paper employs the relevant supply chain theories, combined with previous research and expert interviews, to conduct an empirical analysis of supply chain operation risks in small and medium-sized livestock farms, with a specific focus on pig farms, beef cattle farms, laying hen farms, and broiler farms. The research indicates that the supply chain operation risks faced by small and medium-sized livestock farms primarily stem from external environmental factors and production-related challenges. Furthermore, external environmental risks predominantly arise from market fluctuations and compliance with environmental regulations, while production risk mainly pertains to disease safety. Based on the research findings, this paper proposes specific measures for risk prevention, including the strengthening of external environmental security, driving production innovation capacity, strengthening market forecasting capacity, constantly enhancing environmental awareness, and strengthening epidemic prevention efforts.
1. Introduction
Small and medium-sized livestock farms refer to farms with a poultry-feeding quantity of less than 50,000, basic sow-feeding quantity of less than 1000, and adult dairy cattle-feeding quantity of less than 500 heads. At present, small and medium-sized livestock farms account for 70% of all livestock farms in China. Livestock farms play a key role in animal husbandry, so research on them is becoming more and more important. In the contemporary complex and volatile market environment, small and medium-sized livestock farms are confronted with numerous challenges, as the stability and sustainability of their supply chain operations directly impact the survival and development of these enterprises.
With the rapid development of the economy, controlling supply chain operation risk (SCOR) has gradually become the core competitiveness factor of enterprises. According to previous reports, supply chain risks can be categorized into operational and disruption risks [1,2]. Operational risks are related to ordinary disturbances in supply chain operations, such as lead-time and demand fluctuations, whereas disruption risks primarily concern low-frequency and high-impact events [3]. Since the main functions of the supply chain of small and medium-sized livestock farms are to make daily deliveries according to market demand, the potential risks are mostly operational risks in the supply chain. In terms of supply chain risk impact, Power (2005) argued that supply chain integration complements traditional strategies, serving as a key mechanism for organizations to achieve competitive differentiation through a unique value chain [4]. Jabbour et al. (2020) further studied the role of big data in enhancing sustainable supply chain management through empirical analysis [5]. In terms of operational risk efficiency in the supply chain, recent research has highlighted the importance of digitization in improving supply chain efficiency, emphasizing its potential to create new opportunities for researchers and practitioners [6,7,8]. Using AI-driven multi-criteria decision-making technology analyzing 479 enterprises, Belhadi et al. (2022) demonstrated that big data and machine learning enhance supply chain resilience and decision-making efficiency [9]. For operational risk identification in the agricultural product supply chain, scholars adopted fuzzy MICMAC analysis to determine weather and political risks as the most significant driving factors based on risk dependence and driving forces [10]. In addition, scholars have proposed collaborative management strategies and business continuity plans to mitigate SCOR for agricultural perishables [11,12,13]. However, existing studies have focused on isolated risks, lacking comprehensive analysis of supply chain operation, with limited research on the supply chain development of small and medium-sized livestock farms. Therefore, it is necessary to apply scientific theories to reduce the SCOR and ensure sustainable development of small and medium-sized livestock farms.
Supply chain theory emphasizes coordination among various stages of the chain and adopts a holistic perspective on the entire process, from raw material supply to final product delivery [14,15], providing a robust theoretical framework and analytical perspective for examining the supply chain operations of livestock farms. Supply chain risk management theory addresses risk through four key dimensions: identification, assessment, response, and monitoring [16]. Applying this theory can clarify the causal relationships between different nodes in the supply chain of livestock farms. Moreover, as the first supply chain management standard used in cross-industry applications, the SCOR model, is a standardized general method for various industries to evaluate the operational capability of the supply chain [17]. In terms of structure, the SCOR model clarifies the integrity of the supply chain, further decomposes the core process, and determines the specific process categories. Through continuous exploration by scholars at home and abroad, the SCOR model has built a complete and mature system and has been applied in many fields, such as agriculture, animal husbandry, food, and agricultural products [18,19,20]. This structure of the model enables the farm to control the operational direction of the supply chain as a whole and to delve into the operation details to provide the farm with comprehensive supply chain operation guidance. Therefore, based on these theories, further research on supply chain operation logic, as well as the main risks and risk prevention for small and medium-sized livestock farms, is of great importance to promote the development of animal husbandry.
Furthermore, as an important animal husbandry production base in the world, Northeast China (Heilongjiang, Jilin, and Liaoning Provinces), with its unique geographical advantages and rich natural resources, is a key region to ensure the stable development of animal husbandry in China. Recently, Su and Li (2025) developed a comprehensive evaluation model for assessing the competitive advantages of animal husbandry, identifying low production efficiency and insufficient talent reserves in the current industry [21]. Zhao and Xiong (2022) employed a dual-structure equilibrium index model, revealing significant environmental pollution issues in livestock farming in Northeast China [22]. However, existing research on the development of animal husbandry in Northeast China remains limited and predominantly focuses on macro-level analyses. This study investigates pig farms, beef cattle farms, laying hen farms, and broiler farms as research objects, establishing a supply chain risk assessment index system for small and medium-sized livestock farms based on the SCOR model. By integrating the analytic hierarchy process with the expert scoring method, we identify supply chain risks in these livestock farms and propose feasible risk prevention measures tailored to the common risks observed across different farm types, thereby promoting the stable and sustainable development of small and medium-sized livestock farms. This study contributes to the existing body of research in three key areas: (1) analyzing the operational models of small and medium-sized livestock farms, revealing their operational logic through supply chain theory and expanding the theoretical application of supply chain concepts; (2) enhancing risk identification methodologies by constructing an evaluation index system based on the SCOR model, hierarchical analysis, and expert scoring methods, enriching research approaches in the field of risk identification; and (3) providing a decision-making foundation for governments and enterprises to formulate policies and development strategies for small and medium-sized livestock farms.
2. Establishment of Risk Evaluation Index System
2.1. Establishment of the First-Level Evaluation Index
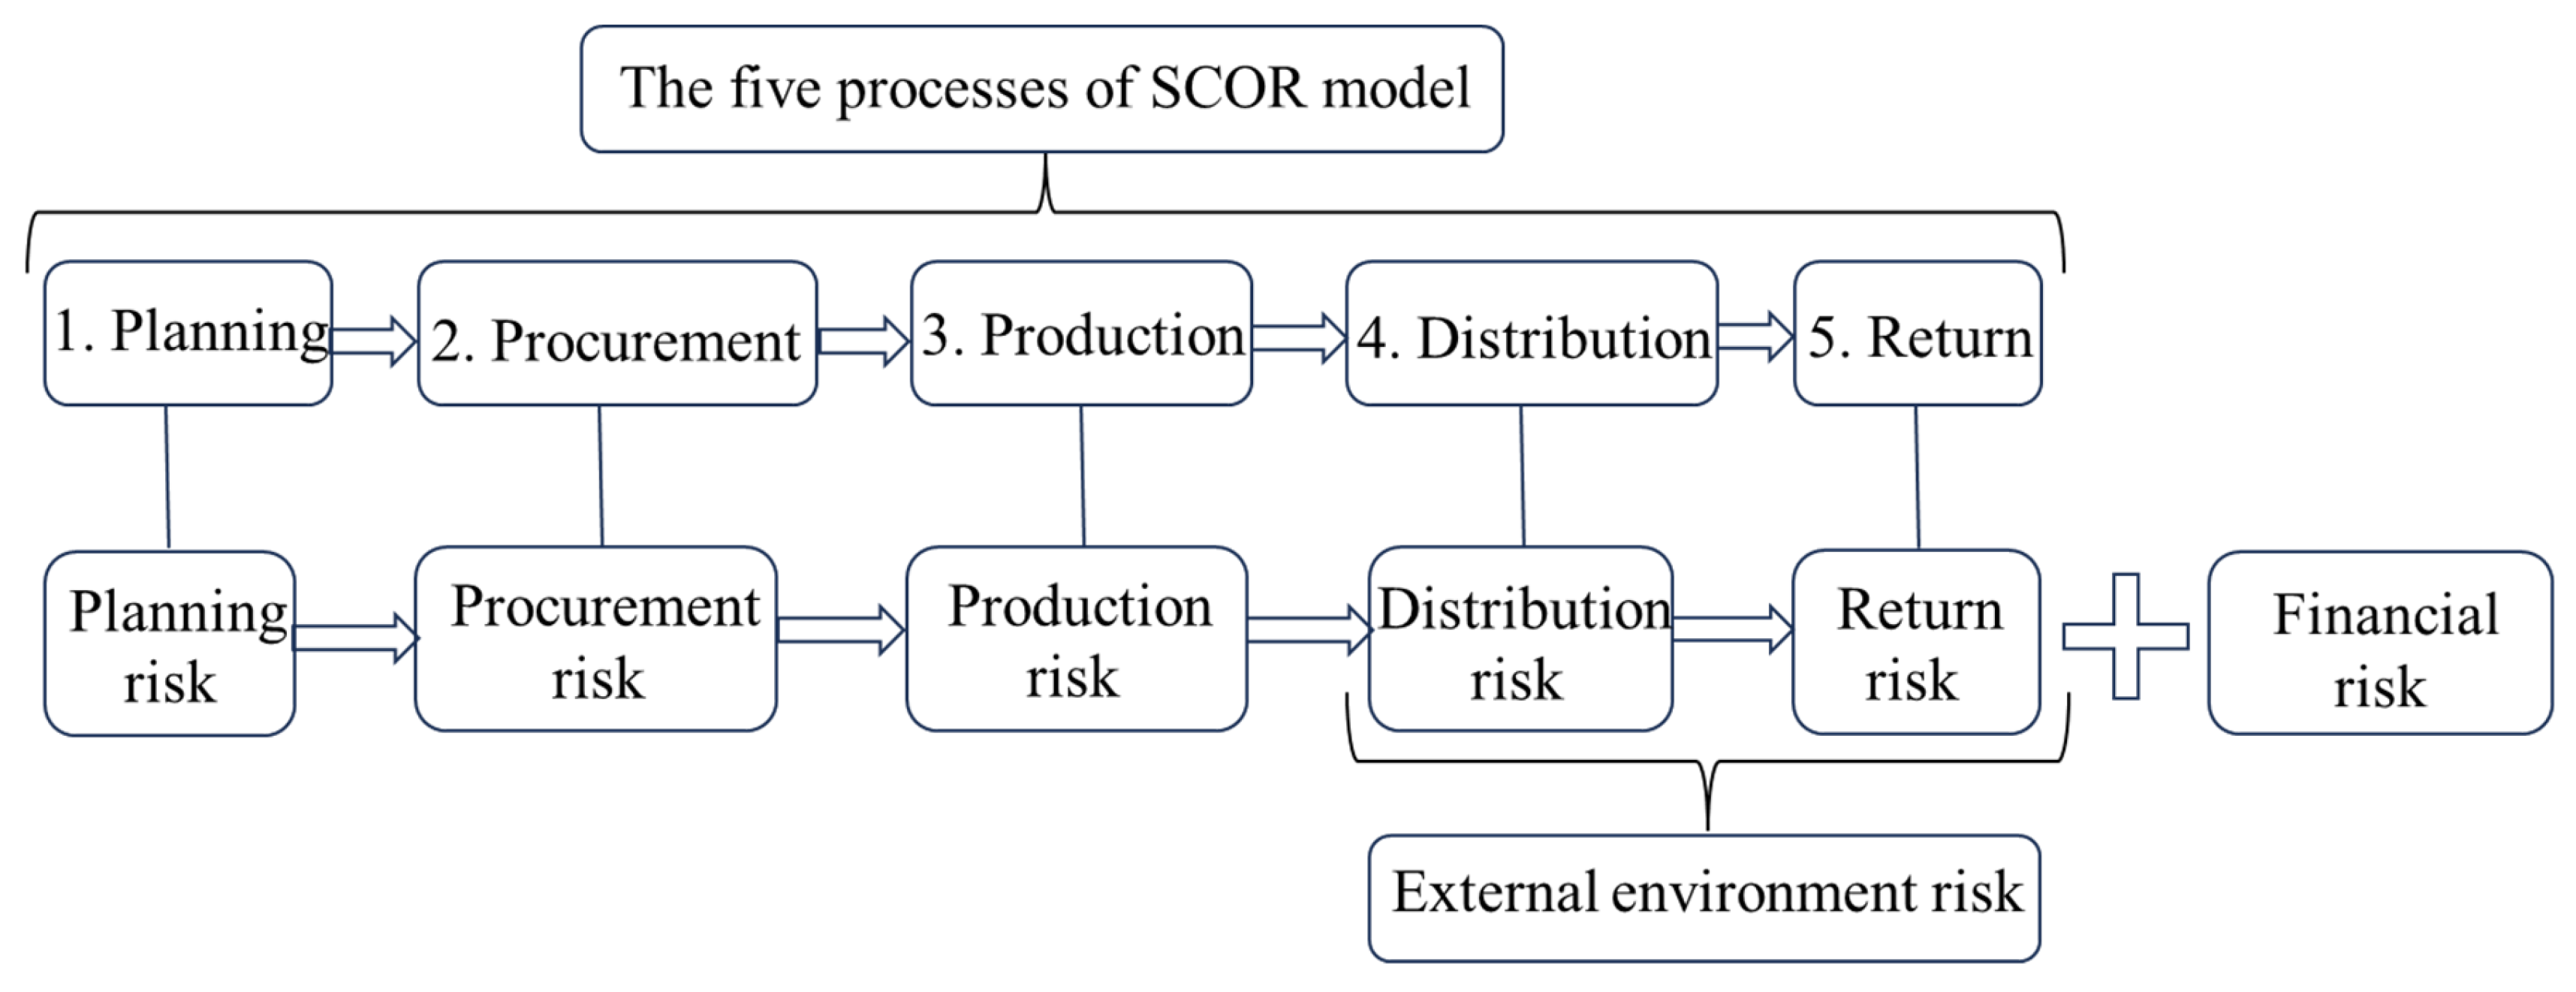
With the aim of a clear and unified expression of the supply chain’s complete operational process and convenient communication with relevant practitioners, experts, and scholars, the in the spring of 1996, the International Association of Supply Chain established the SCOR model, including the five processes of planning, procurement, production, distribution, and return. The SCOR model’s five processes encompass the whole process of enterprise production and services, involving all processes of production and service, from produce to after sales, targeting the classification of the various processes of the supply chain [23]. Drawing on the model’s five processes, this study provides evaluation indicators for the identifying SCOR of small and medium-sized livestock farms, namely, planning risk, procurement risk, production risk, distribution risk, and return risk (Figure 1).
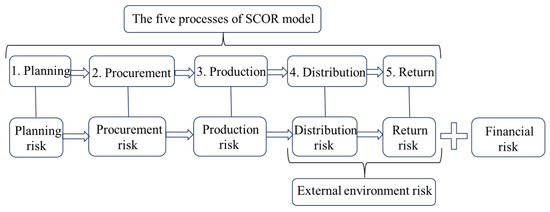
Figure 1.
The five sequential processes of the SCOR model and their corresponding risks and adjusted risks for small and medium-sized livestock farms.
By referring to the evaluation indices from relevant documents and case enterprises and combining them with the suggestions of relevant experts, the evaluation indexes were further adjusted:
- ①
- Given that small and medium-sized livestock farms are highly dependent on market conditions and policy influences, the smooth operations of the distribution and return processes are primarily influenced by external environmental factors, so the distribution risk and return risk were combined into external environmental risk.
- ②
- Since finance is an important capital-flow support for small and medium-sized livestock farms and controls the lifeblood of livestock farms, financial risk was included in the evaluation index system.
As shown in Figure 1, after adjustment, this study formulated five first-level evaluation indices for the SCOR of small and medium-sized livestock farms: planning risk, procurement risk, production risk, external environment risk, and financial risk.
2.2. Establishment of Subdivision Identification Indicators Based on Hierarchical Analysis Method
The supply chain operation processes of small and medium-sized livestock farms are systematic and standardized, and the core of the risk research lies in constructing evaluation indices with strong feasibility and high applicability [24,25]. Based on the analytic hierarchy process, the operation of the supply chain was divided into a target layer, criterion layer, and index layer. In the identification of the SCOR, this study followed the principles of risk identification in supply chain risk management theory and drew on the classification method of animal husbandry proposed by Luo and Cui [26] and the classification of supply chain risk types in each layer proposed by Houshyar et al. [27] to establish a risk identification index system. In addition, according to the characteristics of freshness, regionality, and dispersion of animal products, the evaluation indices were adjusted and subdivided. The analytic hierarchy process and expert scoring method were used to quantify the calculation, the weight of each index was obtained by pairwise comparison, and the risk level was determined according to the weight ranking. The first-level evaluation index was used as the criterion layer to serve as a reference for small and medium-sized livestock farms to prevent supply chain risks. The indicators’ description and evaluation methods are described in Table 1.

Table 1.
Risk evaluation indicators and descriptions of supply chain operations of small and medium-sized livestock farms.
2.3. Construction of the Evaluation Index System
After index combing, a supply chain risk evaluation index system for small and medium-sized livestock farms was created [28,29]. The target layer (A) represents the SCOR of small and medium-sized livestock farms. The criterion layer (B) comprises five indicators: planning risk (B1), procurement risk (B2), production risk (B3), external environment risk (B4), and financial risk (B5). The index layer (C) includes 17 indicators: cooperation problems (C1), infrastructure (C2), policy cognition (C3), young livestock batches (C4), logistics cost (C5), feed cost (C6), PRR number (C7), technical operation (C8), production performance management (C9), disease safety (C10), feed safety (C11), major force (C12), basic energy source (C13), environmental protection requirements (C14), market volatility (C15), financing issue (C16), and labor dispute (C17) [30].
3. Empirical Analysis
3.1. Selection and Introduction of Identification Method
The risk identification standard proposed in this paper is based on the 1–9 scale method [31] (Table 2). The layer index was quantitatively evaluated relative to the criterion layer index, and the judgment matrix was constructed by calculating pairwise comparisons of the indices. The identification results were standardized to determine the level of the risk indices, where a lower index value indicates a lower risk and a higher value indicates a higher risk. Through the judgment of experts, the relevant danger factors were scored to derive the risk weights corresponding to {B1, B2, …, B5} and {C1, C2, …, C17}.
Table 2.
1–9 scale method.
According to the actual situation of the research subject, experts indicated the risk degree for each index. If there were infinite or finite decimal places in the calculation process, a rounding method was adopted to keep four decimal places.
Hierarchical analysis is a common method in risk identification that is usually combined with the expert scoring method [32]. Compared to the risk matrix method, which relies on subjective judgment [33], the method of hierarchical analysis combined with expert scoring offers a more scientific and comprehensive evaluation by decomposing complex problems and quantifying scores. In contrast to fault tree analysis, which focuses on logical relationship analysis of past faults, and fuzzy comprehensive evaluation, which is more subjective and complex in calculation [34,35], the combination of hierarchical analysis with the expert scoring method can determine the danger level and evaluate the probability and impact of danger occurrence. It can also reduce the arbitrariness of judgment and improve logical rigor and reliability through pairwise comparison of the judgment matrix. Therefore, this study used the analytic hierarchy process combined with the expert scoring method. First, a certain number of experts were invited to score the relative probability of occurrence and the non-utility value of the consequences in the risk evaluation model. Then, the risk weight of each level in the hierarchical analysis method was calculated, and the risk coefficient of each index was obtained as the final weight to measure the hazard level.
3.2. Data Sources
Existing risk data in the livestock industry are primarily derived from macro-level sources, lacking research pertinence [36]. This study employed field research methods and expert interview methods to collect foundational data. In the main livestock-producing regions in Northeast China, field research was conducted on pig farms, beef cattle farms, laying hen farms, and broiler farms. Six livestock farm managers, along with relevant officials from the Animal Husbandry Bureau and agricultural university professors, were invited as experts to score and evaluate the potential risks of each indicator. In addition, strict expert rating criteria were established [37], requiring senior titles (e.g., professors, researchers) or over 10 years of relevant field experience. Experts must also demonstrate strong academic integrity, with no history of misconduct, and adhere to consistent, objective scoring standards. Following screening, six experts were selected: two agricultural university professors; two senior livestock bureau officials; and two farm managers with 21 and 16 years of experience, respectively. All of them have maintained exemplary professional ethics throughout their careers.
3.3. Calculation of the Index Weight
3.3.1. Calculation of the Weight of the System-Layer Indicators
Indicators B1, B2, B3, B4, and B5 of the criterion layer were compared according to the score of Expert 1, and the risk comparison results of the criterion layer were obtained, as shown in Table 3.
Table 3.
Criterion-layer risk comparison results.
By comparing the risk results, the judgment matrix (A) was obtained as follows:
Then, the judgment matrix (A) was normalized to obtain matrix B:
The eigenvector (W) was subsequently obtained according to the following calculation:
Specifically, the index weight results of the criterion layer from Expert 1 were 0.1147, 0.0858, 0.2248, 0.5410, and 0.0336.
Using Matrix Laboratory (MATLAB R2022b) software calculation, the maximum eigenvalue (λmax) was calculated as 5.3551. In order to further determine the accuracy of the judgment matrix, the consistency of the results was tested. The five-order positive reciprocal matrix is consistent when λmax = 5. For cases where λmax > 5, the consistency ratio (CR) is used to indicate matrix consistency. If CR > 0.1, the judgment matrix is considered inconsistent and fails the test. Conversely, if CR < 0.1, the judgment matrix is deemed consistent and passes the consistency test. CR is calculated as CR = CI/RI, where CI represents the consistency index and CI = (λmax − n)/(n − 1) [38]. The random index (RI) is an average consistency index obtained through extensive calculations and statistical analysis of the randomly generated judgment matrix. In this analysis, RI was used as the reference standard. When the order (n) was 5, the CI value was 0.0888, and the fixed value of RI was 1.12. CR = CI/RI = 0.0888/1.12 = 0.0793 < 0.1, indicating the matrix passes the consistency test.
Following the same methodology, the weight results from the other five experts were as follows: Expert 2: {0.1104, 0.0763, 0.1991, 0.5808, 0.0334}; Expert 3: {0.1238, 0.0792, 0.2267, 0.5352, 0.0351}; Expert 4: {0.1098, 0.0669, 0.2299, 0.5580, 0.0354}; Expert 5: {0.1038, 0.0619, 0.2185, 0.5741, 0.0416}; Expert 6: {0.0830, 0.0830, 0.1994, 0.5963, 0.0382}.
All the index weight results of the criterion layer mentioned above passed consistency tests.
3.3.2. Establishment of the Index Weight of the Index Layer
Similar to the processing method used for the criterion-layer index data, the index-layer indicators {C1, C2, C3, …, C17} were subjected to pairwise risk comparisons relative to their criterion-layer index. Based on the suggestions of six experts, we constructed a pairwise comparison matrix and calculated the weight of each index in the index layer, as shown in Table 4.
Table 4.
Indicator weight results of the index layer.
The above index weight results of the index layer all passed a consistency test.
3.3.3. Analysis of the Calculation Results
Using the above data, the calculation results were analyzed, and the differences in risk weights were evident. As shown in Figure 2, external environment risk (0.5410) > production risk (0.2248) > planning risk (0.1147) > procurement risk (0.0858) > financial risk (0.0336). Therefore, the external environment risk is the greatest threat to the daily operation of the supply chain of small and medium-sized livestock farms. This finding differs from those of other studies on livestock supply chain risk, which have often identified supply risk as the most significant threat [39,40]. The discrepancy might be attributed to the relatively weak talent recruitment and infrastructure development in small and medium-sized livestock farms, their high dependence on policies, incomplete operational systems, and significant susceptibility to external market influences.
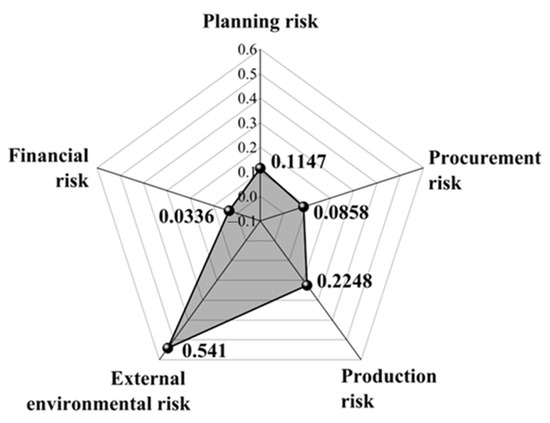
Figure 2.
Each risk weight of small and medium-sized livestock farms. (The values correspond to the magnitude of each risk).
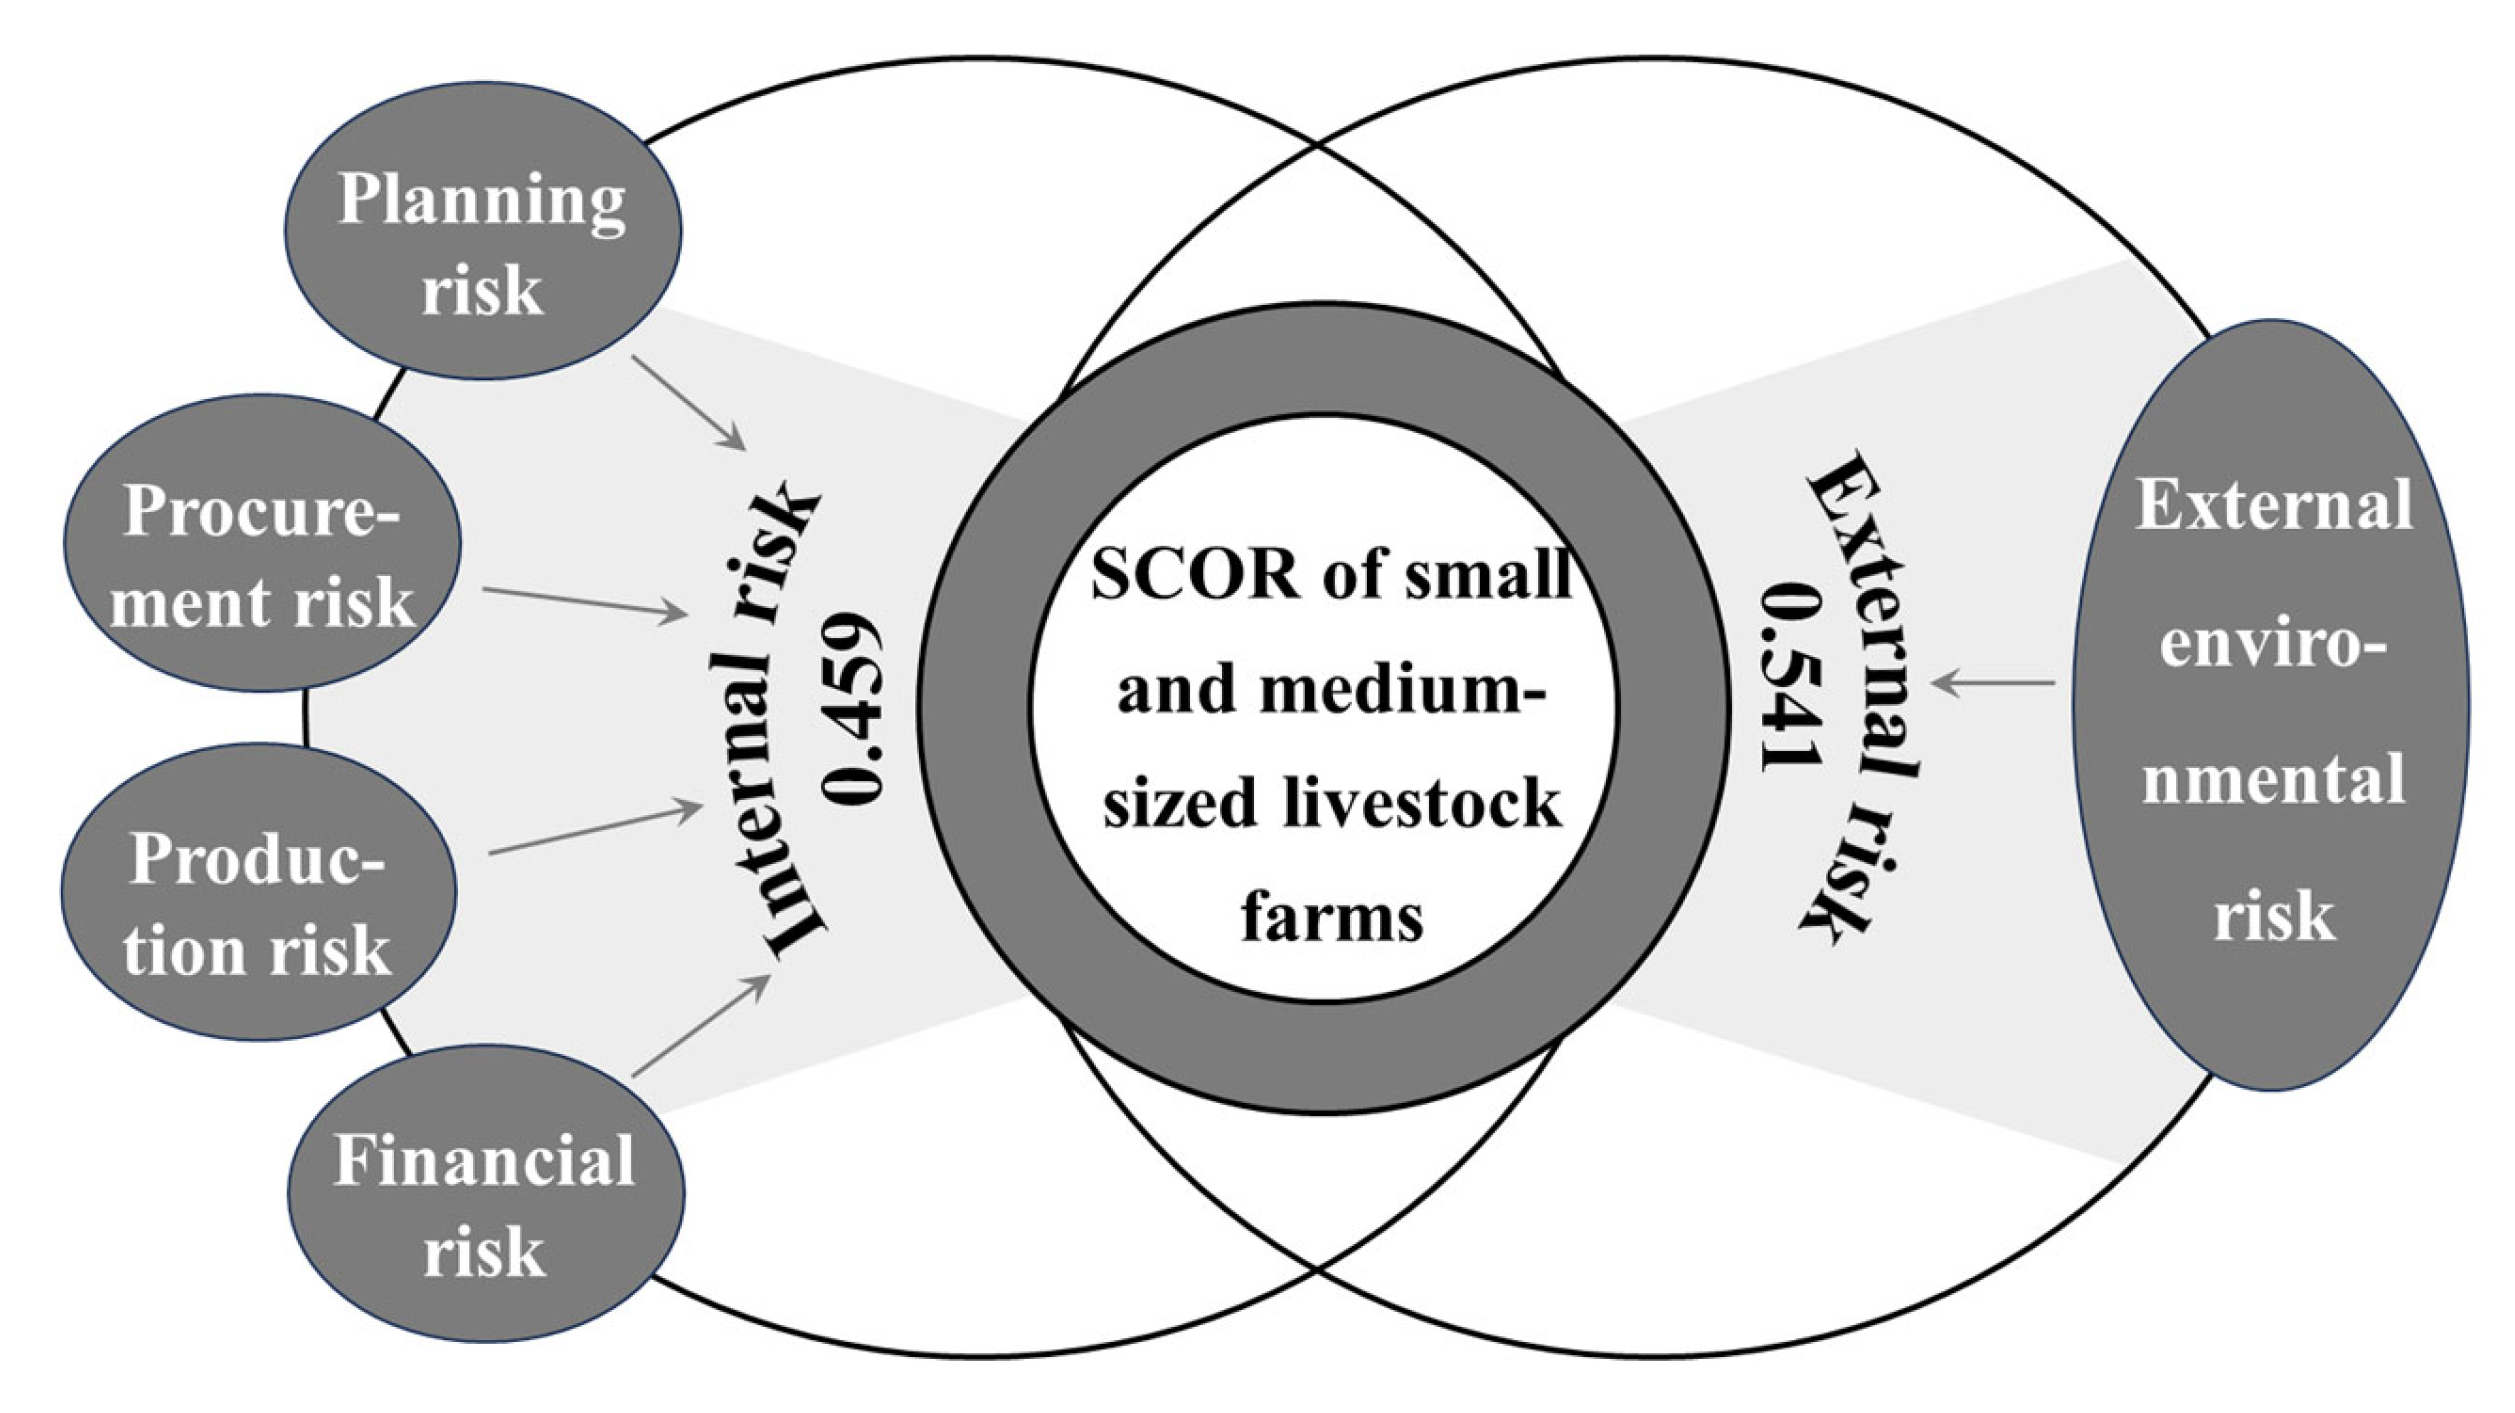
Although the weight of each risk varies significantly, the correlation between the nodes of the supply chain leads to the transmission of risks. When the local structure of the supply chain is greatly affected, the overall operation of the supply chain becomes difficult to control. In serious cases, the partner companies involved in the supply chain are also affected, resulting in huge losses for stakeholders. Although the supply chain is correlated., a local risk will not necessarily affect other aspects of supply chain operation. Whether the supply chain is affected, as well as the degree of the impact, needs to be judged according to the specific market conditions. From the perspective of the structure of the supply chain, planning risk, procurement risk, production risk, and financial risk are internal risks, while external environmental is an external risk (Figure 3). External risk is related to whether small and medium-sized livestock farms can operate normally, while internal risk is related to whether they can operate better. Figure 3 shows that the total internal risk of the supply chain is 0.459, which is smaller than the external risk. This demonstrates that the supply chain of small and medium-sized livestock farms could currently operate normally, despite significant potential for risk prevention.
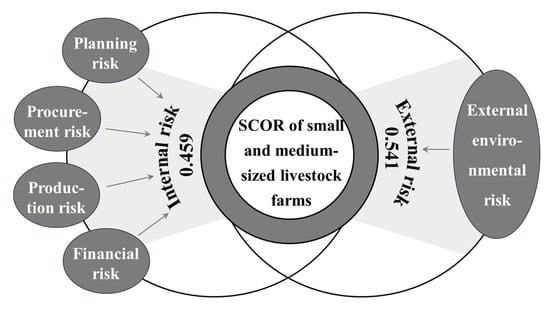
Figure 3.
The structure and proportion of internal and external risks in the SCOR for small and medium-sized livestock farms. (Internal risks: planning risk, procurement risk, production risk, and financial risk; external risk: external environmental risk).
4. Discussion
Based on field investigations conducted on small and medium-sized pig farms, beef cattle farms, laying hen farms, and broiler farms in Northeast China, this study employed the analytic hierarchy process and the expert scoring method to identify the SCOR of these farms. The findings revealed that external environmental risks and production risks carry relatively significant weight. Consequently, it is imperative to mitigate the operational risks of small and medium-sized farms through effective government policy guidance and market measures. This is supported by recent policy developments, notably the 2020 “Opinions on Promoting High-quality Development of Animal Husbandry” (https://www.gov.cn/gongbao/content/2020/content_5551804.htm (accessed on 14 September 2020)), which explicitly advocated for a transformation towards efficient, safe, resource-conserving, and environmentally friendly animal husbandry. Additionally, in 2023, Jilin Province formulated the “Decision of the Standing Committee of the Jilin Provincial People’s Congress on Promoting the Development of the Beef Cattle Industry” (https://xmy.jl.gov.cn/xwfb/myyw/bmdt/202306/t20230614_8723871.html (accessed on 14 June 2023)), providing support in terms of breeding land allocation and tax incentives. The formulation and implementation of these policies have not only positively influenced the development of animal husbandry but also provided a robust foundation for the reliability of this study’s conclusions.
The significance of the policy impact was further corroborated by Mack and Kohler’s research, which emphasized that policies significantly influence corporate revenue and suggested policy optimization as central to operational improvement [41]. However, policy modifications tend to lag and exhibit regional disparities, which diminish their effectiveness. This study identified weak risk awareness and cognitive misalignment among farm managers as the root causes of operational vulnerabilities. Consequently, the focus should shift toward enhancing operators’ risk awareness and reducing cognitive misalignment. Cognitive biases exacerbate risks due to the lack of stable upstream and downstream partnerships, as well as unreliable supply channels for veterinary drugs and vaccines. For instance, Pejsak et al. argued that low animal vaccination rates were a major contributor to increased market risk [42]. Additionally, inadequate inspections by downstream slaughtering and processing enterprises encourage illegal practices among farmers, fostering a chance mentality and market gaming behaviors after animal deaths, thereby destabilizing supply chain operations.
The research findings not only provide significant guidance for small and medium-sized livestock farms in Northeast China but also offer valuable references for traditional livestock industries in other internationally recognized major livestock production regions with suitable climate conditions and abundant land resources. Particularly in the fields of pig farming, beef cattle farming, layer hen farming, and broiler farming, the risk identification and management suggestions from this study can serve as a reference for farms to reduce dangers and improve economic returns. However, the comprehensiveness and international applicability of the data remain subject to limitations. First, the sample scope is restricted. Due to the challenges and time constraints associated with collecting more extensive data, this study focuses on Northeast China, a globally significant livestock production region. However, in high-temperature, high-humidity regions or ecologically fragile areas, regional differences in environmental pressures and technological applications may affect its direct applicability. Second, the study relies on input from six senior experts for scoring. While these experts possess solid theoretical knowledge, extensive practical experience, and strong professional ethics, the limited number of participants and the inherent subjectivity in scoring may introduce discrepancies with respect to actual values. These limitations highlight the need for further research with broader datasets and more diverse expert participation to enhance the robustness and applicability of the findings.
5. Conclusions and Suggestions
5.1. Conclusions
Based on the supply chain operation structure of small and medium-sized livestock farms, this paper identified hidden dangers and derived the following conclusions:
- ①
- The SCOR of small and medium-sized livestock farms mainly derive from external environmental and production risks. The order of risk value was external environment risk > production risk > planning risk > procurement risk > financial risk. Moreover, external environment and production risks collectively accounted for over 70% of the total risk, and strengthening the prevention of these two risks can significantly reduce the total risk.
- ②
- External environmental risks were mainly manifested in two aspects: market volatility and environmental protection requirements. The weight of these two indicators accounted for more than 50% of the external environmental risk, and strengthening their control can significantly reduce the external environmental risk.
- ③
- Production risk mainly manifested in the aspect of disease safety. The weight of disease safety accounted for over 60% of the production risk, and increasing preventive measures can significantly reduce the production risk.
5.2. Suggestions
- ①
- Strengthen external environmental security. To mitigate the impact of natural disasters such as rainstorms and strong winds, infrastructure improvements are essential, including reinforcement of livestock houses with windproof materials and the construction of drainage systems. To avoid delays, construction plans must be reported to the relevant government department prior to commencement. Dedicated warehouses should be established to store feed, water, and grains sufficient for 10–15 days. Emergency plans should be developed, including capacity for 72 h independent power generation and regular maintenance of power supply lines to ensure electrical safety. The government should monitor the implementation of these measures. Based on local pricing standards, construction costs will increase by USD 30/m2. Pilot tests indicate that although initial investments will rise, the long-term benefits include reduced economic losses from livestock housing damage and animal casualties.
- ②
- Drive production innovation and capacity. In terms of production, farms should establish a detailed operational flow chart to identify process linkages and risk sources, assign dedicated personnel for hazard monitoring, ensure survival and stocking rates, enhance production continuity and stability, and address issues promptly. Additionally, in terms of technology, targeted investments and partnerships with research institutions are essential, as long-term collaboration fosters innovative technologies that boost efficiency and reduce energy consumption. While the lengthy research and development cycle may delay economic returns and initial costs are high, improved production safety will ultimately drive greater profitability.
- ③
- Strengthen the market forecasting capacity. Assign specialized personnel to utilize big data analysis tools for prediction of market trends over the next 6–12 months, refining the early price warning mechanism based on the feeding scale, varieties, and market cycle patterns. The survey found that a small number of medium-sized livestock farms have hired experts to conduct price analysis. Given the labor costs in Northeast China, this practice incurs an additional expense of approximately USD 900 per month. However, this strategy enhanced benefit stability. Initial forecasting may involve significant price inaccuracies, necessitating attention to price linkage effects and accumulated forecasting experience. To address market volatility, maintaining sufficient liquidity is important, and securing bank loans or financing can help alleviate economic pressure on livestock farms.
- ④
- Constantly enhance environmental awareness. Farm managers must strengthen low-carbon environmental awareness and water source protection, strictly adhering to regulations such as the “Discharge Standard of Pollutants for Livestock and Poultry Breeding” (https://www.mee.gov.cn/ywgz/fgbz/bz/bzwb/shjbh/swrwpfbz/200301/t20030101_66550.shtml (accessed on 1 January 2003)). Implement biogas digester projects, ensure timely manure cleaning, and use specialized vehicles to transport waste to collection tanks located away from water sources and residential areas. These tanks must have leak-proof and overflow-prevention measures, with a capacity to store at least seven days’ worth of manure. Closed transport systems should be employed to prevent leakage and secondary pollution. Additionally, government bodies should promote environmental slogans to raise public awareness of environmental protection.
- ⑤
- Strengthen epidemic prevention efforts. Livestock farms can implement an animal body temperature monitoring system that employs digital technology, using ear tags to collect and locate temperature data. These data can then be uploaded to a cloud platform for real-time monitoring, enabling farm managers to immediately isolate animals with abnormal temperatures. Cases studies conducted in the area under investigation concluded that infected animals must be quarantined within 2 h to prevent the epidemic from spreading exponentially. However, the long-term use of sensors is associated with challenges such as malfunctions at low temperatures, requiring regular maintenance. Although significant investment is required for ear tags, platform construction, and personnel, the system significantly reduces losses from livestock treatment and mortality, thereby improving breeding efficiency. To stay informed about disease types and advanced vaccine technologies, long-term collaboration with a dedicated veterinary team is crucial. Vaccination strategies should be tailored to livestock breeds, growth stages, and local epidemic characteristics, with immediate treatment upon disease detection.
Author Contributions
Writing—original draft, M.X.; writing—review and editing, M.X. and X.Y.; investigation, M.X. and X.Y.; conceptualization, M.X. and X.Y.; methodology, M.X.; software, M.X. and Z.S.; funding acquisition, X.Y.; validation, Z.S.; formal analysis, Z.S. All authors have read and agreed to the published version of the manuscript.
Funding
This research was supported by the Science and Technology Development Plan of Jilin Province (No. 20240701114FG), the Key Project of Jilin Provincial Education Science “14th Five-Year Plan” 2023 Annual Program (No. ZD23049), the National Undergraduate Innovation Fund Project of Jilin Agricultural University in 2023 (No. 202310193032), and the China Academy of Engineering institute of Land Cooperation Consulting Project (No. JL2024-22).
Data Availability Statement
The data presented in this study are available upon request due to privacy considerations.
Acknowledgments
Our study received support from the head of the local government and agricultural university experts.
Conflicts of Interest
The authors declare that they have no known competing financial interests or personal relationships that could have appeared to influence the work reported in this paper.
References
- Fahimnia, B.; Jabbarzadeh, A.; Sarkis, J. Greening versus resilience: A supply chain design perspective. Transp. Res. Part E Logist. Transp. Rev. 2018, 1, 129–148. [Google Scholar] [CrossRef]
- Xu, S.; Zhang, X.; Feng, L.; Yang, W. Disruption risks in supply chain management: A literature review based on bibliometric analysis. Int. J. Prod. Res. 2020, 58, 3508–3526. [Google Scholar] [CrossRef]
- Hosseini, S.; Ivanov, D.; Dolgui, A. Review of quantitative methods for supply chain resilience analysis. Transp. Res. Part E Logist. Transp. Rev. 2019, 125, 285–307. [Google Scholar] [CrossRef]
- Power, D. Supply chain management integration and implementation: A literature review. Supply Chain Manag.-Int. J. 2005, 10, 252–263. [Google Scholar] [CrossRef]
- Jabbour, C.; Fiorini, P.; Ndubisi, N.; Queiroz, M.; Piato, É. Digitally-enabled sustainable supply chains in the 21st century: A review and a research agenda. Sci. Total Environ. 2020, 10, 138177. [Google Scholar] [CrossRef] [PubMed]
- Perano, M.; Cammarano, A.; Varriale, V.; Regno, C.; Michelino, F.; Caputo, M. Embracing supply chain digitalization and unphysicalization to enhance supply chain performance: A conceptual framework. Int. J. Phys. Distrib. Logist. Manag. 2023, 53, 628–659. [Google Scholar] [CrossRef]
- Van Hoek, R. Research opportunities for a more resilient post-COVID-19 supply chain–closing the gap between research findings and industry practice. Int. J. Oper. Prod. Manag. 2020, 40, 341–355. [Google Scholar] [CrossRef]
- Yu, Z.; Cao, X.; Tang, L.; Yan, T.; Wang, Z. Does digitalization improve supply chain efficiency? Financ. Res. Lett. 2024, 67, 105822. [Google Scholar] [CrossRef]
- Belhadi, A.; Kamble, S.; Fosso Wamba, S.; Queirozd, M. Building supply-chain resilience: An artificial intelligence-based technique and decision-making framework. Int. J. Prod. Res. 2022, 60, 4487–4507. [Google Scholar] [CrossRef]
- Zhao, G.; Liu, S.; Lopez, C.; Chen, H.; Lu, H.; Mangla, S.; Elgueta, S. Risk analysis of the agri-food supply chain: A multi-method approach. Int. J. Prod. Res. 2020, 58, 4851–4876. [Google Scholar] [CrossRef]
- Kumar, A.; Mangla, S.; Kumar, P.; Song, M. Mitigate risks in perishable food supply chains: Learning from COVID-19. Technol. Forecast. Soc. Change 2021, 166, 120643. [Google Scholar] [CrossRef]
- Biza, A.; Montastruc, L.; Negny, S.; Admassu, S. Strategic and tactical planning model for the design of perishable product supply chain network in Ethiopia. Comput. Chem. Eng. 2024, 190, 108814. [Google Scholar] [CrossRef]
- Blackburn, J.; Scudder, G. Supply chain strategies for perishable products: The case of fresh produce. Prod. Oper. Manag. 2009, 18, 129–137. [Google Scholar] [CrossRef]
- Dondi, M.; García-Ten, J.; Rambaldi, E.; Zanelli, C.; Vicent-Cabedo, M. Resource efficiency versus market trends in the ceramic tile industry: Effect on the supply chain in Italy and Spain. Resour. Conserv. Recycl. 2021, 168, 105271. [Google Scholar] [CrossRef]
- Zhu, Q.; Kouhizadeh, M.; Sarkis, J. Formalising product deletion across the supply chain: Blockchain technology as a relational governance mechanism. Int. J. Prod. Res. 2022, 60, 92–110. [Google Scholar] [CrossRef]
- Baryannis, G.; Validi, S.; Dani, S.; Antoniou, G. Supply chain risk management and artificial intelligence: State of the art and future research directions. Int. J. Prod. Res. 2019, 57, 2179–2202. [Google Scholar] [CrossRef]
- Vishnu, C.; Sridharan, R.; Kumar, P. Supply chain risk management: Models and methods. Int. J. Manag. Decis. Mak. 2019, 18, 31–75. [Google Scholar] [CrossRef]
- İndap, Ş.; Tanyaş, M. Blockchain applications for traceability and food safety in agri-food supply chain: Cherry product application. J. Enterp. Inf. Manag. 2023. ahead-of-print. [Google Scholar] [CrossRef]
- Yadav, S.; Garg, D.; Luthra, S. Development of IoT based data-driven agriculture supply chain performance measurement framework. J. Enterp. Inf. Manag. 2021, 34, 292–327. [Google Scholar] [CrossRef]
- Nguyen, T.; Nguyen, T.; Nguyen, Q.; Nguyen, K.; Nguyen, C. Measuring Supply Chain Performance for Khanh Hoa Sanest Soft Drink Joint Stock Company: An Application of the Supply Chain Operations Reference (SCOR) Model. Sustainability 2023, 15, 16057. [Google Scholar] [CrossRef]
- Su, T.; Li, C. Spatial-temporal characteristics and influence factors of high-quality development of animal husbandry industry in China. PLoS ONE 2025, 20, e0313906. [Google Scholar] [CrossRef] [PubMed]
- Zhao, X.; Xiong, C. Spatial and temporal characteristics, evolution law and improvement path of China’s animal husbandry production pattern. Sustainability 2022, 14, 15794. [Google Scholar] [CrossRef]
- Zhou, H.; Benton, J.; Schilling, D.; Milligan, G. Supply chain integration and the SCOR model. J. Bus. Logist. 2011, 32, 332–344. [Google Scholar] [CrossRef]
- Chand, P.; Jitesh, J.; Kunal, K. Analysis of supply chain complexity drivers for Indian mining equipment manufacturing companies combining SAP-LAP and AHP. Resour. Policy 2018, 59, 389–410. [Google Scholar] [CrossRef]
- Buhr, B. Information Technology and Changing Supply Chain Behavior: Discussion. Am. J. Agric. Econ. 2000, 82, 1130–1132. [Google Scholar] [CrossRef]
- Luo, G.; Cui, J. Exploring high quality development of animal husbandry in Qinghai province from the perspective of the Tibetan sheep industry. Sci. Rep. 2024, 14, 21500. [Google Scholar] [CrossRef]
- Houshyar, S.; Fehresti-Sani, M.; Fatahi, A.; San, M.; Cotton, M. Comparison of sustainability in livestock supply chain. Environ. Dev. Sustain. 2024, 26, 21461–21485. [Google Scholar] [CrossRef]
- Salam, M.; Bajaba, S. The role of supply chain resilience and absorptive capacity in the relationship between marketing–supply chain management alignment and firm performance: A moderated-mediation analysis. J. Bus. Ind. Mark. 2023, 38, 1545–1561. [Google Scholar] [CrossRef]
- Rogerson, S.; Svanberg, M.; Santen, V. Supply chain disruptions: Flexibility measures when encountering capacity problems in a port conflict. Int. J. Logist. Manag. 2022, 33, 567–589. [Google Scholar] [CrossRef]
- Zhang, L.; Wu, Z.; Economics, S. Influencing Factors of Rice Farmers' Intention on the Adoption of Specialized and Unified Prevention in Great Lake Region. Econ. Geogr. 2019, 39, 180–186. [Google Scholar]
- Bodin, L.; Gass, S. On teaching the analytic hierarchy process. Comput. Oper. Res. 2003, 30, 1487–1497. [Google Scholar] [CrossRef]
- Gosling, E.; Reith, E. Capturing farmers’ knowledge: Testing the analytic hierarchy process and a ranking and scoring method. Soc. Nat. Resour. 2020, 33, 700–708. [Google Scholar] [CrossRef]
- Qazi, A.; Dikmen, I. From risk matrices to risk networks in construction projects. IEEE Trans. Eng. Manag. 2019, 68, 1449–1460. [Google Scholar] [CrossRef]
- Ikwan, F.; Sanders, D.; Hassan, M. Safety evaluation of leak in a storage tank using fault tree analysis and risk matrix analysis. J. Loss Prev. Process Ind. 2021, 73, 104597. [Google Scholar] [CrossRef]
- Yang, C.; Zheng, X.; Dai, C.; Li, D.; Liu, L.; Fang, L.; Tian, H.; Shao, T.; Zhang, J. Risk Assessment of Coal Supply Chain Based on Analytic Hierarchy Process and Fuzzy Comprehensive Evaluation. Heliyon 2025, 11, e42629. [Google Scholar] [CrossRef]
- Neumann, K.; Verburg, P.; Elbersen, B.; Stehfest, E.; Woltjer, G. Multi-scale scenarios of spatial-temporal dynamics in the European livestock sector. Agric. Ecosyst. Environ. 2011, 140, 88–101. [Google Scholar] [CrossRef]
- Serenko, A.; Bontis, N. A critical evaluation of expert survey-based journal rankings: The role of personal research interests. J. Assoc. Inf. Sci. Technol. 2018, 69, 749–752. [Google Scholar] [CrossRef]
- Aguarón, J.; Moreno-Jiménez, J. The geometric consistency index: Approximated thresholds. Eur. J. Oper. Res. 2003, 147, 137–145. [Google Scholar] [CrossRef]
- McDermott, J.; Staal, S.; Freeman, H.; Herrero, M.; Steeg, J. Sustaining intensification of smallholder livestock systems in the tropics. Livest. Sci. 2010, 130, 95–109. [Google Scholar] [CrossRef]
- Khan, W.; Khan, S.; Dhamija, A.; Haseeb, M.; Ansari, S. Risk assessment in livestock supply chain using the MCDM method: A case of emerging economy. Environ. Sci. Pollut. Res. 2023, 30, 20688–20703. [Google Scholar] [CrossRef]
- Mack, G.; Kohler, A. Short- and long-run policy evaluation: Support for grassland-based milk production in Switzerland. J. Agric. Econ. 2019, 70, 215–240. [Google Scholar] [CrossRef]
- Pejsak, Z.; Kusior, G.; Pomorska, M.; Podgórska, M. Influence of long-term vaccination of a breeding herd of pigs against PCV2 on reproductive parameters. Pol. J. Vet. Sci. 2012, 15, 37–42. [Google Scholar] [CrossRef] [PubMed]

Disclaimer/Publisher’s Note: The statements, opinions and data contained in all publications are solely those of the individual author(s) and contributor(s) and not of MDPI and/or the editor(s). MDPI and/or the editor(s) disclaim responsibility for any injury to people or property resulting from any ideas, methods, instructions or products referred to in the content. |
© 2025 by the authors. Licensee MDPI, Basel, Switzerland. This article is an open access article distributed under the terms and conditions of the Creative Commons Attribution (CC BY) license (https://creativecommons.org/licenses/by/4.0/).