Abstract
Prior exploration is an instructional strategy that has improved performance and understanding in system-dynamics-based simulators, but only to a limited degree. This study investigates whether model transparency, that is, showing users the internal structure of models, can extend the prior exploration strategy and improve learning even more. In an experimental study, participants in a web-based simulation learned about and managed a small developing nation. All participants were provided the prior exploration strategy but only half received prior exploration embedded in a structure-behavior diagram intended to make the underlying model’s structure more transparent. Participants provided with the more transparent strategy demonstrated better understanding of the underlying model. Their performance, however, was the equivalent to those in the less transparent condition. Combined with previous studies, our results suggest that while prior exploration is a beneficial strategy for both performance and understanding, making the model structure transparent with structure-behavior diagrams is more limited in its effect.
1. Introduction
The difficulties with decision-making in complex dynamic systems are well documented (e.g., [1,2,3,4,5,6,7]). Previous research with system-dynamics-based simulators [8,9] has shown success with an instructional strategy called prior exploration. This strategy seeks to improve learners’ performance and understanding by improving both their mental models and transfer of that knowledge, and simultaneously minimizing detrimental cognitive load and learners’ risk avoidance. The prior exploration strategy allows learners to explore the effect of individual decisions on the behavior over time of the dynamic system they have to manage and to do so quickly, easily, and without consequences for the simulator’s final outcome. The prior exploration strategy did improve learners’ understanding of the model and performance in the simulator, but both performance and understanding still are quite far from optimal.
In this paper, we investigate whether model transparency improves the previously found benefits of prior exploration. The strategy of increasing model transparency in system dynamics-based simulators was actively researched in the 1990’s and early 2000’s. Since then, there has been a tendency to assume that model transparency is good and should be a characteristic of most simulators and, for that matter, most system-dynamics activities [10,11,12,13,14].
The research studies of Machuca and his colleagues [15,16,17] provided considerable evidence that well-constructed transparent models are beneficial. Several studies by Größler and his colleagues [18,19,20] provided similar evidence, although some of the results were more mixed. Those, and other, studies are analyzed in [21] which, in addition to concluding that transparency is beneficial for only some learners and some learning objectives, also concluded that different methods of providing transparency (verbal explanations, videos, causal-loop diagrams, and stock and flow diagrams) are differentially effective. For example, stock and flow diagrams are probably effective for learners with more system-dynamics background.
Some more recent studies have again investigated (in contrast to assumed) the benefits of transparency. The results have been mixed. Cheverst et al. [22] provided evidence that users desire transparency, though they do not necessarily benefit from it. Cramer et al. [23] suggested that while transparency improved users’ meta-competence (awareness of their own competence), it may have actually interfered with improving their competence. Lee et al. [24] suggested some benefits for transparency in an authoring tool, but transparency was confounded with other design characteristics, so it was not entirely clear if the benefit was due specifically to transparency. The literature review in [6] identified several studies of transparency that did show beneficial results, and one study indicating that different methods of providing transparency (e.g., causal-loop diagrams, hierarchical-tree diagrams, block diagrams) were differentially effective. Somewhat in agreement with [6,25] included a variety of multimedia techniques for increasing transparency, some of which were more effective than others.
Given that researchers have shown success with some methods of increasing transparency, and based upon the theoretical belief in system dynamics that a key to understanding dynamic systems is an appreciation how model structure drives model behavior, this paper embeds the prior exploration strategy within structure-behavior diagrams.
For evaluating the effectiveness of structural transparency, we assessed both performance and understanding. Performance is a more direct indicator for the quality of dynamic decision making since it is based on learners’ explicit decisions and interactions with the simulator. Performance can be measured as the degree to which learners manage to optimize, maximize or minimize a specific measure or how well they reach a specified target [26]. Understanding, on the other hand, is an indicator of the mental models underlying dynamic decision making. It is a measurement of the cognitive, social, and motivational learning resources used by the learner during dynamic decision making. There are a variety of measures for understanding that range from mean scores on questionnaires to performance in transfer tasks and similarity of mental models between novices and experts [26]. The relationship between understanding and performance is not straightforward and, thus, neither performance can be predicted by understanding nor can understanding be inferred from performance (e.g., [27,28,29]; literature reviewed in [26,30,31,32]).
Given the above, our research questions for this study were as follows:
- Will learners who receive the prior exploration strategy embedded within a more transparent (structure-behavior diagram) interface show better understanding than learners receiving the prior exploration strategy embedded in an opaque (black-box) interface?
- Will learners who receive the prior exploration strategy embedded within a more transparent interface demonstrate better performance in the final simulation-game than learners receiving the prior exploration strategy embedded in an opaque interface?
To answer our research questions, we further developed a previously used dynamic decision-making task and applied it to perform an experimental study with 247 educational psychology students. In the next section we describe the materials and methods used for the experimental study. In the results section we analyze whether the experimental conditions differed from each other with respect to performance and understanding. As our results did not find significant performance differences between the experimental groups (only understanding differences), the discussion and conclusions section focuses on possible explanations and further developments of the current experimental design.
2. Materials and Methods
A pilot study using the current materials and methods is described in [33]. Here, we report on the full study with three (rather than only two) experimental conditions and extended analysis. However, we use a considerable part of the materials and methods description from that previous publication. The same is true for the results section.
2.1. Task and Decisions
The experiment was based on a simulator that we had already used in previous research. BLEND, the Bergen Learning Environment for National Development, its underlying simulation model and details of the experimental design that studied the effectiveness of prior exploration are described in detail in [9,34]. To summarize, participants in the experimental version of BLEND play the role of a developing nation’s prime minister whose task is to achieve and maintain the highest possible per capita income (adjusted for interest payments on debt) over a time horizon of 50 years. The prime minister has full decision-making authority regarding expenditures for education, expenditures for health, and expenditures for roads and can adjust them every five years. The sum of the total expenditures also determines whether the prime minister needs to borrow money from abroad.
The development of per capita income over time results from reinforcing processes between capital accumulation through private sector as well as infrastructure and human development. Too aggressive borrowing strategies lead to the accumulation of debt and severely hamper economic development.
The instructions (Appendix A) describe the structure of the simulation model underlying the experiment and the decisions that participants can make.
2.2. Experimental Conditions
The research participants were assigned randomly to one of three experimental conditions. The first condition is the control group that did not work with the prior exploration strategy but received a reading task as in [9]. The purpose of the control group is to ensure consistency with previous studies investigating the effectiveness of the prior exploration strategy. The remaining two experimental conditions both worked with the prior exploration strategy.
In the original prior exploration strategy ([9]), the learner could adjust sliders for the main input variables of the model (government expenditures for education, health, and roads) and see the effects in the form of graphs showing several of the nation’s key outcome variables (e.g., national debt, per capita income, levels of education, health, and roads). Figure 1 shows the original prior exploration strategy which, for the remainder of the paper, we refer to as the opaque group. In that strategy, the learner only sees behavior, and nothing about the structure of the system. For what we call the transparent group we, therefore, embedded the output graphs in a causal-loop diagram that shows the learner both the structure of the model and the behavior that results when they set the input variables (sliders) in various ways. The result, prior exploration embedded in a structure-behavior diagram, is shown in Figure 2. The diagram also included mouse-over text. When learners point with the mouse at particular graphs, variables, arrows, or loops, they are given an explanation of their role in the overall model, intended to improve transparency even more.
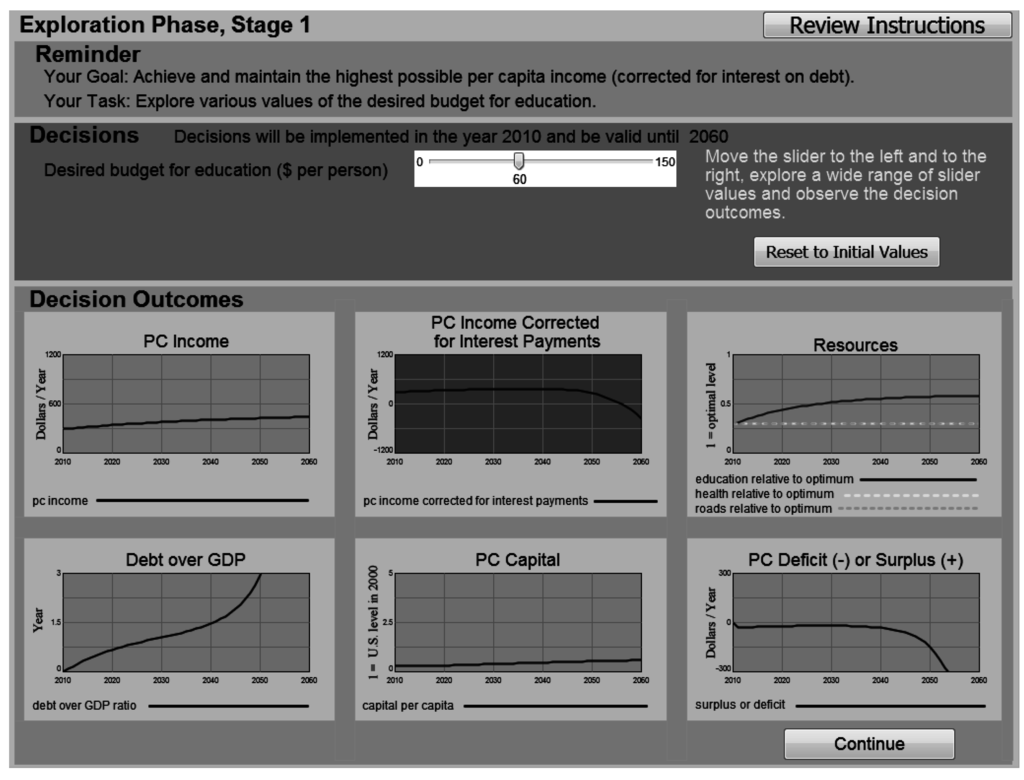
Figure 1.
The Prior Exploration activity in the low transparency condition (opaque group).
Figure 1.
The Prior Exploration activity in the low transparency condition (opaque group).

This is a dynamic activity. As the participant slides the slider for education higher and lower, the graphs below immediately replot to show how the selected budget would affect the various outcome variables. This version is considered low in transparency because there is no indication of how or why the education budget affects the variables plotted in the graphs. The exploration activity is shown in this figure in English (for the convenience of the reader). Participants in Germany saw an identical figure with the text in German.
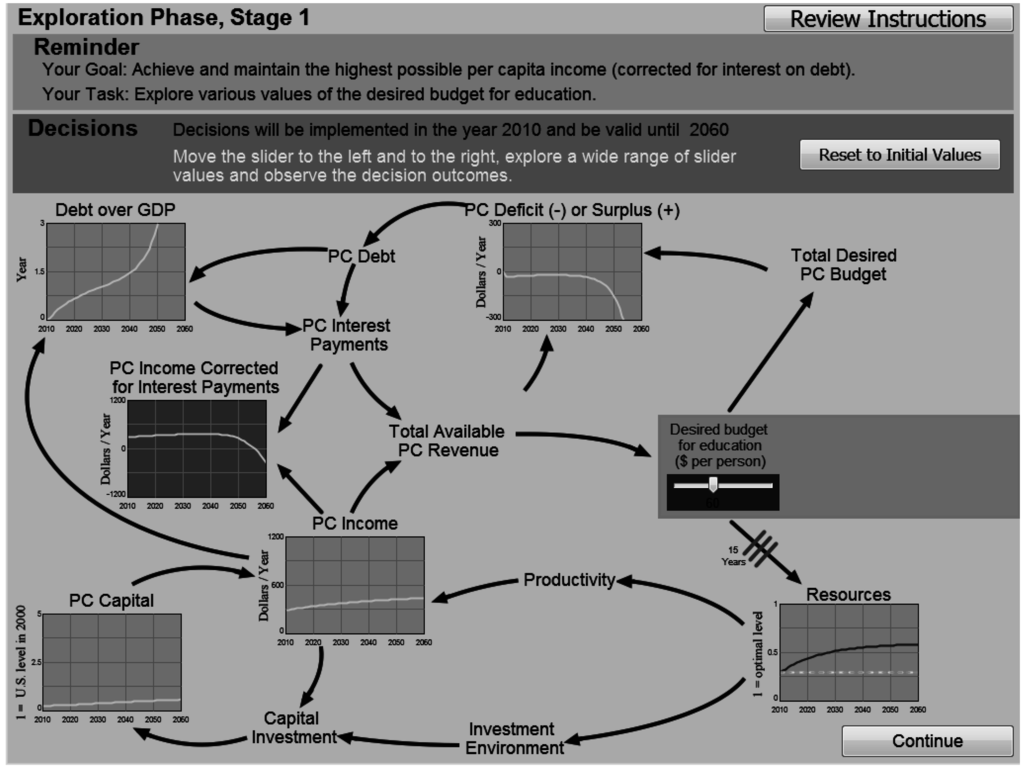
Figure 2.
The Prior Exploration activity in the high transparency condition (transparency group).
Figure 2.
The Prior Exploration activity in the high transparency condition (transparency group).

This is a dynamic activity. This version is considered high in transparency because the slider, the graphs and several other variables are shown within a causal loop diagram that reveals the cause-effect relationships. So, for example, the participant can see that the red slider for the education budget directly affects “Total Desired PC Budget” and “Resources”. Those, in turn, affect other variables like the Deficit, Productivity, and Investment Environment. Important reinforcing loops, such as the debt loop and the capital accumulation loop, are also easy to see. Once again, we show an English translation, though the participants in Germany saw an identical figure with the text in German.
2.3. Materials
All textual materials including test questions and participant responses were in German. Except for initial directions and final debriefing, all research materials were in a web-based program that could be run via any Windows-based computer with a browser and internet connection. The program consisted of:
- A title page.
- Five pages of instructions (Appendix A) which described the simulated nation and the things the participants would be doing.
- An identification page which required participants to enter a unique ID number.
- Four “prior exploration” stages (see below) or for the control group, a reading task.
- Two open-ended story questions (Appendix C).
- An eight-item multiple-choice test (Appendix D).
- The main simulation-game in which participants managed the nation for 50 simulated years (Figure 3).
- A final demographic questionnaire (Appendix E).
The four prior exploration stages were as follows:
- Participants first encountered an exploration page in which they manipulated only the expenditures for education, seeing either Figure 1 (the opaque group) or Figure 2 (the transparent group). They could do so for as long as they wanted, after which they received a reflection question as shown in Appendix B. The reflection question probed participants to type their observations about the preceding simulation-based exploration.
- Phase two was identical except that participants manipulated the expenditures for health, seeing figures very similar to either Figure 1 or Figure 2 and receiving a reflection question very similar to Appendix B.
- Phase three was the same except they manipulated the expenditures for roads (transportation infrastructure).
- Finally in phase four they were able to manipulate all three expenditure sliders for as long as they wished, once again followed by a reflection question.

Figure 3.
Interface of the management phase for the transparency group.
Figure 3.
Interface of the management phase for the transparency group.
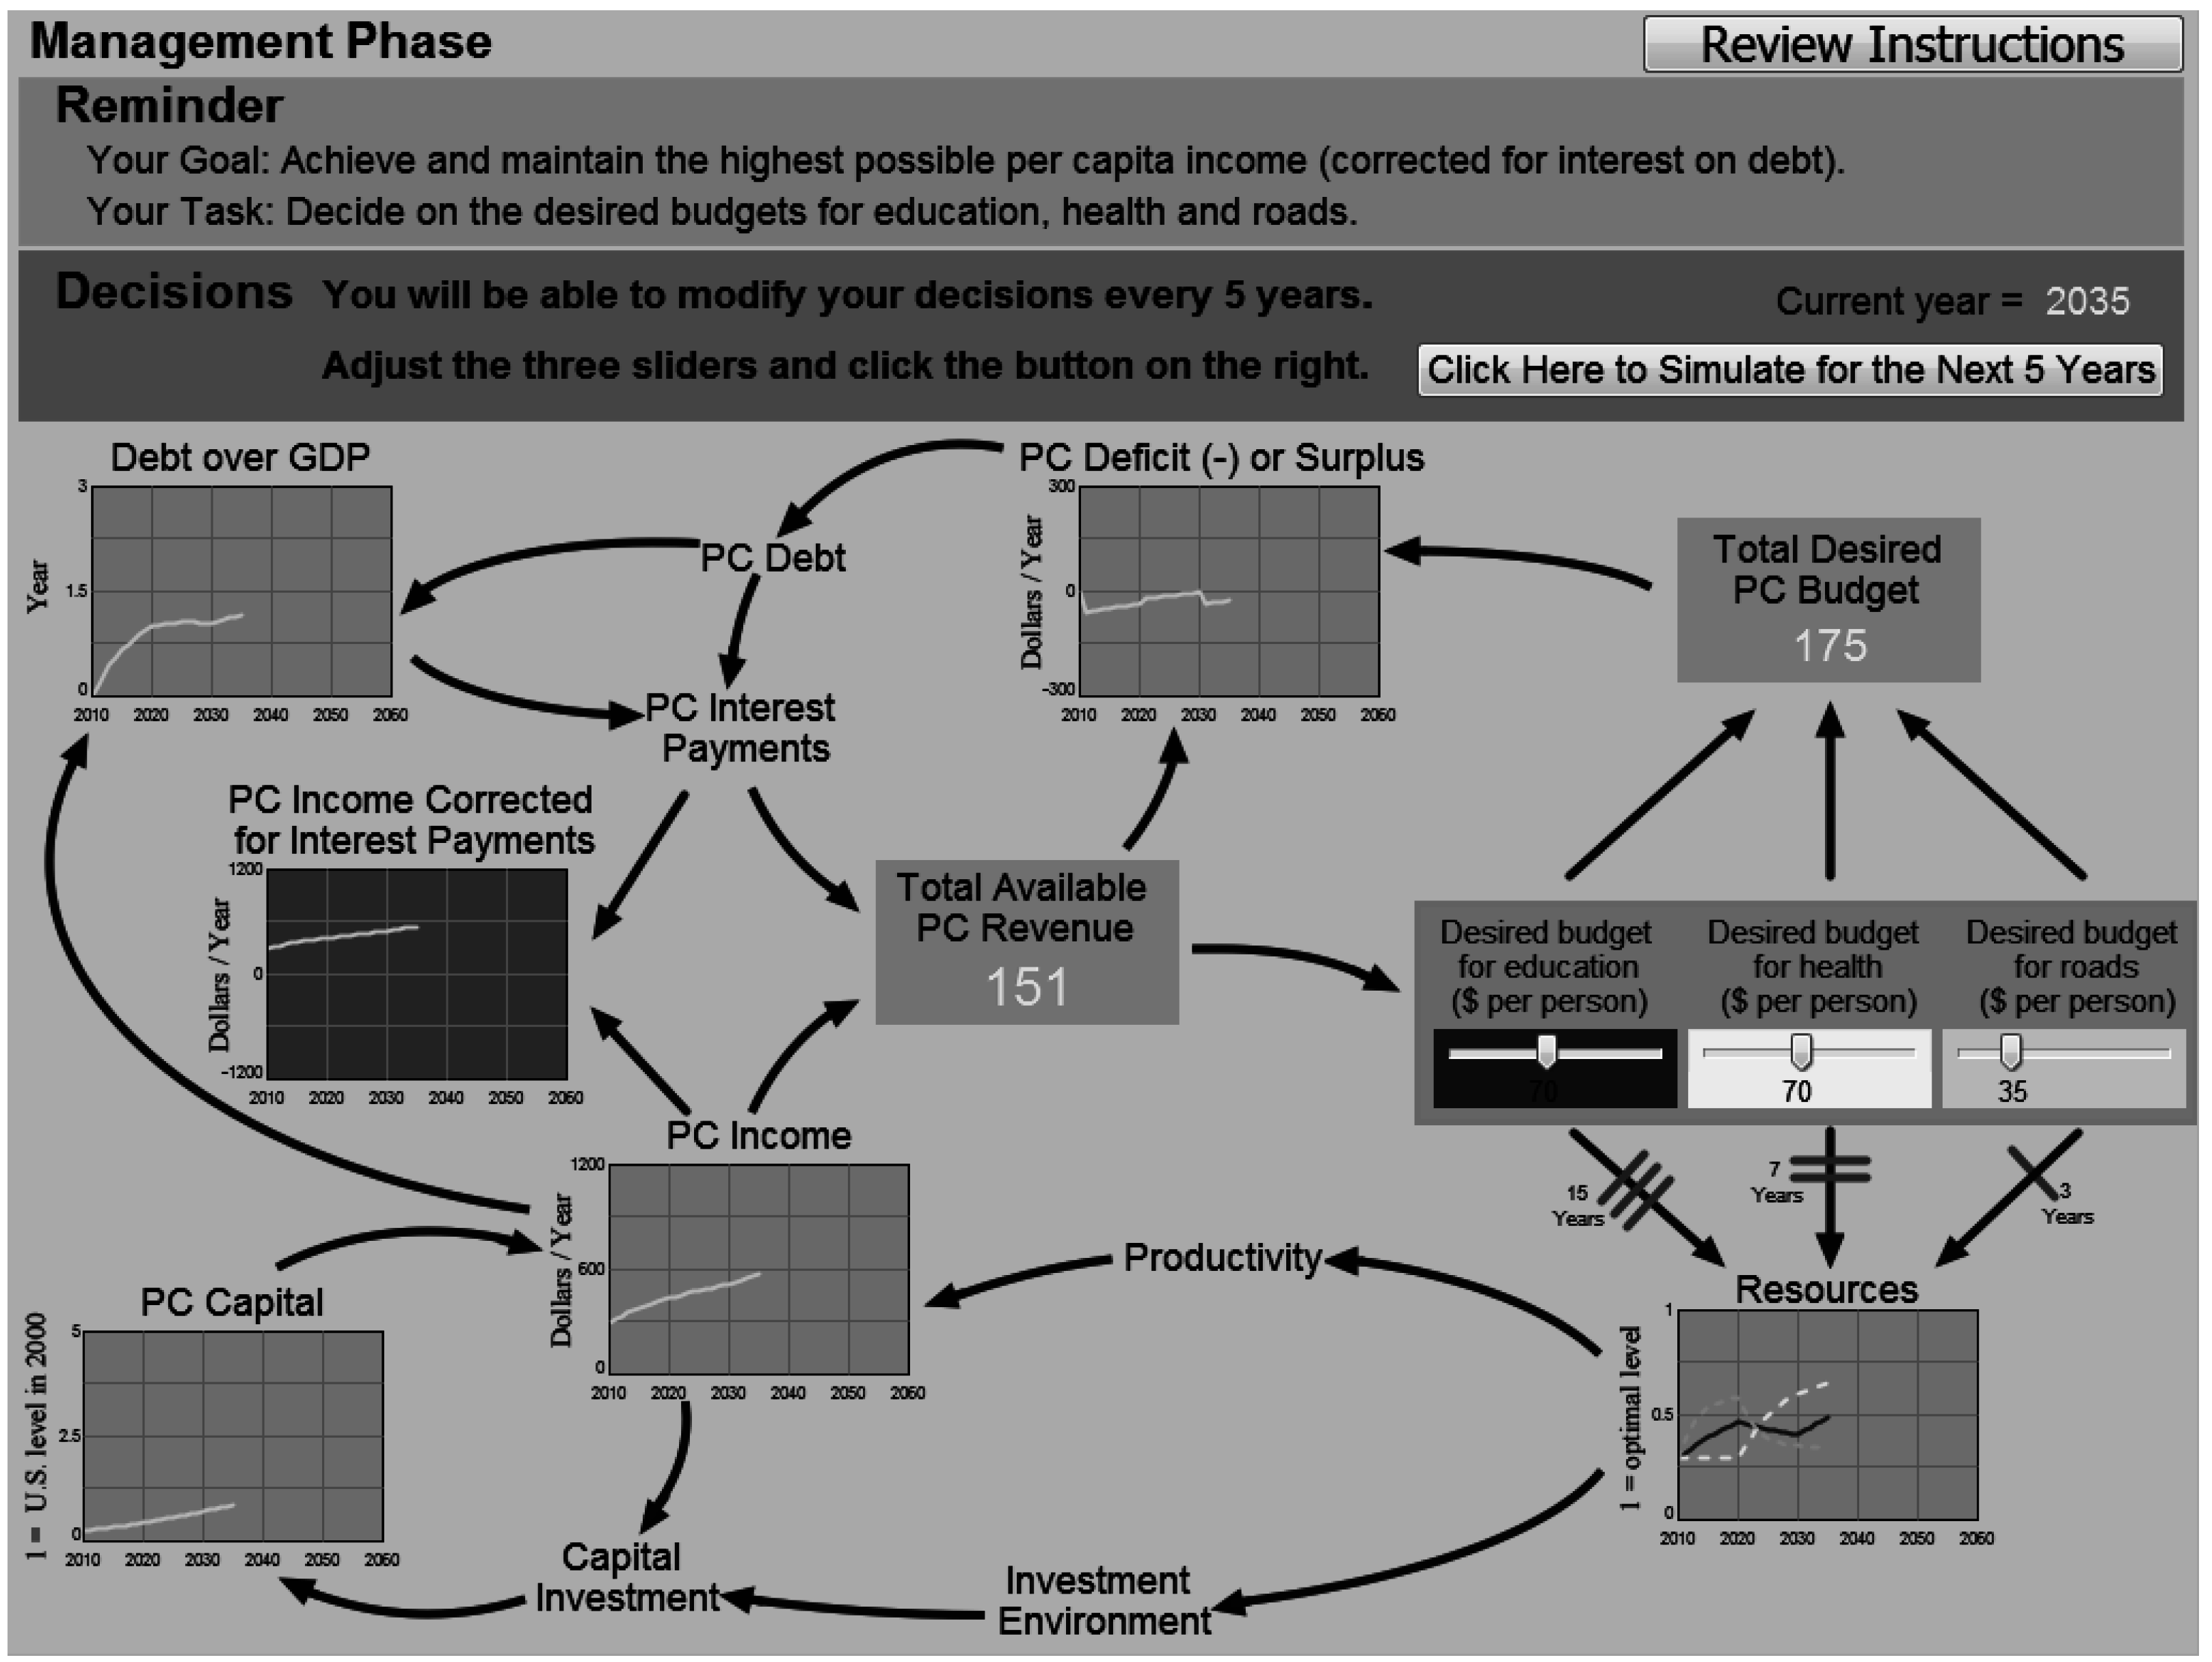
This is the main simulation-game activity that is the basis for assessing performance. It works quite differently than the Prior Exploration activities. On this page, moving a slider does not immediately affect the graphs. Only when the participant clicks the button labeled “Click Here to Simulate for the Next 5 Years” do the graphs update to show the outcomes for that five-year period. The participant can then move the sliders again to modify the investment strategy. This process (modify the sliders, go forward five years) is done ten times. In this figure, the participant has so far progressed to the year 2035 (half way through the simulation), so the graphs show the nation’s results up to that year. We show the English version though as with previous figures, the participants saw a version in German.
2.4. Measures
The final value of the per capita income adjusted for interest payments on debt, in the management phase, was the main measure of performance.
The multiple-choice test (Appendix D) was an objective measure of understanding. For measurement purposes we counted the number of correct answers on the multiple-choice questions. Table 1 provides an overview of the questions in the multiple-choice test and their correct answers. The table also lists the question identifiers (i.e., their short description that will be used in the results section of this paper). The last column refers to the levels in Bloom’s taxonomy of educational objectives that are assessed with the questions. Bloom’s taxonomy ([35,36]) differentiates between six levels of educational objectives which start from remembering and go to understanding, applying, analyzing, evaluating, and creating. In a separate paper [37] we describe the taxonomy in detail and its relevance for assessing understanding in complex dynamic decision making tasks. For the purpose of our BLEND simulator, the first four levels (remembering and understanding—levels 1/2, as well as applying and analyzing—levels 3/4) are of relevance. In the last column of Table 1 we only differentiate between levels 1/2 and 3/4, indicating questions that require remembering and explaining information about the national development planning task (levels 1/2) and questions that require using knowledge about the national development planning task to solve problems within the task (levels 3/4).
The story questions (Appendix C) were the subjective measure of understanding. Descriptions of the problem situation and of the proposed strategy to solve the national development planning task were combined into one verbal protocol which was then compared to an expert response. The expert response also described the problem structure (i.e., the structure of the underlying simulation model) and the strategies for successfully solving the national development planning task.
Since essay answers by 247 participants were so expansive, we coded a random selection of 50 participants’ written responses for each experimental condition and rated the responses for descriptions of a total of 16 relationships in the underlying simulation model and for descriptions of a total of six characteristics of successful strategies for solving the national development planning task.

Table 1.
Multiple-choice questions.
| Question Identifier | Question Stem Wording | Correct Answer | Level in Bloom’s Taxonomy |
|---|---|---|---|
| decisions in the task | The Prime Minister of Blendia can influence the following aspects directly | Expenditures for education, health, and roads | 1, 2 |
| determinants of tax rate | In the country of Blendia the tax rate | is fixed | 1, 2 |
| determinants of capital investments | In the country of Blendia, capital investment depends on: | The levels of education, health and roads | 1, 2 |
| determinants of per capita income | In Blendia, economic development is measured by per capita income. | Per capita income in Blendia is the value of production per person and production is determined by the amount of physical capital, human capital and roads | 1, 2 |
| mechanisms behind interest rate | What determines the interest rate in Blendia? | The amount of debt and the GDP (pc income) | 3, 4 |
| mechanisms that lead to a decrease in debt | How can you pay down (service) debt in Blendia? | By distributing less than the total revenue | 3, 4 |
| length of delays | In the country of Blendia, which of the investments has/will have the most immediate effect on per capita income? Rank the resources and list the resource with the most immediate effect first. | Roads, health, education | 3, 4 |
| mechanisms that lead to an increase in debt | High levels of debt in Blendia are a consequence of: | Spending more than earning through tax revenue | 3, 4 |
2.5. Participants
Research participants were 247 university students from a large national university in Germany. 52% were female and 48% were male. 73% were college age (between 18 and 21 years), 26% were 21 to 30, and 1% were above 30 years of age. Almost all were pursuing the bachelor degree in educational science and taking the class “Introduction to pedagogical psychology”. A small number (42 of the 248) had some experience with national development work, classes, or simulation. The three experimental conditions showed no significant differences in participants’ background (cf. Appendix E; chi-square, α = 0.05).
2.6. Procedure
Potential participants were introduced to the study during class and given the opportunity to volunteer or not for the study. Volunteers could log in for the study and, based on their student number, were randomly directed to one of three web URLs, one of which pointed to the control condition, one to the opaque condition and the last pointed to the transparent condition of the program. Participants were allowed two weeks to perform the national development planning task. Data was automatically stored to a secure web server. After two weeks, a debriefing and discussion occurred in class.
3. Results
This section presents the results from our experimental study. We first compare performance between the experimental groups and then analyze differences in understanding.
3.1. Performance
Figure 4 shows participants’ performance in the national development planning task (i.e., the values for per capita income adjusted for interest payments on debt) for the control group, the opaque group, and the transparent group. Differences in performance between the opaque and the transparent group are difficult to detect visually. The opaque group tends to exhibit slightly more homogeneous performance patterns than the transparent group.
In the opaque and transparent groups, the vast majority of participants either stabilized or increased their per capita income (adjusted for interest on debt) over time. In the control group, on the other hand, a considerably higher number of participants bankrupted their country, i.e., they created so much debt that per capita income adjusted for interest payments on debt became negative. As the reinforcing nature of this debt spiral leads to escalating negative values of performance, Figure 5 compares the median performance of the three conditions.

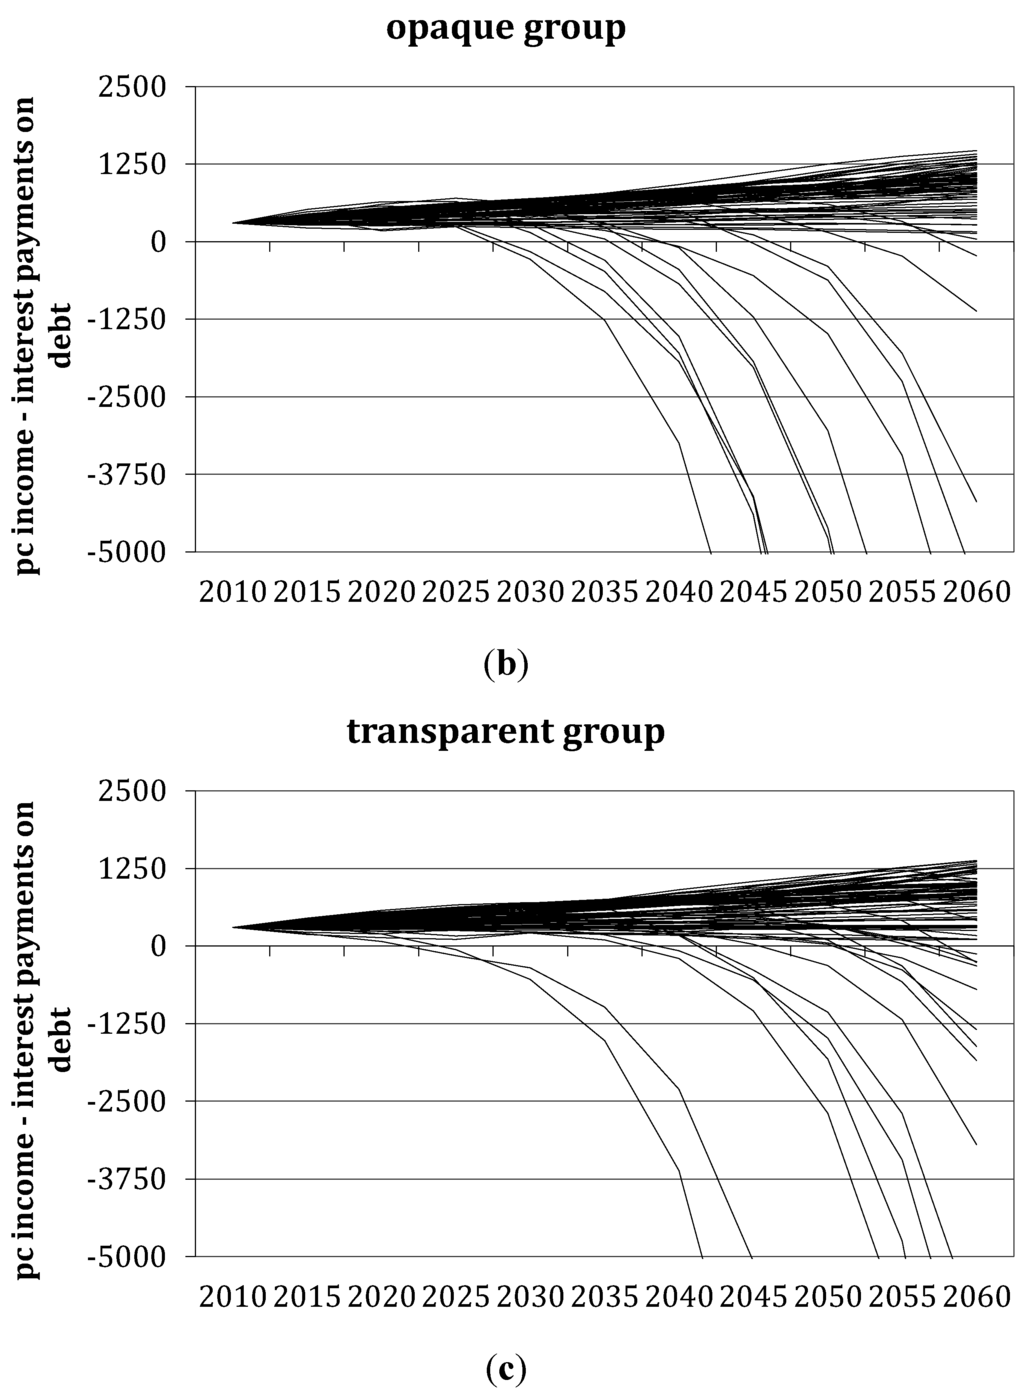
Figure 4.
Individual participants’ performance in the three conditions. (a) Shows participants’ performance in the control group; (b) In the prior exploration group with opaque interface and (c) In the prior exploration group with transparent interface.
Figure 4.
Individual participants’ performance in the three conditions. (a) Shows participants’ performance in the control group; (b) In the prior exploration group with opaque interface and (c) In the prior exploration group with transparent interface.
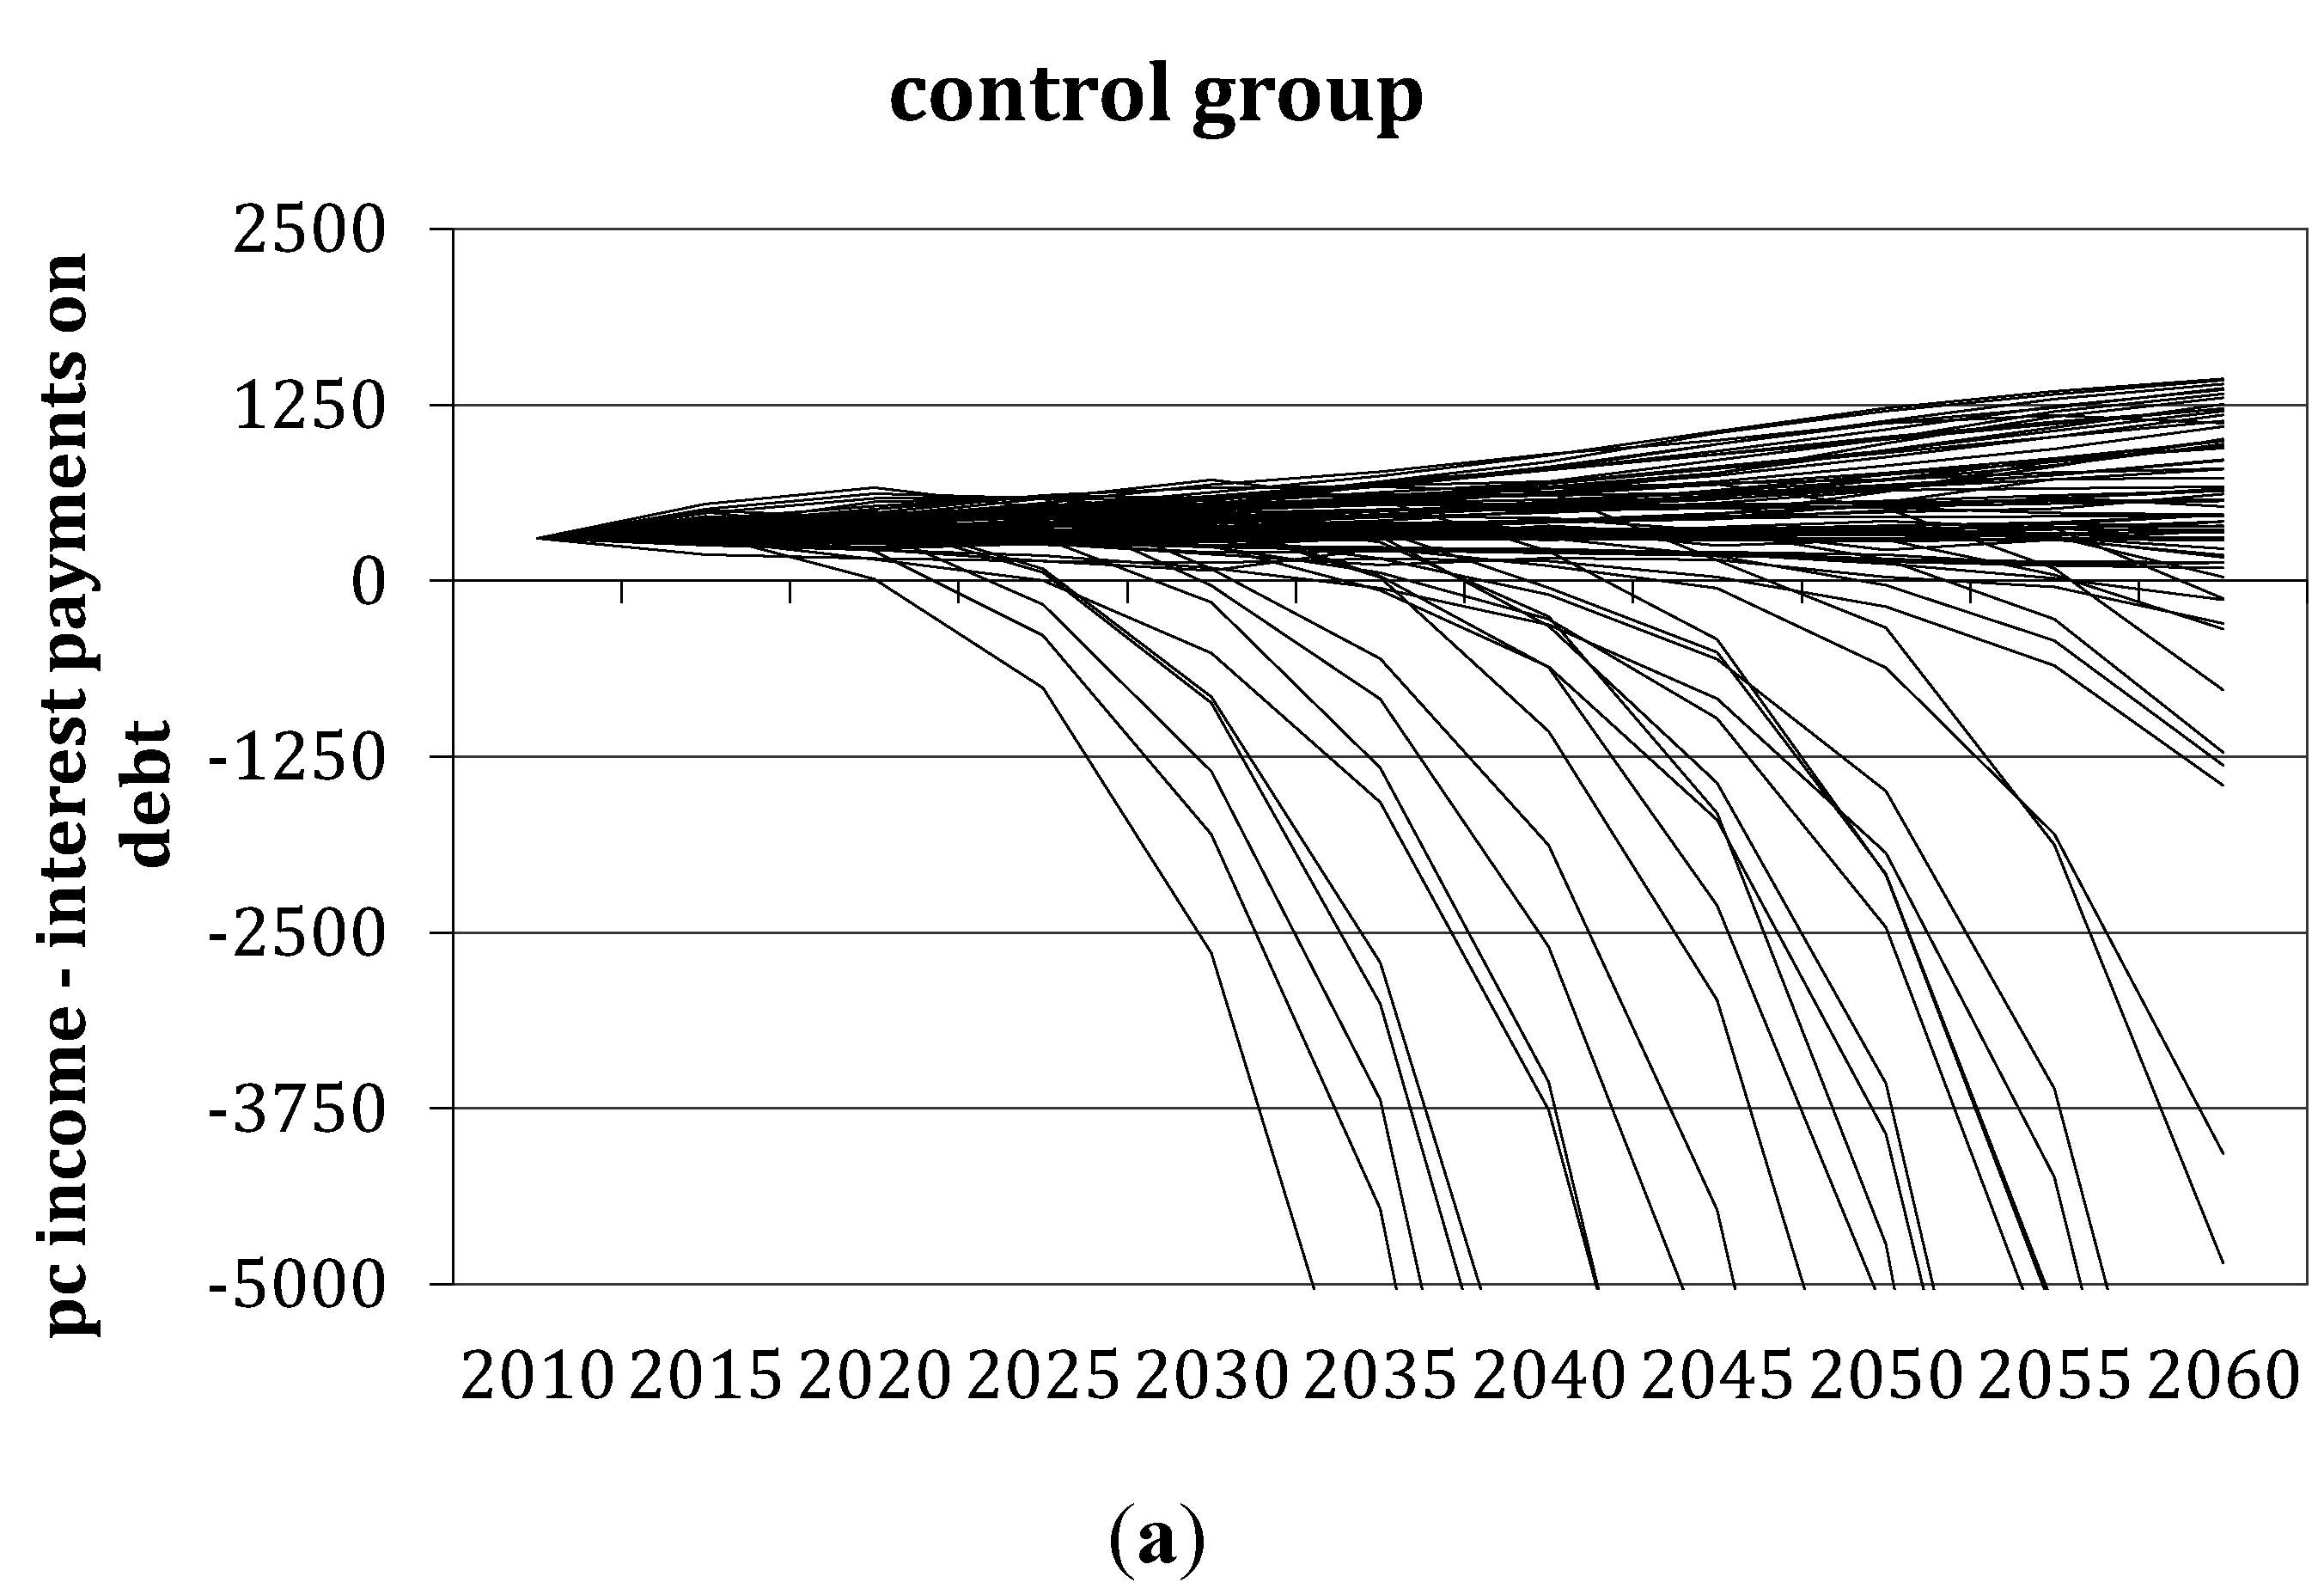

Figure 4 plots individual performance over time for the control group, the opaque, as well as the transparent group. In the control group, a substantial number of participants bankrupt their country. Differences in performance between the opaque and the transparent group, on the other hand, are difficult to detect visually. The opaque group tends to exhibit slightly more homogeneous performance patterns than the transparent group.
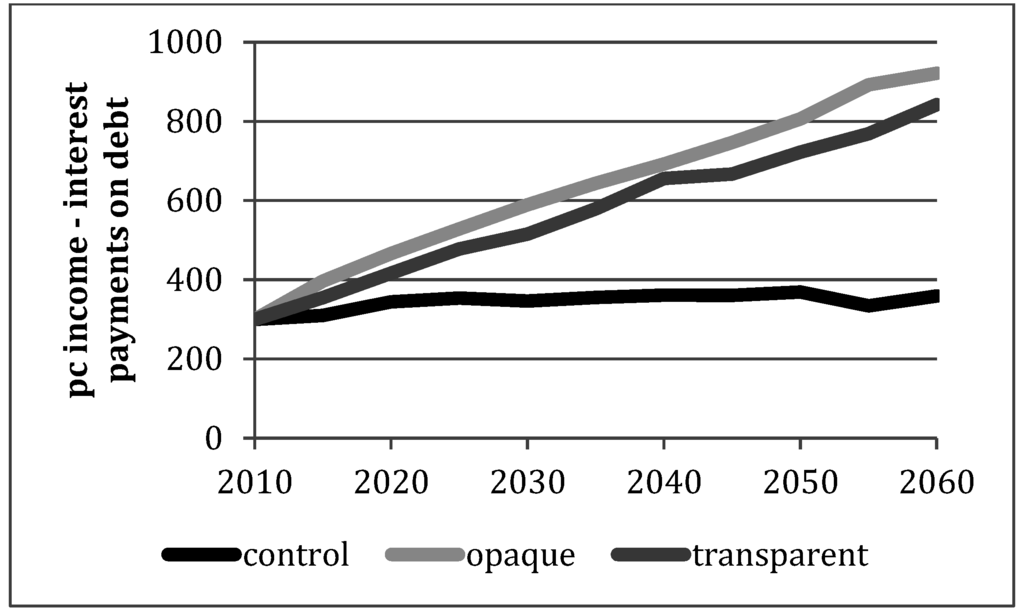
Figure 5.
Median performance in the three conditions.
Figure 5.
Median performance in the three conditions.

When comparing median performance between the three conditions, the difference between the control group, on the one hand, and the two groups receiving the prior exploration strategy, on the other hand, is noticeable. The difference between the opaque and the transparent group, on the other hand, is much smaller. Somewhat surprisingly, performance is lower for the transparent group; that is, the group that is provided with structure-behavior diagrams prior to exploration, as well as the actual decision-making (management) phase.
To see if the differences between the three groups were statistically significant, we compared per capita income adjusted for interest on debt for the three groups using a one-way ANOVA and post hoc Bonferroni adjustment. The resulting p-values are listed in Table 2 and indicate a significant difference in performance both between the control group and the opaque group and the control group and the transparent group. The opaque and transparent group, however, show no significant differences in performance based on the final per capita income adjusted for interest on debt. The differences between the control group and the two groups receiving the prior exploration strategy are consistent with previous research [8,9]. The non-significant difference between the opaque and the transparent group, however, is more surprising.
Table 2.
Summary of test results for performance.
| N | Mean Pc Income-Interest Payments on Debt 2060 | Median Pc Income-Interest Payments on Debt 2060 | P Value Bonferroni | |
|---|---|---|---|---|
| Control group | 83 | −15,985 | 359 | Control-opaque: < 0.05 |
| Opaque group | 79 | −2,216 | 921 | Control-transparent: < 0.05 |
| Transparent group | 85 | −1,265 | 842 | Opaque-transparent: 0.93 |
3.2. Understanding
Figure 6 compares answers to the multiple-choice questions for the three conditions. The figure indicates the percentage of correct answers to each question and the percentage of total correct answers.
Figure 6 shows that a majority of the participants correctly answered questions about the decisions that they needed to make in the national development planning task (question 1). Many participants also answered questions correctly about the mechanisms that lead to an increase in debt (question 5) as well as mechanisms that help decrease debt (question 8). Only a small number of participants were able to correctly rank the length of the delays between investments in roads, health and education and their impact on per capita income (question 7). Interestingly, this question was the only one that showed significant differences between the three experimental conditions. For question 7, the transparent group had a significantly higher percentage of correct answers than the control group (factorial ANOVA and post-hoc Bonferroni adjustment at α = 0.05). Differences between the opaque group and the control group were not significant (p = 0.38) and neither were differences between the opaque and the transparent group (p = 0.65).

Figure 6.
Multiple-choice test: percentage of correct answers: question 1—decisions in the task (1/2); question 2—determinants of tax rate (1/2); question 3—determinants of capital investment (1/2); question 4—mechanisms behind interest rate (3/4); question 5—mechanisms that lead to a decrease in debt (3/4); question 6—determinants of per capita income (1/2); question 7—length of delays (level 3/4); question 8—mechanisms that lead to an increase in debt (3/4).
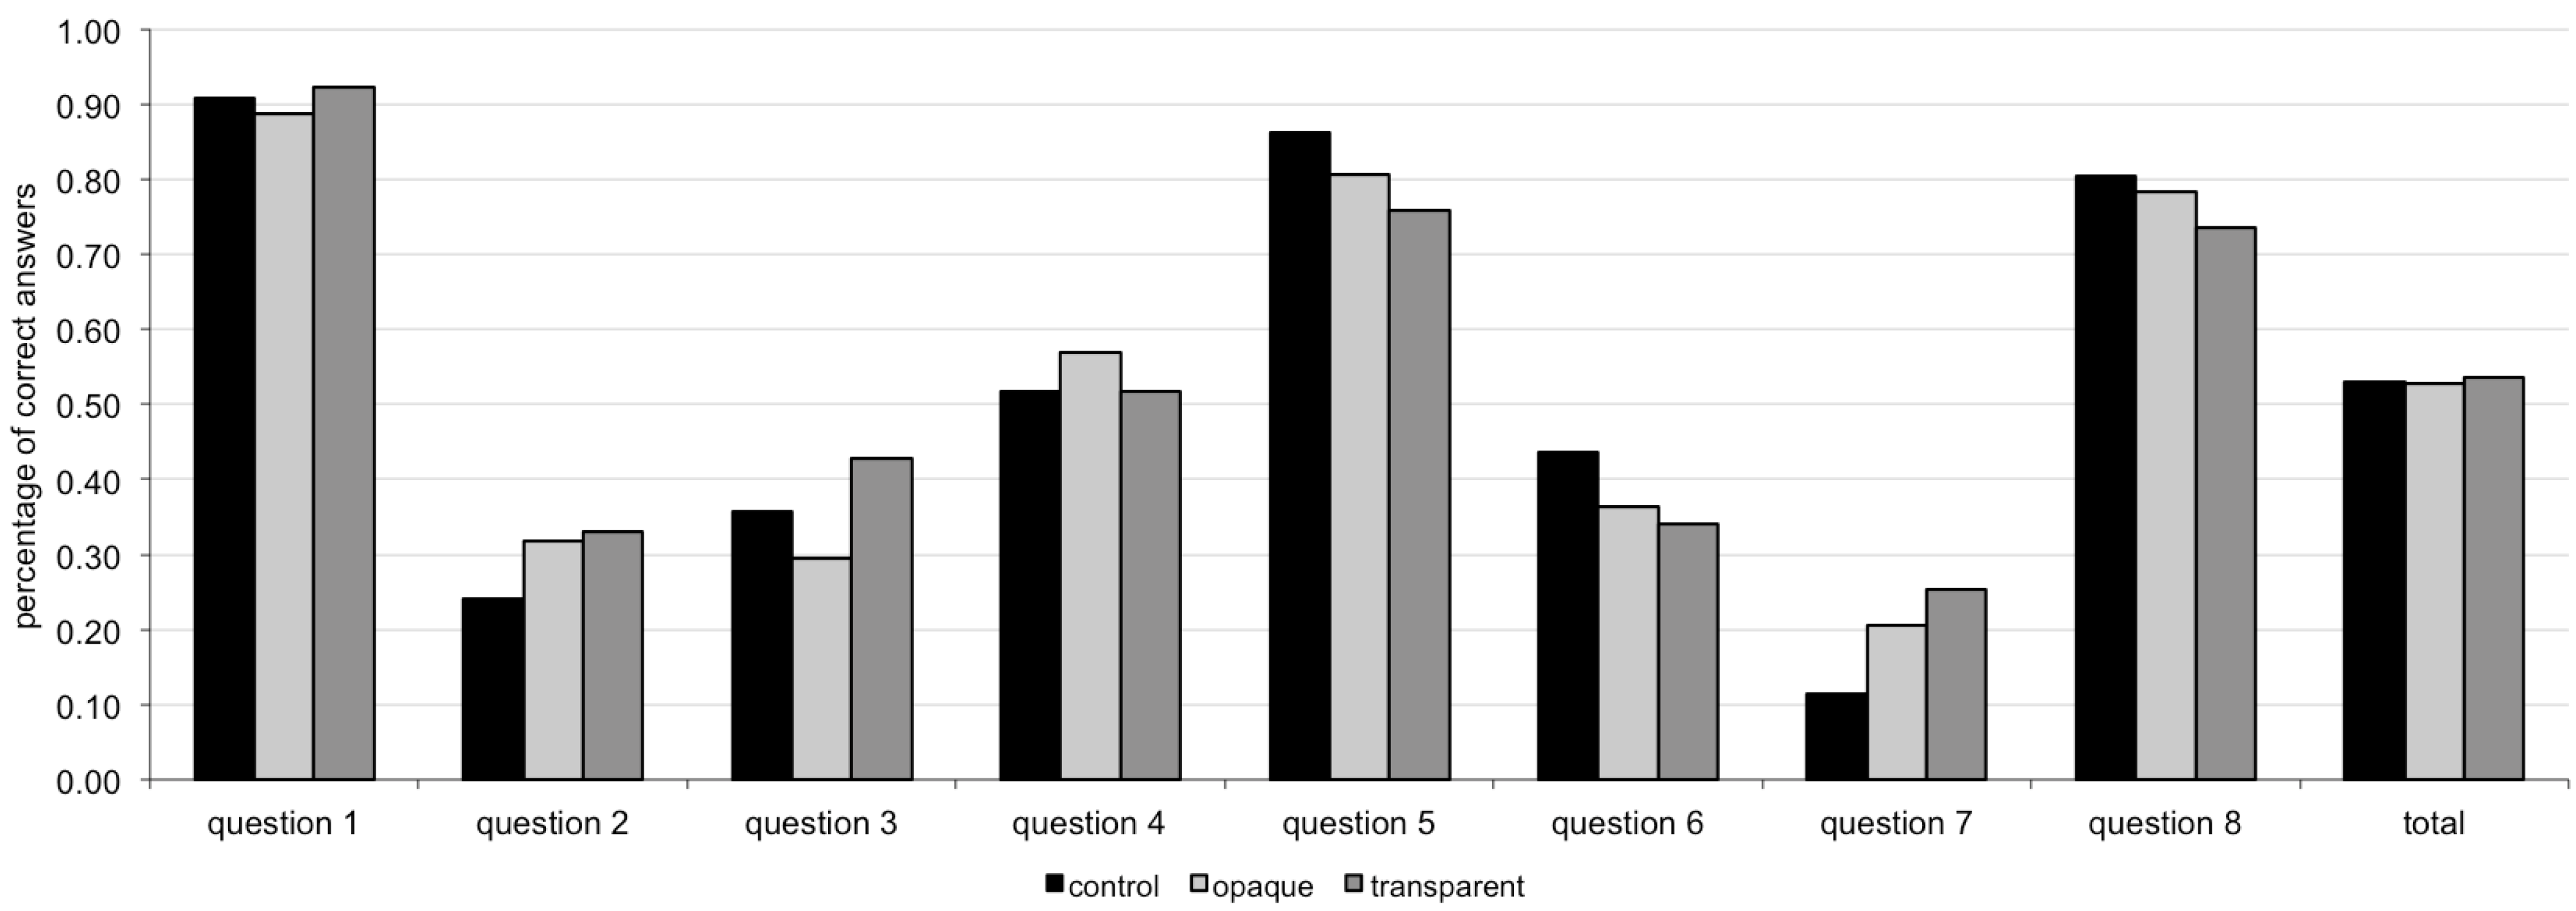
Figure 6 shows the percentage of participants per experimental condition who correclty answered the eight questions in the multiple-choice test. Questions elicit either lower-level system understanding (questions marked 1/2 in Table 1) or higher-level system understanding (questions marked 3/4 in Table 1).
For assessing participants’ understanding in a more sensitive way than the multiple-choice test did, we also coded some of the verbal protocols manually. Manual analysis was performed for 50 protocols per experimental condition. The manual analysis identified the number of described relationships in the verbal protocols and the number of described strategy elements for solving the national development planning task. Figure 7 compares the percentage of participants per experimental condition who described the same relationships and strategy elements as the expert text had done.
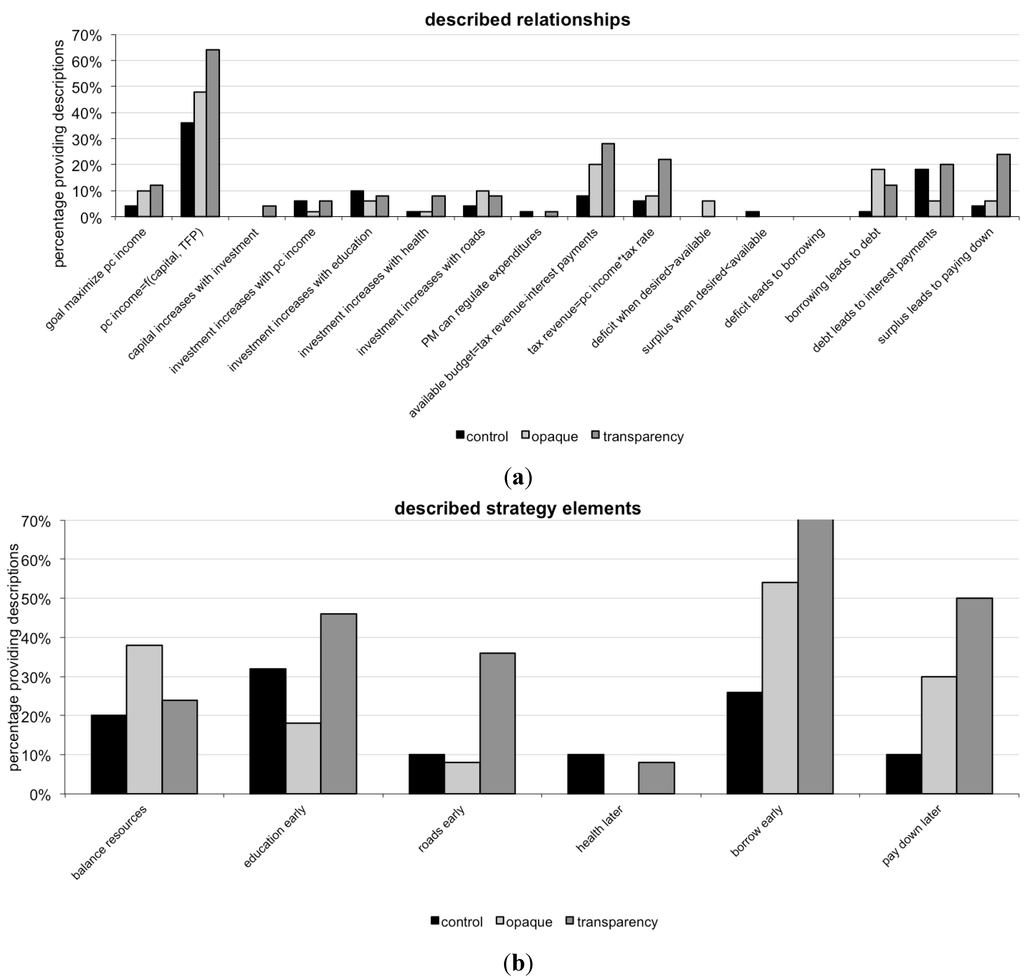
Figure 7.
Open-ended story questions: (a) Percentage of participants describing a relationship; (b) Percentage of participants describing a strategy element.
Figure 7.
Open-ended story questions: (a) Percentage of participants describing a relationship; (b) Percentage of participants describing a strategy element.
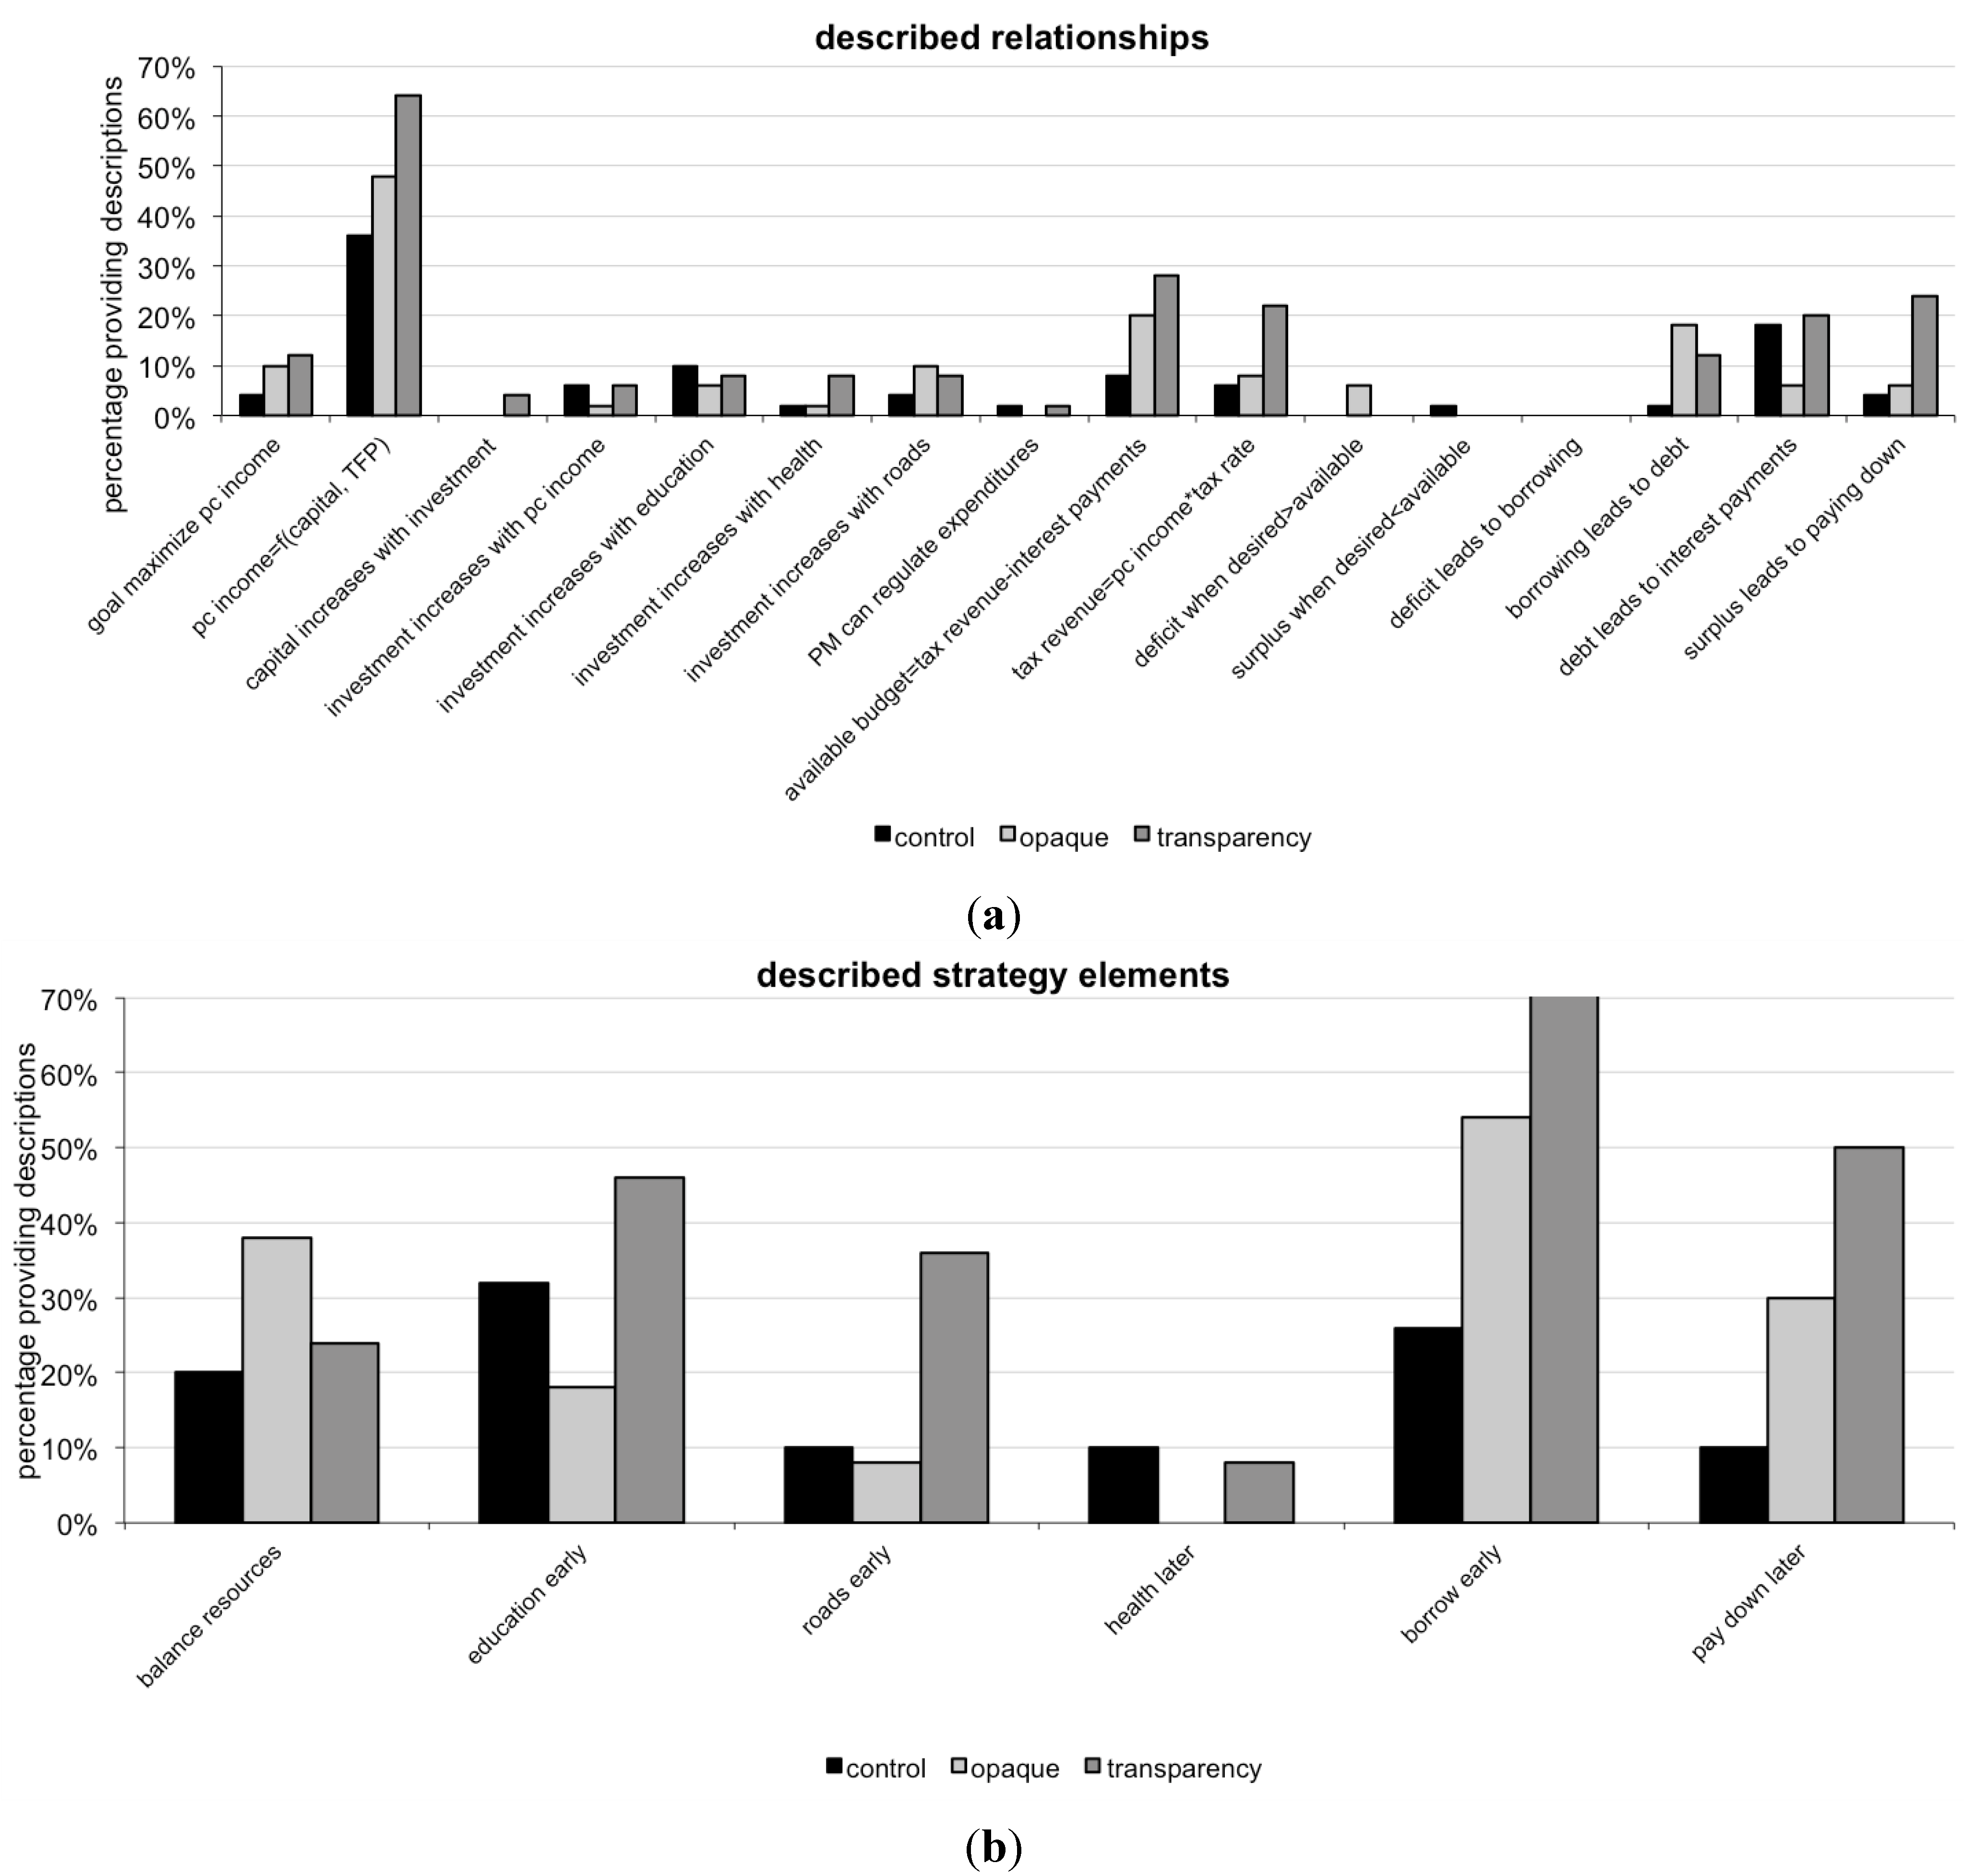
Figure 7 shows the percentage of participants in each experimental condition who described a certain relationship (upper part of the figure) or strategy element (lower part of the figure) in their answers to the open-ended story questions. The description of relationships is a proxy for participants’ understanding of the simulation model underlying the national development planning task. The description of strategy elements is a proxy for participants’ understanding of the behavioral implications of the underlying simulation model; that is, for their understanding of how to solve the national development task.
Figure 7 shows that for the majority of the relationships and almost for all strategy elements, the transparent group provided the highest percentage of descriptions. The differences between the opaque and the control group are less systematic. The figure, thus, shows that there is a tendency for the transparent group to provide more descriptions of the underlying model and the correct strategy for solving the national development task when compared to the control as well as the opaque group.
Statistically, the three experimental conditions compared to each other in the following ways. First, both the opaque and the transparent group described a significantly higher number of relationships than participants in the control group (factorial ANOVA and post hoc Bonferroni adjustment at α = 0.05). This is consistent with previous experiments on the effectiveness of prior exploration. The difference between the opaque and the transparent group, however, was not significant (p = 0.14).
Second, the opaque and transparent groups also described a significantly higher number of strategy elements than participants in the control group. Additionally, participants in the transparent group were able to verbalize more characteristics of a successful strategy for managing the nation than the opaque group.
4. Discussion and Conclusions
4.1. ResearchQuestions
Our first research question was the following: will learners who receive the prior exploration strategy embedded within a more transparent interface show better understanding than learners receiving the prior exploration strategy embedded in an opaque interface?
We employed two measures to address this question. The first, an objective measure, was an eight-item multiple-choice test. Four of the items probed participants’ understanding at the first and second levels of Bloom’s taxonomy of educational objectives [35,36] (remembering and understanding). The other four items probed participants’ understanding at the third and fourth levels of Bloom’s taxonomy (applying and analyzing).
The second, a subjective measure, consisted of two short-essay story questions given immediately before the actual decision making phase. The first story question asked participants to write a note to the prime minister describing the problem facing the nation; that is, explaining the main issues and variables relevant to the nation and how they affect each other. The second story question followed up on the first, asking participants to advise the prime minister by suggesting an investment strategy (for education, health, and roads across a 50-year time span) to maximize per capita income while minimizing national debt.
Both the objective multiple-choice test and the subjective story questions did demonstrate some significant difference, favoring participants receiving the more transparent model interface.
The multiple-choice items were of two types, four at the remembering and understanding levels of Bloom’s taxonomy (levels 1 and 2) and four at the slightly higher applying and analyzing (levels 3 and 4) levels. We also examined how the two conditions differed for the different levels of questions. For some levels 3 and 4 questions the transparent condition showed greater understanding than the opaque condition. Our cautious new hypothesis is that model structure transparency benefits higher levels of learning (applying and analyzing) more than lower levels of learning. This hypothesis is corroborated by our subjective (story problem) questions. Analysis of verbal protocols resulting from the story question not only revealed previously found significant differences in understanding between the control group and groups that received the prior exploration strategy. In addition, the verbal protocols indicated that participants in the transparent group showed significantly better understanding of the necessary strategy for solving the national development task. While questions eliciting understanding of system elements targeted lower-level system elements, those questions eliciting understanding of strategy elements pointed at higher-level system elements.
Our second research question was the following: will learners who receive the prior exploration strategy embedded within a more transparent interface demonstrate better performance in the final simulation-game than learners receiving the prior exploration strategy embedded in an opaque interface, where performance is measured by the final per capita income adjusted for interest on debt in the simulated nation.
Using the criterion of per capita income minus interest on debt in 2060 (the last year of the management simulation), the two conditions did not differ significantly. Consistent with previous studies, performance was significantly better than in the control condition where participants did not receive the prior exploration strategy but performed a reading task instead. Looking at Figure 4, we see that the great majority of participants in prior exploration groups had small to large improvements in per capita income adjusted for interest on debt. A small number of participants did poorly, bankrupting the nation, as represented by lines going down below zero in the graphs.
4.2. Reflections and Outlook
Given some success regarding our first research question but much weaker findings regarding the second research question, our main dilemma is why learners might acquire relevant knowledge yet not perform well within the simulation. Task complexity, including complexity of the simulation tool, might be one explaining factor. However, previous studies with the same task [9] reproduced the same understanding and performance findings for the control and opaque groups as studies using a less complex task [8]. A potentially more powerful explanation is that performance requires transfer of knowledge from one form (answering verbal questions) to another (policy formation and implementation). It is quite common for learners to acquire new knowledge yet not be able to apply it in other situations, especially in the real world. It makes sense that providing learners with the transparent model structure, including showing how that structure relates to model behavior (in the form of the output graphs), would help them understand the model better. In fact, they appear to understand the model not only at the simplest levels of Bloom’s taxonomy (remembering and understanding) but even more so at the slightly higher levels of applying and analyzing. However, applying in a multiple-choice question is not the same as applying when implementing policies and strategies in a management simulation over a period of fifty (simulated) years. No matter what the level of understanding required in a multiple-choice question, the learner still needs only click on a response. To be successful in the management simulation probably requires learners to form hypotheses, test them, evaluate the results, and revise hypotheses, doing all that several times. We know from our previous experiments that the prior exploration strategy does itself impact performance, but simply modifying its interface (providing greater or less transparency) mostly impacts understanding, and impacts performance little, if at all.
Given the overall performance of our participants (some still bankrupted the simulated nation and many just held the nation steady, without improving anything) we are certain that they can still improve a lot. Research on model structure transparency suggests it is sometimes beneficial. However, there are other ways to provide structural transparency besides imbedding behavior graphs in a causal-loop diagram. The structure of a model could be taught with an interactive tutorial, with an audio or video lecture, with animated pedagogical agents, or any number of new multimedia techniques. Our structure-behavior diagrams were passive; that is, learners were not required to cognitively process the information embedded in them. Perhaps a form of structural transparency that requires more active cognitive processing will be more effective.
Then again, perhaps the prior exploration strategy will be augmented more by something other than transparency of model structure. For example, providing assistance (either through a help system or an animated pedagogical agent) on exploring (creating hypotheses, testing them, revising them), giving learners corrective feedback, giving learners assignments that promote reflective thinking, or using collaborating learning activities might have even greater impact than providing structural transparency tools.
Acknowledgments
We are very grateful to Pablo Pirnay-Dummer (Martin Luther University Halle-Wittenberg, Germany) who gave us access to his students. During the research phase for this manuscript, part of the work of one of the authors (BK) was supported by the Swiss National Science Foundation under a Fellowship for Advanced Researchers. During the preparation of the manuscript, one of the authors (BK) received support from the Norwegian Research Council through the project Simulation based tools for linking knowledge with action to improve and maintain food security in Africa (contract number 217931/F10). The views and conclusions expressed in this article are those of the authors alone and do not necessarily reflect the views of the Swiss National Science Foundation or the Norwegian Research Council.
Author Contributions
B.K. and S.A. designed the experiment. B.K. analyzed the data. B.K. and S.A. prepared the manuscript.
Appendices
Appendix A: Instructions
You have just been appointed as the head advisor to the Prime Minister of Blendia. The Prime Minister and you will stay in office for a period of 50 years. You are thus in charge of the long term development of Blendia.
Blendia is an island located off the western coast of Africa. It is currently one of the poorest countries in the world with a per capita income of $300 per year. Your task is to bring the country onto a sustainable economic growth path and achieve and maintain the highest possible per capita income.
Per capita income results directly from production and sale of goods and services. For simplicity, assume that per capita GDP (per capita production) is equal to per capita income. Production is driven by the available physical capital (machinery and its technology level), by human capital (the amount of workers, and their education and health), and by the level of infrastructure (including roads). The government cannot invest in physical capital directly, but it can invest in improving the general level of education, health, and infrastructure. By investing in such resources, the general investment environment improves. Investors in capital will invest the potentially available money (a share of per capita income) more when the labor force is more productive and roads provide access to input and output markets for the goods produced.
Specifically, the Prime Minister can invest in the following three resources:
- Education
Education is the stock of knowledge, skills, techniques, and capabilities embodied in labor acquired through education and training. These qualities are important for the labor force to understand and perform tasks, to properly use the available physical capital, and to efficiently organize the production process. Maximum or optimal education would mean an average adult literacy rate of 100%, which is the maximum or optimal value for Human Development Index (HDI) calculations. The HDI is a United Nations composite index that includes measures of education, health, and income. It allows comparison across countries of their level of human development.
- Health
Health defines the strength of the labor force and thus its capability to properly use the available physical capital and to efficiently organize the production process. Maximum or optimal health would mean an average life expectancy of 85 years (which is the maximum or optimal value for Human Development Index calculations).
- Roads
Efficient and extended infrastructure allows faster and cheaper access to the market, broader access to information, and reliable access to the inputs required for production. Maximum or optimal roads would mean a value of kilometers of roads per person equal to those in the year 2005 in the United States.
Budget issues
The budget for education, health and roads expenditures (also called "development expenditure") can be calculated as follows:
- + Revenue: Through taxation (30% flat tax rate) the government generates revenue from per capita income.
- + Borrowing: The government can borrow money from foreign sources (e.g., the International Monetary Fund). If the government borrows money, it starts accumulating debt.
- − Interest payments on debt: Each year the government will have to pay interest on its debt. The interest rate depends on the level of debt. A common measure for the amount of debt is the debt over GDP ratio. The interest rate is 1% for a very low debt over GDP ratio and can rise up to 15% for a very high debt over GDP ratio.
Note that Revenue and Borrowing add funds (the plus signs) available for expenditures, while Interest payments on the debt subtract funds (the minus signs) available for expenditures.
Decisions
Every five years, as part of a national development planning effort, the Prime Minister will decide on the expenditures for education, health and roads. The Prime Minister can do three things, and has the absolute power to decide which to do (see also Table A1):
- Distribute the total available Per Capita Revenue among education, health and roads without creating either a deficit or a surplus.
- Distribute more than the total available Per Capita Revenue. In this case the Prime Minister creates a deficit and borrows money.
- Distribute less than the total available Per Capita Revenue. In this case the Prime Minister will have a surplus and be able to service (pay down) debt or lend money.
Table A1.
Budget decisions mechanism with initial values.
| Total Available per Capita Revenue | $90 per Person |
|---|---|
| Education Expenditure | $30 per person |
| Health Expenditure | $30 per person |
| Transportation Expenditure | $30 per person |
| Surplus (+) / Deficit (−) | $0 per person |
Evaluation
The performance of the Prime Minister will be evaluated based on a composite income indicator. The indicator is calculated as:
- + Per capita income: You should try to achieve and maintain the highest possible per capita income. The country’s official goal is to reach a value of $600 per capita or more in 50 years.
- − Interest payments on debt: Per capita income can only be maintained if the country has not accumulated excessive debt.
In summary, the interest payments on debt will be deducted from per capita income.
Appendix B: Enforced Reflection Questions
What happened to per capita income and the other indicators when you changed the budget for education?
Why do you think this happened?
Please write your key observations below.
Appendix C: Open-Ended Story Questions
Part 1
As the Prime Minister’s main advisor, you must clearly understand the situation in Blendia and steps necessary to achieve and maintain the highest possible per capita income. The Prime Minister will be traveling to an important United Nations conference where heads of sub-Saharan African nations will meet to discuss strategies for breaking out of the poverty trap. The country with the best strategy will receive the most favorable loan conditions from the International Monetary Fund.
On this and the next page you will prepare a concept note for the Prime Minister, explaining in detail why Blendia has such a low per capita income and what the Prime Minister must do to change this, i.e., how much money the Prime Minister must spend on education, health and roads every five years throughout the next 50 years. Bear in mind that the Prime Minister is a politician who does not have much time to think about the causes of poverty and why your strategies would succeed. You must explain yourself very clearly and include as much relevant information as possible.
In the spaces below, describe Blendia’s problem situation to the Prime Minister. Try to identify the key issues or variables relevant to the problem and explain the relationship between them. Please give the Prime Minister your six most important ideas in enough detail that the Minister will clearly understand what you are saying.
Part 2
Now, in the space below, explain for the Prime Minister your insights and suggestions about increasing per capita income in Blendia while maintaining low interest payments on debt. How much money should the Minster spend on education, health and roads over the next 50 years? Be as specific as possible and explain the reasons for each step in your strategy. This is important because the Prime Minister must be able to give a very convincing rationale to other Ministers at the conference.
Appendix D: Multiple-Choice Test
Correct answers are highlighted.
1. The Prime Minister of Blendia can influence the following aspects directly:
- Expenditures for education, health, and roads.
- Level of debt, capital investment, and tax rate.
- Expenditures for roads, tax rate, and capital investment.
- Expenditures for education, health, and level of debt.
- Interest rate (on debt), tax rate, and capital investment.
- Expenditures for roads, level of debt, and interest rate (on debt).
2. In the country of Blendia the tax rate
- is fixed.
- depends on the level of debt.
- is per capita income minus total expenditures.
- is tax revenue plus borrowing.
- is per capita income minus debt.
- depends on the total expenditures for education, health, and roads.
3. In the country of Blendia, capital investment depends on:
- The total government development expenditure.
- The government’s expenditures on education, health and roads.
- The levels of education, health and roads.
- The tax revenue minus interest payments on debt.
- The tax rate minus the interest rate.
- The level of education and the tax revenue minus the interest payments on debt.
4. What determines the interest rate in Blendia?
- The amount of debt and the GDP (per capita income).
- GDP (per capita income) and the negotiation power of Blendia towards the lender country.
- How much Blendia is borrowing in the current year.
- How much Blendia borrowed the preceding year.
- The credibility that Blendia has due to its current amount of debt.
- The credibility that Blendia has due to its current amount of debt balanced by what it usually pays down.
5. How can you pay down (service) debt in Blendia?
- By borrowing more money from foreign sources.
- By spending less than the total revenue.
- By spending more than the total revenue.
- By negotiating debt relief.
- By raising taxes for a short period of time.
- By raising taxes for a long period of time.
6. In Blendia, economic development is measured by per capita income. Per capita income in Blendia is the:
- value of production per person and production is determined by the amount of physical capital minus interest payments on debt.
- sum of the government’s expenditures on education, health and roads per person.
- sum of the government’s expenditures on education, health and roads per person minus interest payments on debt.
- value of production per person and production is determined by the amount of physical capital, human capital and roads.
- sum of tax revenue and borrowing minus interest payments on debt.
- tax revenue minus the sum of the government’s expenditures on education, health and roads per person.
7. In the country of Blendia, which of the investments has or will have the most immediate effect on per capita income? Rank the resources, listing the resource with the most immediate effect first.
- Roads, education, health.
- Roads, health, education.
- All have their effect at the same time.
- Education, health, roads.
- Education, roads, health.
- Health, education, roads.
8. High levels of debt in Blendia are a consequence of:
- Changing modalities in loan contracts.
- Spending more than earning through tax revenue.
- Mismanagement and corruption by government officials in Blendia.
- The geographic disadvantages of Blendia.
- The lack of natural resources in Blendia.
- Budged shortages with donor agencies.
Appendix E: Demographic Questionnaire
How interested are you in national development issues?
- Extremely
- Quite
- Some
- Not particularly
- Not at all
Have you ever taken classes in national development studies or in national development economics?
- Yes
- No
Have you ever used simulation and modeling to study or manage national development issues?
- Yes
- No
What is your age?
- Below 18 years
- 18 to 21 years
- 22 to 30 years
- Above 30 years
How would you rate your knowledge of national development issues?
- Very good
- Good
- Average
- Poor
- Very poor
Do you have any practical experience in national development work?
- Yes
- No
What is your highest educational degree?
- Secondary School
- B.A.
- M.A.
- Ph.D.
What is your gender?
- Female
- Male
Conflicts of Interest
The authors declare no conflict of interest.
References
- Brehmer, B. Dynamic decision making: Human control of complex systems. Acta Psychol. 1992, 81, 211–241. [Google Scholar] [CrossRef]
- Funke, J. Solving complex problems: Exploration and control of complex systems. In Complex Problem Solving: Principles and Mechanisms; Sternberg, R., Frensch, P., Eds.; Lawrence Erlbaum: Hillsdale, NJ, USA, 1991; pp. 185–222. [Google Scholar]
- Jensen, E. Learning and transfer from a simple dynamic system. Scand. J. Psychol. 2005, 46, 119–131. [Google Scholar] [CrossRef] [PubMed]
- Moxnes, E. Misperceptions of basic dynamics: The case of renewable resource management. Syst. Dyn. Rev. 2004, 20, 139–162. [Google Scholar] [CrossRef]
- Moxnes, E.; Saysel, A.K. Misperceptions of global climate change: Information policies. Clim. Change 2009, 93, 15–37. [Google Scholar] [CrossRef]
- Rouwette, E.A.J.A.; Größler, A.; Vennix, J.A.M. Exploring influencing factors on rationality: A literature review of dynamic decision-making studies in system dynamics. Syst. Res. Behav. Sci. 2004, 21, 351–370. [Google Scholar] [CrossRef]
- Sterman, J.D. Misperceptions of feedback in dynamic decision making. Organ. Behav. Hum. Decis. Process. 1989, 43, 301–335. [Google Scholar] [CrossRef]
- Kopainsky, B.; Sawicka, A. Simulator-supported descriptions of complex dynamic problems: Experimental results on task performance and system understanding. Syst. Dyn. Rev. 2011, 27, 142–172. [Google Scholar] [CrossRef]
- Kopainsky, B.; Alessi, S.M.; Pedercini, M.; Davidsen, P.I. The effect of prior exploration as a learning strategy in system dynamics learning environments. Simul. Gaming 2014, 22, 112–127. [Google Scholar]
- Benedetti, L.; Bixio, D.; Claeys, F.; Vanrolleghem, P.A. Tools to support a model-based methodology for emission/immission and benefit/cost/risk analysis of wastewater systems that considers uncertainty. Environ. Model. Softw. 2008, 23, 1082–1091. [Google Scholar] [CrossRef]
- Crout, N.; Kokkonen, T.; Jakeman, A.J.; Norton, J.P.; Newham, L.T.H.; Anderson, R.; Assaf, H.; Croke, B.F.W.; Gaber, N.; Gibbons, J.; et al. Chapter two good modelling practice. Dev. Integr. Environ. Assess. 2008, 3, 15–31. [Google Scholar]
- Fleischmann, K.R.; Wallace, W.A. Ensuring transparency in computational modeling. Commun. ACM 2009, 52, 131–134. [Google Scholar] [CrossRef]
- Gore, B.F.; Hooey, B.L.; Foyle, D.C.; Scott-Nash, S. Meeting the challenge of cognitive human performance model interpretability through transparency. In Proceedings of the 2nd International Conference on Applied Human Factors and Ergonomics, Las Vegas, NV, USA, 14–17 July 2008.
- Topping, C.J.; Høye, T.T.; Olesen, C.R. Opening the black box—developing, testing and documentation of a mechanistically rich agent-based model. Ecol. Model. 2010, 221, 245–255. [Google Scholar] [CrossRef]
- Machuca, J.A.D.; Ruiz del Castillo, J.C.; Domingo, M.A.; González Zamora, M.D.M. Our ten years of work on transparent box business simulation. In Proceedings of the 16th International Conference of the System Dynamics Society, Québec, QC, Canada, 20–23 July 1998.
- Machuca, J.A.D. Transparent-box business simulators: An aid to manage the complexity of organizations. Simul. Gaming 2000, 31, 230–239. [Google Scholar] [CrossRef]
- González Zamora, M.D.M.; Machuca, J.A.D.; Ruiz del Castillo, J.C. SITMECOM 1.0 PC: A transparent-box multifunctional simulator of competing companies. Simul. Gaming 2000, 31, 240–256. [Google Scholar] [CrossRef]
- Größler, A. Giving the black box a lid—providing transparency in management simulations. In Proceedings of the 15th International Conference of the System Dynamics Society, Istanbul, Turkey, 19–22 August 1997.
- Größler, A. Structural transparency as an element of business simulators. In Proceedings of the 16th International Conference of the System Dynamics Society, Québec, QC, Canada, 20–23 July 1998.
- Größler, A.; Maier, F.H.; Milling, P.M. Enhancing learning capabilities by providing transparency in business simulators. Simul. Gaming 2000, 31, 257–278. [Google Scholar] [CrossRef]
- Alessi, S.M. Model transparency in educational system dynamics. In Proceedings of 20th International Conference of the System Dynamics Society, Palermo, Italy, 28 July–1 August 2002.
- Cheverst, K.; Byun, H.E.; Fitton, D.; Sas, C.; Kray, C.; Villar, N. Exploring issues of user model transparency and proactive behavior in an office environment control system. User Model. User Adapt. Interact. 2005, 15, 235–273. [Google Scholar] [CrossRef]
- Cramer, H.; Evers, V.; Ramlal, S.; van Someren, M.; Rutledge, L.; Stash, N.; Aroyo, L.; Wielinga, B. The effects of transparency on trust in and acceptance of a content-based art recommender. User Model. User Adapt. Interact. 2008, 18, 455–496. [Google Scholar] [CrossRef]
- Lee, G.A.; Nelles, C.; Billinghurst, M.; Kim, G.J. Immersive authoring of tangible augmented reality applications. In Proceedings of International Symposium on Mixed and Augmented Reality (ISMAR), Washington, DC, USA, 2–5 November 2004; pp. 172–181.
- Viste, M. Visualization of Complex Systems. Ph.D. Thesis, University of Bergen, Bergen, Norway, 2007. [Google Scholar]
- Hsiao, N.; Richardson, G.P. In search of theories of dynamic decision making: A literature review. In Proceedings of 17th International Conference of the System Dynamics Society, Wellington, New Zealand, 20–23 July 1999.
- Ajzen, I. Perceived behavioral control, self-efficacy, locus of control, and the theory of planned behavior. J. Appl. Soc. Psychol. 2002, 32, 665–683. [Google Scholar] [CrossRef]
- Berry, D.C.; Broadbent, D.E. On the relationship between task performance and associated verbalizable knowledge. Q. J. Exp. Psychol. Sect. A 1984, 36, 209–231. [Google Scholar] [CrossRef]
- Maxwell, T.A. Decisions: Cognitive Style, Mental Models and Task Performance. Ph.D. Thesis, State University of New York, Albany, NY, USA, 1995. [Google Scholar]
- Doyle, J.K. The cognitive psychology of systems thinking. Syst. Dyn. Rev. 1997, 13, 253–265. [Google Scholar] [CrossRef]
- Größler, A. Musings about the effectivness and evaluation of business simulators. In Proceedings of 19th International Conference of the System Dynamics Society, Atlanta, GA, USA, 23–27 July 2001.
- Stouten, H.; Heene, A.; Gellynck, X.; Polet, H. Learning from playing with microworlds in policy making: An experimental evaluation in fisheries management. Comput. Hum. Behav. 2012, 28, 757–770. [Google Scholar] [CrossRef]
- Kopainsky, B.; Alessi, S.M.; Pirnay-Dummer, P. Providing structural transparency when exploring a model’s behavior: Effects on performance and knowledge acquisition. In Proceedings of 29th International Conference of the System Dynamics Society, Washington, DC, USA, 24–28 July 2011.
- Kopainsky, B.; Pedercini, M.; Alessi, S.M.; Davidsen, P.I. A blend of planning and learning: Simplifying a simulation model of national development. Simul. Gaming 2010, 41, 641–662. [Google Scholar] [CrossRef]
- Bloom, B.S. Taxonomy of Educational Objectives: Book 1—Cognitive Domain; Longman: New York, NY, USA, 1956. [Google Scholar]
- Anderson, L.W.; Krathwohl, D.R. A Taxonomy for Learning, Teaching, and Assessing: A Revision of Bloom’s Taxonomy of Educational Objectives; Allyn & Bacon: Boston, MA, USA, 2001. [Google Scholar]
- Kopainsky, B.; Alessi, S.M. Measuring knowledge acquisition in dynamic decision making tasks. In Proceedings of 29th International Conference of the System Dynamics Society, Washington, DC, USA, 24–28 July 2011.
© 2015 by the authors; licensee MDPI, Basel, Switzerland. This article is an open access article distributed under the terms and conditions of the Creative Commons Attribution license (http://creativecommons.org/licenses/by/4.0/).