Abstract
Recent advances in computing allows researchers to propose the automation of hydroponic systems to boost efficiency and reduce manpower demands, hence increasing agricultural produce and profit. A completely automated hydroponic system should be equipped with tools capable of detecting plant diseases in real-time. Despite the availability of deep-learning-based plant disease detection models, the existing models are not designed for an embedded system environment, and the models cannot realistically be deployed on resource-constrained IoT devices such as raspberry pi or a smartphone. Some of the drawbacks of the existing models are the following: high computational resource requirements, high power consumption, dissipates energy rapidly, and occupies large storage space due to large complex structure. Therefore, in this paper, we proposed a low-power deep learning model for plant disease detection using knowledge distillation techniques. The proposed low-power model has a simple network structure of a shallow neural network. The parameters of the model were also reduced by more than 90%. This reduces its computational requirements as well as its power consumption. The proposed low-power model has a maximum power consumption of 6.22 w, which is significantly lower compared to the existing models, and achieved a detection accuracy of 99.4%.
1. Introduction
Hydroponics is a technique of crop cultivation without using soil [1,2]. Although the term hydroponic might sound new, the concept was long practiced by Ancient Egyptians: They used similar concepts to grow crop in roof tops and walls [3]. These new portable systems of farming have many benefits such as (1) a small amount land is needed; (2) faster plant growth; (3) it is less prone to diseases; (4) it is portable, as soil is not needed; (5) seasonal changes do not affect plant growth; and (6) little or no pesticides and herbicides are needed [4,5].
Some works on Computer-Aided Diagnosis (CAD) of plants have been conducted using techniques such as expert systems and rule-based models [6,7], which are confined to the knowledge of the expert and hence have the potential for mistakes in result interpretations. Artificial Neural Networks (ANNs) were investigated in this domain to improve the diagnostic process, such as the system found in a IoT-based deep learning system for plant disease detection [8].
Deep-learning-based plant disease detection models leverage computer vision capability and come up with a model that can diagnose plant diseases by scanning plant leaves. The system is capable of diagnosing a given sample by simply taking the leaf image as input and returning the class of the disease that is affecting the plant on screen to ascertain whether the plant is healthy or not, alongside the name of the diseases that are affecting the plant.
However, the context within which the model will be deployed was not considered. The model has a lot of parameters, which results in numerous memory accesses and huge computations making the model resources expensive. The model also uses transfer learning and was controlled by a user via the Internet. From the experimental results, the power consumption of the model increases significantly when Wi-Fi connectivity is turned on. This brings about rapid power dissipation when tested. To overcome these problems, in this paper, an energy-aware intelligent model is proposed where knowledge distillation replaces the transfer learning available in the previous model, making the proposed model, a small compressed version of the previous model that will function completely offline and has low resources requirement.
There have been several kinds of research on how to reduce the energy consumption of neural network models. Some of the reported breakthroughs are to perform hardware acceleration, energy management designs, or model compression. Another way of mitigating this energy crisis is to overcome energy shortages in an embedded computing environment with energy harvesting.
In this paper, we concentrated on improving our previous work published in MCsoC 2021 [8], by reducing the power consumption of the plant disease detection model from a software perspective. Therefore, energy harvesting and model compression techniques were employed to propose a low-power deep learning model of plant disease detection in smart hydroponics.
The rest of the paper is organized as follows: Section 2 presents some background knowledge about Artificial Neural Network and IoT-based hydroponic systems. Section 3 presents previous works that have been found in the literature review. Section 4 presents the proposed system architecture and its components. Section 5 presents the results and discussion from the experiments. Section 6 concludes the paper and presents the future direction.
2. Background
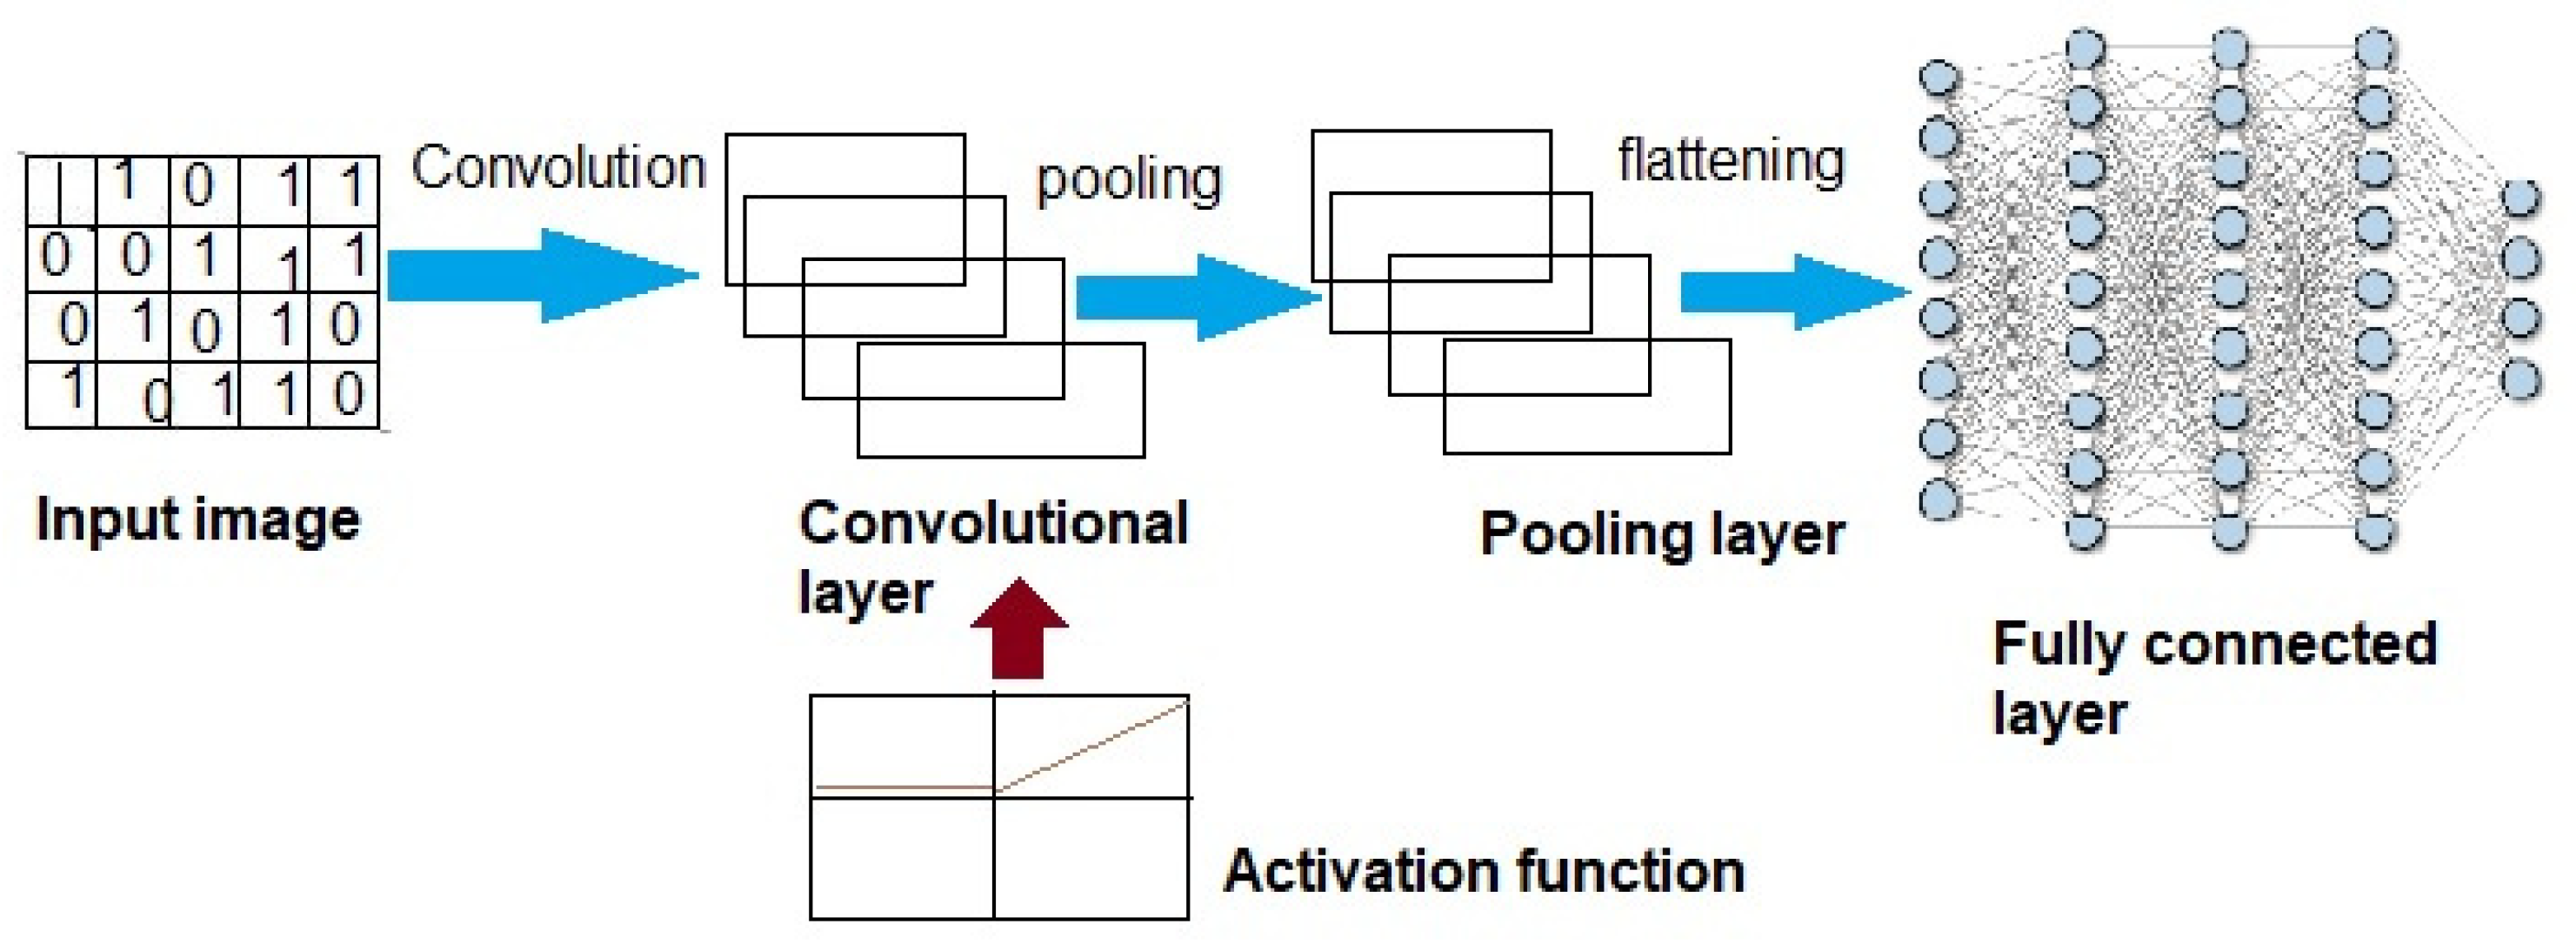
An Artificial Neural Network (ANN) is an Artificial Intelligent (AI) paradigm where problem-solving behaviors of biological nerve cells known as neurons are simulated [9,10]. A Convolutional Neural Network (CNN) is an ANN that has more than one layer and trains its models by adjusting its weights using optimization methods such as gradient descent algorithms [11]. The first layer in the CNN is the “convolution layer”, which uses the operation of convolution to search for patterns. Neurons in this network are used to perform the convolution operations, i.e., filtering images to look for patterns. The neurons in each given filter share the same weight and bias thus giving them the ability to search for the same pattern in different parts of the image. The second layer is the “rectified linear unit layer”, which focuses on building up the patterns discovered by the convolution layer. The third layer in the CNN is the “pooling layer”. This layer reduces the number of patterns allowing the neural network to focus only on important patterns. The final layer is called the fully “Connected layer”, which makes the CNN able to classify data into appropriate labels. Figure 1, highlight the arrangement of layers in CNN. The accuracy of the CNN classifier is largely dependent on the size of the dataset it trains on, as it usually requires a very large set of training data [12,13].
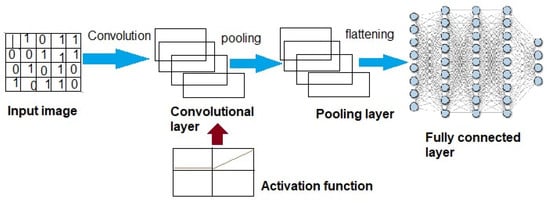
Figure 1.
Convolutional neural network adopted from superdatascience.
2.1. Internet of Things (IoT)
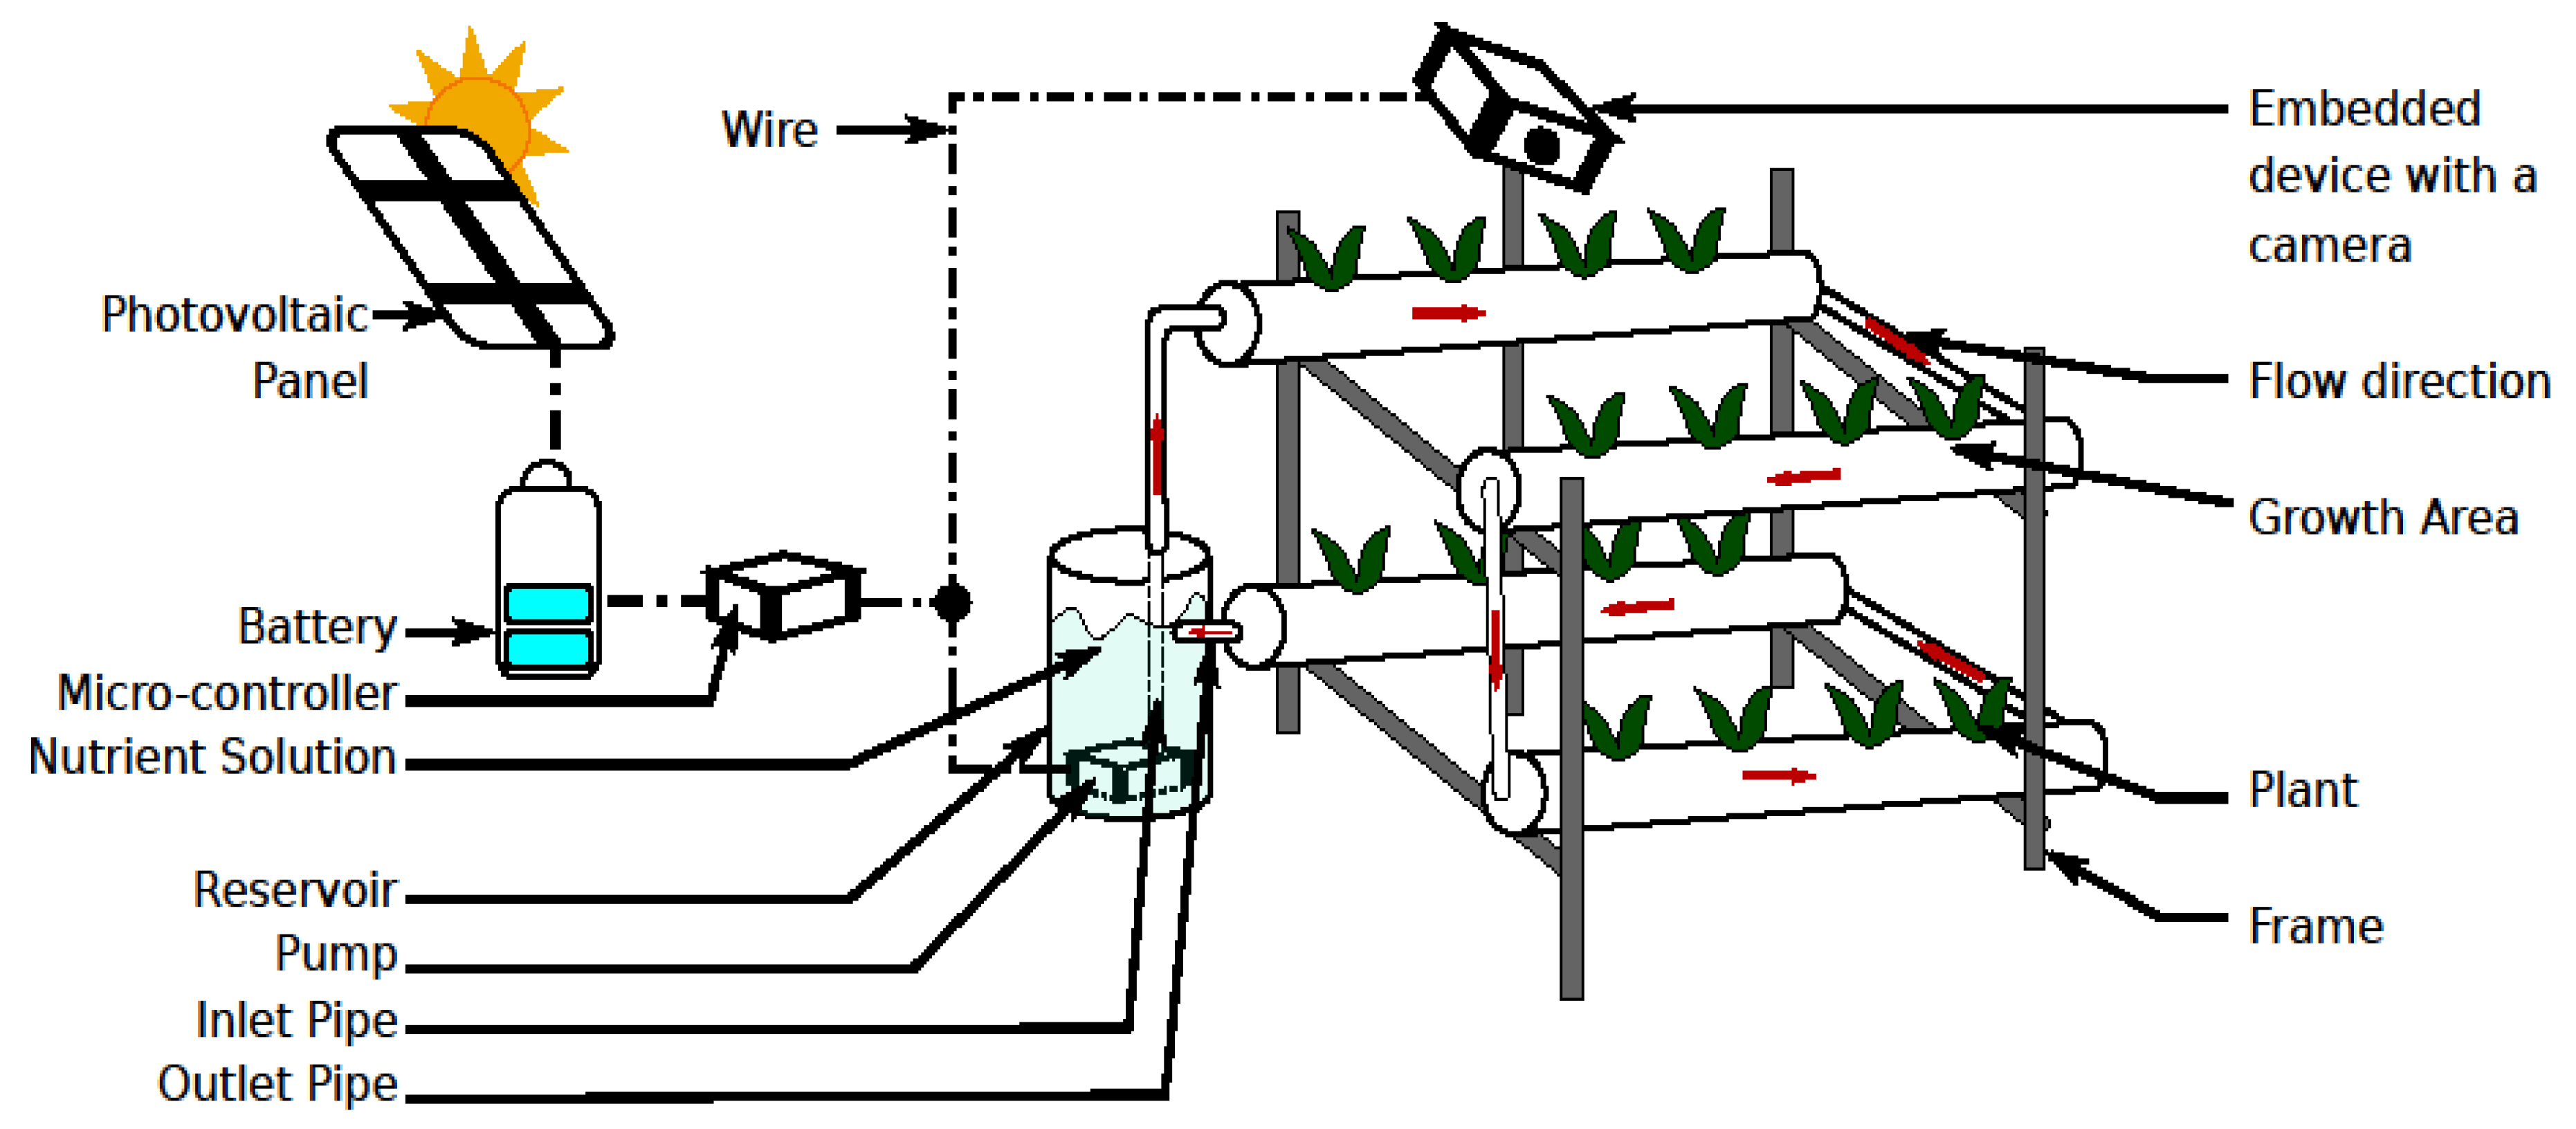
Internet of things (IoT) is a branch of distributed systems that tends to allow devices to communicate automatically with minimal or no human intervention, as shown in Figure 2, and the IoT is a system of interrelated computing devices, sensors, and CPUs that are provided with unique identifiers (UIDs) and the ability to transfer data over a network without requiring human-to-human or human-to-computer interactions [8]. An IoT-based hydroponics system is designed to monitor and/or control a hydroponic system with the help of a server. The system communicates with the server through Ethernet, Wi-Fi, GPRS, or satellite radio communication.
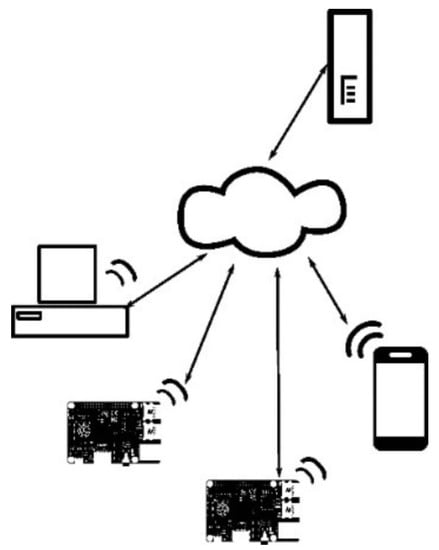
Figure 2.
Typical IoT system.
As shown in Figure 2, IoT systems heavily utilized embedded devices, while ubiquitous devices are at the core of this system. Embedded devices are battery-powered devices categorized by resource constraints, and they suffer from inadequate space, speed, and small battery life because of their size. When these devices are employed in a system. A careful design has to be made to supplement these deficiencies. In this paper, we design an energy-aware model using an energy harvesting technique to handle the power requirement of the system, whereas the space constraint was neutralized by compressing our model into smaller one using knowledge distillation.
2.2. Energy Harvesting
Energy harvesting techniques are different sets of processes of converting the ambient energy present in the environment into electrical energy to be used in powering wireless sensors or embedded devices [14]. These technologies often supplement batteries in situations where their integration is feasible. Energy harvesting become popular in wireless sensor technology and autonomous devices due to the nature of the environment these devices operate in. For example, devices that are deployed in drones, underwater, and so on, cannot have access to any physical power source; as such, harvesting energy from the environment becomes necessary. This technique provides energy ranging from microwatts to megawatts. When selecting energy-harvesting techniques, factors such as the nature of the environment, the source of available energy nearby, and the energy consumption of the devices have to be put into consideration before a particular method is selected.
According to Kanoun et al. [15], energy-harvesting techniques according to the source of energy can be classified into seven (7) categories, namely, solar energy, wind energy, vibration energy, thermal energy, ocean wave energy, acoustic noise energy, and radiofrequency energy. However, in this paper, we only discussed the four most popularly used methods:
- Solar Source: This is one of the most common and easiest methodologies of harvesting energy from sunlight and converting it into electric energy. The major component here are photovoltaics, which can be arranged in different forms, depending on the design. These photovoltaics are solely responsible for collecting the energy from sunlight and converting it into electric energy. The solar energy harvester can be used with batteries or directly to the equipment it needs to power, with the help of inverters which regulate the power into an appropriate type, suitable for the available devices [16].
- Wind Source: The wind available in our surroundings can also be tapped and produced energy from it using electromechanical conversion methods. The system works with turbines popularly known as turbine generators which are mechanical devices that are installed in the direction of the wind. These turbines have a rotor and spines, which rotate with the power of wind speed. The movement generates mechanical energy, which can be collected and converted into electrical energy [17]. The wind turbine generator converts mechanical energy to electrical energy. The generator has to work with a power source (the wind turbine rotor), which supplies fluctuating mechanical power (torque). Inverters have to be integrated into the wind energy harvester system to convert electricity generated by the system into compatible power needed by the devices.
- Vibration Source: Energy harvesting from a vibrating source is the art of converting vibrational energy to electrical energy. The technique works with different types of converters and technologies such as electromagnetic, electrostatic, piezoelectric, and triboelectric, as listed by [18]. Many vibration sources exist, such as ocean movement or the motion of people, which can be utilized and harvested for an effective energy source. The majority of the techniques used electromechanical converters, while others used piezoelectric generators which convert mechanical energy generated from the vibration source into electricity.
- Thermal Source: Thermal energy harvesting is another method of cultivating energy from the environment by capturing free heat and converting it to electric energy using special technologies such as thermoelectrics or pyroelectrics. This heat exists in two forms, either naturally occurring heat, for example, heat from volcanoes refuse dumps, or artificially generated heat, usually as waste from industries [19].
With the above-mentioned methods for harvesting energy from ambient sources, the question is, which method is simpler to achieve and which one suits our deployment environment? Solar is the most obviously available cheap method; it is also easy to integrate and deploy due to its simplicity and the availability of the components. Wind energy harvesting is the second simplest method. The efficiency of this method largely depends on wind-speed, which is proportional to the resulting rotational speed of the turbine; this limits its potential of being deployed in certain environments. Solar inverters use an algorithm to maximize harvested power, whereas wind inverters must have a maximum power characteristic curve, unique to each wind turbine model. In essence, this means that the ability of a wind harvester to harvest energy in conditions where wind-speed is low arise from wind inverters with low threshold.
Vibration and thermal energy are not commonly found techniques, but they are viable options, and even better options when it comes to renewable energy. They are expensive and difficult to fabricate as they contain complexities not found in other methods. This limits their potential in many situations. Table 1 summarizes the energy-harvesting techniques as well as the strengths and weaknesses of the discussed methods.

Table 1.
Energy Harvesting Techniques.
Looking at the nature of the proposed model, and the environment within which the model is to be deployed, that is, smart hydroponics available at farms located in remote areas, many of these farms are not connected to the national power grids because of their location. Therefore, an alternative energy source is needed. There are many ambient sources of energy in the environment where the proposed model will operate. Any of the discussed techniques can be integrated with the proposed model to solve the problem of power; therefore, we adopt the solar technique.
2.3. Knowledge Distillation
Knowledge Distillation (KD), as proposed by Hinton et.al. [20], is a type of knowledge transfer that was developed around convolutional neural networks, the idea behind KD is to train a large, complex model using high computational resources and use the learned parameters from the model to teach a small model with fewer computational resources. The process usually utilized two network structures, which are named teacher and student. The teacher is a model with a strong capability, while the student is a simple shallow neural network model which mimics the behavior of the teacher model by transferring significant knowledge from the teacher model [21].
The process of knowledge distillation is well-represented in Figure 3, where two models are defined with different architectures. On the top is teacher model with multiple convolutional layers and hidden layers, whereas the picture of student model with only a convolutional layer and one hidden layer is on the bottom. This indicates that the two models differ physically, and therefore, they have different computational requirements. The student models mimic the behavior of the teacher model by training on the soft level generated by the teacher model, otherwise called the distilled knowledge from the teacher. Unlike transfer learning, this technique does not require the Internet, and it does not require that the student model architecture be the same as the teacher.
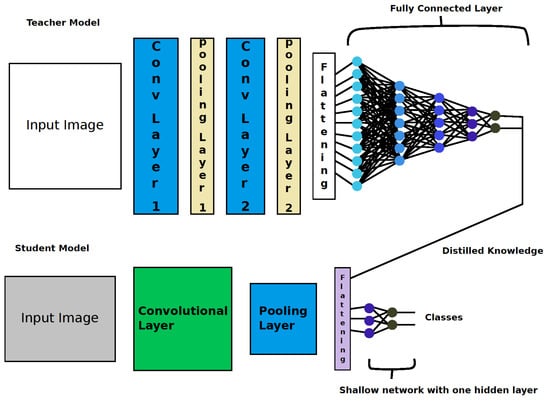
Figure 3.
Structure of knowledge distillation.
3. Related Works
The IoT originates from embedded systems, which is a branch of distributed systems. These systems are made up of small devices such as smartphones and personal computers, characterized by low resources and low computing power, that communicate through the Internet. Data generated from IoT systems are saved and monitored through a server or a broker depending on the design. Research has been carried out on the use of the IoT in hydroponic systems [22,23,24].
In [25], an IoT-based hydroponics system was designed using Arduino and Raspberry. The system is connected via USB and saves experimental data on a Pi card memory. External users and programmers were able to connect to the Pi via the internet and interact with the system. The greenhouse-based hydroponic system′s temperature and humidity were controlled by the system. The system increases the efficiency of crop growth. When compared to traditional methods, the technology has been shown to be substantially faster. The system′s configuration, however, was difficult due to the additional plug-ins and the third-party software needed. In addition, using image processing, the system allows for plant growth tracking. Unfortunately, because it only provides cooling systems to reduce high temperatures, the system was built to favor crop production during the summer months only. Furthermore, neither the pH nor the nutrient solution concentration (EC) levels were tested, so the nutrient combination and pH information acquired from the system will be unreliable.
Gartphol et al. [26] developed lettuce quality prediction models using Internet-of-Things-based hydroponic farms. The authors created a smart hydroponic lettuce farm that uses the Internet of Things to collect environmental data and operate operations in real time. At the conclusion of the experiment, a big dataset was generated, which was utilized to develop regression models using machine learning techniques. Environmental data, such as the amount and intensity of light, humidity, and temperature, as well as weekly measures of plant development, were some of the features used. The Internet of Things enables automated operation that may be accessed from within a home or office. The model did not obtain a good learning result because of inaccuracies such as those discovered in estimating the lettuce’s height due to changes produced by blowing wind, which causes the crop to wobble. Other faults are those caused by the breadth of the stem. A Bayesian Network was proposed and achieved 84.53% accuracy and a 66.67% greater crop yield than a manual technique [27].
T. A. Setyawan [28] built a sophisticated aquaponics system that blends traditional aquaculture with hydroponics. The system employs the IoT to continually monitor and regulate the environment, as well as send real-time feedback to the owner via mobile applications. The aquaponics arrangement was livestreamed via camera monitoring, and photos were gathered to conduct leaf recognition and disease detection. The system automatically creates a report upon illness identification, which is subsequently transmitted to the owner through mobile application at an early stage of disease infection. Any suspected sickness notifications with photographs are sent via email via the mobile application. Two Raspberry Pi 3 (RPi) and an Arduino Uno make up the IoT setup. One of the Raspberry Pis was used to collect data from additional sensors and send it to a real-time database. It was also utilized to read user commands from a real-time database and control the actuators accordingly. Another Raspberry Pi uses OpenCV [29] to identify diseases. With the use of a machine learning classifier, the photos of leaves acquired with the Pi camera are analyzed to identify the leaf and detect any probable illnesses. The sensors′ status was published via a front-end created with the aid of ThingSpeak web view and Firebase. Despite the fact that this system can identify illness from a plant′s leaves, it cannot detect disease from the root. Furthermore, the suggested system employs a large number of IoT devices to run complicated CNN algorithms, resulting in excessive energy consumption and latency.
Rau et al. [30] used MATLAB-based image processing to design a less expensive method of automatic irrigation for recognizing rice illnesses and nutritional deficits. The system was built using a Raspberry Pi, a DHT11 temperature and humidity sensor, and solenoid valves. The farmer can keep an eye on the weather. The user or the Pi camera sends images of the leaves to the Pi for analysis with MATLAB. The scientists constructed a database that calculated attributes including contrast, correlation, mean, standard deviation, and entropy, as well as assigning a name to each ailment. The properties of the selected picture were derived from the clusters after the images were segmented into clusters and a Region of Interest (ROI) was chosen [31]. The illnesses are recognized based on the values of parameters that match the values in the database. The farmer will be fully informed on strategies to save the plant from the disease′s effects via the feedback process. This IoT-based intelligent system with nutrient and disease analysis is smarter and optimized for irrigation, lowering overheads and allowing for more effective water usage, which aids in water conservation. Furthermore, the automatic diagnosis of nutrient insufficiency and disease analysis will allow farmers to boost their yield with less effort.
The performance of CNN in object recognition and image classification has been on the rise, large cumbersome models such as Resnet50, Alexnet are achieving state-of-the-art accuracies at the cost of computation. The accuracy of these models increases as their parameters are increasing exponentially. This performance along with the simplicity of CNN’s paved the way for ML to be applied in many domains where image classification can solve the problem, such as a disease diagnosis from medical imaging [32].
Previous works such as Bay et al. [33] use traditional machine learning algorithms to solve the problem of image classification, the approach was based on hand-engineered feature extraction methods, and then a learning algorithm or a classifier is applied to these extracted features. The process is both tedious and troublesome because when the dataset changes significantly, then the features have to be extracted again. The performance of these traditional methods depends heavily on the predefined features. This problem occurs in almost all the traditional approaches of image classification using computer vision, the features are extracted and manually hand-engineered followed by image enhancement techniques and all sorts of complex and labor-intensive methodologies. However, with the advent of a convolutional neural network, the narrative was changed completely. Hand-engineered feature extraction is thus replaced by automatic features extraction using convolutions.
The earliest work on the use of CNN to detect plant diseases was seen in the work of [34,35,36], who proposed a deep-learning-based plant disease detection model. In their work, the authors demonstrated how CNN can be used to replace the traditional method of plant diseases detection of using hand-engineered features selected. They indicated that that process can be eliminated by convolution operations. The system achieved a remarkable accuracy of 99.7% using transfer learning; specifically, the model used pre-trained models Alexnet and Googlenet for better performance, but the models were known to be computationally expensive as a result of their complex architecture. Nevertheless, neither the computational requirements nor the power consumption of the model was reported.
Similarly, Aminu et al. [8] proposed a deep learning model of plant diseases detection for smart hydroponics. The work differs from the work in this paper in the sense that the model proposed in this paper is based on a shallow neural network, while the latter was a large CNN model. Training such a model is computationally expensive, and from the power analysis of the model when deployed, the energy consumption of the device increases when Wi-Fi is enabled. Therefore, it requires a frequent recharge of the batteries, increasing the overall energy demand of the system. On the other hand, our proposed model is based on knowledge distillation which does not require Internet access at all, and has energy harvesting technology to take care of intermitted battery recharge.
Moreover, Li et al. [37] proposed a multi-exit neural network to overcome the limitation of a deep neural network by filtering out data without objects of interest, thereby avoiding computing the entire neural network. In their paper they implement a multi-exit convolutional neural network on the ESP32-CAM embedded platform as an image-sensing system with an energy harvesting technology to serve as a power source, the system achieved an accuracy of 74% with a reduced power consumption of about 42.5%.
Others such as A. Saddik et al. [38] deviates from using deep learning entirely. As the computational cost is too high, they proposed a low-power system for vegetation monitoring using a system-based monitoring algorithm for agricultural fields. The solution is based on an electronic architecture of a CPU-FPGA SoC system and the OpenCL parallel programming paradigm.
Interestingly, the effort to minimize power consumption of edge devices can be from both hardware and software perspectives. Knowledge distillation reduces the number of parameters in the model, which reduced the number of computations, which in turn reduced the number of memory accesses, thus reducing power consumption. From the hardware point of view, different techniques are available which can be used to reduce the power consumption of the processing unit of an edge device or a sensor node. An example of such techniques is Dynamic Voltage and Frequency Scaling (DVFS).
According to Senadeera et al. [39], DVFS is designed to minimize the power consumption during the execution of tasks by adjusting the operating voltage and frequency dynamically depending on the system performance requirement at a fixed time. It is also possible to investigate the power consumption of the wireless node during different activities. Depending on the design, IoT devices can be designed to have various operating modes, such as standby, battery saver, fully operational, and so on. In each state, the amount of energy consumes differs [40]. For example, in standby, the system reserves the energy without performing any heavy task. Under a power saver, the power has dropped below a certain threshold, and there, some of the system functionalities are turned off automatically to minimize the power consumption. This second aspect can also be regarded as energy management.
Energy management is a way of using the available energy in edge devices carefully to maximize operation time and minimize power consumption, it is a critical part of a system that is powered by energy harvesting technology. An efficient energy management solution enables long-lasting devices and IoT systems. It minimizes the failure rate by preventing frequent system downtime as well as reducing maintenance costs [41].
From the software aspect as well, due to the rise in these edge devices and the popularity of IoT systems, researchers are investigating ways of building and efficient CNN models with good accuracy, as well as low power consumption. The reason behind this shift was that CNN achieves significant breakthroughs in term of image classification at the cost of computation. These models contain millions of parameters and perform hundreds of thousands of operations during training, which is why the models can only be trained on a high-performance computer with GPUs. This limits the possibilities of these models to be deployed on embedded devices. The devices are usually resources constrained, in terms of power, computing resource, and network connectivity.
In line with this, [42] provides an extensive survey on the ways to develop low-power deep learning models suitable for embedded device or IoT environments, among the methods mentioned in the survey are model pruning, model compression, matrix factorization as well knowledge distillation. Despite the availability of these methods, throughout our search in literature, we have not seen a work that employed either one of the above-mentioned techniques to optimize or proposed a new low-power, deep learning-based plant disease detection model for a smart hydroponic system.
4. Methodology
This section describes the methodology employed in this research work. It discusses the entire framework followed by the authors and the algorithm′s designs, and the framework is arranged in a sequence of steps. The steps are data gathering and description, a data preprocessing model definition, building the models, as well as experimental setup for implementing the model.
4.1. Dataset Description
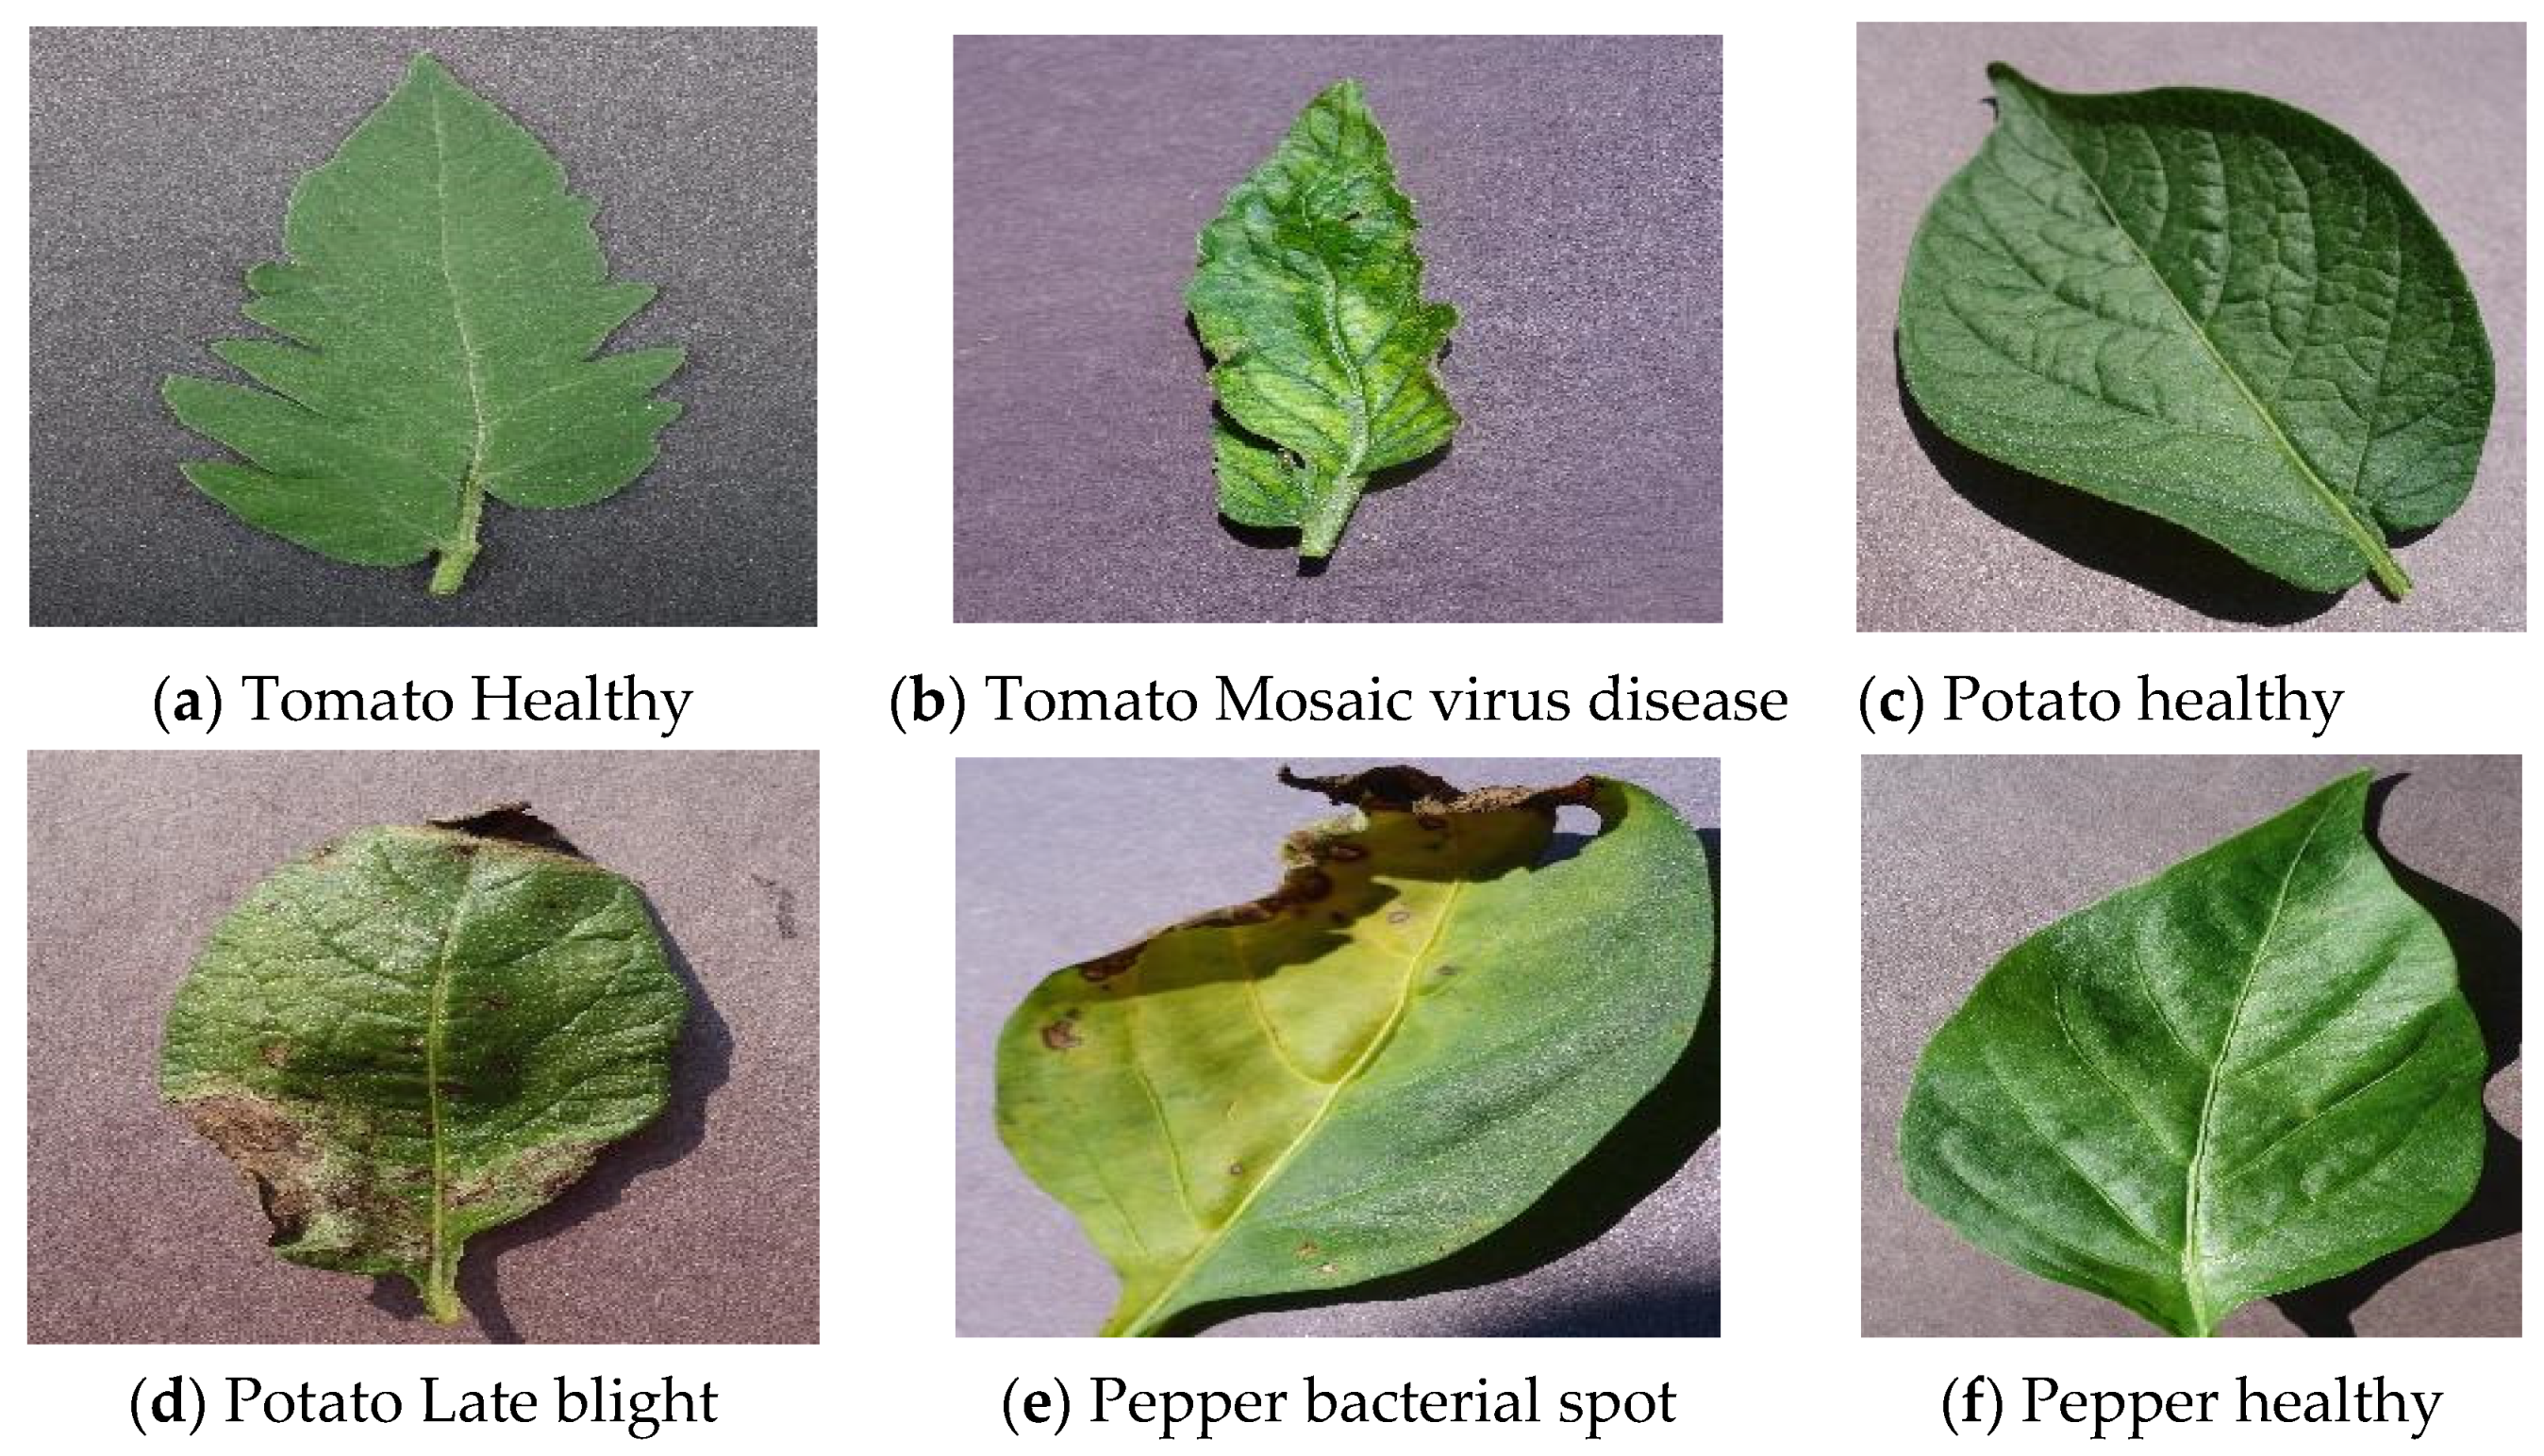
The dataset used in this research consisted of images of plant leaves obtained from PlantVillage [43], a publicly available plant disease database. The dataset contains 54,306 instances of different plant diseases. The dataset was divided into 8 different plant classes, namely: tomato, potato, pepper, soya beans, grape, orange, and apple. The aforementioned plants have at least two classes in the dataset, that is, the healthy plant leaf class and other classes of diseases that affect the plant. Each disease is represented by a particular directory in the dataset, and these directories make up the classes in the dataset. In total, the dataset has 39 different classes ranging from healthy plants to various diseases available in the dataset. The images below show a sample of the images from the dataset.
Figure 4 shows the sample images from the dataset, where some of the classes were selected, such as healthy classes and some disease classes. The images were all resized to 256 by 256 pixels. All the experiments were carried out on these images.
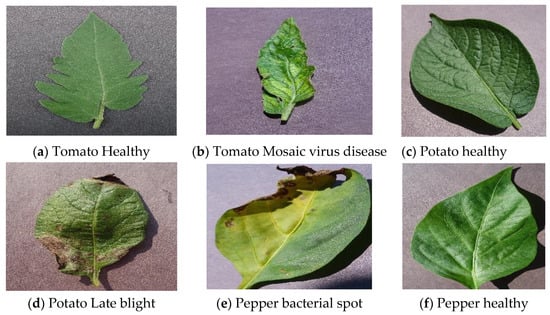
Figure 4.
Sample images from the dataset.
4.2. Proposed Model
The proposed model is a low-power convolutional neural network model for plant disease detection in smart hydroponics. The system will be deployed on edge devices, specifically, a raspberry pi. Hence, it is equipped with an energy-harvesting technique to supplement the energy requirement of the system and make sure that the device batteries are constantly refreshed with charge. To reduce the power consumption of the model, we adopted one of the model compression techniques called knowledge distillation. The logic is that when the parameters of the model are lesser, the number of the computation will be reduced, which reduces the memory accesses. Since the variations in memory access and power consumption are directly proportional, it this reduces power consumption.
It is also noteworthy to know that the proposed knowledge distillation model does not require Internet access, as in the case of the previous model, which was deployed on Google Cloud Platform (GCP) and required the Internet to run. It was indicated that power consumption increases with Internet connectivity in embedded device environments [8].
To vividly describe the proposed model, a cumbersome CNN model named the TM model is built with six (6) layers consisting of an input layer, five (5) convolutional layers, and a fully connected layer with four (4) hidden layers including the output layer. The modified softmax activation function will be applied to the logits of the TM model to obtain the distilled knowledge.
On another hand, a shallow CNN with only one hidden layer is defined and is referred to as the SM model. The model takes images from the dataset as input and distilled knowledge from TM as additional knowledge to aid in training the model. The main idea behind distilled knowledge is to obtain labels with high variance and low standard deviation which contain more information about the classes than the hard labels, making the SM model prediction easier and, as such, reducing the computations needed to perform the task. The proposed model setup is presented in Figure 5 below.
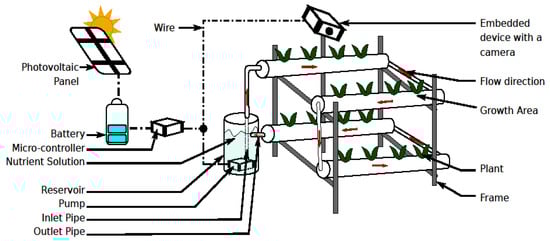
Figure 5.
Proposed System setup.
4.3. Model Definition
Unlike the previous deep neural network models, this model is based on a shallow neural network developed with the aid of knowledge distillation. Therefore, two models were defined, the teacher model and the student model. The teacher model is the large cumbersome model where knowledge will be distilled for the student model. The student model is the shallow network that will train under the supervision of the teacher model. The student model takes both plant images from the dataset and distilled knowledge from the teacher model as input. The student model training took place in two phases: In the first phase, it was trained on images and soft labels as a target from the teacher model, while, in the second phase, the student model will be trained on images and hard labels or ground truth as the target.
First, we defined a deep neural network model with several hidden layers as the teacher model (TM). The model can be formulated mathematically below:
Given an image, I, with features (h,w,c), I (h,w,c) is an image with height, width, and color channel c. The first convolutional layer takes this image and applies filter K on it for features selection:
The RELU activation function is applied to the result obtained in Equation (1) to remove negative values and normalize the values:
where A: is the output of the convolutional layer before the pooling layer.
The output from convolution layer one is then passed into a pooling layer to reduce the feature map:
where X is the vector containing the convolve image features.
The process was repeated for another three convolutional layers available in the model. The results of the final layer were passed through a flattening layer to convert the 2D array into a 1D vector. Vector W served as input to the fully connected layer. The equation for the operations taking place in the fully connected layer is a typical forward pass equation, with a softmax activation function applied to the logits of the final layer:
where w is the weight associated with each neuron.
In the case of knowledge distillation, the teacher model (TM) will have a modification in its softmax function to generate soft labels, which will serve as distilled knowledge to the student. Therefore, TM can be defined as:
where t is a real number greater than 1.
With this, the next step was to define a student model (SM) with two training phases to obtain distillation loss as well as student loss. In phase one, the SM definition is similar to TM, and they only differ in the target labels. The TM target are the hard labels from the dataset while the SM target are the soft labels generated by TM. Therefore, SM models are defined as:
SM training Phase I:
with temperature t greater than 1.
SM training Phase II:
with temperature t = 1.
The general loss function can now be calculated as:
where x is the input;
- W: are the student model parameters;
- y: is hard label or ground truth;
- M: is cross entropy loss function;
- : is the softmax activation function;
- are the constants or coefficients.
In Equation (8), the overall loss function is computed, incorporating both distillation loss and student losses. In essence, the distillation loss function is the difference between soft student predictions and soft teacher labels. While student loss function is the difference between SM prediction and ground truth using the softmax function with the temperature of 1.
The entire process can be compacted in an algorithm for easier comprehending, the algorithm of the proposed model is presented below (Algorithm 1):
| Algorithm 1. Proposed Model Algorithm |
| Input: Deep CNN model TM |
| Output: Shallow Student model SM |
| 1. Declare TM, SM, Temperature T, Train_set X and Softmax function F |
| 2. Initialize TM, T > 1, = model weight |
| 3. Input train set images X |
| 4. Do |
| train TM: |
| Forward pass |
| Apply Softmax with temperature (T) on TM logits to soften the labels |
| Distilled Knowledge |
| 5. End do |
| 6. Initialize SM Model: |
| 7. Feed distilled knowledge Z, train_set X |
| 8. Do while CE ≤ 0: |
| SM training phase I with z as target |
| SM_loss = |
| SM training phase II with X as target |
| Distillation_loss = |
| General Loss = |
| 9. End do |
| 10 Stop |
The above algorithm describes the process of formulating a knowledge distillation model, where the teacher and student models were built. The teacher model was trained on the full dataset with a softmax activation and a temperature variable T greater than 1 to soften the labels. The student model, on the other hand, was trained on the dataset and logits of the teacher model as a target which serves as distilled knowledge. Later on, the student model was trained on the full dataset with a temperature of 1 and ground truth as the target. The student model performance was as good as the teacher model with reduced parameters and low resource requirements.
5. Results and Discussion
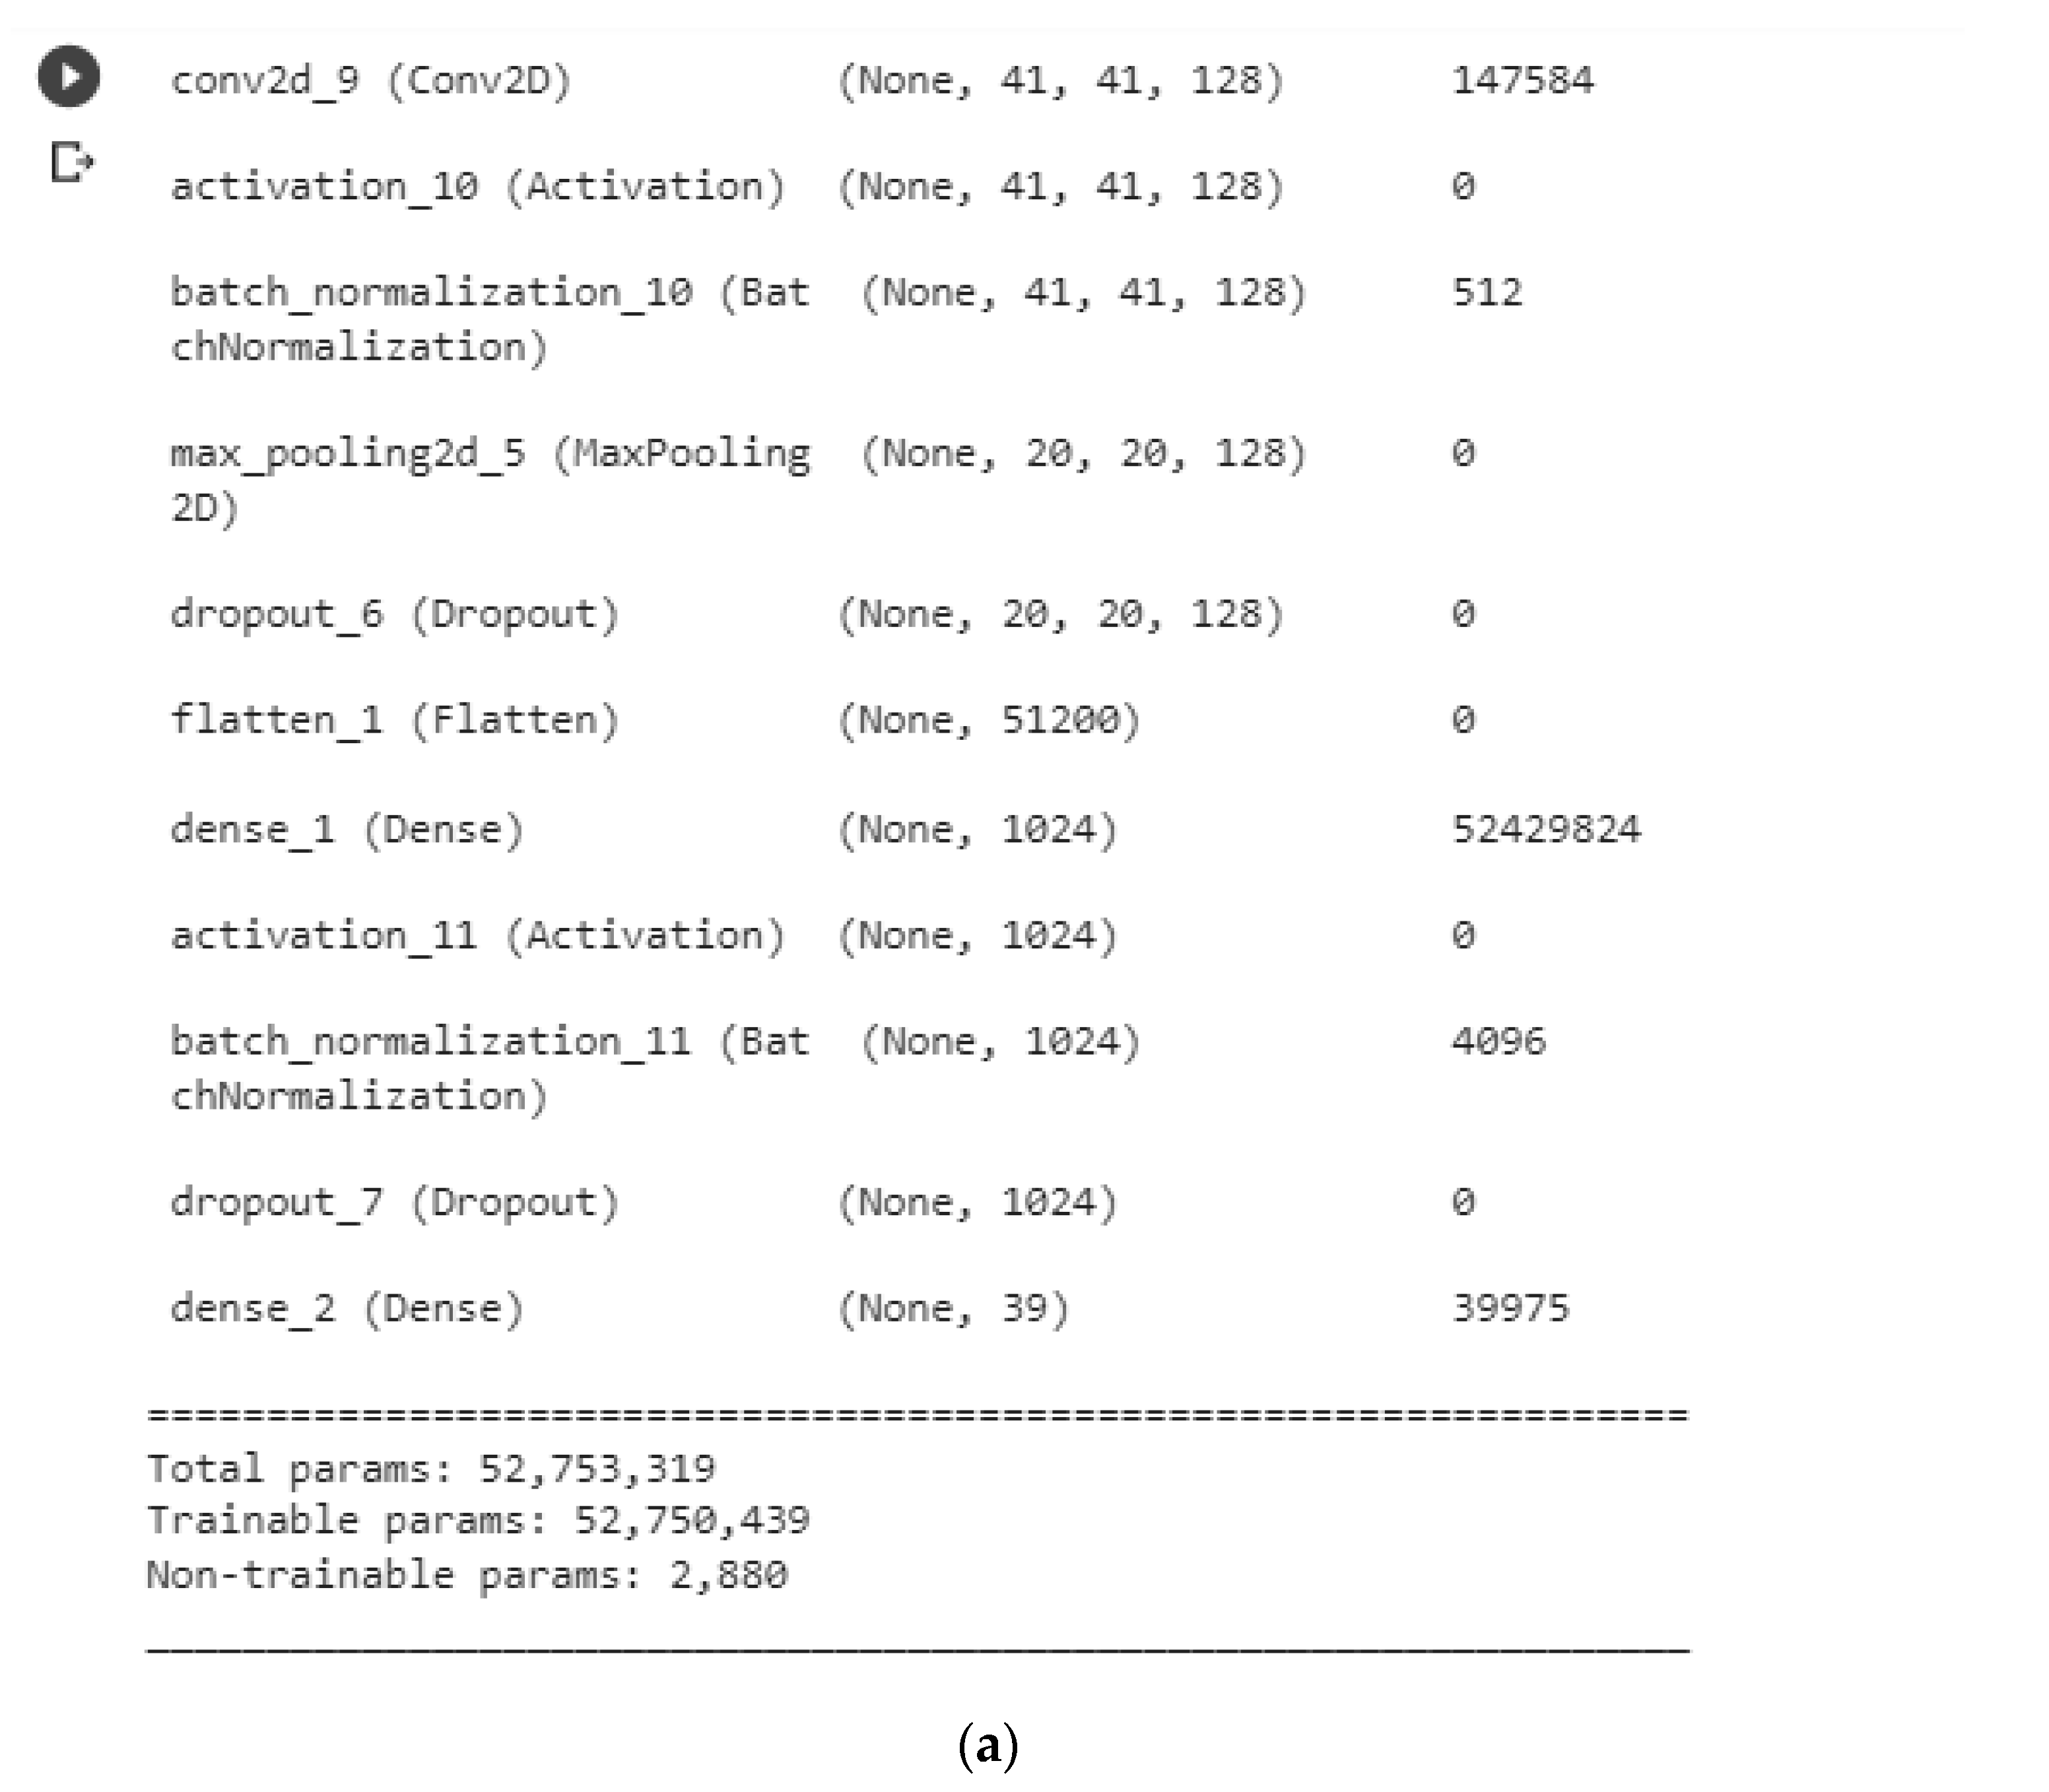
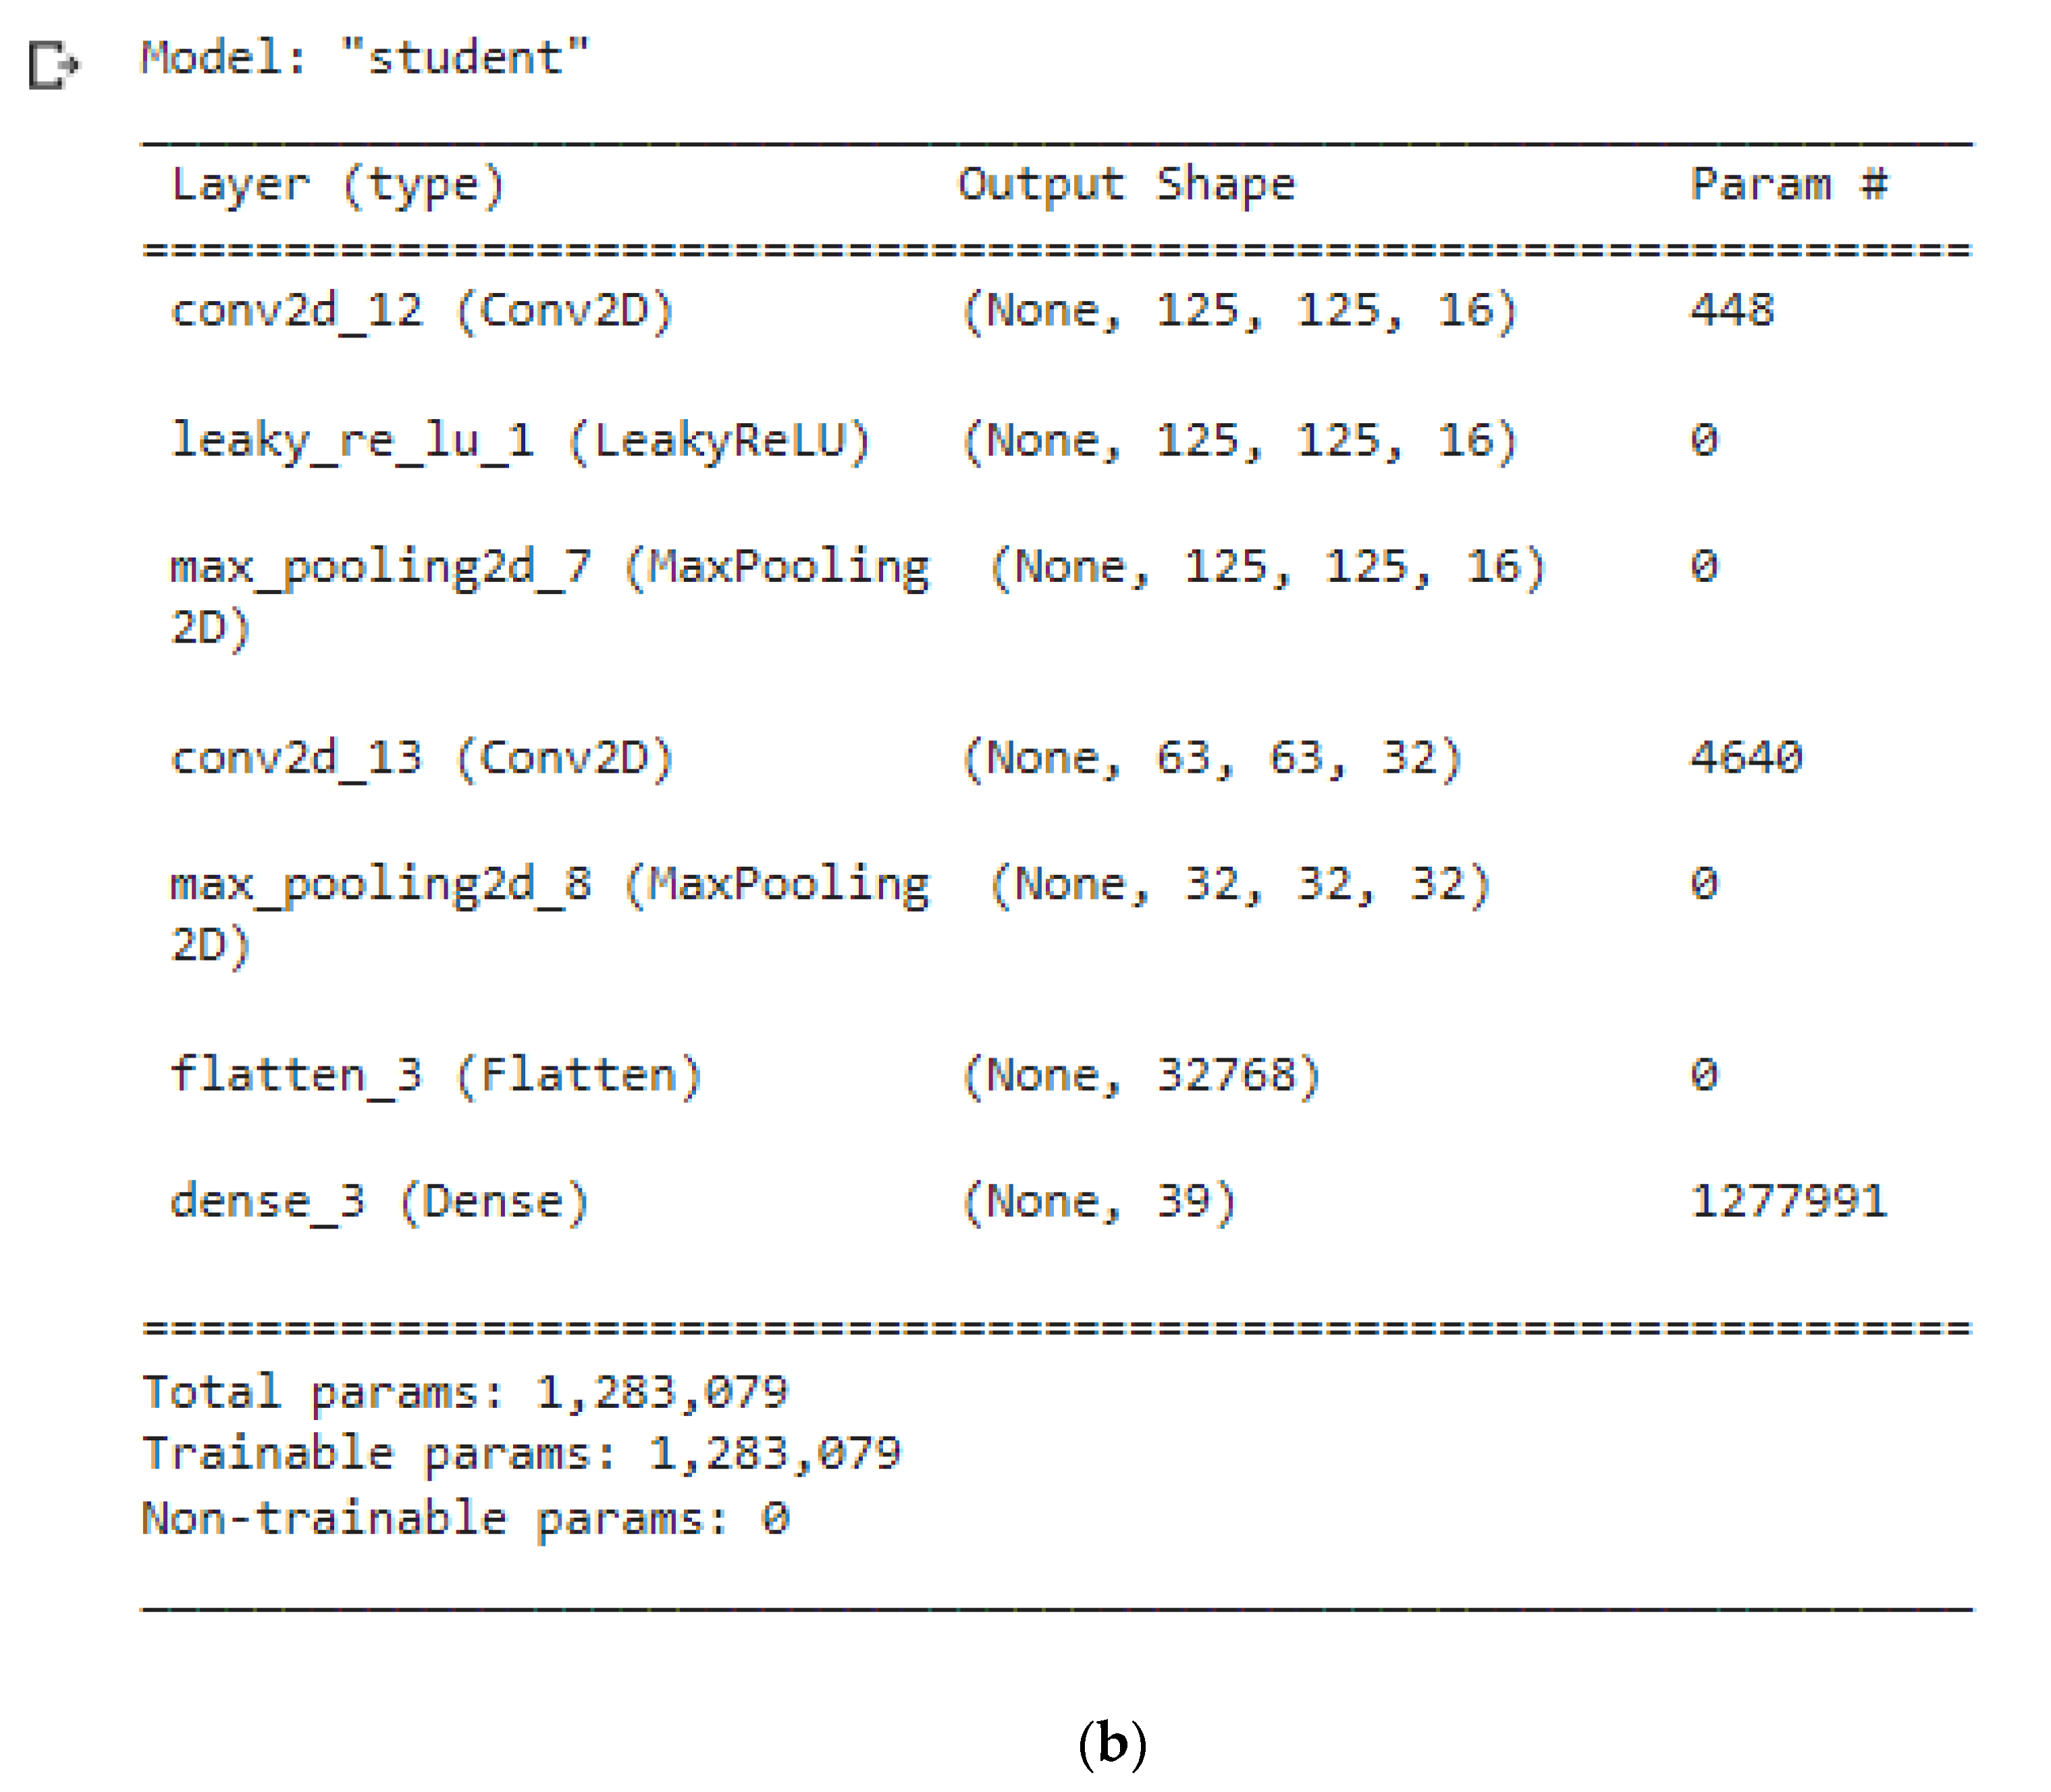
The experimental results indicate that the knowledge distillation technique can be used to build a low-power convolutional neural network model for plant diseases detection, the technique demonstrated how a cumbersome teacher model can be compressed to a lightweight student model with few parameters and low resources utilization (power and storage). Few parameters require less storage space and also indicate that the model will have fewer memory accesses; less memory access guarantees low power consumption. The cumbersome model and low-power model architectures are presented in Figure 6a,b below to highlight their differences in terms of parameters.
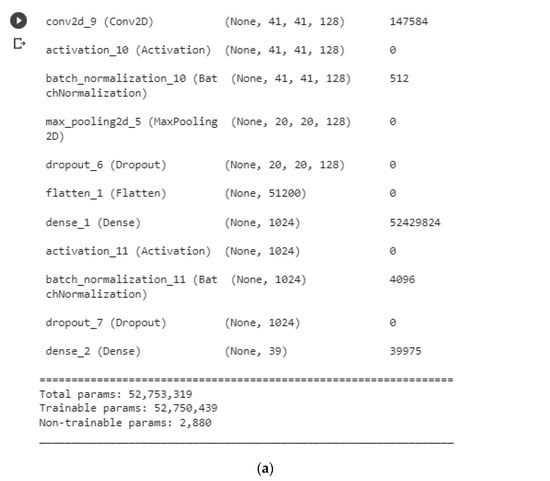
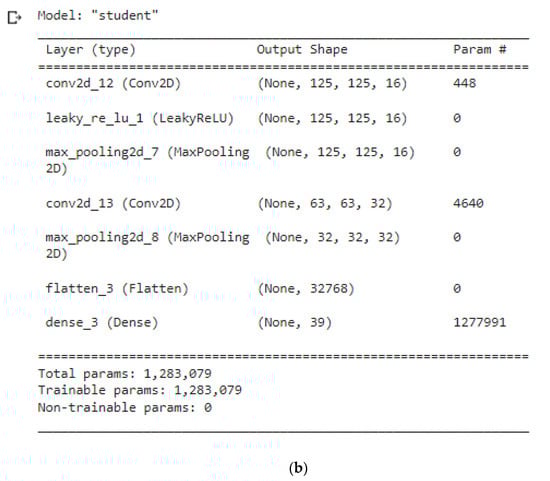
Figure 6.
(a) Teacher Model and (b) Student Model.
The proposed low-power model is a shallow neural network with just one hidden layer and two convolutional layers. The total number of parameters in the model is 1.2 M. Whereas the teacher model has about 52 M parameters, the previous model proposed in paper [8] has about 12 M parameters also. This indicates that the proposed low-power model has fewer parameters, which will result in lesser memory accesses and computations, thus reducing power consumption.
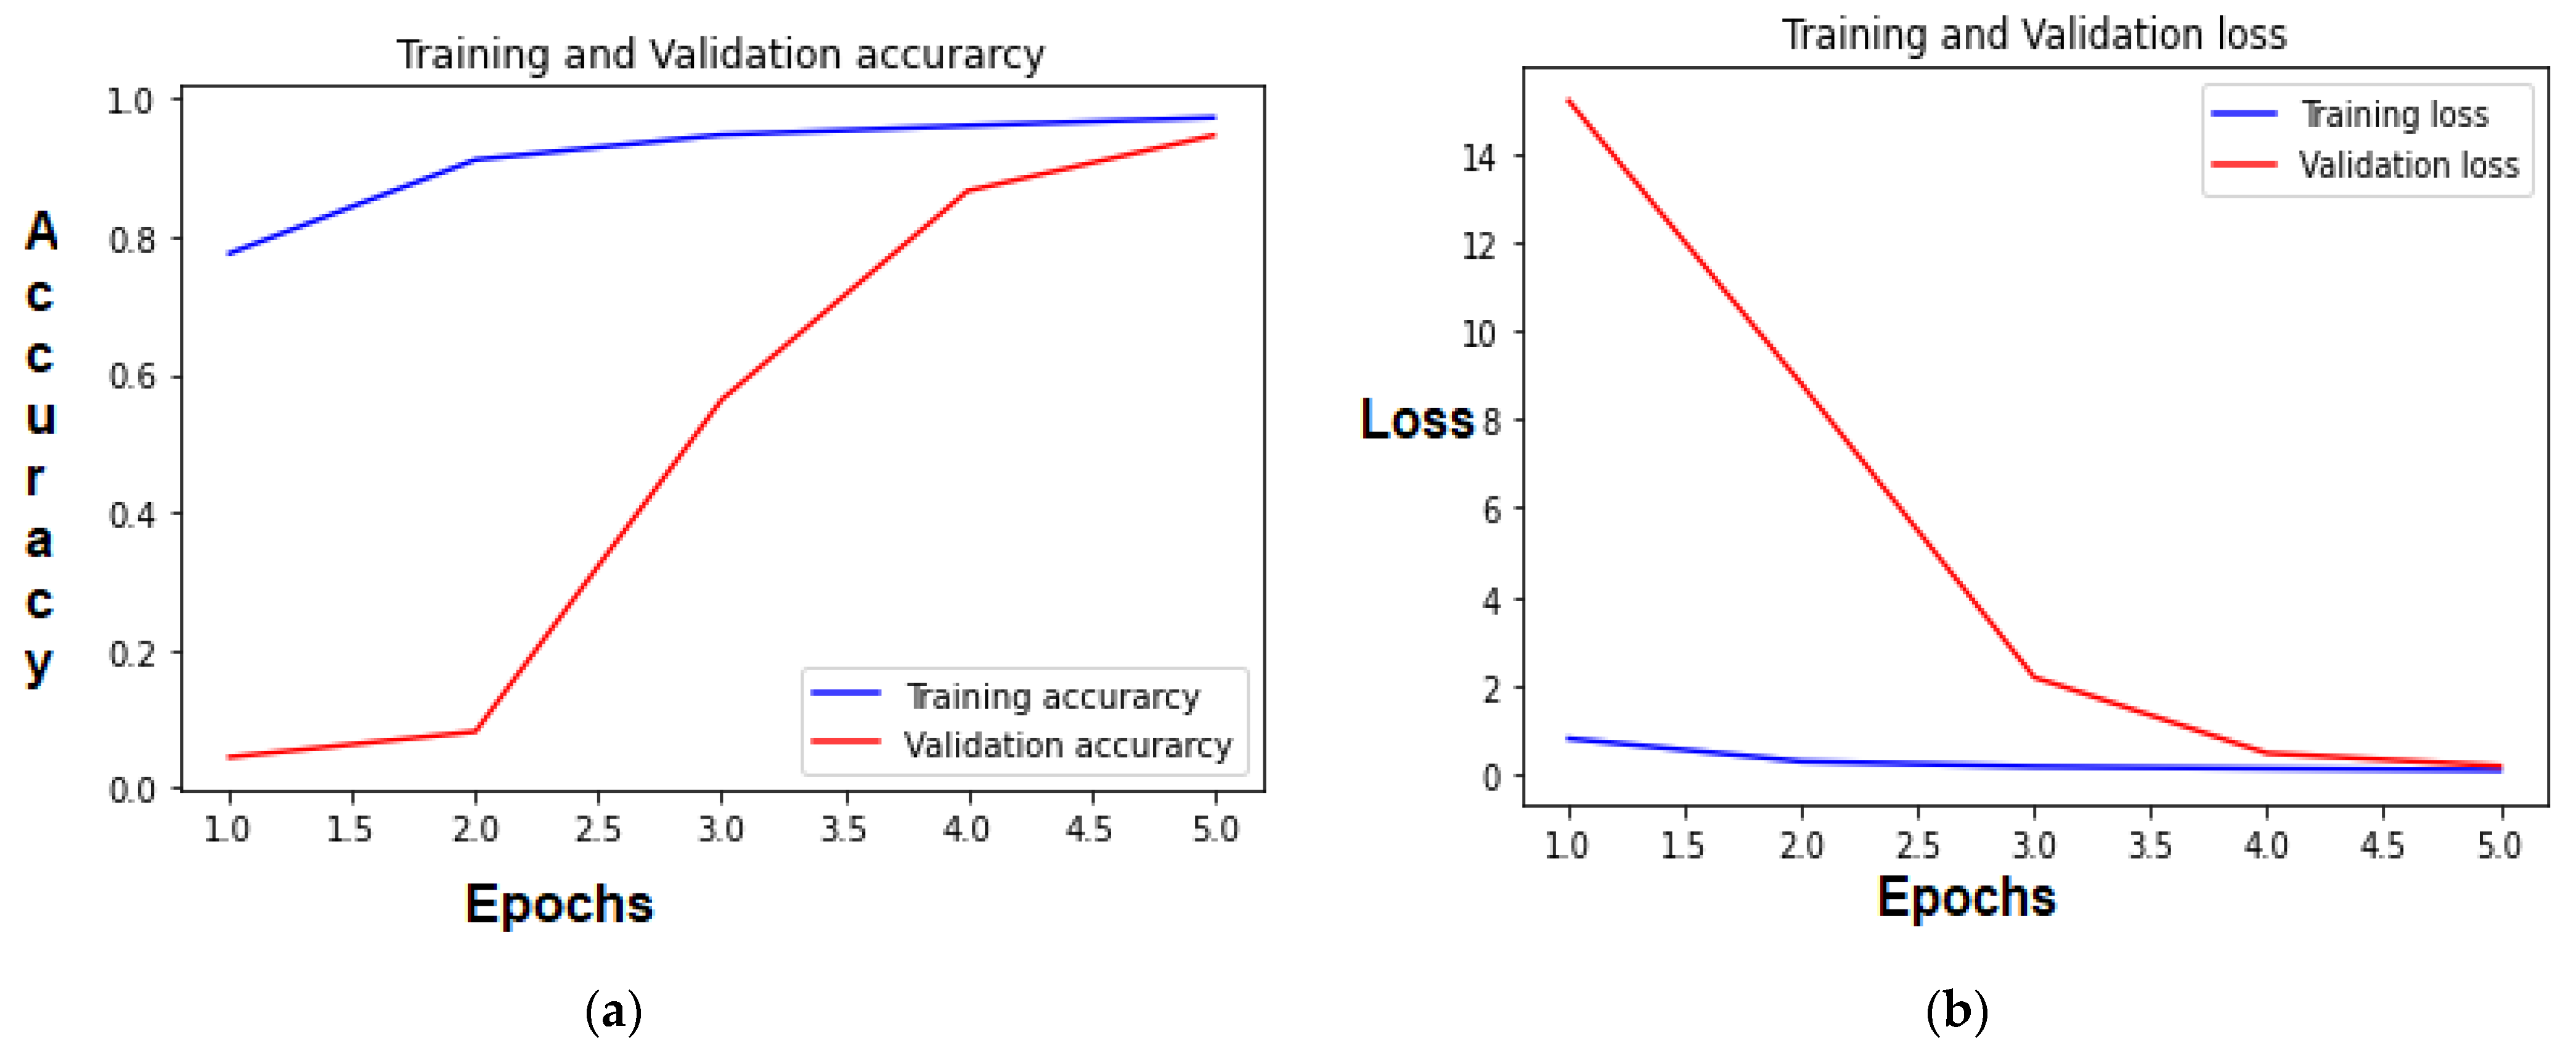
To effectively measure the performance of the proposed low-power model, we evaluate the performance of the model on the accuracy, power consumption, number of parameters, and training time. The proposed model performance was compared with the cumbersome model and other existing models to prove its effectiveness. To begin with the accuracy of the models, Figure 7, Figure 8, Figure 9 and Figure 10 presents the accuracy and loss curves of the cumbersome teacher model, as well as the low-power student model.
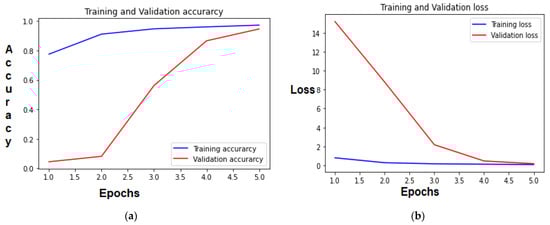
Figure 7.
(a) Teacher model accuracy; (b) Teacher model loss.
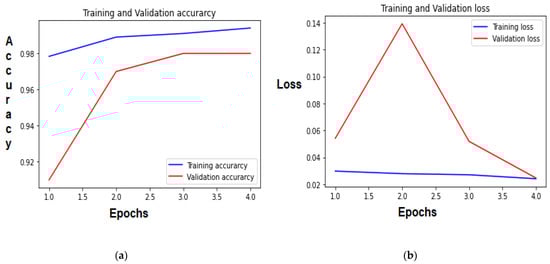
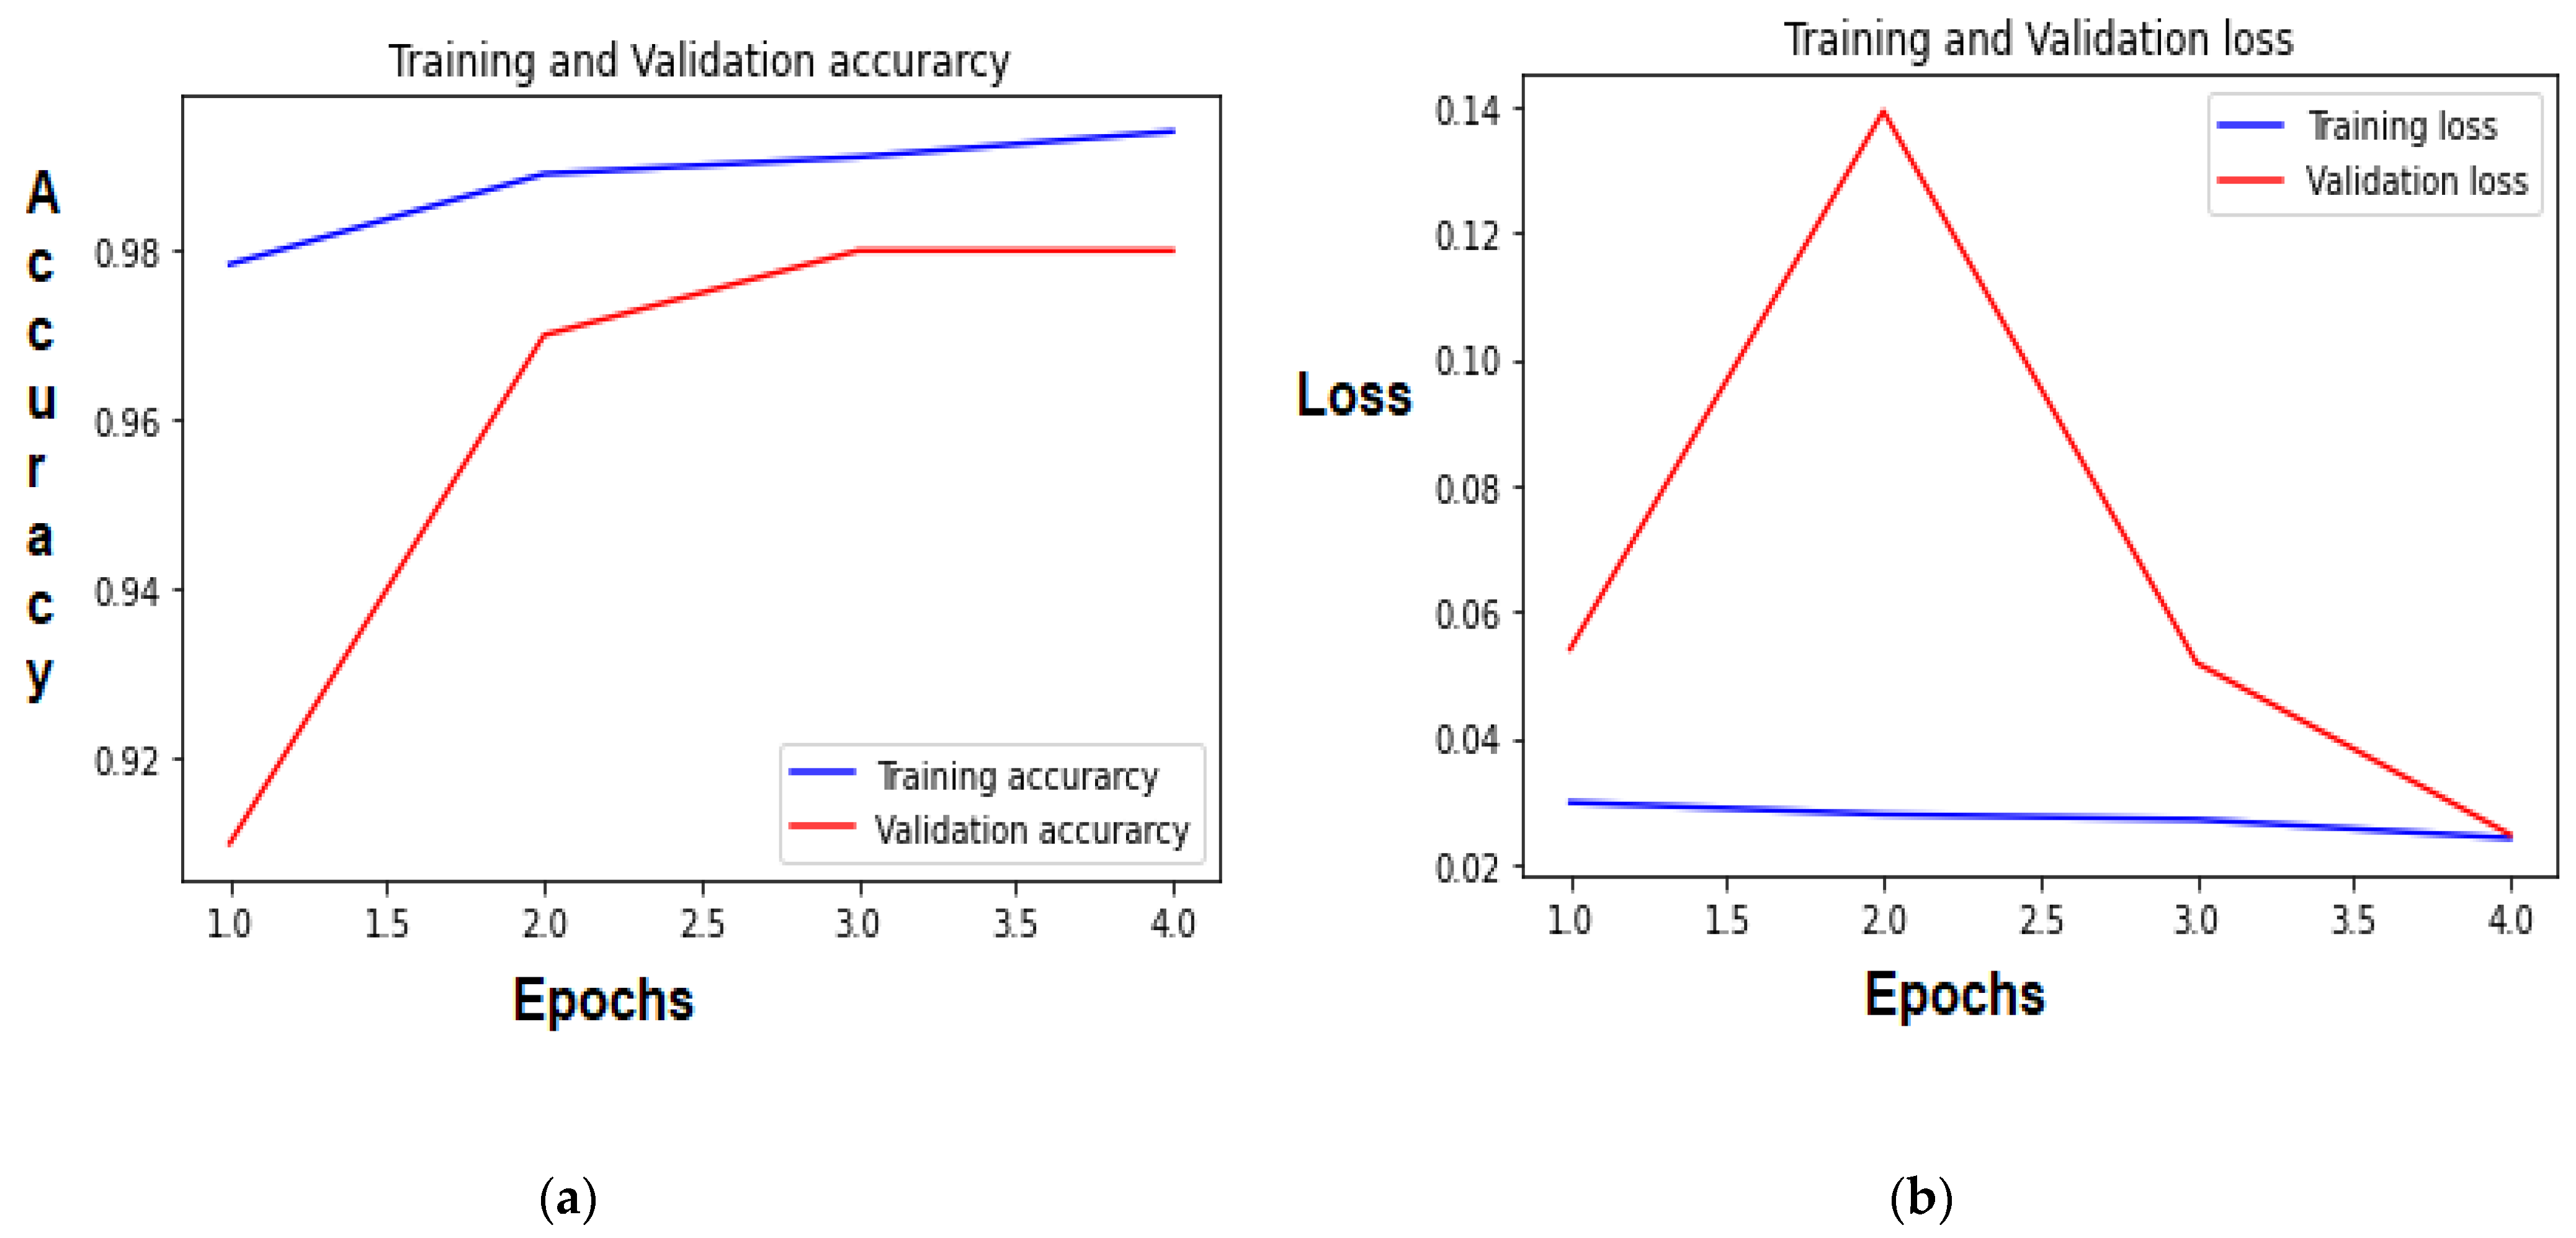
Figure 8.
(a) Proposed model accuracy; (b) Proposed model loss.
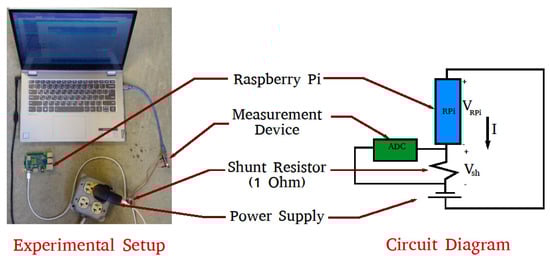
Figure 9.
Power experimental setup.
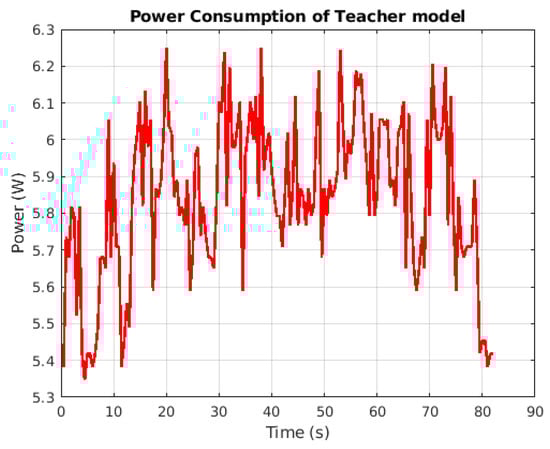
Figure 10.
Power consumption of the teacher model versus inference time.
From the results above, the relationship between the size of the model and power consumption was established. We showed that large CNN models give rise to high power consumption from numerous matrix multiplications which leads to huge computations and increases memory accesses. Frequent memory accesses result in increased power consumption. With this notion, we reduced the size of the CNN to a shallow network with fewer memory accesses, and it is capable of detecting these diseases with better accuracy.
From Figure 8a,b, it can be noted that the proposed model achieved an overall accuracy of 99.4% on a dataset with 39 different class labels, which surpassed the performance of the cumbersome teacher model presented in Figure 7a,b, as well as the performance of some existing models found in the literature (see Table 2). The overall accuracy we found in existing literature using the Plant Village dataset varied from 85.53% to 99.34%, without consideration of the power consumption or the storage requirements. Hence, the proposed model shows a strong promise of how a low-power deep learning model can be achieved using knowledge distillation techniques for plant disease detection or any other similar detection problems. The proposed low-power model can be deployed effectively on the IoT and embedded devices that are resource-constrained.
Table 2.
Comparison of Model Performance.
The proposed low-power student model does not only differ from other models in terms of accuracy but also in several other performance metrics, including power consumption, which is more relevant than other metrics in this paper. The proposed low-power model performances were compared with other models, and the result are presented in Table 2.
It can be inferred from Table 2 that not only does the proposed model has significantly lower power consumption than all the existing compared models, but it also, surprisingly, has better accuracy as well. This makes the model suitable for embedded systems and IoT environments. The proposed model is also faster to train. It achieved 99.4% accuracy in only 5 training epochs, while the rest of the models were trained for over 10 epochs each.
The energy aspect of the model was investigated to show that the proposed model is energy efficient. An experiment was conducted to measure the power consumption of the model at both training and inference times. Figure 9 displayed the original experimental setup where Raspberry, arduino, stop watch, and resistor shunt were used to record the power consumption and inference time.
The power consumption of the proposed model was measured at the inference time. The model was deployed on raspberry pi for testing, Arduino was connected, and the timer was simultaneously started. The time was recorded as 00:00:00, the code was run through an SSH connection with the raspberry pi, and the lap’s time is recorded as 00:10:39. This shows the time taken for importing packages, loading images, and executing the neural network counting from zero. Thus, we add the 10 s. above to track the power graph. Manual time laps are shown in Table 3.
Table 3.
Proposed model power consumption at different operations.
For the purpose of comparison, the teacher model’s power consumption at inference time was also measured. Arduino was connected, and the timer was simultaneously started. The time was recorded as 00:00:00, the code was run through an SSH connection with the raspberry pi, and the lap’s time was recorded as 00:10:16 as the time taken to (a) import packages, (b) load images, (c) load the neural network, and (d) execute the neural network counting from zero. Thus, we add the 10 sec above to track the power graph.
The experimental setup displayed in Figure 9 and Equation (9) was used to calculate the power consumed by the Rpi, and the energy consumed is obtained by calculating the area under the curve in the respective figures:
where .
From Table 4 and Table 5, the power consumption at different phases of the model simulation during inference was presented. At the beginning of the experiment, the power consumed by the Raspberry device was 5.3 w. Each phase of code execution has different power consumption; for example, importing packages necessary to run the app has different power cost than uploading a sample image for inference, and they all differ from the cost of image detection. This leads to fluctuations in the power/time graph.
Table 4.
Teacher model power consumption at different operations.
Table 5.
Comparison of power consumption.
The results of the power experiment reveal that there was a significant improvement in the energy efficiency of the proposed model compared to the existing models, which have no consideration of power consumption but rather accuracy at all costs. The CNN model presented in paper [8] has a maximum power consumption of 6.25 w, and it increases when the Wi-Fi activity is turned on, which is necessary for the model, as it requires Internet connectivity to diagnose a plant. Figure 9 and Figure 10 present the power consumption of our previous model and proposed model, respectively.
Figure 9 shows that power consumption of the system when deployed on raspberry pi. Power is one of the most limited resources of any IoT system, for an efficient IoT system, the system has to be designed in a way that is energy-efficient to be able to utilize power moderately. As shown in Figure 10, the CNN model based on [8] uses about 6.25 w for its operation, whereas the proposed model consumed about 6.2 w and within a time interval of 50 s, as shown in Figure 11. This makes the proposed system energy-efficient and faster compared to the existing model. The average power consumption of both models was compared in Table 3.
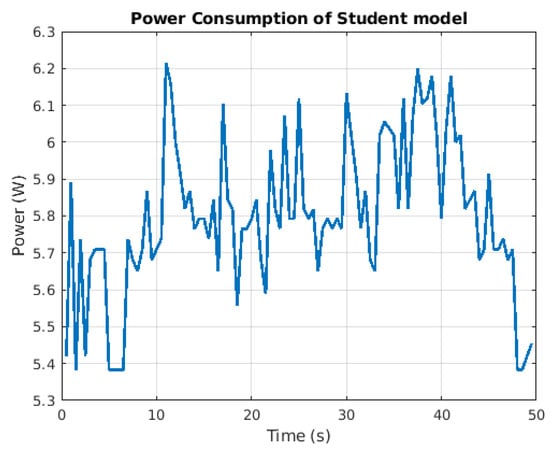
Figure 11.
Proposed model power consumption versus inference time.
6. Conclusions
In this paper, we presented a low-power convolutional neural network model for plant disease detection in smart hydroponics using the knowledge distillation technique. Power consumption is a critical resource in an embedded system environment such as smart hydroponics. For an effective solution to plant disease diagnosis in smart hydroponics, deep-learning-based models have been proposed in the past. Unfortunately, those models suffer from high power consumption, high inference times, and consumed large space on disks. Therefore, this paper presents an energy-efficient, low-power deep learning model for plant disease detection in smart hydroponics. The model achieved a state-of-the-art accuracy of 99.4%, higher than that of existing models, with a low average power consumption of 6 w. The system was also complemented with an energy-harvesting technique to augment the recharging of the edge devices when their battery is low. The proposed model was aimed at improving the accuracy and power consumption of the existing models by reducing the number of parameters in the model, minimizing computations, and providing a faster model that is more accurate and scalable.
The proposed low-power model obtained an increase in accuracy of 2.4% compared to our previous CNN model despite its light structure. The model also records a maximum power consumption and energy usage of 6.22 w and 170.54 J, respectively. This shows a slight decrease in power consumption when compared to our previous model [8] with 8.9 w. However, the energy usage of the two models differs significantly. The CNN model has higher energy usage compared to the proposed KD model, which indicated that the proposed model is indeed energy-efficient. In terms of speed, the latency of the two models were highlighted in table III, which also shows that the proposed KD model has a lowest latency of 29.17 s. During training as well, KD model was only trained for 5 epochs, which last for 7 min. In comparison, the CNN model was trained for 10 epochs, which lasted more than 50 min. In terms of inference, when deployed on raspberry pi, the proposed model took an average of 50 s per image while utilizing 6.22 w power; consequently, the teacher model spent more than 80 s per image with a power consumption of 6.25 w on the same device. Conclusively, the proposed low-power model is more accurate, energy-efficient, lighter, faster, and more suitable for smart hydroponics environment compared to existing models of plant disease detection. This paper is limited to the deep-learning-based method of plant diagnosis, which uses plant leaves as a dataset. The model cannot detect other conditions apart from the ones it was trained on and cannot give solutions to the detected diseases affecting the plant.
Author Contributions
Conceptualization, all authors; methodology, all authors; Experiments, A.M. and F.A.; coding and validation, A.M. and M.H. (Mohammed Hassan); Investigation, A.M. and F.A.; resources, F.A. and M.H. (Mohamed Hamada); writing–original draft preparation, A.M.; writing–review and editing, M.H. (Mohammed Hassan) and A.M.; supervision, M.H. (Mohammed Hassan) and M.H. (Mohamed Hamada). All authors have read and agreed to the published version of the manuscript.
Funding
This research received no external funding.
Institutional Review Board Statement
Not applicable.
Informed Consent Statement
Not applicable.
Data Availability Statement
Not applicable.
Conflicts of Interest
The authors declare no conflict of interest.
References
- Singh, D.J.; Davidson, J. Introduction to Hydroponics—Growing Your Plants without Any Soil. Mendon Cottage Books; JD-Biz Corp Publishing: Mendon, UT, USA, 2016. [Google Scholar]
- Baras, T. DIY Hydroponic Gardens: How to Design and Build an Inexpensive System for Growing Plants in Water; Cool Springs Press: Beverly, MA, USA, 2018. [Google Scholar]
- Raviv, M.; Lieth, J.H.; Bar-Tal, A. Soilless Culture: Theory and Practice: Theory and Practice; Elsevier: Amsterdam, The Netherlands, 2019. [Google Scholar]
- Aylor, D.E. Spread of plant disease on a continental scale: Role of aerial dispersal of pathogens. Ecology 2003, 84, 1989–1997. [Google Scholar] [CrossRef]
- Kannan, R. Plant Pathology; Chapter-2 Remote Sensing. Available online: https://www.academia.edu/download/61375450/2019_CRISPR_Cas9_Genome_Editing_and_Its_Medical_Potential20191129-85712-1nbvc0i.pdf#page=21 (accessed on 22 January 2022).
- Malao, S.; Gaikwad, P.; Palve, P.; Suryawanshi, R.; Suthar, N. Disease diagnosis of mango, International Journal of Recent Technology and Engineering (IJRTE) ISSN: 2277-3878, Volume-8 Issue-3S3. 2019. Available online: https://www.academia.edu/download/59886960/IRJET-V6I4105020190628-98574-bx9tae.pdf (accessed on 22 January 2022).
- Singh, V.; Misra, A. Detection of plant leaf diseases using image segmentation and soft computing techniques. Inf. Process. Agric. 2017, 4, 41–49. [Google Scholar] [CrossRef] [Green Version]
- Musa, A.; Hamada, M.; Aliyu, F.M.; Hassan, M. An Intelligent Plant Dissease Detection System for Smart Hydroponic Using Convolutional Neural Network. In Proceedings of the 14th International Symposium on Embedded Multicore/Many-core Systems-on-Chip (MCSoC), Singapore, 20–23 December 2021; pp. 345–351. [Google Scholar]
- Mrisho, L.M.; Mbilinyi, N.A.; Ndalahwa, M.; Ramcharan, A.M.; Kehs, A.K.; McCloskey, P.C.; Murithi, H.; Hughes, D.P.; Legg, J.P. Accuracy of a Smartphone-Based Object Detection Model, PlantVillage Nuru, in Identifying the Foliar Symptoms of the Viral Diseases of Cassava–CMD and CBSD. Front. Plant Sci. 2020, 11. [Google Scholar] [CrossRef]
- Hassan, M.; Hamada, M. A neural network recommendation approach for improving accuracy of multi-criteria collaborative filtering, IEICE Technical Report. IEICE Tech. Rep. 2017, 117, 17–20. [Google Scholar]
- Musa, A.; Aliyu, F. Performance Evaluation of Multi-Layer Perceptron (MLP) and Radial Basis Function (RBF). In Proceedings of the 2nd International Conference of the IEEE Nigeria (NigeriaComputConf), Zaria, Nigeria, 14–17 October 2019; pp. 1–5. [Google Scholar]
- Dahmane, M.; Foucher, S.; Byrns, D. Are You Smiling as a Celebrity? Latent Smile and Gender Recognition. In Proceedings of the Swarm, Evolutionary, and Memetic Computing; Springer Science and Business Media LLC: Berlin/Heidelberg, Germany, 2017; pp. 304–311. [Google Scholar]
- Gital, A.Y.; Hamada, M.; Haruna, K.; Hassan, M.; Shittu, F.; Ilu, S.Y.; Khan, A.; Adamu, I.M.; Muhammad, A.; Chiroma, H. Hybrid of Cuckoo Search Algorithm with Lévy Flight and Neural Network for Crude Oil Prices Prediction. J. Comput. Theor. Nanosci. 2019, 16, 4092–4104. [Google Scholar] [CrossRef]
- Ibrahim, R.; Chung, T.D.; Hassan, S.M.; Bingi, K.; Salahuddin, S.K.B. Solar Energy Harvester for Industrial Wireless Sensor Nodes. Procedia Comput. Sci. 2017, 105, 111–118. [Google Scholar] [CrossRef]
- Kanoun, O.; Bradai, S.; Khriji, S.; Bouattour, G.; El Houssaini, D.; Ben Ammar, M.; Naifar, S.; Bouhamed, A.; Derbel, F.; Viehweger, C. Energy-Aware System Design for Autonomous Wireless Sensor Nodes: A Comprehensive Review. Sensors 2021, 21, 548. [Google Scholar] [CrossRef]
- Scansen, D. Wind Energy Harvesting. Digikey.com, 11 July 2012. Available online: https://www.digikey.com/en/articles/wind-energy-harvesting (accessed on 21 December 2021).
- Vibration Energy Harvesting—Learn about the Tech That Replaces Batteries. Revibe Energy. 16 February 2021. Available online: https://revibeenergy.com/vibrationenergyharvesting/ (accessed on 21 December 2021).
- Wei, C.; Jing, X. A comprehensive review on vibration energy harvesting: Modelling and realization. Renew. Sustain. Energy Rev. 2017, 74, 1–18. [Google Scholar] [CrossRef]
- Kishore, R.A.; Priya, S. A Review on Low-Grade Thermal Energy Harvesting: Materials, Methods and Devices. Materials 2018, 11, 1433. [Google Scholar] [CrossRef] [Green Version]
- Hinton, G.; Vinyals, O.; Dean, J. Distilling the knowledge in a neural network. arXiv 2015, arXiv:1503.02531. [Google Scholar]
- Musa, A.; Hamada, M.; Hassan, M. A Theoretical Framework toward Building a Lightweight Model for Pothole Detection using Knowledge Distillation Approach. In Proceedings of the 4th ETLTC International Conference on Information and Communications Technology (ETLTC2022), Fukushima, Japan, 25–28 January 2022. [Google Scholar]
- Fernandes, M.B.; Costa, B.A.; Lemos, J.M. Hydroponic Greenhouse Crop Optimization. In Proceedings of the 2018 13th APCA International Conference on Control and Soft Computing (CONTROLO), Ponta Delgada, Portugal, 4–6 June 2018; pp. 270–275. [Google Scholar]
- Mashumah, S.; Rivai, M.; Irfansyah, A.N. Nutrient Film Technique based Hydroponic System Using Fuzzy Logic Control. In Proceedings of the 2018 International Seminar on Intelligent Technology and Its Applications (ISITIA), Bali, Indonesia, 30–31 August 2018; pp. 387–390. [Google Scholar]
- Yolanda, D.; Arief, L.; Sundara, T.A.; Deza, M.; Oktavia, D. Control of Electrical Conductivity for NFT Hydroponic Systems using Fuzzy Logic and Android Environment. In Proceedings of the 2018 International Conference on Information Technology Systems and Innovation (ICITSI), Bandung, Indonesia, 22–26 October 2018; pp. 508–514. [Google Scholar]
- Vidhya, R.; Valarmathi, K. Survey on Automatic Monitoring of Hydroponics Farms Using IoT. In Proceedings of the 2018 3rd International Conference on Communication and Electronics Systems (ICCES), Coimbatore, India, 15–16 October 2018; pp. 125–128. [Google Scholar]
- Gertphol, S.; Chulaka, P.; Changmai, T. Predictive models for Lettuce quality from Internet of Things-based hydroponic farm. In Proceedings of the 2018 22nd International Computer Science and Engineering Conference (ICSEC), Chiang Mai, Thailand, 21–24 November 2018; pp. 1–5. [Google Scholar]
- Hernandez-Rabadan, D.L.; Ramos-Quintana, F.; Guerrero Juk, J. Integrating soms and a bayesian classifier for segmenting diseased plants in uncontrolled environments. Sci. World J. 2014, 2014, 214674. [Google Scholar] [CrossRef] [PubMed]
- Setyawan, T.A.; Riwinanto, S.A.; Suhendro; Helmy; Nursyahid, A.; Nugroho, A.S. Comparison of HSV and LAB Color Spaces for Hydroponic Monitoring System. In Proceedings of the 2018 5th International Conference on Information Technology, Computer, and Electrical Engineering (ICITACEE), Semarang, Indonesia, 27–28 September 2018; pp. 347–352. [Google Scholar]
- Bradski, G.; Kaehler, A. Opencv. Dr. Dobb’s J. Softw. Tools 2000, 3, 122–125. [Google Scholar]
- Rau, A.J.; Sankar, J.; Mohan, A.R.; Das Krishna, D.; Mathew, J. IoT based smart irrigation system and nutrient detection with disease analysis. In Proceedings of the IEEE Region 10 Symposium (TENSYMP), San Jose, CA, USA, 18–21 October 2017; pp. 1–4. [Google Scholar]
- Badnakhe, M.R.; Deshmukh, P.R. Infected leaf analysis and comparison by otsu threshold and k-means clustering. Int. J. Adv. Res. Comput. Sci. Softw. Eng. 2012, 2, 449–452. [Google Scholar]
- Das, A.K.; Ghosh, S.; Thunder, S.; Dutta, R.; Agarwal, S.; Chakrabarti, A. Automatic COVID-19 detection from X-ray images using ensemble learning with convolutional neural network. Pattern Anal Applic 2021, 24, 1111–1124. [Google Scholar] [CrossRef]
- Bay, H.; Ess, A.; Tuytelaars, T.; Van Gool, L. Speeded-Up Robust Features (SURF). Comput. Vis. Image Underst. 2008, 110, 346–359. [Google Scholar] [CrossRef]
- Sharath, D.; Akhilesh; Kumar, S.A.; Rohan, M.; Prathap, C. Image based plant disease detection in pomegranate plant for bacterial blight. In Proceedings of the International Conference on Communication and Signal Processing (ICCSP), Chennai, India, 4–6 April 2019; pp. 645–649. [Google Scholar]
- Kulkarni, P.; Karwande, A.; Kolhe, T.; Kamble, S.; Joshi, A.; Wyawahare, M. Plant disease detection using image processing and machine learning. arXiv 2021, arXiv:2106.10698. [Google Scholar]
- Mohanty, S.P.; Hughes, D.P.; Salathé, M. Using Deep Learning for Image-Based Plant Disease Detection. Front. Plant Sci. 2016, 7, 1419. [Google Scholar] [CrossRef] [Green Version]
- Li, Y.; Gao, Y.; Shao, M.; Tonecha, J.T.; Wu, Y.; Hu, J.; Lee, I. Implementation of Multi-Exit Neural-Network Inferences for an Image-Based Sensing System with Energy Harvesting. J. Low Power Electron. Appl. 2021, 11, 34. [Google Scholar] [CrossRef]
- Saddik, A.; Latif, R.; El Ouardi, A. Low-Power FPGA Architecture Based Monitoring Applications in Precision Agriculture. J. Low Power Electron. Appl. 2021, 11, 39. [Google Scholar] [CrossRef]
- Senadeera, S.D.A.P.; Kyi, S.; Sirisung, T.; Pongsupan, W.; Taparugssanagorn, A.; Dailey, M.N.; Wai, T.A. Cost-Effective and Low Power IoT-Based Paper Supply Monitoring System: An Application Modeling Approach. J. Low Power Electron. Appl. 2021, 11, 46. [Google Scholar] [CrossRef]
- Yolanda, D.; Hindersah, H.; Hadiatna, F.; Triawan, M.A. Implementation of real-time fuzzy logic control for Nft-based hydroponic system on internet of things environment. In Proceedings of the 2016 6th International Conference on System Engineering and Technology (ICSET), Bandung, Indonesia, 3–4 October 2016; pp. 153–159. [Google Scholar]
- Alipio, M.I.; Cruz, A.E.M.D.; Doria, J.D.A.; Fruto, R.M.S. On the design of Nutrient Film Technique hydroponics farm for smart agriculture. Eng. Agric. Environ. Food 2019, 12, 315–324. [Google Scholar] [CrossRef]
- Goel, A.; Tung, C.; Lu, Y.-H.; Thiruvathukal, G.K. A Survey of Methods for Low-Power Deep Learning and Computer Vision. arXiv 2019, arXiv:2003.11066. [Google Scholar]
- Mohanty, P. spMohanty/PlantVillage—Dataset: Dataset of Diseased Plant Leaf Images and Corresponding Labels. GitHub, 2 September 2016. Available online: https://github.com/spMohanty/PlantVillage—Dataset (accessed on 14 January 2022).


Publisher’s Note: MDPI stays neutral with regard to jurisdictional claims in published maps and institutional affiliations. |
© 2022 by the authors. Licensee MDPI, Basel, Switzerland. This article is an open access article distributed under the terms and conditions of the Creative Commons Attribution (CC BY) license (https://creativecommons.org/licenses/by/4.0/).