Abstract
As climate change and energy crises increase, NPK (nitrogen, phosphorus and potassium) fertilizer supply chains become more volatile. Globally, the Russian attack on Ukraine has caused the cost of gas to rise and fertilizer supplies to decline. This aggression may worsen the energy and wheat resource crisis in global supply chains. As a result of the escalation of hostilities, natural gas, oil, and coal prices have rapidly increased. In the years preceding the conflict, the agricultural sector had already begun to suffer, caused by unprecedented increases in the prices of natural gas and raw materials for the production of fertilizers stemming from Russian manipulation, especially in the gas market. Prior to the growing season, farmers were still unable to afford fertilizer prices. This situation will be exacerbated by the war. We can conclude from our results that European countries and the United States have high wheat production potential. Developed countries have significant nitrogen, phosphorus, and potassium fertilizer resources. Ukraine has a large yield gap, ranging between 4.5 and 7 Mg/ha. Wheat supply crises can be caused by tense geopolitical affairs, including military aggression and economic embargoes. Based on this, we recommend that decision-makers focus on crop quality to increase the country’s own production.
1. Introduction
By promoting and implementing a sustainable agricultural management model, the use of chemical plant protection products and mineral fertilizers can be rationalized. The share of natural fertilizers and biological plant protection methods can also be increased. Various regions of the world experience soil contamination because of improper use of artificial fertilizers, calcium, and plant protection products [1,2]. Pesticides and artificial fertilizers have been reduced by almost half in winter wheat cultivation (down to almost none). Promoting and implementing the sustainable agriculture model result in the rational use of chemical plant protection products and mineral fertilizers. In addition, there is a greater share of natural fertilizers and biological plant protection methods [3,4]. In Ukraine, one of the world’s largest wheat exporters, the war has increased wheat prices, among other things. Food production must be freed from over-dependence on fossil fuels and imports in response to the conflict [5,6]. Ukrainian cereal production including wheat was 24.9 million Mg before the outbreak of the war. The Russian invasion of Ukraine has also disrupted global grain exports and supplies. In 2020, the value of French exports was USD 4.5 billion, while that from Germany was USD 2.1 billion, and Poland was approximately USD 1 billion. [7] This will undoubtedly increase wheat prices, and higher wheat prices cause more expensive flour and bread [8]. Ukraine will suspend the export of some cereals until the end of the year, providing another catalyst for increasing food prices in the world [9]. Wheat is a strategic agricultural product exported by Russia and Ukraine. These nations are the first- and fifth-largest exporters of this raw material in the world. However, export licenses were introduced for the export of wheat. This caused food prices to rise around the world. This is compounded by the fact that the international sanctions imposed on Russia will also make it difficult to buy Russian grain. This country is responsible for 35 percent of the world market for this grain, Ukraine for 12 percent, and Kazakhstan for 4 percent [10]. Wheat supplies from the Black Sea region have been suspended since the end of February. This has drastically increased their prices and affected food markets in countries dependent on imports, such as North Africa and the Middle East. Currently, there is export ban on wheat. The ban is in place, however, due to Russia’s military offensive in Ukraine, including the blocking of Ukrainian ports. Problems with importing agricultural goods from Ukraine have occurred. As a consequence, import-dependent countries may experience famine and the related migration of people. Fluctuations in winter wheat yield due to weather fluctuations. This occurs in a variety of climatic regions [11]. In a world where food shortages and rising inflation are more prevalent than ever, Indian warehouses are overcrowded with grain. Domestic farmers are gearing up for another record harvest. The country is the world’s second-largest producer of wheat, after China, according to the report, and has the potential to ship 12 million tons to the world market in 2022–2023. Since India has experienced five record harvests, it can export its enormous surplus [12]. Virtually every market now needs to consider Indian wheat, especially Asia, Africa, and the Middle East. Indian wheat is a big opportunity for people from such poor countries. One of the most threatened countries is Egypt, which imports 86 percent of its whole wheat and 26 percent of its corn from Russia and Ukraine. Food subsidies are common in the countries of the region. For example, Egypt spends around $2.9 billion annually on food subsidies, mainly for bread [13]. According to nutritionists, consumers should eat local products, meaning those produced within 100 km of where they live. FAO estimates indicate that malnutrition in the global population will increase to approximately 813 million people because of military activity, organic production, and exports in Ukraine [14].
We assessed a new approach for the winter wheat production index (Figure 1) and yield gap (Figure 2). A comparison of selected regions around the world was also conducted to determine the areas where NPK fertilizers (nitrogen, phosphorus, and potassium) were most applicable (Figure 3, Figure 4 and Figure 5).
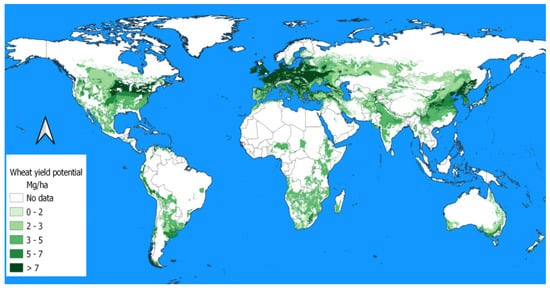
Figure 1.
World wheat potential production.
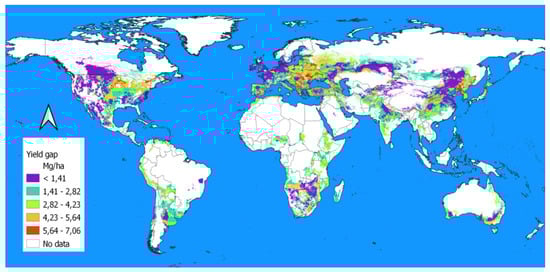
Figure 2.
Gap yield for wheat in the World.
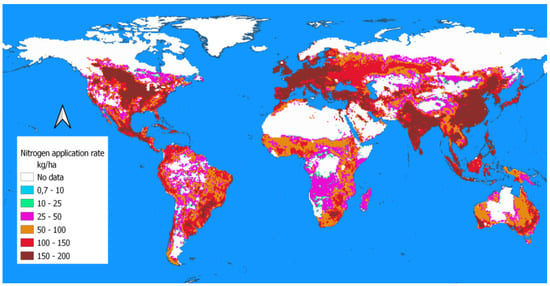
Figure 3.
Global nitrogen application.
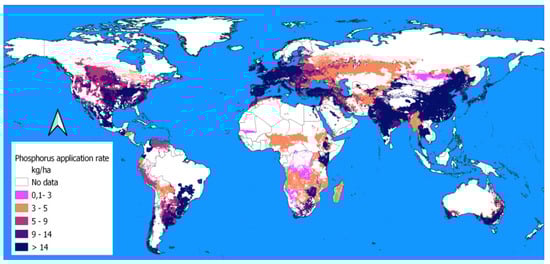
Figure 4.
Global phosphorus application.
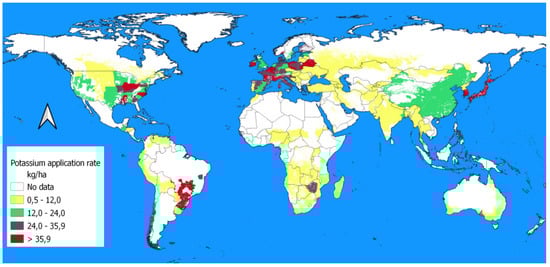
Figure 5.
Global potassium application.
2. Materials and Methods
2.1. Yield Data Calculation
To calculate the weighted average harvested areas in the world over 30 years, information on the average harvested area and yields in each sub-national location was used (Figure 1), together with the observed coefficient of determination. Global and country numbers were averaged only for 53–79% of the global harvest areas where statistical models were significant (p < 0.1). Overall, although we used a less restrictive p-value of 0.1, the selected models were generally significant at p = 0.05 or less. The following data products are included for the total yield (Figure 6). The yield gap was estimated by comparing observed and achievable yields in climate-similar zones. The amount and consumption of fertilizer in each country and territory were compiled. Winter wheat application rates were then broken down into detailed maps of pasture and cultivation areas and compared to local and national nutrient consumption data. As part of these data, mineral fertilizers, manure, and atmospheric deposition were considered.
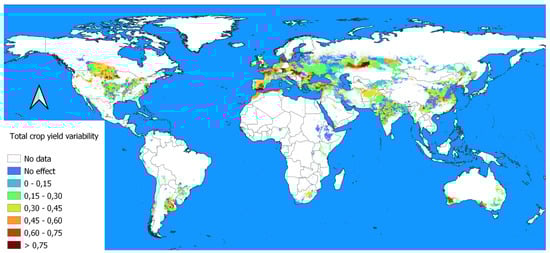
Figure 6.
Variability rate of change for wheat crop.
2.2. Climatic and Fertilization Data Proceeding
This manuscript uses a detailed long time series for crops to investigate how current climate variability has led to changes in wheat yields around the world. To determine to what extent fluctuations in yields were statistically explained by climate factors (temperature and rainfall), the linear and quadratic functions from the regression equation were used. The regression model was performed for the world’s wheat-growing zones. Then, the coefficient of determination (R2), the linking function, and the qualitative parameters of the model as well as the regression residue were determined. The residue of the regression is unexplained changes in seasonal and annual temperature and precipitation [15,16,17]. A combination of spatial data on agricultural land use and fertilizer rates tabulated for individual crops or groups of crops were used in our approach. Cropland maps and pasture data were used to calculate national fertilizer application rates (EarthStat). Several FAO reports were consulted and verified. Data were harmonized with the FAO’s national nutrient consumption data. A preliminary estimate of global consumption of N, P2O5 and K2O was calculated by multiplying fertilizer application rates by crop area. When the total amount of fertilizer consumed by crops exceeded (>95%) the FAO data, a procedure for scaling fertilizer application rates was applied. To match the consumption data, the fertilizer dosage data were scaled based on the country’s total sum. Because of the scaling limit of 25%, consistency with the FAO consumption dataset may have varied. In each country, we generated regression equations with the Akaike information criterion (AIC). We used regression models containing only temperature and only precipitation. The remainder of the model is unexplained yield variability. The average harvested area and harvest information from the 30-year study period at each national location were used along with the observed coefficient of determination to calculate national and global weighted average harvested areas. Bootstrapping was conducted to determine whether the inclusion of specific combinations of years would impact the overall national yield prediction at p = 0.01 and p = 0.05.
A full description is available at: http://www.earthstat.org/climate-variation-effects-crop-yields-maize-soybean-rice-wheat accessed on 1 July 2022. Geotiff files were downloaded for free from the website http://www.earthstat.org (accessed on 1 July 2022). A single crop, winter wheat, was filtered from various crops. We processed the datasets and overlaid them on a world map. Our layouts used Spatial Reference: GCS_WGS_1984, based on the D_WGS_1984. The cell size was 0.0833 degrees. A five-sheet minute grid was presented, with 4320 × 2160 cells per sheet. The map’s resolution was 10 km × 10 km. Earthstat.org provides a very detailed analysis of the nutrient application to major crops at http://www.earthstat.org/nutrient-application-major-crops (accessed on 1 July 2022). This website provides reproducible and free data.
Based on the reporting of local administrative units, the presented data did not contain unique data for each grid cell. The data were compiled using information from individual countries’ agricultural censuses. Therefore, data for all countries were not available (white areas on the maps). A Creative Commons Attribution 4.0 International free license was used to collect data from earthstat.org. Winter wheat and NPK fertilizer production areas were mapped utilizing the QGIS program version 3.12 “Białowieża”. The forecast for future yields was based on climatic indexes and the change in wheat production.
3. Results and Discussion
Russia’s invasion of Ukraine has caused commodity prices to rise sharply. Wheat becoming more expensive will undermine Middle Eastern budgets, possibly forcing subsidy cuts that could result in food shortages and even starvation. Russia is a major global supplier of fertilizer. As the crisis deepens, logistical flows may also be affected. Longer delivery times, transit detours, and higher ocean freight and insurance costs are likely. Imported goods will only be affected in two categories—oils, fats and animal and vegetable waxes, and edible raw materials, except fuels. Other product groups could be substituted relatively easily by Poland. In consequence, a conflict between these countries and the related losses in production and logistical difficulties could lead to an increase in cereal and oilseed prices worldwide.
3.1. The Fertilizer Production Supply Chain
Inappropriate use of artificial fertilizers and calcium substances, as well as plant protection products, leads to soil degradation [18,19,20,21,22]. In agriculture, the use of artificial and calcium fertilizers and pesticides has been reduced by almost half since the 1990s [23]. Wheat production has high potential in European countries and the United States, as shown in Figure 1. Many countries, including India and China, are plagued by barren and geotechnically degraded soils and poorly shaped humus layers. This method of management is especially important, given the current climate and energy policies of the European Union, as well as the commitments made regarding the share of renewable energy in its primary consumption. Figure 7 shows that yields in the studied countries changed by approximately 2% per year.
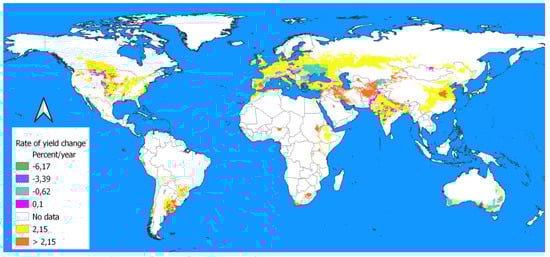
Figure 7.
Wheat yield change rate.
According to the data obtained for the study of the yield gap for wheat production, Ukraine has the largest potential (Figure 2). In addition, the land for perennial plantations will have to be acquired in many countries. It is also necessary to verify and analyze the proposals to replace set-aside areas with legume crops. If setting aside land poses a threat to food security, a derogation would follow. Set-asides are conditional because the strategies of the new NPK fertilizer application policy have different legal statuses to achieve efficiency in their use [24]. The conflict is likely to lead to a further increase in their prices, including ammonium nitrate, phosphorus, and potassium. Disruptions in exports and European sanctions will significantly reduce supply. Russia is responsible for fertilizer distribution. It is the second-largest producer of potash. It is also one of the major players in phosphate and ammonium (NH3) production [25].
The solution may be to diversify and disperse production and maintain small and medium-sized farms. It is also important to be more independent from the use of fertilizers employing precision farming, as the steppe agricultural areas in Ukraine [26] are becoming desertified [27]. Climate change [28], as a factor limiting agricultural production, must also be taken into account in the assessment of wheat resources [29,30,31,32,33,34], especially in terms of drought tolerance [35,36]. There are also serious threats to the supply of potash (potassium carbonate). Russia, like Belarus, is responsible for approximately 20 percent of world trade. Overall, the current conflict has the potential to fuel a new upward spiral in fertilizer prices. It will be especially marked for Brazil, the USA, Japan, France, and Poland (Figure 5).
3.2. Rising Fuel Prices and the Agricultural Energy Market
Currently, the Ukrainian–Russian conflict is causing serious problems for the energy market. The Russian oil industry is the second largest in the world. As oil prices rise, vegetable oils and oilseeds become more valuable. Increasing fuel prices are also a consequence of the conflict. The natural gas supply for Western Europe is dependent on Russia, as is the gas supply for Ukraine as well. Natural gas storage facilities in the European Union are supplied by pipelines located in Belarus, Ukraine, Poland, and Germany. This deficit will cause natural gas prices to increase if the flow of natural gas to Poland decreases, which will inevitably lead to high fertilizer prices. As shown in Figure 4, the greatest amount of phosphorus is applied in European countries, India, Mexico, the United States, and China. These countries will face higher costs of production regardless of whether they are producers or use their own resources. A phosphorus deficiency may also be present in these regions. To address this issue, these countries should develop an application plan that optimizes phosphorus fertilizer use. The macroeconomic impact of trade disruptions may be limited in theory. This study emphasizes the specific commodity structure of imports from Russia (oil and gas) and Ukraine (agricultural products and metals), which reflects the structure and role of these economies. Fertilizer prices could be reduced by maintaining energy prices and opening fertilizer trade internationally.
3.3. Conflict and Economic Consequences for the Agri-Food Economy
High food prices played a role in the outbreak of local revolts and protests that led to the Syrian food war [37,38]. Stagflation in Ukraine may result in even higher inflation and slower economic growth worldwide [39]. Notably, the problem with grain sales [40] is also caused by a reduction in animal production, especially pig production. Areas with pig bans produce not just meat, but also plants [41]. In recent years, the first disturbing reports have appeared concerning the impact of war on the European Union (EU) and global food supply chains [42], including possible shortages in production [43,44], exports, and further production and fertilizer consumption [45,46]. The EU is currently focusing on short-term remedies and will consider medium-term remedies later. One of them may be the use of legumes to reduce the use of nitrogen fertilizers [47]. The Food and Agriculture Organization of the United Nations (FAO) estimates that while for Europe, the Americas, or a large part of Asia it will simply mean an inconvenient rise in the prices of bakery and flour products, Africa (especially the northern countries) and the Middle East may face hunger. Supply disruptions could affect 8–13 million people. Food availability in many countries may be severely affected by the war in Ukraine and the disruption of food supply chains, especially wheat. Wheat imports are especially important to those who rely solely on imported grains. Despite the threat of mass displacement of the population, it is too early to say that this crisis will lead to a doomed migration. We live in uncertain times, and countermeasures are still possible. High variability in wheat yields over small areas has been reported. However, the greatest variability was reported in the United States. In contrast, a large effect of more than 0.75 was found for European countries (Figure 6).
3.4. The Current Market and Geopolitical Situation—General Opinion on Solutions for the Wheat Supply Crisis
In light of the war in Ukraine, which poses a real threat to Europe’s food security, the Council of Agriculture Ministers of the EU discussed the war’s impact on EU agriculture. Increasing agricultural production in Europe and around the world can provide food aid in many ways. The following help is offered:
- (a)
- Creating expert groups on behalf of the Commission to focus on certain issues in the current situation, e.g., support types provided, crisis preparedness, a group for important production and livestock sectors;
- (b)
- Announcing the EC’s work on implementing market-related exceptional measures that need to be established and finalized as soon as possible to provide aid;
- (c)
- Unlocking the potential of agricultural production, referring to currently important crops (the production cycle does not currently cover all crops), i.e., protein crops, especially for livestock feed; it is proposed to plant protein crops on fallow land.
Agricultural industries such as energy and fertilizer may be disrupted by the Ukrainian invasion, according to EU agricultural ministers. World prices have risen sharply since the conflict began. The model of nutrition that prevails in the world plays a crucial role in fighting hunger and poverty. In response, food and agricultural subsidies should be redirected to support transition in affluent countries to reduce greenhouse gas emissions and biodiversity loss. A significant reduction in fertilizer and pesticide use would be achieved. As a result, greenhouse gas emissions and biodiversity loss would also be drastically reduced. It would also require less fertilizer and pesticide, and existing fertilizers and pesticides would be more effective and less harmful.
The new nutritional model takes an organic, regenerative approach. The system would also result in less waste and excess production, and it would focus on providing a healthy diet to the world. It also affects markets where recent trends have shown historically high prices for key commodities and products. This increase can be attributed to the conflict in Ukraine. Map 7 shows that the wheat supply chain for India, one of the largest importers of this grain from Ukraine, could be distorted. A potential primary reason is the notable increase in wheat production in the Middle East (Figure 7).
3.5. The Effects of Climate Change on Global Wheat Production
A permanent and long-term threat to wheat production has been discussed by scientists [48]. Depending on the economic situation, including slowdowns or crises, price fluctuations may last 1–2 years. While climate change can have much fewer short-term effects, extreme weather events, water scarcity, and degradation of lands are more serious long-term impacts. Heat also adversely affects the physiology of crops, which, together with increasingly severe droughts, will lead to further drops in cereal yields. Europe has experienced a threefold increase in losses over the past 50 years [49,50]. According to FAO recommendations, to reduce conflict-induced shocks and remain resilient, countries that depend on food imports from Ukraine and the Russian Federation should find alternative wheat export suppliers [51,52]. The limiting factor for wheat exports in a military crisis is the agro-technological level. A suitable exception is Germany, with its wheat export capacity not declining substantially. However, countries including: Romania, Bulgaria, and Poland have lost export opportunities of 30% as compared to the situation prior to the war [53]. This is supported by the fact that the yield gap for Germany was 1.5 t/ha. Conversely, for Romania, Bulgaria and Poland, it ranged from 2.8 to 3.9 t/ha (Figure 2). Factors varying wheat production were also visible at the administrative level, as shown in Map 6 (Figure 6).
Annual per-capita wheat consumption can decline by 0.59% once the price of wheat increases by 1% [54]. Countries by food security situation and wheat share in daily total dietary energy per person consumption are: Afghanistan (61%) and Yemen (45.8%). Moderate food insecurity is recorded in Tajikistan (43.6%) and Egypt (35.3%). The results proved that these countries are exposed to the dynamics of changes in wheat production. Confirmation of the wheat shortage is evident in our map (Figure 6).
Based on Map 8, climate forecasts indicate fairly stable wheat cropping conditions (precipitation and temperature) for Ukraine (Figure 8). Another important producer and exporter like Russia may demonstrate these conditions being disturbed. For food security, stable climatic adaptation measures are important to maintain food systems in the event of a military threat in Ukraine.
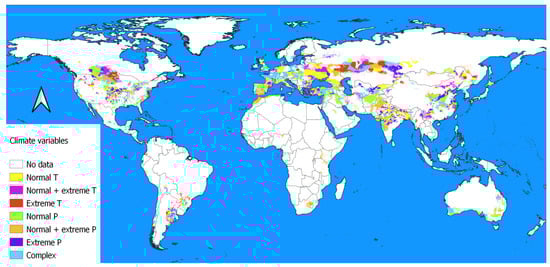
Figure 8.
Impact of selected extreme climatic factors on wheat production.
4. Summary
Global solutions to food and energy shortages need to be developed. This is especially relevant to food policy in the nations that lead grain production. By releasing accumulated wheat stocks, producers could increase their exports. Another important issue is reducing oil prices to decrease the cost of fuel, fertilizer, and supplies. Governments have to offer nutritional or financial and protective assistance to their citizens during the escalating energy crisis. The case study demonstrated that the countries leading wheat production are applying NPK fertilizers in substantial volumes. Our meta-analysis indicated that there is reasonable potential for ongoing cultivation, and only climate change could reduce wheat output. We intend to continue studying the development of wheat production and conduct an in-depth analysis of this issue. The course of the armed conflict in Ukraine and the impact of other factors that may disrupt the supply chain of this grain will be taken into account. We will also consider the impact of climatic factors and scenarios on wheat production. Only from such a time-expanded perspective will it be possible to provide full conclusions.
Author Contributions
Conceptualization, W.H. and D.B.; methodology, W.H. and D.B.; investigation, W.H. and D.B.; data curation W.H. and D.B.; writing—W.H.; writing—review and editing, D.B.; visualization W.H. and D.B. All authors have read and agreed to the published version of the manuscript.
Funding
This research was financed by a subsidy by the Ministry of Education and Science of the Republic of Poland for the University of Agriculture in Krakow for 2022.
Institutional Review Board Statement
Not applicable.
Informed Consent Statement
Not applicable.
Data Availability Statement
Not applicable.
Conflicts of Interest
The authors declare no conflict of interest.
References
- Panfilova, A.; Gamayunova, V.; Smirnova, I. Influence of fertilizing with modern complex organic-mineral fertilizers to grain yield and quality of winter wheat in the southern steppe of Ukraine. J. Agric. Sci. 2020, 2, 196–201. [Google Scholar]
- Gramlich, A.; Stoll, S.; Stamm, C.; Walter, T.; Prasuhn, V. Effects of artificial land drainage on hydrology, nutrient and pesticide fluxes from agricultural fields—A review. Agric. Ecosyst. Environ. 2018, 266, 84–99. [Google Scholar] [CrossRef]
- Möhring, N.; Finger, R. Pesticide-free but not organic: Adoption of a large-scale wheat production standard in Switzerland. Food Policy 2022, 106, 102188. [Google Scholar] [CrossRef]
- Bais-Moleman, A.L.; Schulp, C.J.; Verburg, P.H. Assessing the environmental impacts of production-and consumption-side measures in sustainable agriculture intensification in the European Union. Geoderma 2019, 338, 555–567. [Google Scholar] [CrossRef]
- Mbah, R.E.; Wasum, D.F. Russian-Ukraine 2022 War: A review of the economic impact of Russian-Ukraine crisis on the USA, UK, Canada, and Europe. Adv. Soc. Sci. Res. J. 2022, 9, 144–153. [Google Scholar] [CrossRef]
- Pörtner, L.M.; Lambrecht, N.; Springmann, M.; Bodirsky, B.L.; Gaupp, F.; Freund, F.; Gabrysch, S. We need a food system transformation—In the face of the Russia-Ukraine war, now more than ever. One Earth 2022, 5, 470–472. [Google Scholar] [CrossRef]
- FAO. icense: CC BY-NC-SA 3.0 IGOFAOSTAT. Available online: https://www.fao.org/faostat/en/#data/TCL (accessed on 3 June 2022).
- Liadze, I.; Macchiarelli, C.; Mortimer-Lee, P.; Juanino, P.S. The economic costs of the Russia-Ukraine conflict. NIESR Policy Paper 2022, 32, 1–10. [Google Scholar]
- Kovalenko, N.; Kovalenko, V.; Hutsol, T.; Ievstafiieva, Y.; Polishchuk, A. Economic efficiency and internal competitive advantages of grain production in the central region of Ukraine. Agric. Eng. 2021, 25, 51–62. [Google Scholar] [CrossRef]
- Svanidze, M.; Đurić, I. Global wheat market dynamics: What is the role of the EU and the Black Sea wheat exporters? Agriculture 2021, 11, 799. [Google Scholar] [CrossRef]
- Huzsvai, L.; Zsembeli, J.; Kovács, E.; Juhász, C. Response of Winter Wheat (Triticum aestivum L.) Yield to the Increasing Weather Fluctuations in a Continental Region of Four-Season Climate. Agronomy 2022, 12, 314. [Google Scholar] [CrossRef]
- Ramadas, S.; Kumar, T.K.; Singh, G.P. Wheat production in India: Trends and prospects. In Recent Advances in Grain Crops Research; IntechOpen: Rijeka, Croatia, 2019; Chapter 6. [Google Scholar]
- Zampieri, M.; Toreti, A.; Ceglar, A.; Naumann, G.; Turco, M.; Tebaldi, C. Climate resilience of the top ten wheat producers in the Mediterranean and the Middle East. Reg. Environ. Chang. 2020, 20, 41. [Google Scholar] [CrossRef]
- Osendarp, S.; Verburg, G.; Bhutta, Z.; Black, R.E.; de Pee, S.; Fabrizio, C.; Ruel, M.T. Act now before Ukraine war plunges millions into malnutrition. Nature 2022, 604, 620–624. [Google Scholar] [CrossRef] [PubMed]
- Ray, D.K.; Gerber, J.S.; MacDonald, G.K.; West, P.C. Climate variation explains a third of global crop yield variability. Nat. Commun. 2015, 6, 5989. [Google Scholar] [CrossRef] [PubMed]
- West, P.C.; Gerber, J.S.; Mueller, N.D.; Brauman, K.A.; Carlson, K.M.; Cassidy, E.S.; Engstrom, P.M.; Johnston, M.; MacDonald, G.K.; Ray, D.K.; et al. Leverage points for improving food security and the environment. Science 2014, 345, 325–328. [Google Scholar] [CrossRef]
- Mueller, N.D.; Gerber, J.S.; Johnston, M.; Ray, D.K.; Ramankutty, N.; Foley, J.A. Closing yield gaps through nutrient and water management. Nature 2012, 490, 254–257. [Google Scholar] [CrossRef]
- Yang, T.; Zhou, Q.; Wang, Q.; Wang, X.; Cai, J.; Huang, M.; Jiang, D. Effects of nitrogen fertilizer on quality characteristics of wheat with the absence of different individual high-molecular-weight glutenin subunits (HMW-GSs). Int. J. Mol. Sci. 2022, 23, 2178. [Google Scholar] [CrossRef]
- Chai, Y.; Chai, Q.; Han, F.; Li, Y.; Ma, J.; Li, R.; Chai, S. Increasing yields while reducing soil nutrient accumulation by straw strip mulching in the dryland wheat (Triticum aestivum L.) cropping system of Northwest China. Agric. Ecosyst. Environ. 2022, 326, 107797. [Google Scholar] [CrossRef]
- Alghamdi, R.S.; Cihacek, L. Do post-harvest crop residues in no-till systems provide for nitrogen needs of following crops? J. Agron. 2022, 114, 835–852. [Google Scholar] [CrossRef]
- Agovino, M.; Casaccia, M.; Ciommi, M.; Ferrara, M.; Marchesano, K. Agriculture, climate change and sustainability: The case of EU-28. Ecol. Indic. 2019, 105, 525–543. [Google Scholar] [CrossRef]
- Darzi-Naftchali, A.; Mokhtassi-Bidgoli, A. Saving environment through improving nutrient use efficiency under intensive use of agrochemicals in paddy fields. Sci. Total Environ. 2022, 822, 153487. [Google Scholar] [CrossRef]
- Franch, B.; Vermote, E.F.; Skakun, S.; Roger, J.C.; Becker-Reshef, I.; Murphy, E.; Justice, C. Remote sensing based yield monitoring: Application to winter wheat in United States and Ukraine. J. Appl. Earth. Obs. Geoinf. 2019, 76, 112–127. [Google Scholar] [CrossRef]
- Nordhagen, S.; Lambertini, E.; DeWaal, C.S.; McClafferty, B.; Neufeld, L.M. Integrating nutrition and food safety in food systems policy and programming. Glob. Food Sec. 2022, 32, 100593. [Google Scholar] [CrossRef]
- Rawal, N.; Pande, K.R.; Shrestha, R.; Vista, S.P. Nutrient use efficiency (NUE) of wheat (Triticum aestivum L.) as affected by NPK fertilization. PLoS ONE 2022, 17, e0262771. [Google Scholar] [CrossRef] [PubMed]
- Ben Hassen, T.; El Bilali, H. Impacts of the Russia-Ukraine war on global food security: Towards more sustainable and resilient food systems? Foods 2022, 11, 2301. [Google Scholar] [CrossRef]
- Ilinova, A.; Dmitrieva, D.; Kraslawski, A. Influence of COVID-19 pandemic on fertilizer companies: The role of competitive advantages. Resour. Policy 2021, 71, 102019. [Google Scholar] [CrossRef]
- Polovyy, V.; Hnativ, P.; Chojnicki, J.; Lahush, N.; Ivaniuk, V.; Avhustynovych, M.; Lukyanik, M. Changes in the agrochemical indices of Luvic Greyzemic Phaeozems under the impact of west Ukraine climate aridization. Soil Sci. Ann. 2022, 73, 146855. [Google Scholar] [CrossRef]
- Le Gouis, J.; Oury, F.X.; Charmet, G. How changes in climate and agricultural practices influenced wheat production in Western Europe. J. Cereal Sci. 2020, 93, 102960. [Google Scholar] [CrossRef]
- Rapacz, M.; Macko-Podgórni, A.; Jurczyk, B.; Kuchar, L. Modeling wheat and triticale winter hardiness under current and predicted winter scenarios for Central Europe: A focus on deacclimation. Agric. For. Meteorol. 2022, 313, 108739. [Google Scholar] [CrossRef]
- Semenov, M.A.; Stratonovitch, P.; Alghabari, F.; Gooding, M.J. Adapting wheat in Europe for climate change. J. Cereal Sci. 2014, 59, 245–256. [Google Scholar] [CrossRef]
- Svetlov, N.M.; Siptits, S.O.; Romanenko, I.A.; Evdokimova, N.E. The effect of climate change on the location of branches of agriculture in Russia. Stud. Russ. Econ. Dev. 2019, 30, 406–418. [Google Scholar] [CrossRef]
- Trnka, M.; Rötter, R.P.; Ruiz-Ramos, M.; Kersebaum, K.C.; Olesen, J.E.; Žalud, Z.; Semenov, M.A. Adverse weather conditions for European wheat production will become more frequent with climate change. Nat. Clim. Chang. 2014, 4, 637–643. [Google Scholar] [CrossRef]
- Neupane, D.; Adhikari, P.; Bhattarai, D.; Rana, B.; Ahmed, Z.; Sharma, U.; Adhikari, D. Does climate change affect the yield of the top three cereals and food security in the World? Earth 2022, 3, 45–71. [Google Scholar] [CrossRef]
- Oleksiak, T.; Spyroglou, I.; Pacoń, D.; Matysik, P.; Pernisová, M.; Rybka, K. Effect of drought on wheat production in Poland between 1961 and 2019. Crop. Sci. 2022, 62, 728–743. [Google Scholar] [CrossRef]
- Senapati, N.; Stratonovitch, P.; Paul, M.J.; Semenov, M.A. Drought tolerance during reproductive development is important for increasing wheat yield potential under climate change in Europe. J. Exp. Bot. 2019, 70, 2549–2560. [Google Scholar] [CrossRef] [PubMed]
- Paulson, N.; Janzen, J.; Zulauf, C.; Swanson, K.; Schnitkey, G. Revisiting Ukraine, Russia, and Agricultural Commodity Markets. Farmdoc. Dly. 2022, 12. [Google Scholar]
- Linke, A.M.; Ruether, B. Weather, wheat, and war: Security implications of climate variability for conflict in Syria. J. Peace Res. 2021, 58, 114–131. [Google Scholar] [CrossRef]
- Sulaiman, N.; Pieroni, A.; Sõukand, R.; Polesny, Z. Food Behavior in Emergency Time: Wild Plant Use for Human Nutrition during the Conflict in Syria. Foods 2022, 11, 177. [Google Scholar] [CrossRef]
- Sharma, I.; Tyagi, B.S.; Singh, G.; Venkatesh, K.; Gupta, O.P. Enhancing wheat production-A global perspective. Indian J. Agric. Sci. 2015, 85, 3–13. [Google Scholar]
- Skrypnyk, A.; Klymenko, N.; Tuzhyk, K.; Galaieva, L.; Rohoza, K. Prerequisites and prospects for sustainable development of grain production in Ukraine. Indian J. Agric. Sci. 2021, 7, 90–106. [Google Scholar] [CrossRef]
- Trachova, D.; Belova, I.; Stender, S.; Tomchuk, O.; Danilochkina, O. Rationale for the need to use blockchain technology to record and control operations for the export of grain (the example of Ukraine). Indep. J. Manag. Prod. 2022, 13, s347–s360. [Google Scholar] [CrossRef]
- Veninga, W.; Ihle, R. Import vulnerability in the Middle East: Effects of the Arab spring on Egyptian wheat trade. Food Secur. 2018, 10, 183–194. [Google Scholar] [CrossRef]
- Verma, S.P.; Pathak, V.N.; Verma, O.P. Interrelationship between yield and its contributing traits in wheat (Triticum aestivum L). Int. J. Curr. Microbiol. Appl. Sci. 2019, 8, 3209–3215. [Google Scholar] [CrossRef]
- Yan, S.; Wu, Y.; Fan, J.; Zhang, F.; Guo, J.; Zheng, J.; Wu, L. Quantifying grain yield, protein, nutrient uptake and utilization of winter wheat under various drip fertigation regimes. Agric. Water Manag. 2022, 261, 107380. [Google Scholar] [CrossRef]
- Zhai, L.; Yuan, S.; Feng, Y. The economic effects of export restrictions imposed by major grain producers. Agric. Econ. 2022, 68, 11–19. [Google Scholar] [CrossRef]
- Zhang, J.J.; He, P.; Xu, X.P.; Ding, W.C.; Ullah, S.; Wang, Y.L.; Zhou, W. Nutrient expert improves nitrogen efficiency and environmental benefits for winter wheat in China. Agron. J. 2018, 110, 696–706. [Google Scholar] [CrossRef]
- Horodyska, I.M.; Ternovyi, Y.; Chub, A.; Lishchuk, A.; Draga, M. Technologies of protection and nutrition in agrophytocenoses of legumes for organic seed production. Environ. Eng. Manag. J. 2021, 77, 47–58. [Google Scholar] [CrossRef]
- Vita, P.D.; Taranto, F. Durum wheat (Triticum turgidum ssp. durum) breeding to meet the challenge of climate change. In Advances in Plant Breeding Strategies: Cereals; Springer: Cham, Switzerland, 2019; pp. 471–524. [Google Scholar]
- Brás, T.A.; Seixas, J.; Carvalhais, N.; Jägermeyr, J. Severity of drought and heatwave crop losses tripled over the last five decades in Europe. Environ. Res. Lett. 2021, 16, 065012. [Google Scholar] [CrossRef]
- Rozhkov, A.O.; Spilnyk, S.S.; Gepenko, O.V.; Didukh, N.O.; Derevyanko, I.O.; Stankevych, S.V. Influence on fertilization regime on spring barley yields in the southern steppe of Ukraine. Ukr. J. Ecol. 2021, 11, 400–406. [Google Scholar]
- FAO. The Importance of Ukraine and the Russian Federation for Global. Agricultural Markets and the Risks Associated with the Current Conflict. 2022. Available online: https://www.fao.org/3/cb9236en/cb9236en.pdf. (accessed on 25 March 2022).
- Júnior, R.d.S.N.; Ewert, F.; Webber, H.; Martre, P.; Hertel, T.W.; van Ittersum, M.K.; Asseng, S. Needed global wheat stock and crop management in response to the war in Ukraine. Glob. Food Secur. 2022, 35, 100662. [Google Scholar] [CrossRef]
- Mottaleb, K.A.; Kruseman, G.; Snapp, S. Potential impacts of Ukraine-Russia armed conflict on global wheat food security: A quantitative exploration. Glob. Food Sec. 2022, 35, 100659. [Google Scholar] [CrossRef]


Publisher’s Note: MDPI stays neutral with regard to jurisdictional claims in published maps and institutional affiliations. |
© 2022 by the authors. Licensee MDPI, Basel, Switzerland. This article is an open access article distributed under the terms and conditions of the Creative Commons Attribution (CC BY) license (https://creativecommons.org/licenses/by/4.0/).