Article

Multi-Parameter Analysis of Groundwater Resources Quality in the Auvergne-Rhône-Alpes Region (France) Using a Large Database

1
Geosciences, Water and Environment Laboratory, Faculty of Sciences Rabat, Mohammed V University, Rabat 10000, Morocco
2
Laboratoire de Géosciences, Faculté des Sciences, Université Ibn Tofaïl, BP 133, Kénitra 14000, Morocco
3
Mixed Research Unit EMMAH (Environnement Méditerranéen et Modélisation des Agro-Hydrosystèmes), Hydrogeology Laboratory, Avignon University, 84916 Avignon, France
4
Faculté des Sciences et Techniques (FSTBM), BP 523, Beni Mellal 23000, Morocco
5
Institut de Recherche pour le Développement, Géoscience Environnement Toulouse, CNRS, University of Toulouse, Observatoire Midi-Pyrénées, UMR 5563, 14 Avenue Edouard Belin, 31400 Toulouse, France
*
Author to whom correspondence should be addressed.
Resources 2023, 12(12), 143; https://doi.org/10.3390/resources12120143
Submission received: 5 November 2023 / Revised: 28 November 2023 / Accepted: 6 December 2023 / Published: 8 December 2023

Abstract

:
The aim of this work is to gain a better understanding of the diversity of groundwater resource quality in the Auvergne-Rhône-Alpes region (France) using the national Sise-Eaux database. Three matrices were extracted, which included a hollow matrix (approximately 120,000 observations and 21 variables) and two complete matrices (8078 observations with 13 variables each and 150 observations with 20 variables each, respectively). The mapping of these parameters, the chemical profiles of the water, and the characteristics of the variograms make it possible to estimate the importance of the temporal variance compared with the spatial variance. This distinction led to a typology separating 4 groups of chemical parameters and 2 groups of bacteriological parameters, highlighting the information redundancies linking several parameters. A PCA was used to considerably reduce the size of the hyperspace of the data. The study of the factorial axes combined with their distribution over the study area made it possible to discriminate and identify certain mechanisms for acquiring the physico-chemical and bacteriological characteristics of groundwater, the importance of lithology, the components of faecal contamination, and the role of environmental conditions. A typology of the parameters by hierarchical clustering on the major part of the information makes it possible to reduce the information to that carried by a few representative parameters. This work is a new step in understanding the diversity of groundwater resources in general, with a view to more targeted monitoring based on this diversity.

1. Introduction

The sustainability of groundwater resources is not an intrinsic property of a physical groundwater system, but rather a combination of its properties, its environment, and the constraints exerted on it [1]. These constraints may be of anthropogenic origin (such as water extraction or pollution) or natural (for example, climatic variations). The quality of groundwater should be seen as a record of what is happening on the surface (livestock farming, agricultural, or urban pollution), in the soil (filtration or not, changes in CO2 partial pressure and organic carbon, impact of soil bacteria), and in the deep circulation (water–rock interaction). It is therefore a mine of information, incorporating everything that happens upstream and throughout the catchment area [2,3]. Groundwater services are generally only associated with the extraction of groundwater (supply services), as groundwater is considered to be of good quality because it is less exposed than surface water to various forms of pollution. Unfortunately, this is less and less the case, as various potential threats are becoming increasingly widespread throughout the world [4], and groundwater resource sustainability is now placed in the spotlight [5,6,7].
Problems related to groundwater resources are generally associated with long-term effects [8]. In this context, monitoring can provide essential data to characterise, analyse, and record changes in aquifers, which can help us to better understand the complexity and uncertainties associated with groundwater resources [9,10,11]. According to Daughney et al. [12], the objectives of a regional or national groundwater monitoring network can be summarised in 4 main points:
  • Provide an overview of water quality at the appropriate scale (catchment, aquifer or administrative boundaries, on a regional or national scale);
  • Identify trends in quality as early as possible;
  • Link observed pollution patterns to land use in order to identify likely sources;
  • Guide and support the design and implementation of programs of measures by providing appropriate data.
The concept of water quality is already complex in itself, as it involves a variety of assessment methods: microbiological, radiological, organic or inorganic chemical aspects, etc., each of these fields having its own mechanisms for acquiring quality and its own scales of spatial variability. The majority of data on changes in groundwater quantity and quality are dispersed, and major characteristics such as heavy metals and organic compounds are often even absent. These are constraints for the scientists and institutions responsible for maintaining the quality of the resource [13,14]. However, in France, the Regional Health Agencies have been concentrating a large amount of information on the quality of water resources for over 30 years in a national database [15,16] that is still seldom used by scientists: the Sise-Eaux database (https://data.eaufrance.fr/concept/sise-eaux, accessed on 15 March 2021). On a regional scale (around 75,000 km²), due to the size of the areas concerned, there is a high probability of the existence of a wide diversity of natural environments, including lithological, geomorphological, pedological, and altitudinal, and each of these environments may present its own specificity in terms of the mechanisms that can affect a given quality parameter. In such a context, it is difficult to define a relevant scale for surveillance and appropriate monitoring of groundwater quality by health agencies. In recent years, our research group has focused on finding such a scale. Initial work carried out in the Provence-Alpes-Côte d’Azur region highlighted the fact that the heterogeneity of natural environments on a regional scale masks some of the major processes involved in acquiring quality [17]. The development of groups of homogeneous groundwater bodies after reducing the dimensionality of the data hyperspace has considerably improved this point [18], but the presence of extreme values in the dataset exaggerates the impact of certain parameters, which was resolved by logarithmic conditioning of the data [19,20]. Discriminating spatial and temporal variance has made it possible to highlight seasonal mechanisms or long-term trends [20,21,22]. Finally, quantification of the information initially contained in the datasets and lost when grouped into homogeneous bodies of water made it possible to validate the proposed analysis method [23,24] on the scale of small to large regions (8000 to 80,000 km²). The grouping method works on regions of variable size, i.e., medium-sized and fairly contrasted (Provence-Alpes-Côte d’Azur) or larger but moderately contrasted (Occitanie) from a lithological, altitudinal, environmental, or land-use point of view. In this context, the aim of this work is twofold. Firstly, to give continuity to the development of this procedure for analysing data from the Sise-Eaux database by testing it on a large and highly contrasting region—the Auvergne-Rhône-Alpes region. In addition, efforts to date have focused on identifying and understanding the mechanisms by which water characteristics are acquired, with a view to condensing the information conveyed by the database. This concentration of information highlights a redundancy of information within the microbiological and physico-chemical quality parameters. The second aspect is therefore to establish a typology of quality parameters based on structures or associations between these parameters, which differ in terms of spatial range, seasonality, or long-term behaviour [20], the ultimate aim being to facilitate quality surveillance and monitoring by the Regional Health Agencies.

2. Materials and Methods

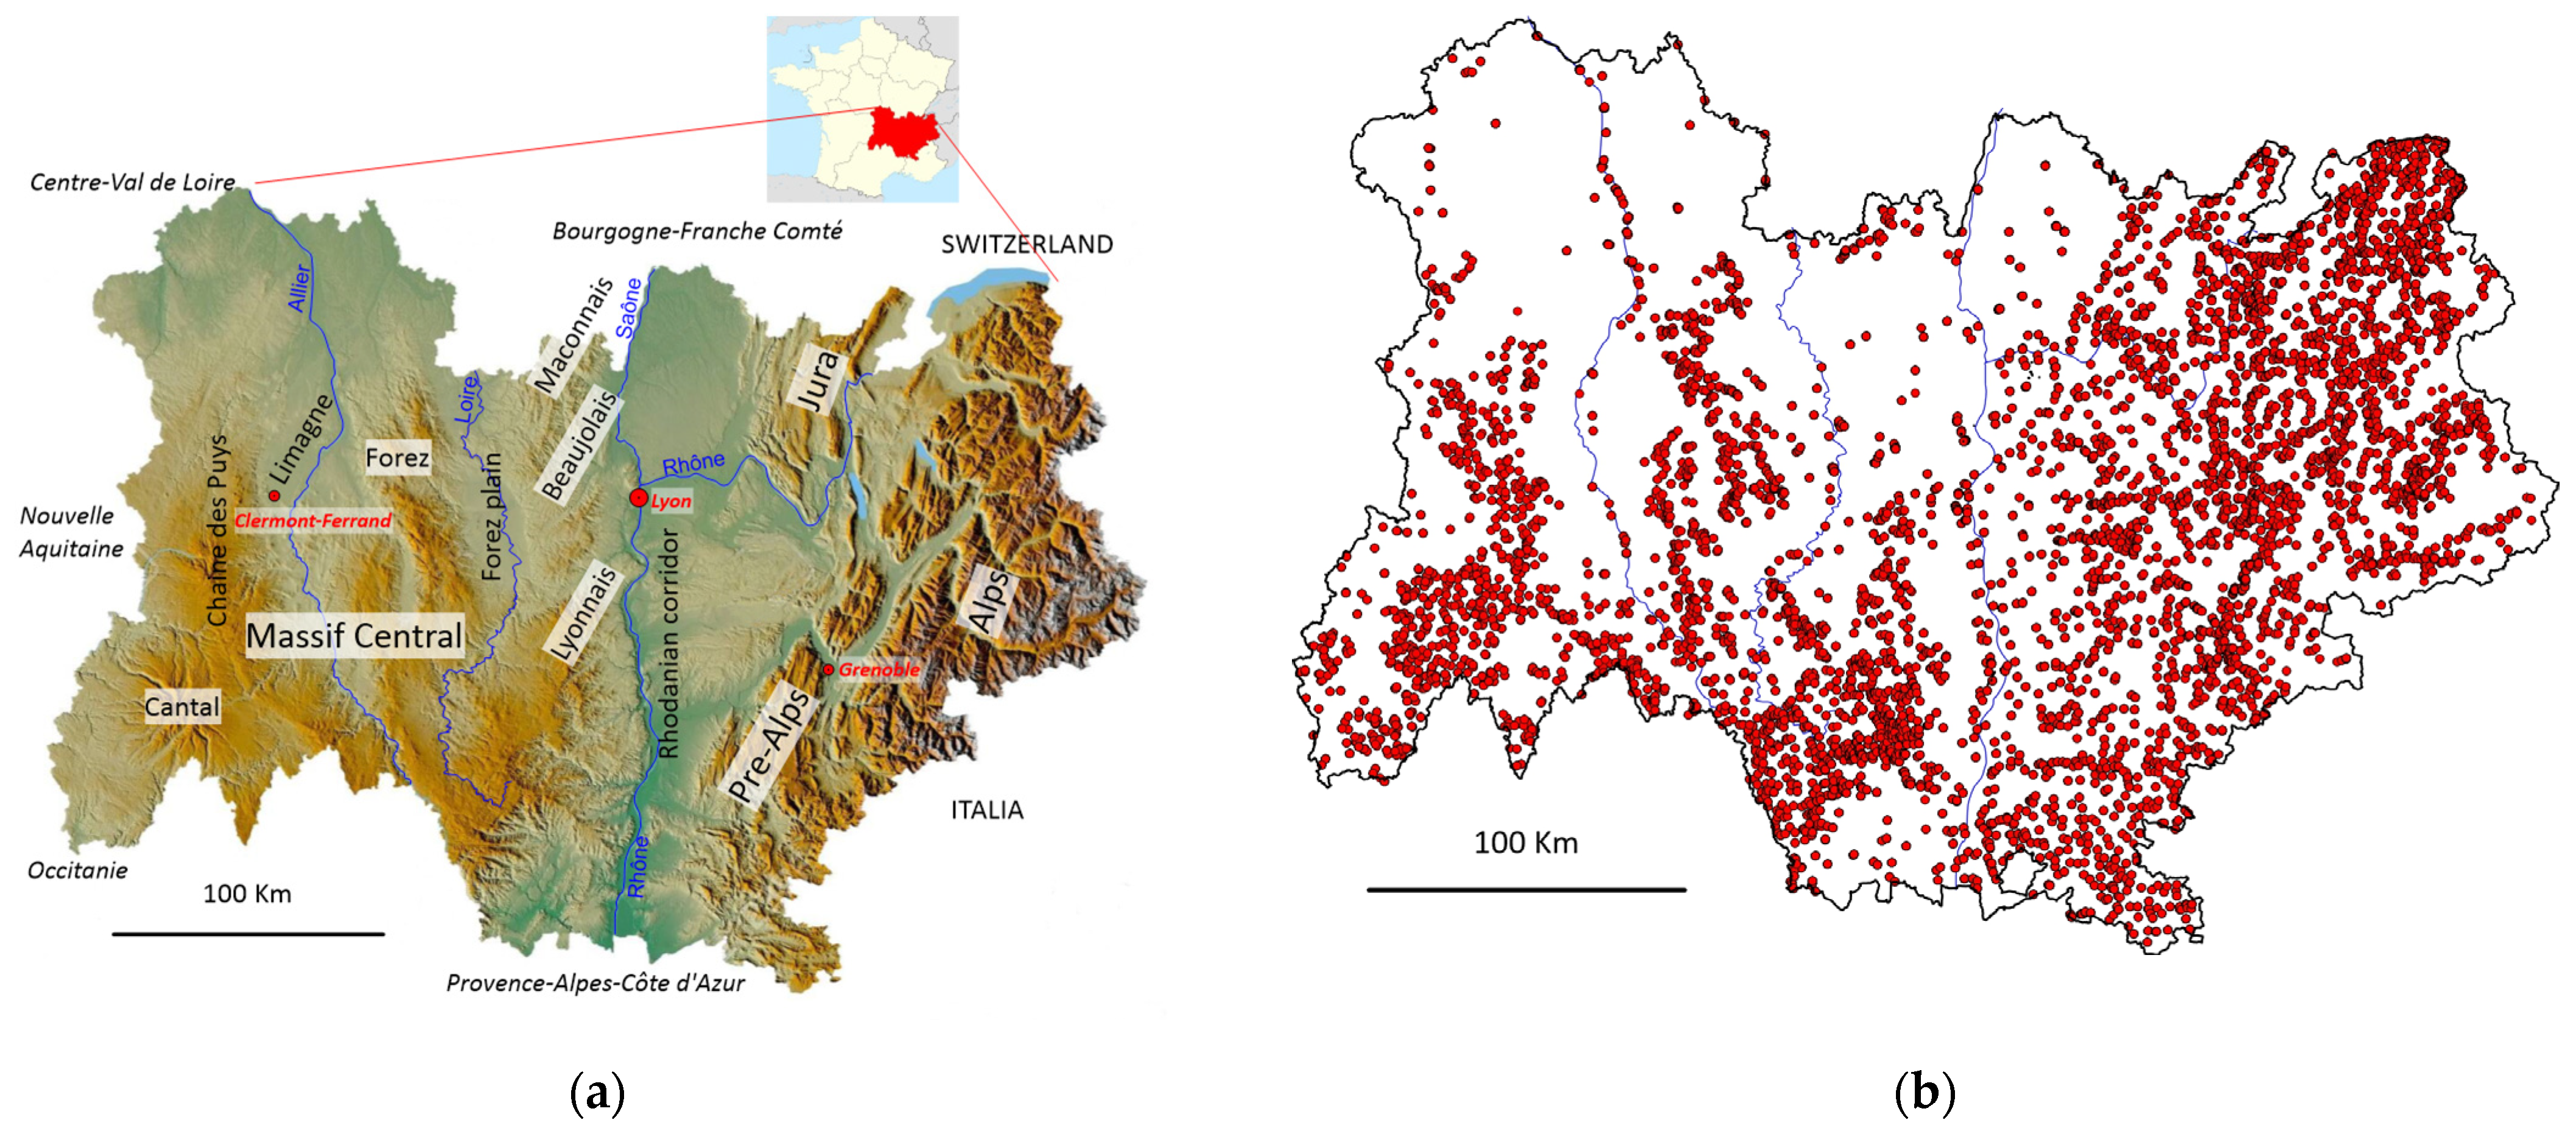
2.1. Auvergne-Rhône-Alpes Region

Auvergne-Rhône-Alpes (whose administrative capital is Lyon) is located in the south-east quarter of France, covering an area of 69,711 km2 and with a population of around 8 million. It is bordered by five other administrative regions: Bourgogne-Franche-Comté to the north, Centre-Val de Loire to the north-west, Nouvelle-Aquitaine to the west, Occitanie to the south-west, and Provence-Alpes-Côte d’Azur to the south-east (Figure 1). It also borders Italy to the east and Switzerland to the north-east. The region has a complex geology, being located on three major structural units: the Massif Central, the Alps, and the Rhône corridor. To the east, the Alps, with several peaks over 4000 m, are criss-crossed by deep valleys and bordered by the limestone Pre-Alps. Their fragmentation, like the numerous faults that run through them, bears witness to the tectonic upheavals associated with the uplifting of the Alps and their westward thrusting. Further west, the eastern edge of the Massif Central is made up of primary rocks in a horst position dominating the grabens of the Rhône and Saône valleys, the Forez plain (Loire valley), and the Limagne plain (Allier valley), filled in by Tertiary and Quaternary sediments. The extreme south-west of the region is marked by the volcanic terrain of the Cantal and the Chaine des Puits. This geological complexity gives the region a wealth of mineral resources, including coal (Saint-Etienne coalfield), metals, uranium, kaolin, and alluvial deposits, some of which have been mined for a very long time. The management of former metals (silver lead, cadmium, etc.) or uranium production sites is often a major environmental health issue for the areas concerned. The region also has a diverse climate, with an oceanic climate in the north-west, a semi-continental climate in the centre, a mountainous climate in the west, east and north-east, and a Mediterranean climate in the centre-south. Finally, the region straddles three river basins: Adour-Garonne in the south-west, Loire-Bretagne in the north and north-west, and Rhône-Méditerranée.

2.2. The Sise-Eaux Database

The Sise-Eaux database (https://data.eaufrance.fr/concept/sise-eaux, accessed on 15 March 2021) records the quality of surface water and groundwater intended for human consumption. It is essentially supplied with the results of health inspections carried out by the Regional Health Agencies (ARS) [15,16] on water points supplying local communities. On a national scale, approximately 32,000 water catchments (96% groundwater and 4% surface water) are monitored more or less regularly as required. The database covers both untreated water, known as “raw water” taken from the catchment or borehole, and treated water, i.e., disinfected through chlorination or another process, and possibly decanted or filtered. In this work, only untreated raw water was used. The water samples were collected and analysed by the ARS service provider laboratories, approved by the Ministry of Health, and have all the international certifications for analytical quality. For each sample collected, the number of parameters analysed varies depending on whether it is a simple control (few parameters measured, i.e., faecal bacteriology and major ions), more targeted monitoring (a few additional parameters), or a complete analysis when it is the first time it has been analysed (with several hundred parameters including pesticides, metals, metalloids, trace elements, and more complete bacteriology). As a result, groundwater data extractions from this database generate hollow matrices. Extraction for the period from July 1990 to September 2020 for the entire Auvergne-Rhône-Alpes region yielded a hollow matrix of 114,033 observations (water samples) on which 21 parameters were measured, namely major ions, electrical conductivity at 25 °C (EC), pH at sample temperature, NO3, NO2, Fe, Mn, As, Enterococcus (Ent.), Escherichia coli (E. coli), Aerobic bacteria revivable at 22 °C—72 h (Aer.22) and at 37 °C—24 h (Aer.37), total coliforms (Col.), sulphite-reducing bacteria, and spores (SO3red). This matrix involves 6336 geo-referenced sampling points, i.e., an average of 18 water samples analysed per sampling point. As some of the following calculations could not be carried out on a hollow matrix, two full matrices were generated, on the one hand by eliminating infrequently analysed parameters and maximising the number of observations, and on the other hand by eliminating observations with few analysed parameters and maximising the number of parameters. The first is a full matrix (matrix M1) comprising 8078 observations and 13 parameters (major ions, EC, NO3, Ent., E. coli, pH, Fe), and the second (matrix M2) comprises 150 observations and 20 parameters. The 7 additional parameters were SO3red, Aer.22, Aer.37, Col., NO2, As, Mn. In the following, a distinction will be made between the levels analysed in the samples collected and the variable representing these values, e.g., NO3 is the parameter representing nitrate ion levels NO3.

2.3. Data Conditioning

Previous work on extractions from the Sise-Eaux database highlighted the need for a logarithmic transformation of the data [19] using the formula y = log10 (x + DL), where x and DL represent the measurement of the physico-chemical or bacteriological parameter X and its detection limit, respectively. Only the pH, which already corresponds to the log transformation of H3O+ chemical activity, was kept unconditioned. The aim of this log transformation was to bring the distributions of each parameter closer to a normal distribution, but, above all, to limit the weight of extreme values likely to mask, during analysis, certain processes responsible for the variability of water quality within the data set [20,22]. In addition, as electrical conductivity is strongly correlated with dissolved ionic charge, and therefore with anionic and cationic charge, the ratios of major ions to electrical conductivity (Na+/CE, Cl/CE, etc.) were calculated and mapped in order to represent the spatial distribution of the anionic and cationic profiles of the waters. For the sake of consistency with the logarithmic conditioning of the data, the log (X/EC) variables, with X major ion, will be used to visualise the groundwater chemical profile.

2.4. Principal Component Analysis

A principal component analysis (PCA) was performed on the log-transformed data and on the full matrix with the aim of reducing the dimension of the data hyperspace [17] and identifying and classifying the sources of variability within the dataset [25]. The PCA was based on the correlation matrix, thus considering reduced-centred variables, which makes it possible to integrate parameters of very diverse natures and units. In addition, it was performed by diagonalizing the correlation matrix. In this condition, the factorial axes are orthogonal to each other, and therefore theoretically associated with independent processes responsible for the variability of water quality. Factorial axes accounting for around 90% of the information were retained. The remaining factorial axes, which explain a small percentage of the variance and are generally considered statistical noise [26], were eliminated.

2.5. Parameters Hierarchical Clustering

Unsupervised agglomerative hierarchical clustering (AHC) [27,28] was carried out on bacteriological and physico-chemical parameters on the basis of the first factorial axes of the PCA in order to understand the diversity and similarities in the distribution of parameters on a regional scale.

2.6. Variograms and Kriging

In order to retain as much information as possible for the mapping of each parameter, the hollow matrix was used for the calculations. By way of indication, the number of analysed water samples used to calculate variograms and maps for major elements, EC, E. coli, and Enterococcus varies between 35,000 and 40,000 data per parameter. This number decreases slightly for nitrates, metals (Fe, Mn), and coliform, revivable, and sulphite-reducing bacteria. Variograms measure the change in semi-variance between pairs of points as a function of the distance separating them [29]. However, in the dataset extracted, samples were taken at different points and on different dates, thus including spatial and temporal variability [20]. In this context, the variograms were calculated in two ways, i.e., using all the data (VarTot), or using the mean values at each sampling point (VarMean). In the second case, the variograms reflect a semi-variance less influenced by temporal variability than in the first. However, the VarMean variograms calculated in this way inevitably include a proportion of temporal variability, albeit reduced, because the sampling was spread over 30 years and was not synchronous at the various points. Raw and directional variograms with a rotation step of 15° were calculated to detect any anisotropy in the distribution of parameter values. Two directions were selected, corresponding to the maximisation of the differences between the directional variograms and the orthogonal direction. Kriging maps were calculated after fitting standard functions to the experimental variograms using the best linear unbiased estimator.

3. Results

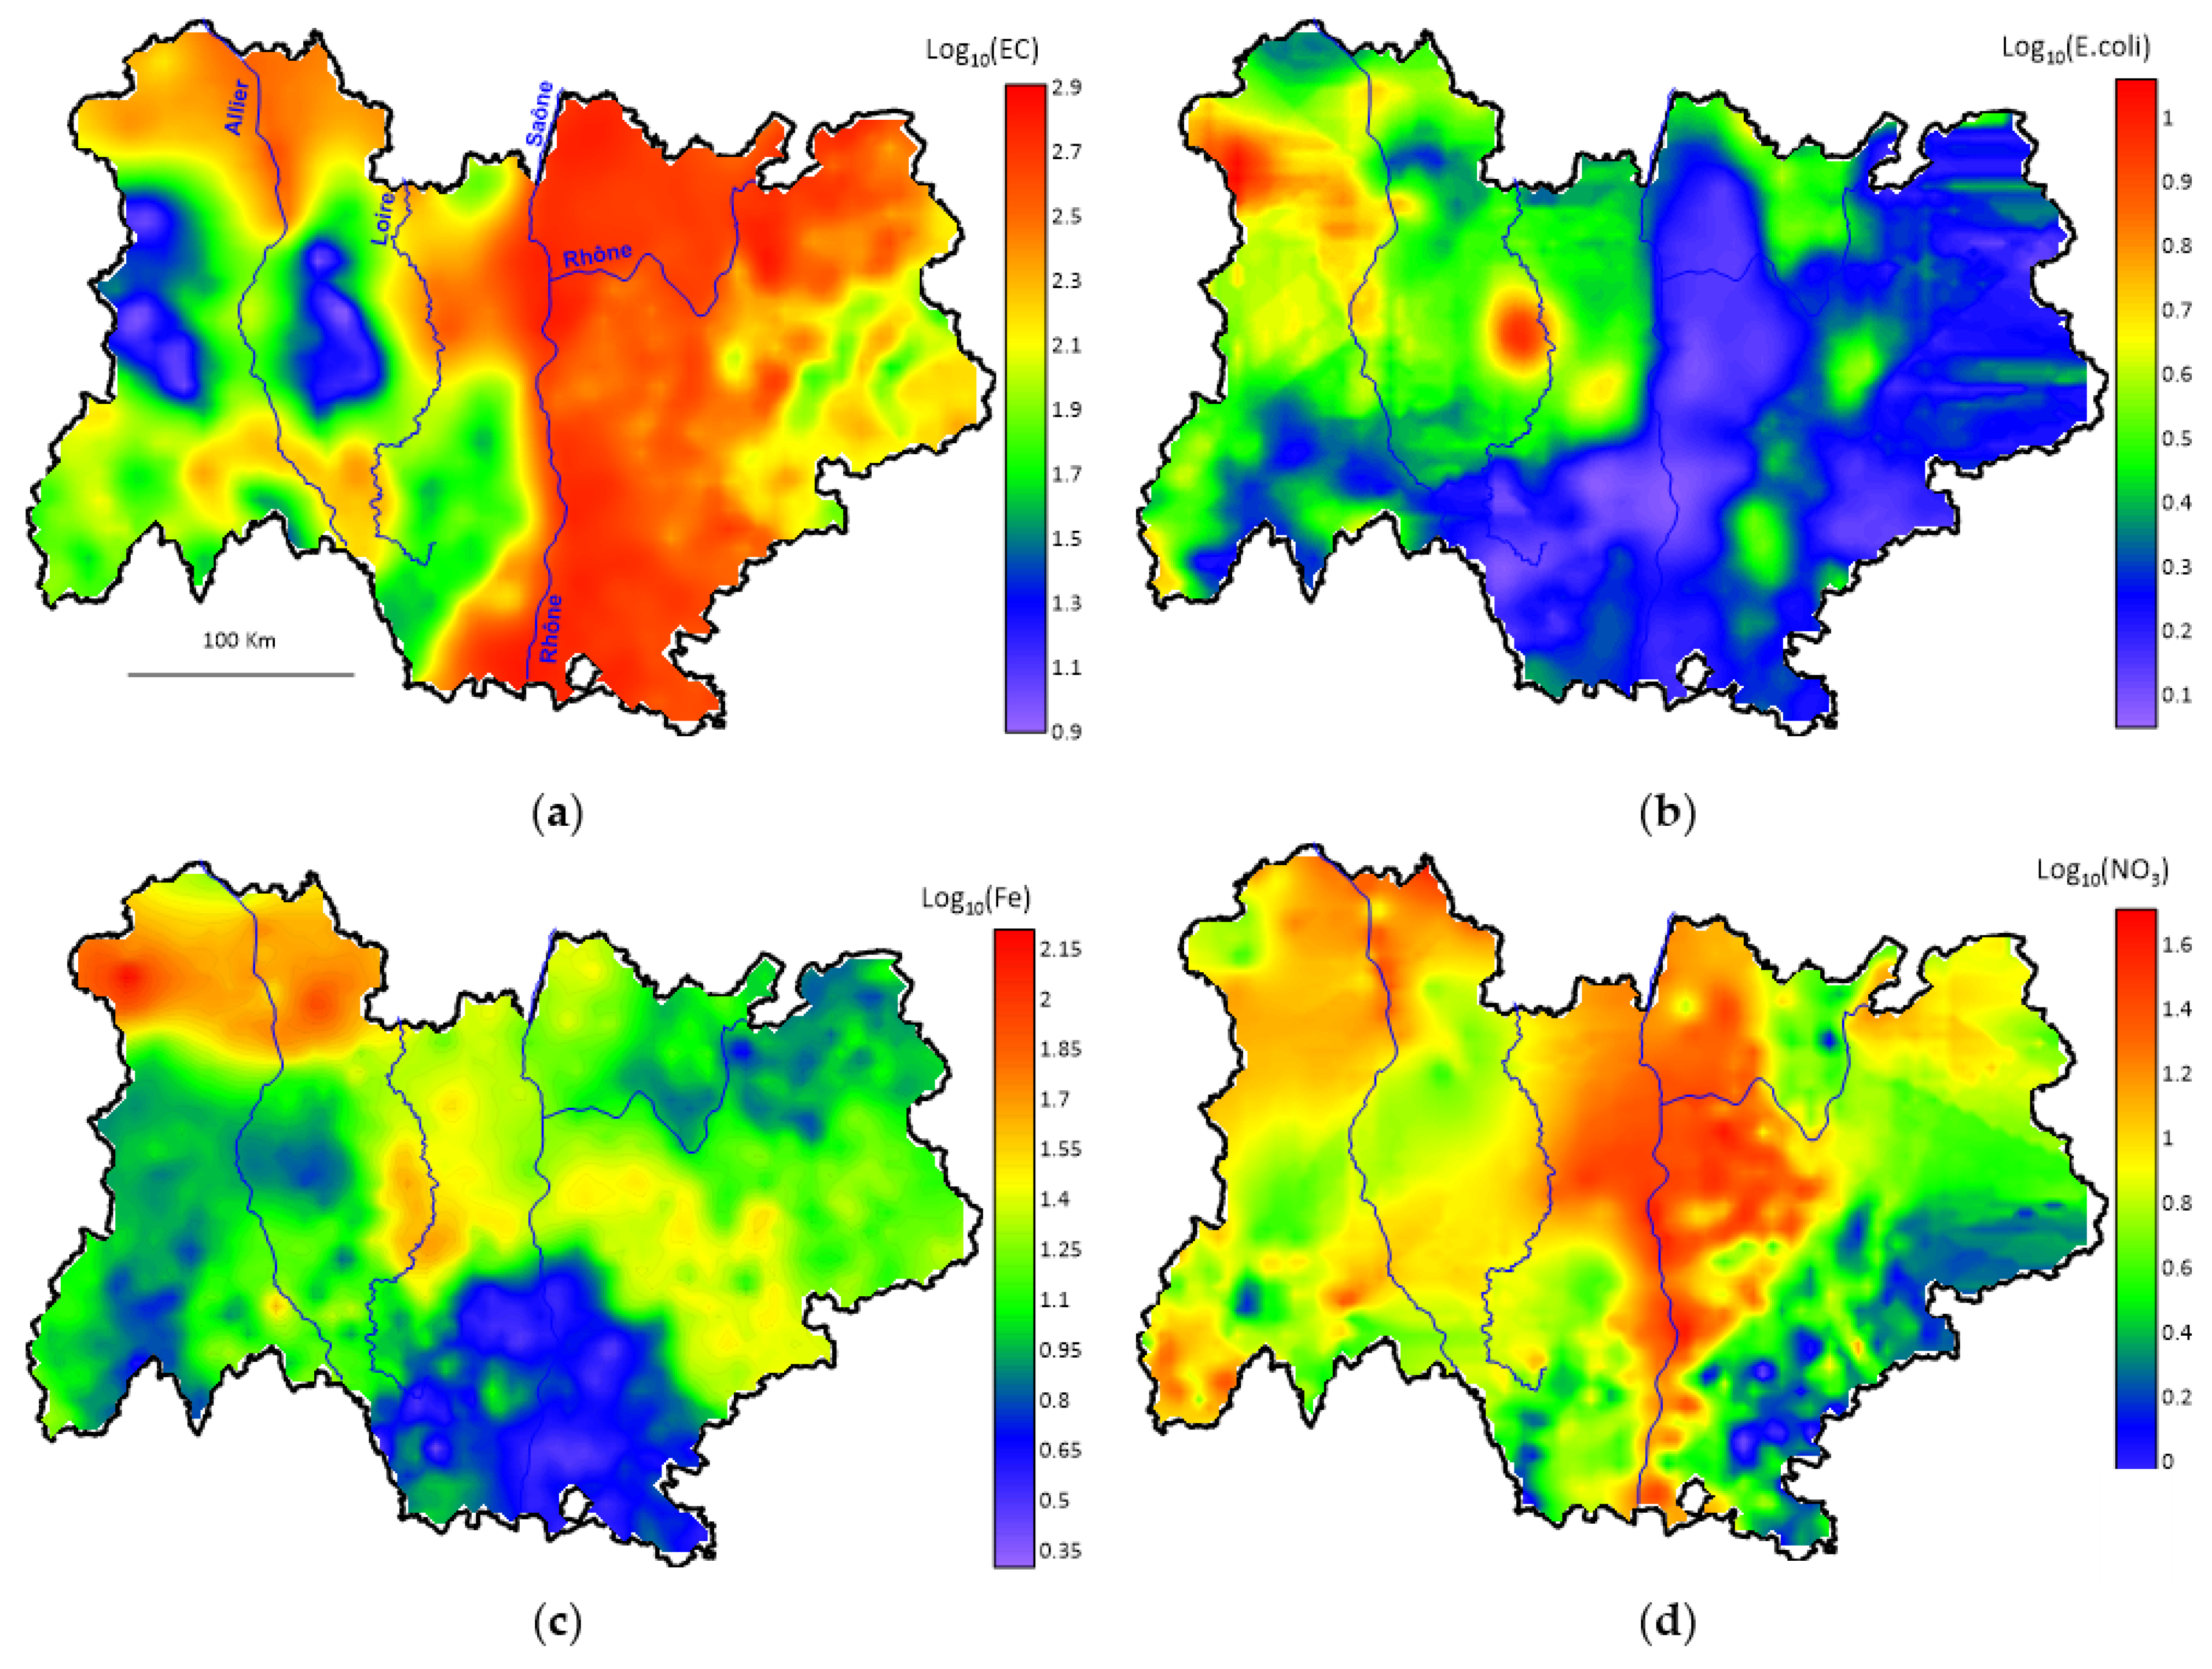
3.1. Parameters and Chemical Profiles Distribution

Maps of some major parameters (EC, E. coli, Fe, NO3) are shown in Figure 2. These maps, calculated on the basis of several tens of thousands of data points (VarTot), show contrasting but different areas within the region studied, depending on the parameters considered.
The maps of the chemical profiles are shown in Figure 3. The sodium chloride profile predominated over the whole of the Massif Central block and was weak in the Alpine part and as far as the Rhône corridor. This contrast was more marked for sodium (Figure 3a) than for chloride (Figure 3b). The Rhodanian corridor showed intermediate values. On the other hand, calcic carbonate facies predominated in the Pre-Alps, Alps, and Jura, which are essentially made up of calcareous rocks (limestone and marly limestone) from the Mesozoic (mainly Jurassic and Cretaceous), as well as in the alluvial valleys that drain the Alps (including the Rhone corridor) and are made up of calcareous sediments. These chemical facies also had high values in the valleys of the Massif Central, where the water mineral load was higher than in the surrounding mountains, namely the Monts du Lyonnais, Forez, Maconnais, and Beaujolais. The sulphate facies showed higher values in the Cretaceous sedimentary zones of the Alps and Pre-Alps, consisting of marl and marly limestone containing sedimentary pyrites. To a lesser extent, fairly high values were detected in the collapse basins, particularly in Limagne, where the slopes contain primary formations rich in sulphides and sulphates.

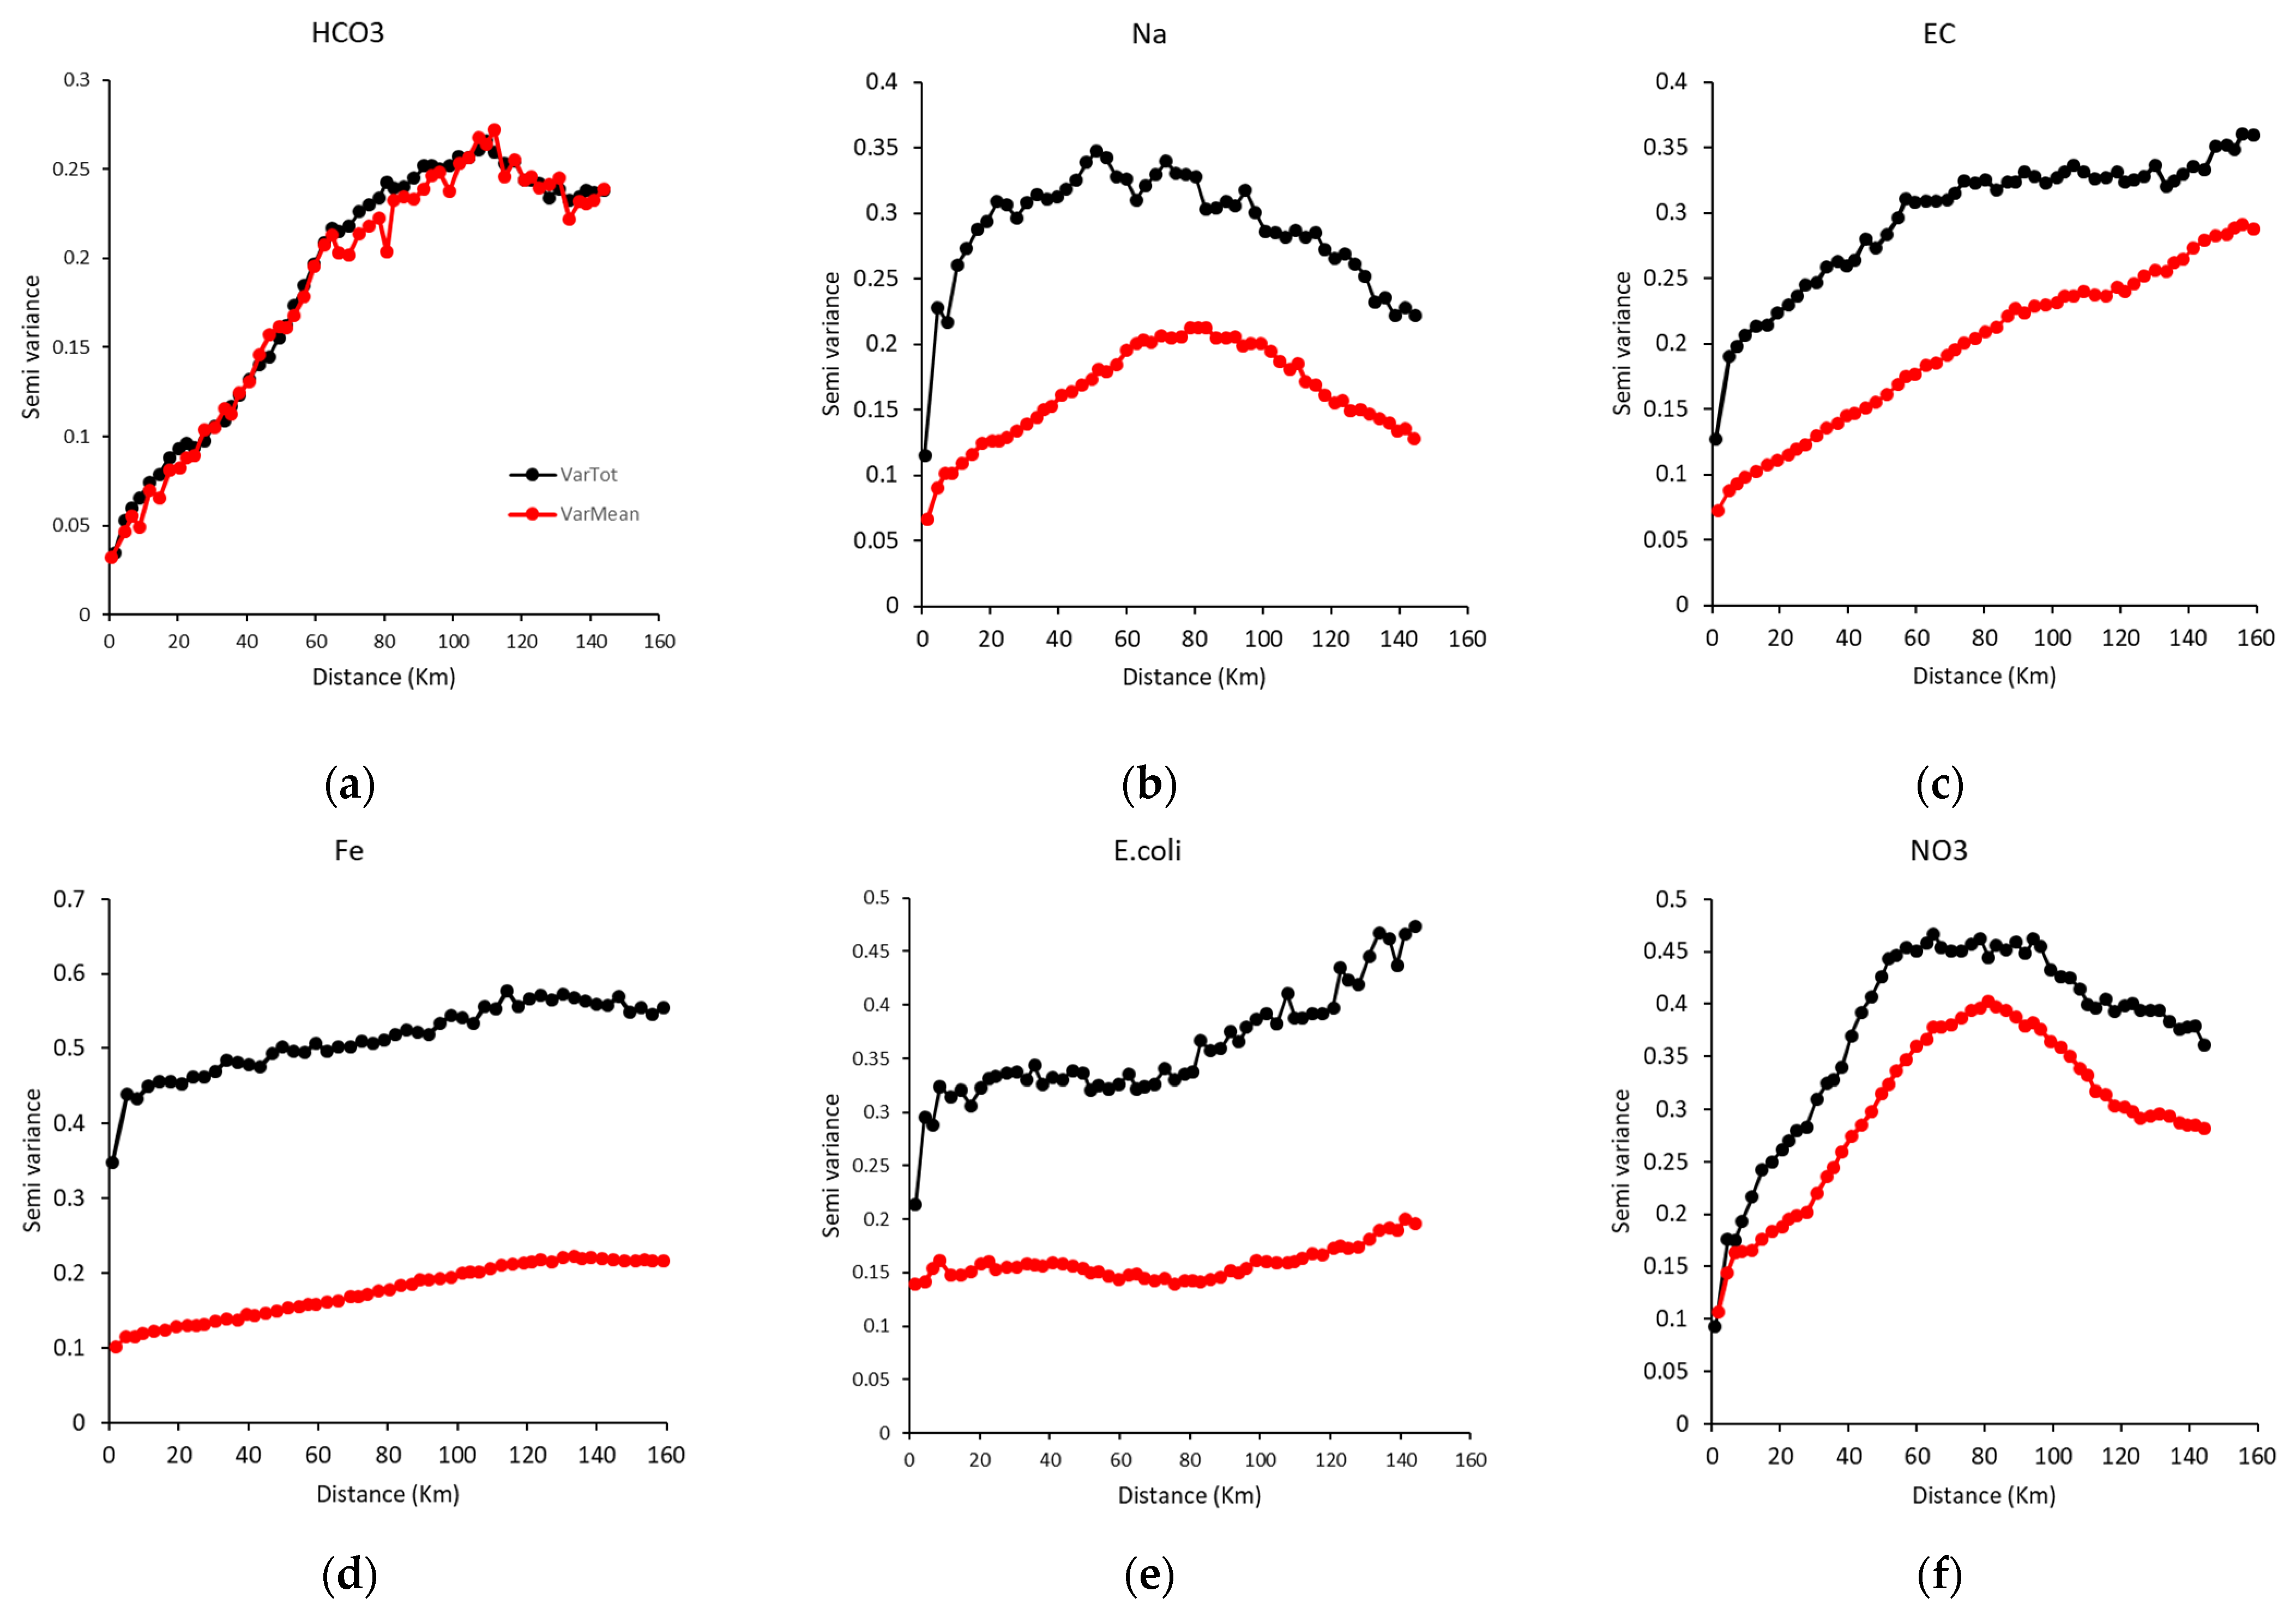
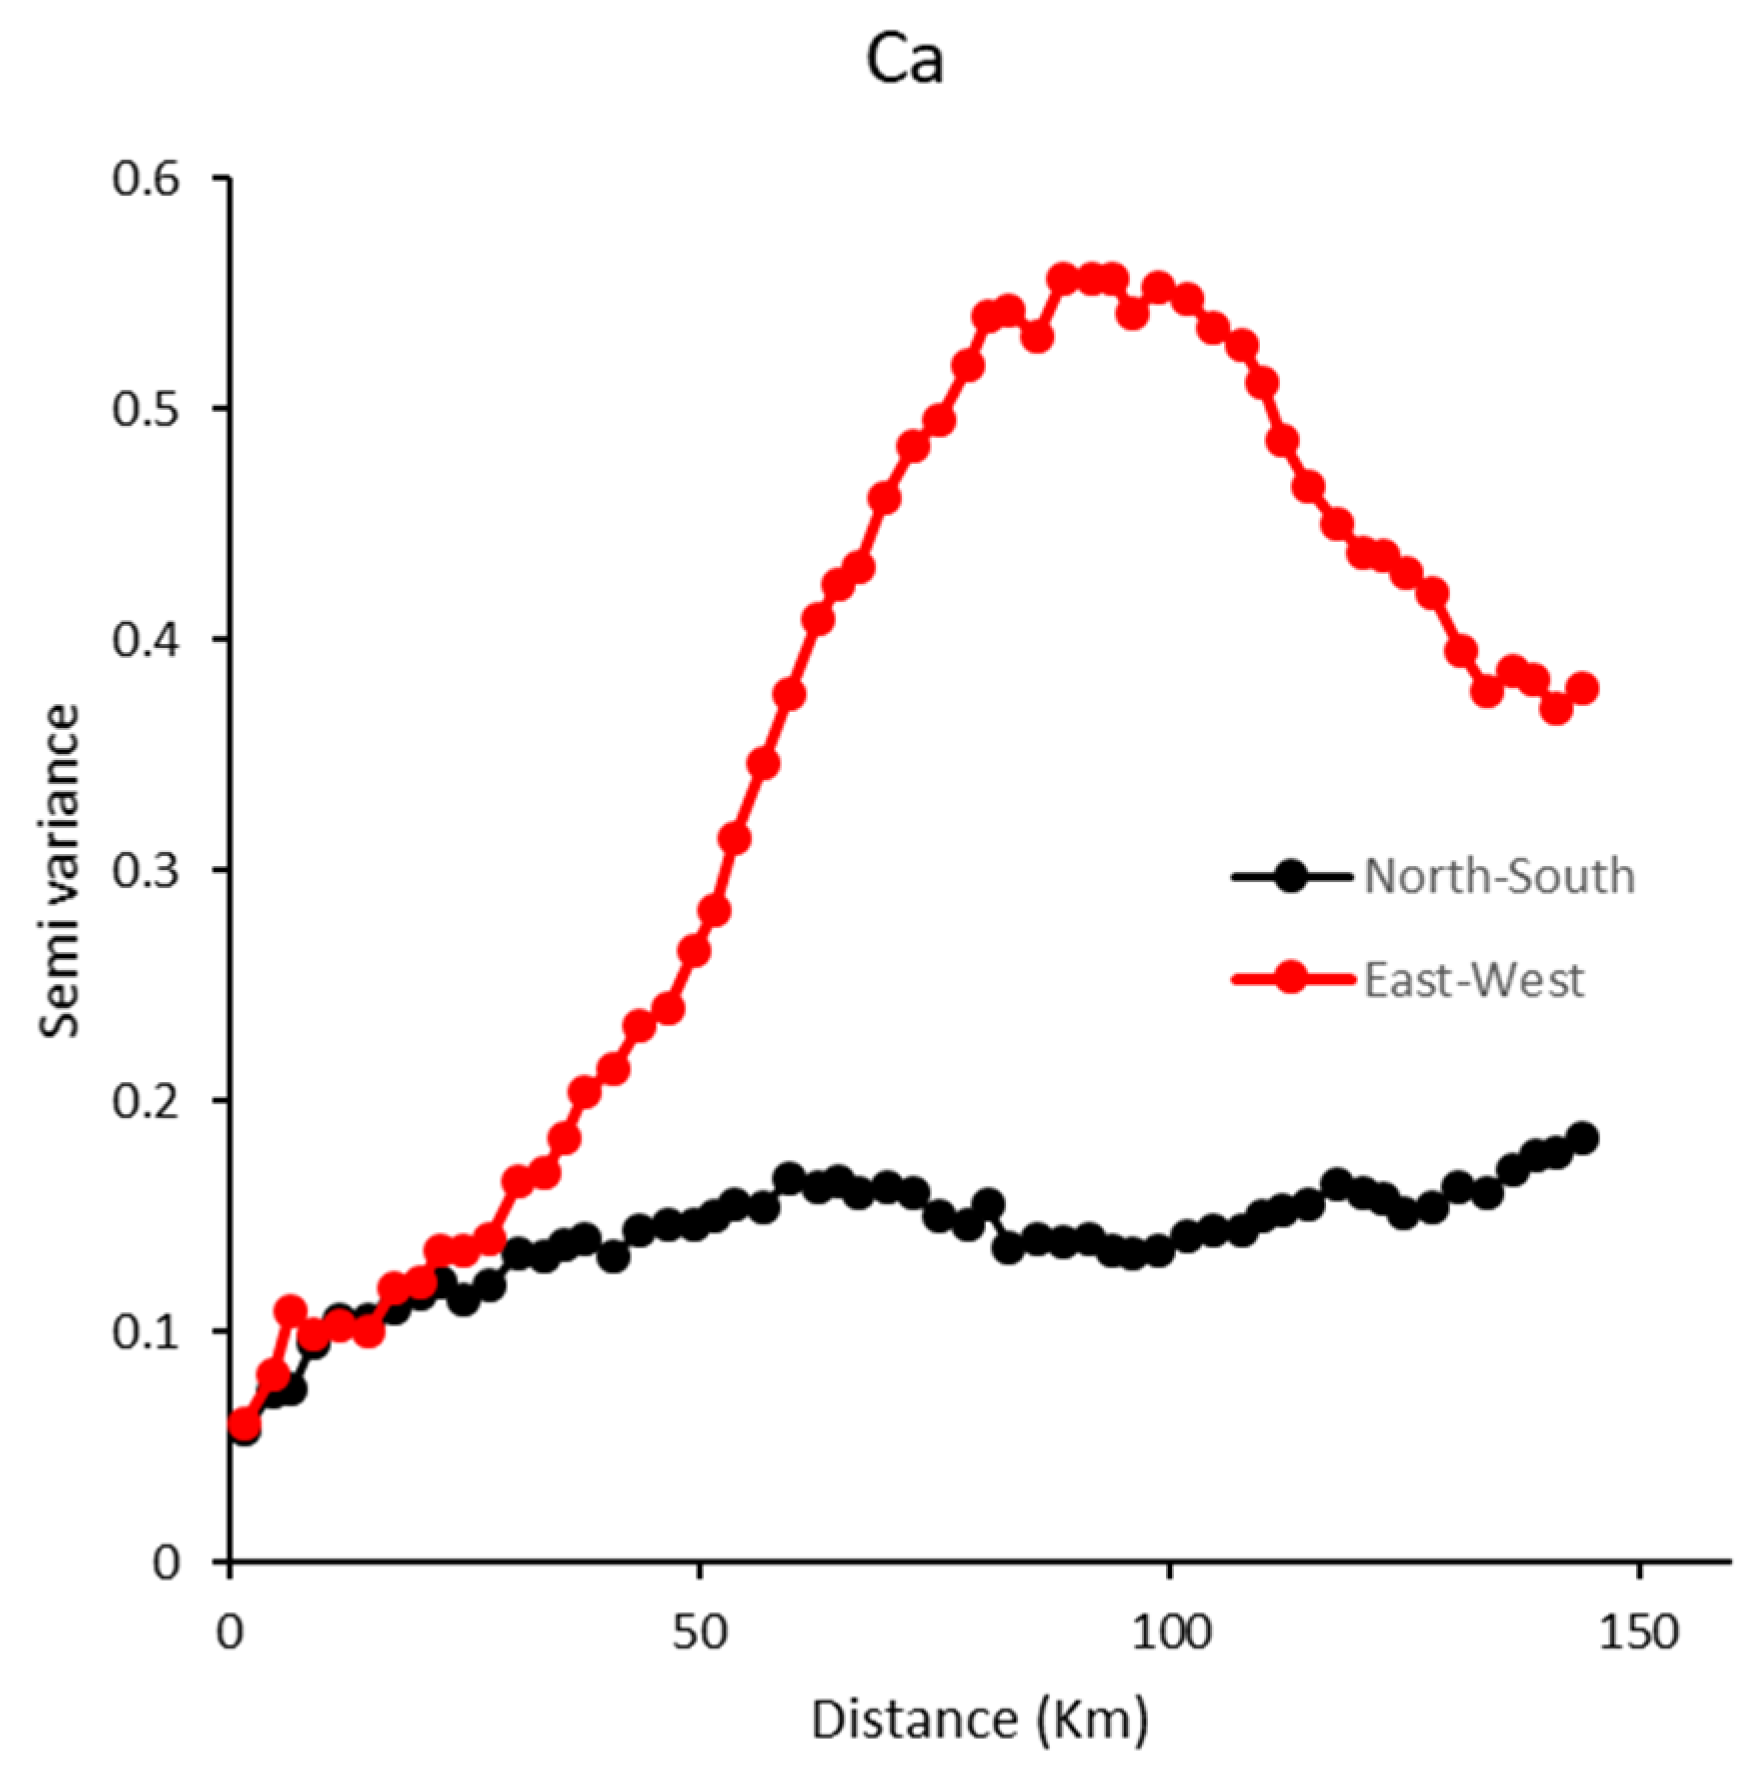
3.2. Diversity of Variograms

Representative examples of the diversity of variograms obtained are shown in Figure 4. Several types can be observed. In the case of calcium, carbonates (Figure 4a), sulphates, and pH, the variograms showed a range greater than 100 km and a weak nugget effect, i.e., low variability at short distances. For these parameters, the VarMean (calculated from the mean at each sampling point) and VarTot (calculated from all the data) variograms are superimposed (see Figure 4a), reflecting the low temporal variability. For the other major ions (Na (Figure 4b), Cl, K, Mg, SO4) and for EC (Figure 4c), the range was also large, between 80 and 120 km, and the nugget effect was moderate—of the order of 1/3 of the sill. However, the two variograms (VarTot and VarMean) were not superimposed, with VarMean being generally 1/3 lower than VarTot. For all the major ions, there was very marked anisotropy between the north-south direction and its east-west perpendicular, corresponding to the lowest and highest semi-variance, respectively (Figure 5). In the east-west direction, the range was of the order of 80 km, whereas it was not reached in the north-south variogram (>150 km).
For metals (Figure 4d), bacteria characteristic of faecal contamination (Escherichia coli and Enterococci, Figure 4e), revivable bacteria, and sulphite-reducing bacteria, the nugget effect was significant and accounted for most of the maximum semi-variance. The range of the variograms was short—of the order of 10 km up to an initial plateau. There was a very pronounced gap between VarTot and VarMean, reflecting strong temporal variability. Finally, for nitrates (Figure 4f), the range was of the order of 10 km until an initial plateau, then around 60 km to reach maximum semi-variance, and the temporal variability was moderate. For this parameter, the shape of the variograms was intermediate between those representing major ions and trace ions.

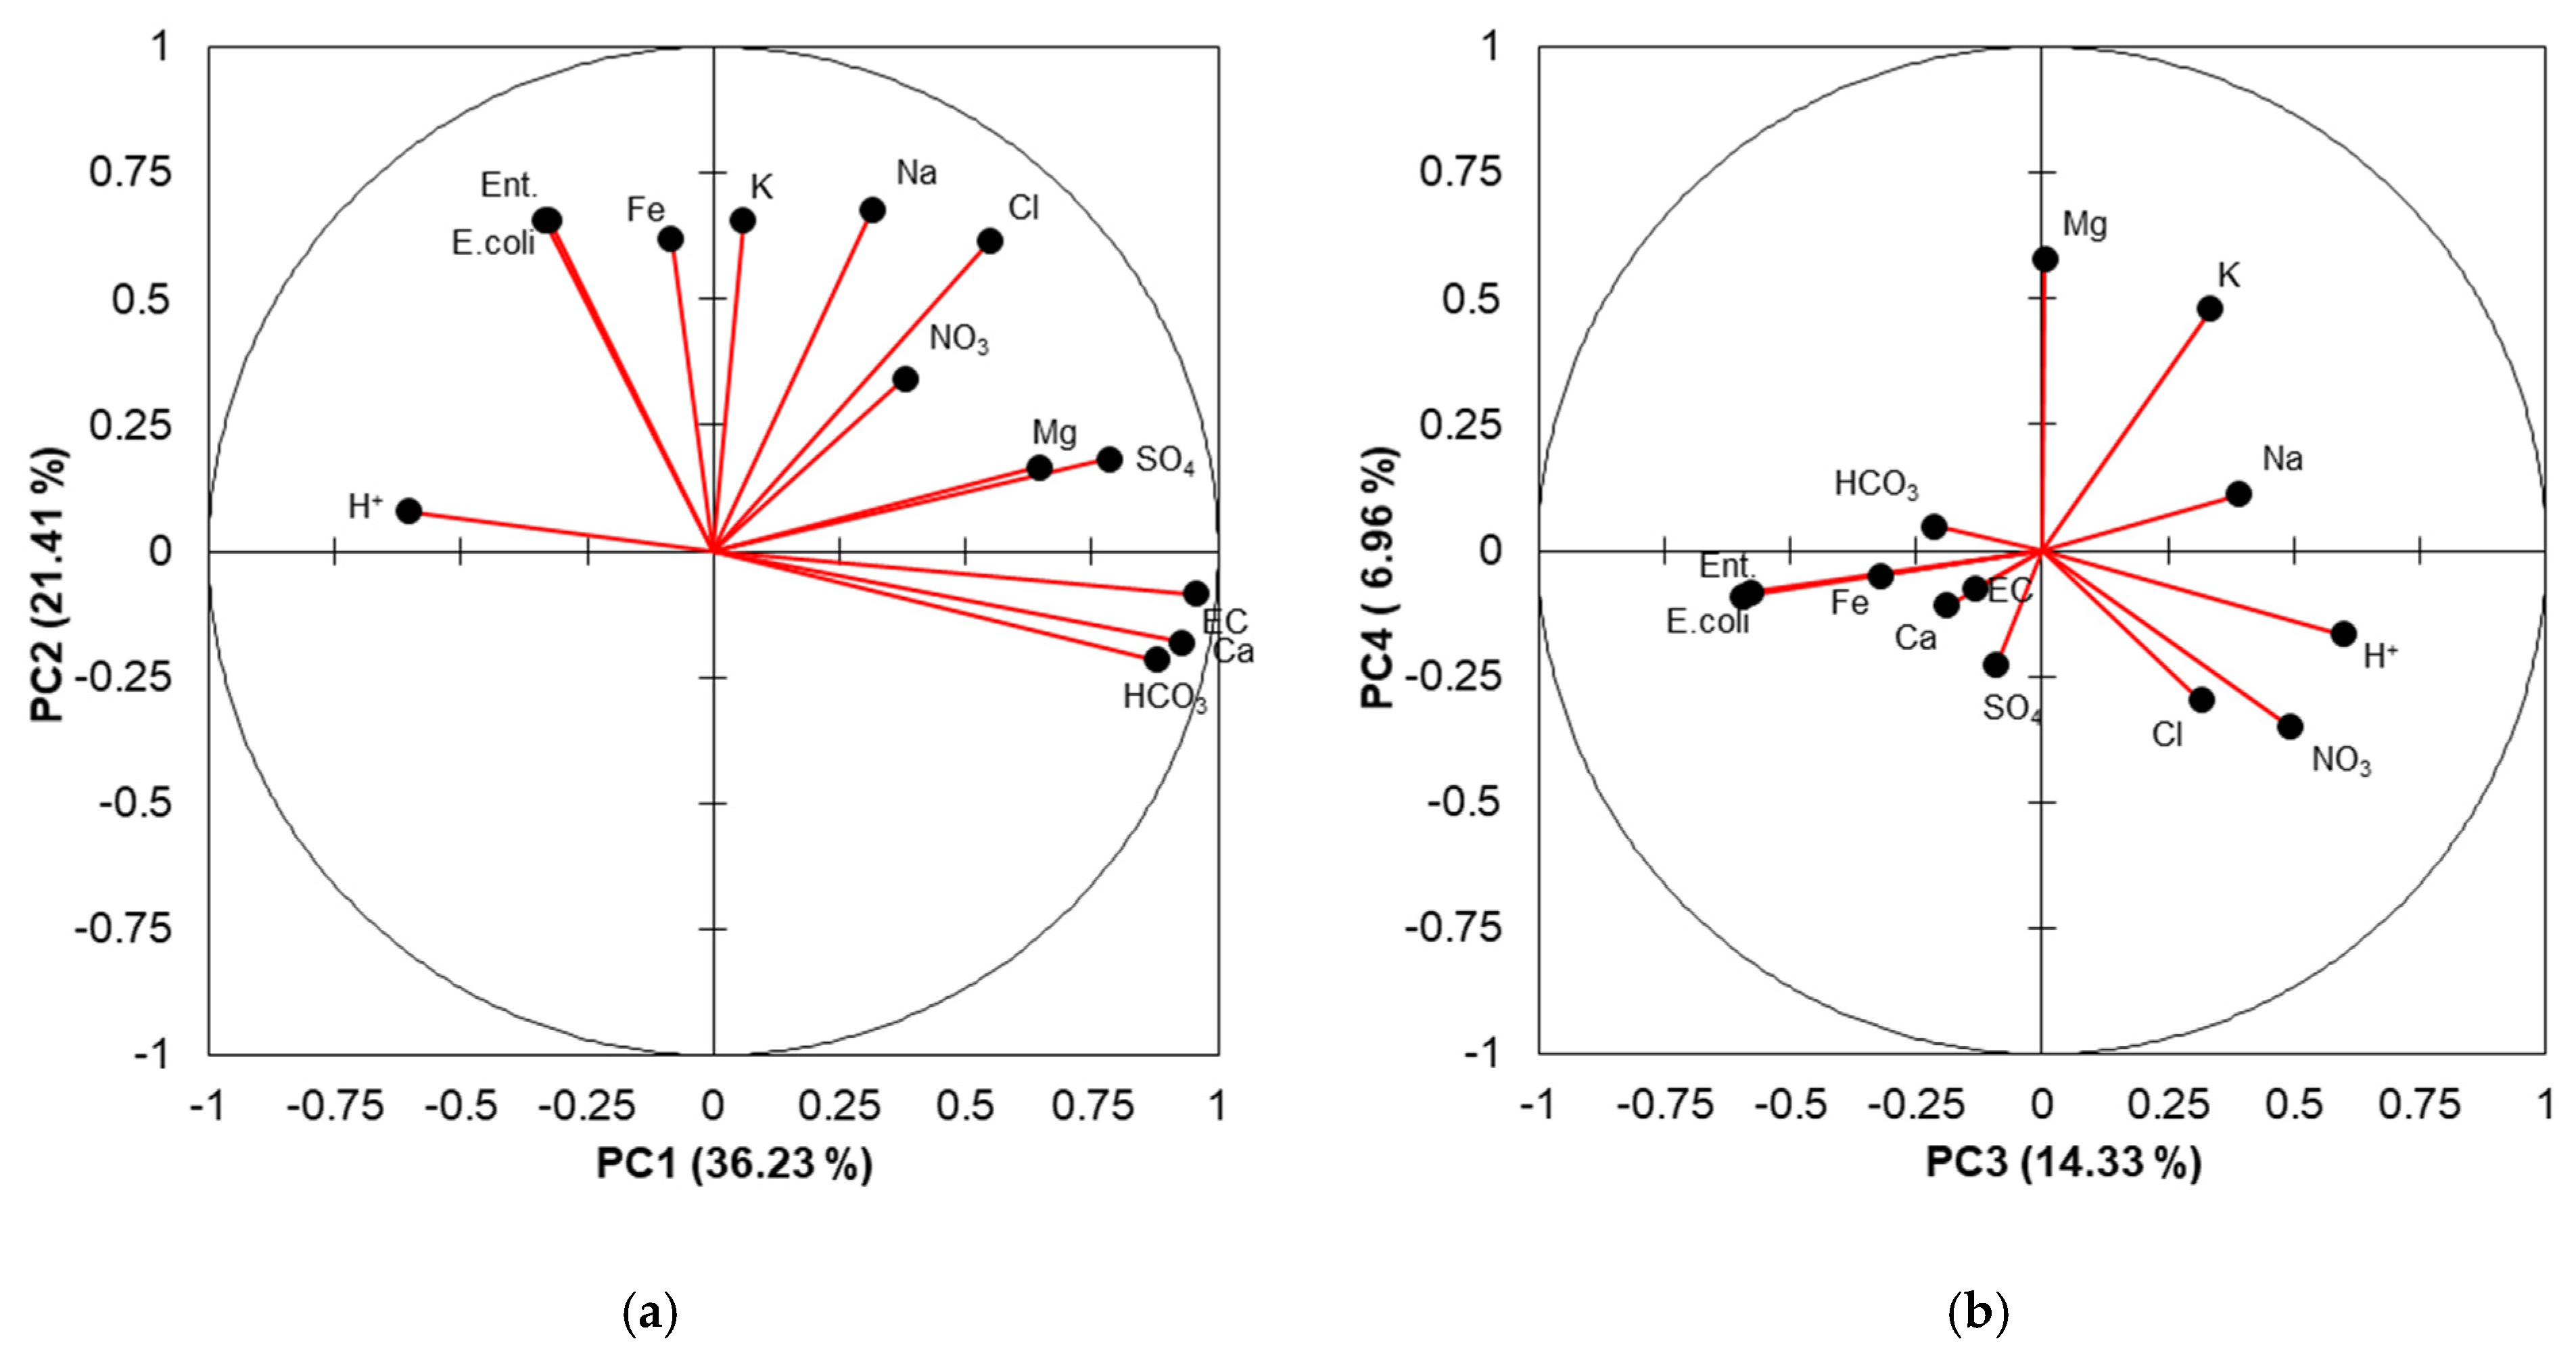
3.3. PCA Performed on Matrix M1
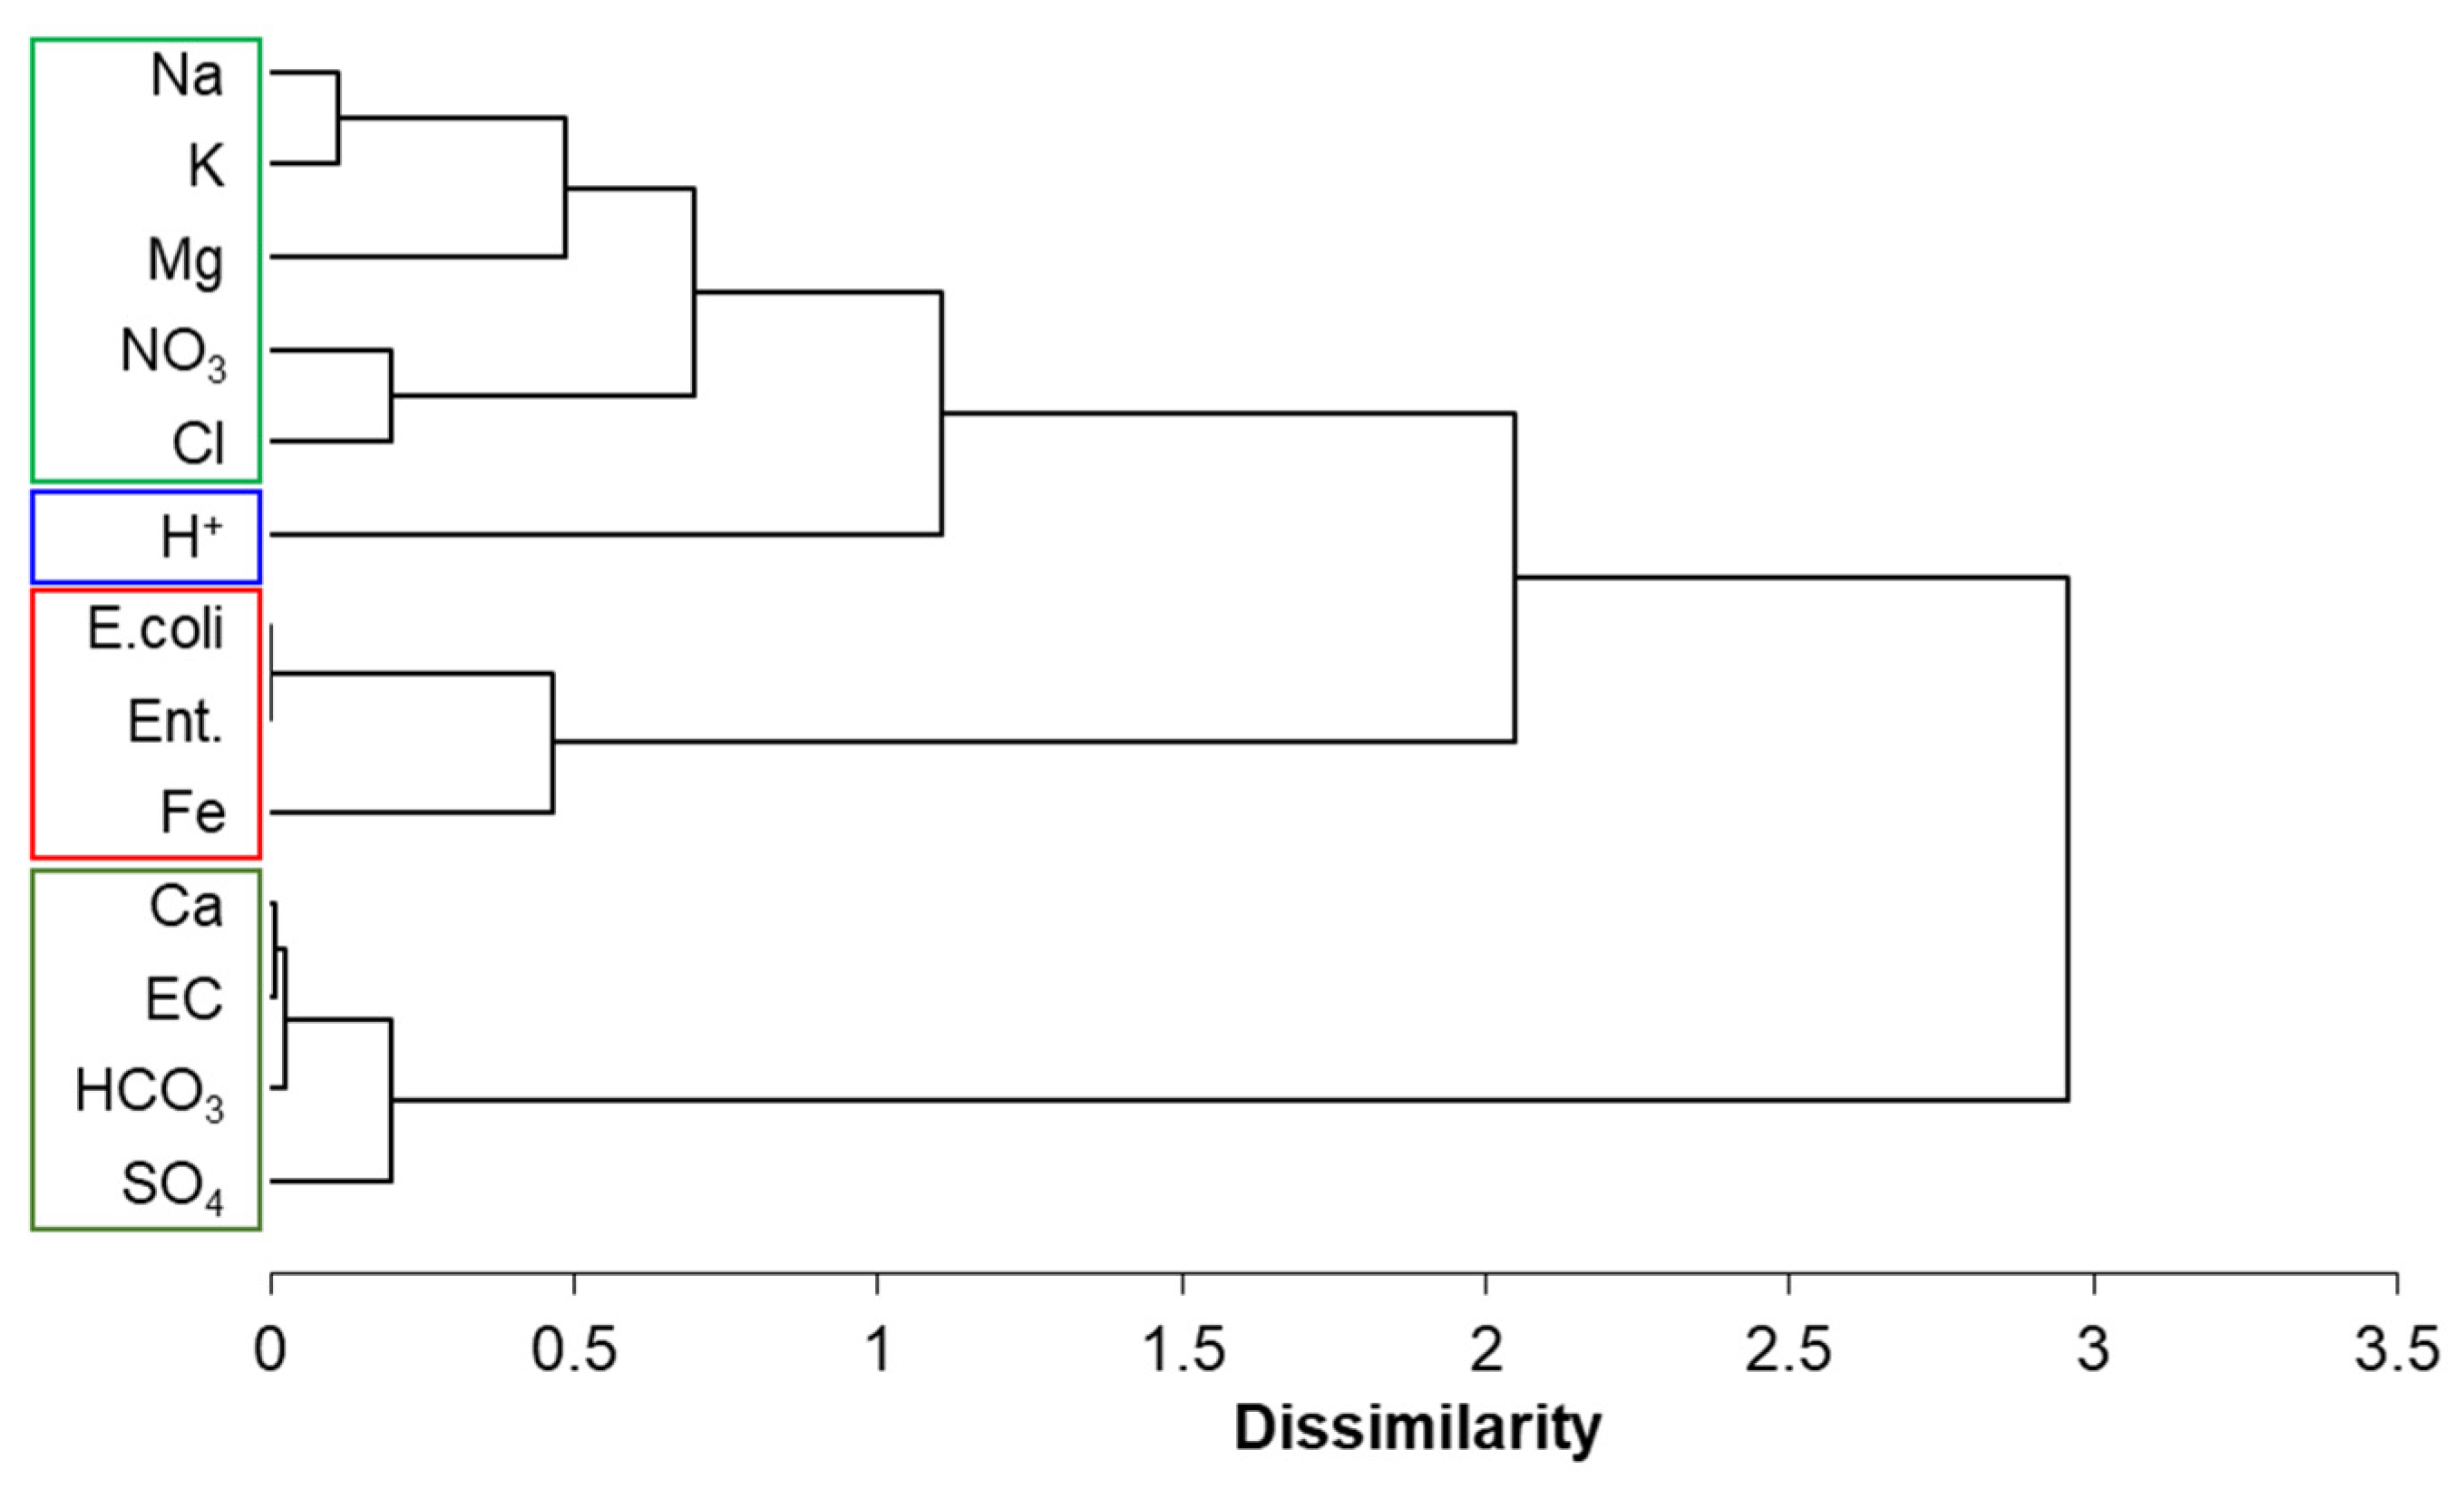
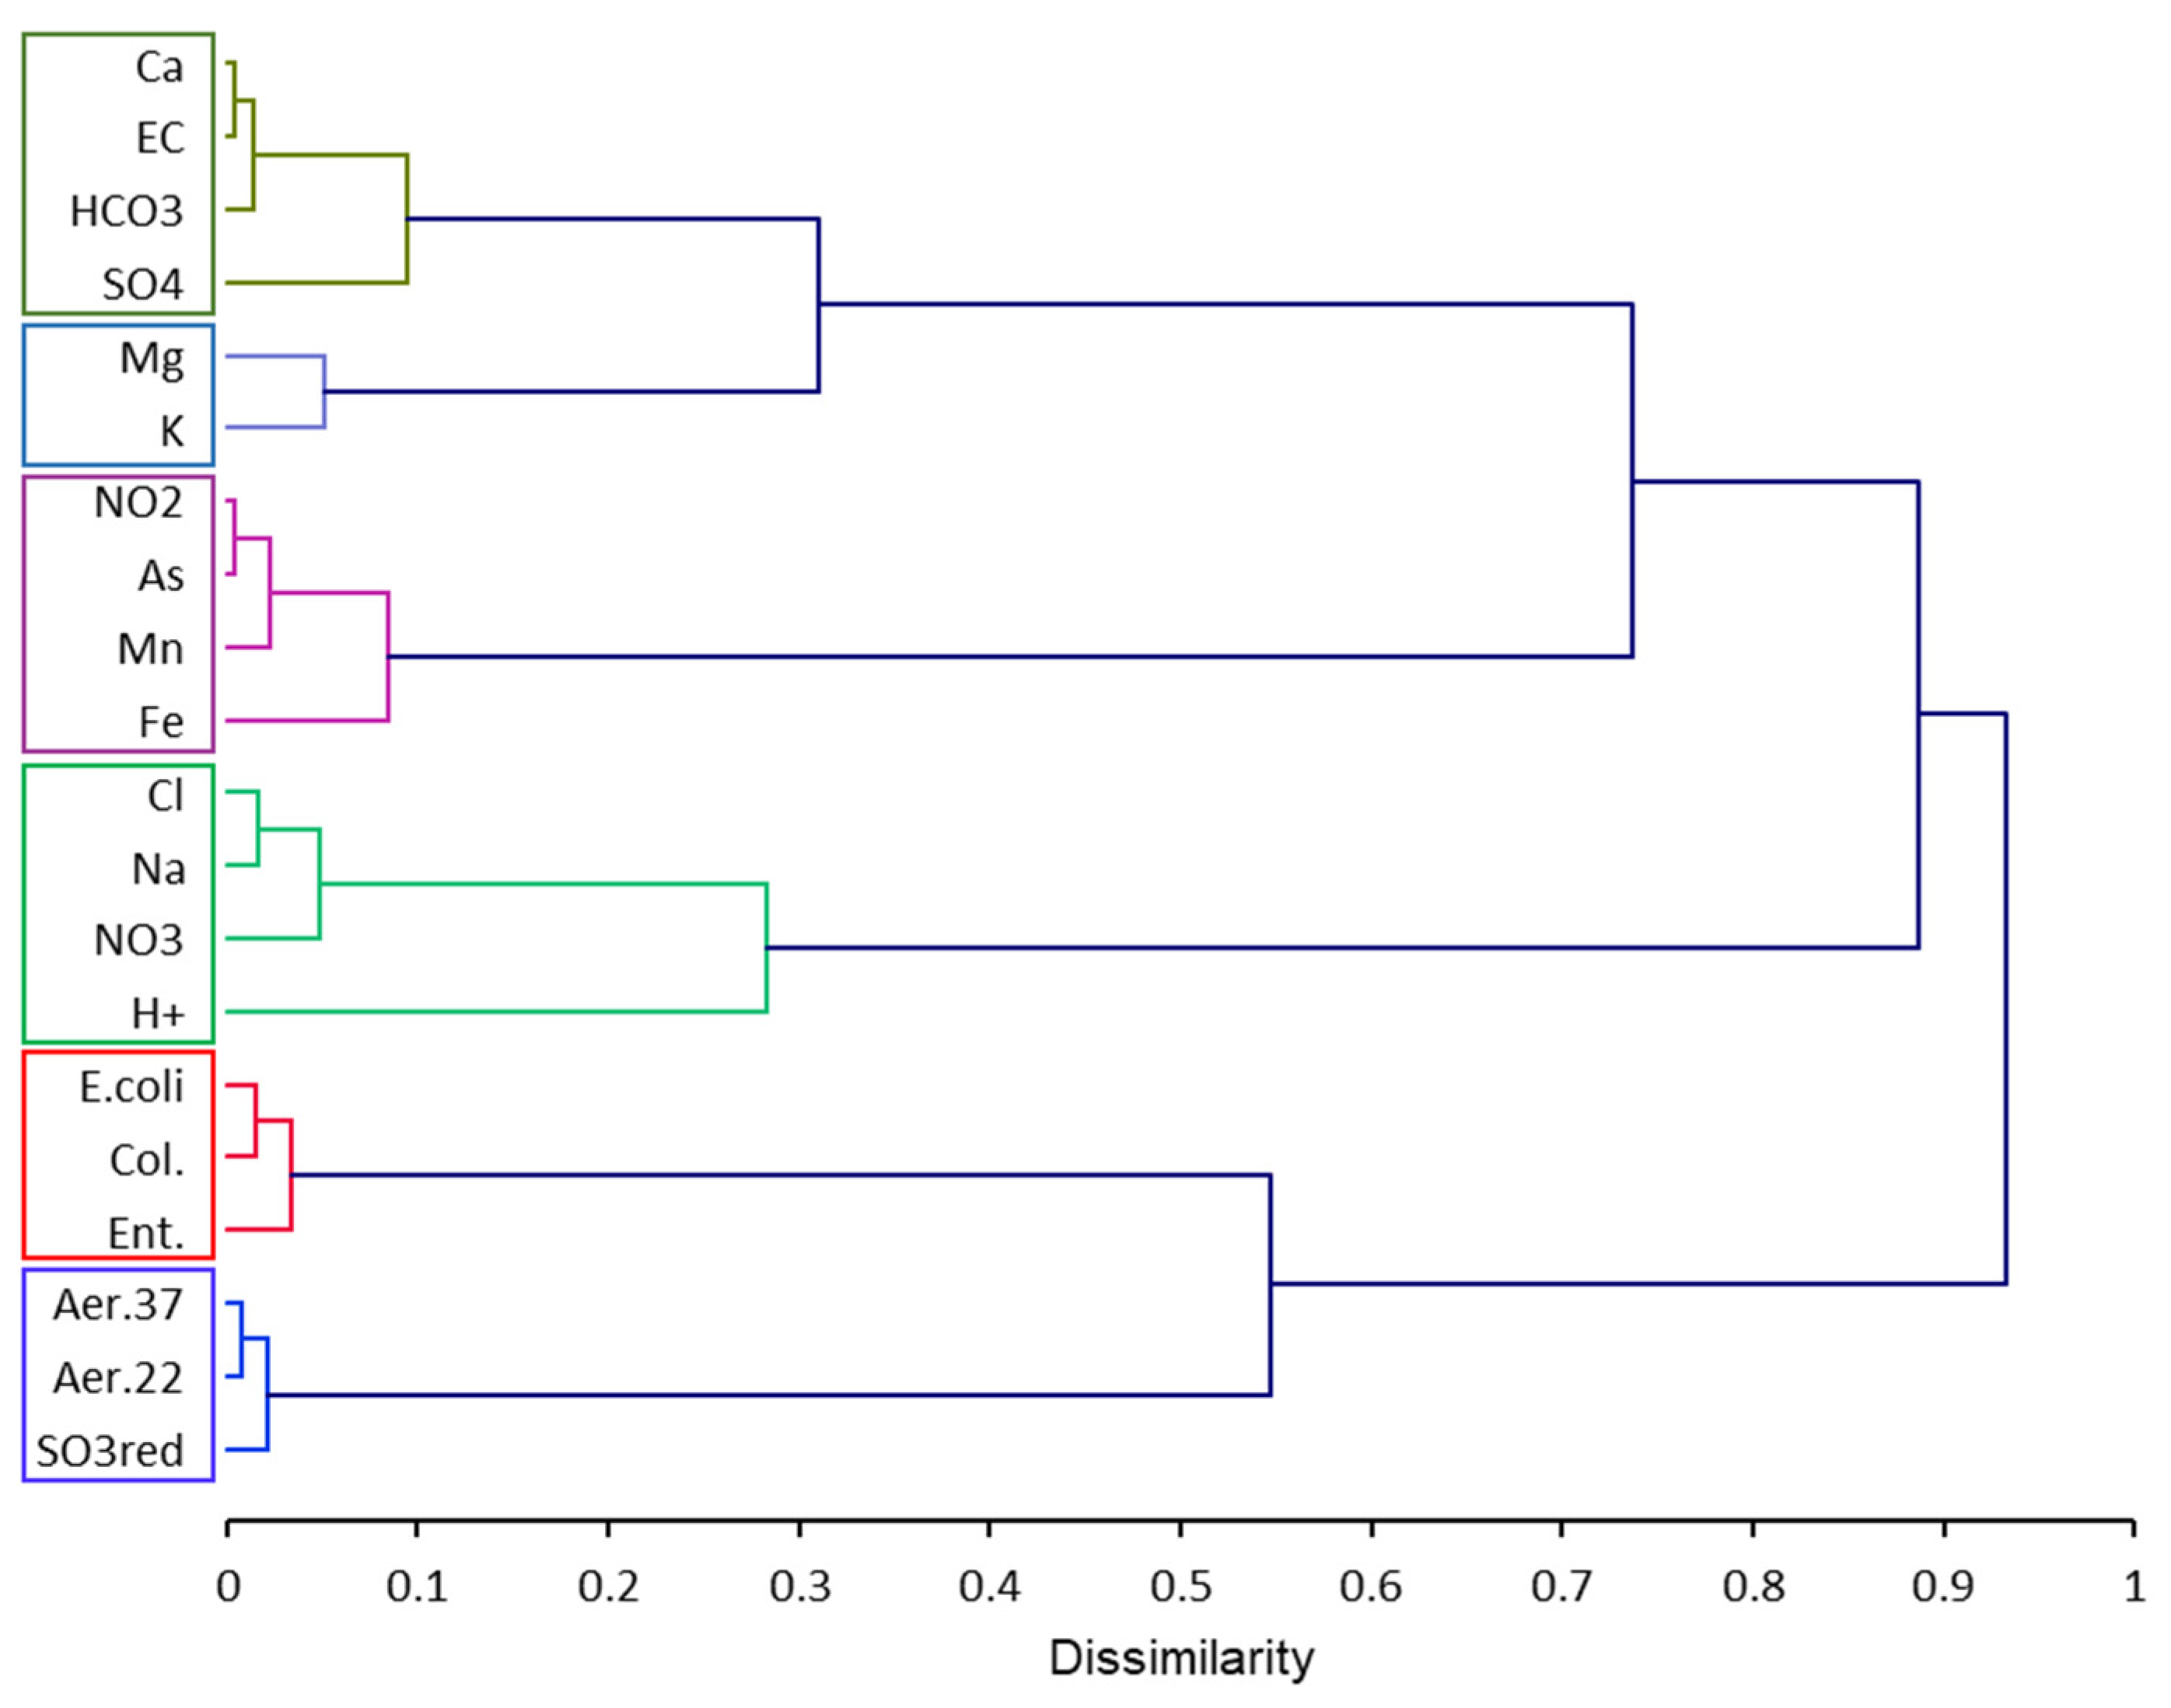
The distribution of factorial axis inertia is shown in Table 1, and the contributions of bacteriological and physico-chemical parameters to the first six factorial axes in Table 2 and Figure 6 for score plots PC1-PC2 and PC3-PC4.
The first factorial axis accounted for 36% of the total variance and had a high eigenvalue of 4.71, meaning that this principal component carried almost as much information as 5 of the 13 initial parameters. The reduction in dimension was therefore very strong at this level, and even more remarkable if we consider the first factorial plan (PC1-PC2, 58% of the total variance). The first seven factorial axes accounted for 92% of the total variability, i.e., of the information contained in the dataset.
The distribution of the first four factorial axes is shown in Figure 7. The first factorial axis (PC1) was clearly driven by electrical conductivity and major ions (except K). This axis reflected the mineral load of groundwater. On this axis, water with faecal contamination appeared to be diluted water. High values were found in the Rhone corridor, the northern part of the Allier valley, the whole of the Pre-Alps, and the Jura, and lower values in the whole of the Massif Central (Cantal, Monts du Forez, etc.) and the Alps. The second factorial axis (PC2), which carries 21.4% of the information, was positively scored by the parameters Na, Cl, and K, by faecal contamination, iron, and secondarily by the presence of nitrates, conditions which were opposed to a calcareous carbonate chemical profile. In other words, this factorial axis reflects, on the one hand, the fairly widespread faecal contamination associated with high levels of nitrates present in the Massif Central and more particularly in the Loire and Allier valleys and, on the other hand, the low and medium mountain areas of the Alps, which showed frequent but scattered faecal contamination. These first two factorial axes presented a marked anisotropy (not shown) between the more homogeneous north-south direction and the more heterogeneous east-west direction. The third factorial axis accounted for 14.3% of the variance. It differentiates between water that is vulnerable to faecal contamination, with a carbonate and iron-rich chemical profile, and water with a Na–K–Cl chemical profile, rich in nitrates. The fourth factorial axis accounted for only 7% of the variance. This was the first axis not affected by faecal contamination.

3.4. Subsection

The result of the clustering of bacteriological and physico-chemical parameters carried out on the basis of the first 6 factorial axes of the PCA (matrix M1) is presented in Figure 8. Four groups of parameters were observed, namely (1) the major ions Ca, HCO3, and, SO4 and electrical conductivity, (2) bacteriological parameters and iron, (3) pH, an isolated parameter, then (4) the other major ions (Cl, Mg, K, Na) with nitrates.
The dendrogram obtained by the same treatment from the M2 matrix (150 observations and 20 parameters) immediately separated the bacteriological parameters from the chemical parameters. Within the latter, four groups of parameters were identified (Figure 9), broadly similar to those obtained with the M1 matrix:
  • Major elements of lithological origin and electrical conductivity (EC, Ca, HCO3, SO4);
  • K and Mg, which are related to this first group but showed a certain dissimilarity;
  • Elements involved in redox processes (Fe, Mn, NO2, As);
  • Na, Cl, NO3, and H+, which may be of mixed origin, both natural and anthropogenic.
Two groups made up the bacteriological parameter branch, namely faecal pollution indicators grouped with total coliforms, and revivable bacteria with sulphite-reducing bacteria, these two groups being discriminated very early in the tree structure, for a dissimilarity of 0.55.

4. Discussion

The distribution of the inertia of the factorial axes shows complex information within the full matrix M1. At least 7 PCs are necessary to explain more than 90% of the variance, i.e., more than 90% of the information contained in the database. This can be explained by the great diversity of natural environments in this large region (diversity of altitudes, lithologies, types of groundwater resources, climate, and human activities), but also by the diversity of mechanisms involved in inducing spatial and temporal variations in water quality. An attempt should be made to identify these mechanisms, bearing in mind that it is difficult to identify a mechanism associated with a factorial axis explaining a small proportion (less than 10%) of the total variance.

4.1. Parameters, Lithology and Major Structural Units

The range of the major ion and electrical conductivity variograms coincides with the major geological units and structural axes of the region. In addition, the marked anisotropy between the north-south direction, with a range greater than 160 km, and the east-west direction, with a smaller range, confirms that these parameters reflect a north-south structuring in line with the regional geology. In the Alps, this north-south structuring corresponds to the folded cover of the Pre-Alps and Jura, the Rhone corridor, and the horst of the Massif Central alternating with the grabens of the Forez and Limagne plains, which are geologically fairly homogeneous, all trending north-south. In contrast, the very moderate ranges of the variograms of the bacteriological parameters, as well as the significant nugget effect, show a very local source of variability that is very different from the spatial structure of the major ions. The maps of parameters (Figure 2), chemical profiles (Figure 3), and initial factorial axes (Figure 6) confirm the link with the major north-south-trending structural units along the axis generated by (1) the Saône/Rhône valley occupying the collapse basin between the Alps to the east and the Massif-Central to the west and (2) the collapse basins occupied by the Allier and Loire rivers. The Rhône corridor and the Saône valley are slightly more mineralised than the alluvial valleys of the Loire and Allier (Figure 2a). At the other extreme, the least mineralised waters are found in the crystalline massifs of the central Alps to the east, and in the crystalline zone formed by the Hercynian basement of the Massif Central to the west. The waters of average mineral load correspond to the areas of sedimentary rock, of Jurassic to Tertiary age, located at the edge of the two crystalline complexes mentioned above. The zonation of the water minerality is in line with the results usually observed, particularly in other regions of France [17,20,22,24,25], namely that it depends on the solubility and alteration rate of the rocks, and that it increases along the flow lines, reflecting a longer water–rock interaction. Chemical facies maps can be used to refine the geochemical mapping of major ions. As the most mineralised waters are located in the Rhone corridor and the Na+ (Figure 3a) and Cl (Figure 3b) ions are highly soluble, the distribution of the Na-Cl chemical profile highlights the clear opposition between the sedimentary lithologies of the Alpine zone and the eruptive rocks of the Massif Central. This contrast is lithological in nature, with the weathering of eruptive rocks releasing proportionately more sodium and, to a lesser extent, chloride [30]. As these two areas (with sedimentary or eruptive lithology) are equally far from the sea, a differential input of Na-Cl of meteoric origin is not conceivable. It should also be noted that the alluvial valleys of the Allier and Loire, which drain this part of the Massif Central, also have slightly higher values for sodium and chloride profiles than the Rhône corridor, confirming that this is indeed a lithological contrast.
Major ions show moderate temporal variability (Figure 4b), which can be attributed to seasonality, to the contrast between hot, dry summers, during which water concentrates, and wetter winters, when rainfall causes dilution. This variability is practically non-existent for calcium ions, carbonates (Figure 4a), and pH, which are controlled by the equilibrium with calcite over part of the study area and/or buffered by carbonate equilibria. In calcareous environments, during dilutions caused by the arrival of low mineral content water, the soluble rock supplies ions that maintain a more or less constant concentration. On the other hand, during periods of evaporation and concentration, solutions at equilibrium precipitate calcite, which subtracts Ca2+ ions and alkalinity from the solution, again keeping the ion content of the water more or less constant. Sulphates come mainly from sedimentary polysulphides present in marly limestones from the Cretaceous period, which have low permeability and slow flow rates [31]. Consequently, the effect of fast dilution or mixing by storms or seasonal rainfall is very limited. All these conditions favour the relatively constant release of high sulphate levels and explain the low temporal variability detected from the variograms.
The second axis of the PCA (matrix 1, Figure 6a and Figure 7b) contrasts faecal contamination in the Massif Central and the Loire and Allier valleys with that in the Pre-Alps. This opposition is lithological, with the Alpine low and mid-mountain areas being almost exclusively limestone or calcareous marls, whereas the Loire and Allier valleys in the Massif Central concerned drain crystalline, metamorphic, and volcanic environments. Unlike the first factorial axis, which reflects a mixture of temporal and spatial contrasts that are specific to certain environments, this is a spatial contrast and one of the explanations could be linked to the flocculent nature of the calcium ion, which limits turbidity and hence the transport of bacteria. In summary, this factorial axis summarises water contamination (faecal and nitrate contamination as well as the natural content of metals Fe and Mn). The third factorial axis summarises some of the information, including important elements, from the HCO3 and Ca distribution maps, contrasting the Alpine-Jura zone with the other major structural units in the region.

4.2. Mechanisms for Acquiring Characteristics

One of the main sources of water variability is the run-off of poorly mineralised, bacterially-charged water during heavy rainfall events. Run-off mobilises and transports suspended matter and bacteria [32], and if this surface water infiltrates directly into water catchments intended for human consumption, the latter are contaminated if poorly protected. This mechanism is highly dependent on meteorological events and affects only certain areas, which explains the local nature and high temporal variability of the E. coli and Ent. parameters [33,34]. The consequences, i.e., local faecal contamination that varies over time [35,36], are very frequently observed for surface water [37] but also by the health agencies responsible for monitoring water quality and correspond to the main reasons for non-compliance reported [34,38,39]. Moreover, a similar mechanism has already been observed in other regions based on extracts from the Sise-Eaux database [17,18,19,20,22,23,24], particularly in Mediterranean climates where late summer storms can be violent and favour run-off. It should be noted, however, that faecal contamination is carried by at least the first three factorial axes, which are orthogonal to each other and therefore reflect independent mechanisms. We can therefore deduce that faecal contamination occurs in different contexts or that its path cannot be restricted solely to runoff induced by heavy rainfalls.
The third factorial axis of the PCA (matrix 1) shows an opposition between Fe and NO3 (Figure 6b and Table 2). This opposition is often associated with redox processes. Nitrate undergoing denitrification is therefore absent in reducing waters, whereas iron, on the other hand, is more soluble in reducing environments. This opposition has also been mentioned by numerous authors working on large groundwater databases [17,20,22].
The typology of elements presented in Figure 8 and Figure 9 is based on the first axes of the PCA, i.e., on most of the information in the corresponding full matrix. The first dichotomy between microbiological parameters and chemical elements (Figure 9) confirms the opposition between microbiological parameters, whose local variability is significant, and chemical parameters, whose spatial structure is expressed over greater distances, often linked to large lithological units. These microbiological parameters include, on the one hand, parameters characteristic of faecal contamination (E. coli, Enterococci, coliforms), generally linked to livestock farming and, to a lesser extent, to discharges from poorly performing wastewater treatment plants and, on the other hand, sulphite-reducing or revivable bacteria linked to the natural functioning of microbial ecosystems in the soil and subsoil, such as redox processes and organic carbon transformation processes.

5. Conclusions

A study of the multi-parameter quality of groundwater intended for human consumption in the Auvergne-Rhône-Alpes region was carried out using the extensive Sise-Eaux database. A typology of quality parameters emerged in terms of (1) spatial structure, (2) the contribution of temporal variability in relation to spatial variability based on the study of variograms, and (3) their mapping. The typology of the variograms completes and supports the typology of the distribution maps of the various parameters with great consistency. Major ion content and electrical conductivity are mainly determined by the major lithological and structural units. Faecal contamination shows more local variability, but with clear regional trends. Nitrate and metal levels fall between these two groups of parameters. Calculating maps parameter by parameter leads to a high degree of redundancy, which is not an effective mapping method. Dimensional reduction using PCA makes it possible to do the following:
  • Synthesise the essential information contained in the nearly 80% of information conveyed by 13 parameters. This represents a major dimensional reduction and a significant simplification of the water quality maps.
  • Separate, in particular, the different components of spatio-temporal variations in water faecal contamination. This revealed at least 3 sources of variability in groundwater bacteriological quality:
    The main component is linked to the intrusion of surface water by run-off during heavy rainfall events. This is a temporal variability, as it occurs mainly following storms at the end of the summer, but also a spatial variability, as only certain poorly protected catchments are vulnerable to faecal contamination.
    The second component is more related to spatial variability: water with a calcium carbonate profile is less likely to generate faecal contamination, which can be attributed to the flocculent nature of the calcium ion on clay colloids, reducing the risk of solid transport and germs. The distribution of this mechanism, linked to the water chemical profile, is essentially due to lithological variability.
    The third component also concerns the calcium carbonate environment, but anoxic waters that are fairly rich in iron and subject to contamination. It is also linked to spatial variability, concerning shallow areas where water stagnation favours reduced conditions and where the iron (ferric cements in the matrix) is solubilised.
Following on from the work carried out by extracting the Sise-Eaux database on other regions of France of varying size (8000–80,000 km²), this is a further step forward showing the usefulness of discerning the temporal and spatial components in the variability of groundwater quality parameters.

Author Contributions

Conceptualization, M.A., I.K. and V.V.; methodology, M.A., V.V. and L.B.; software, M.A., A.B. and H.L.; validation, M.A., V.V., H.L., A.B. and L.B.; formal analysis, M.A., V.V. and H.L.; investigation, M.A.; resources, I.K.; data curation, M.A. and A.T.; writing—original draft preparation, M.A. and V.V.; writing—review and editing, L.B.; visualization, M.A. and L.B.; supervision, V.V. and I.K.; project administration, I.K. All authors have read and agreed to the published version of the manuscript.

Funding

This research received no external funding.

Data Availability Statement

The data in this study are the property of ARS-PACA and are included in the SISE-Eaux French database https://data.eaufrance.fr/concept/sise-eaux, accessed on 15 March 2021.

Acknowledgments

The authors would like to thank the Regional Health Agency (Agence Régional de la Santé, ARS-ARA) for providing the SISE-Eaux database extraction. We are also very grateful to the reviewers who provided detailed, relevant, and constructive comments.

Conflicts of Interest

The authors declare no conflict of interest.

References

  1. van der Gun, J. Chapter 24—Groundwater Resources Sustainability; Mukherjee, A., Scanlon, B.R., Aureli, A., Langan, S., Guo, H., McKenzie, A.A., Eds.; Elsevier: Amsterdam, The Netherlands, 2021; pp. 331–345. ISBN 978-0-12-818172-0. [Google Scholar]
  2. Yuan, H.; Yang, S.; Wang, B. Hydrochemistry characteristics of groundwater with the influence of spatial variability and water flow in Hetao Irrigation District, China. Environ. Sci. Pollut. Res. 2022, 29, 71150–71164. [Google Scholar] [CrossRef] [PubMed]
  3. Gao, Y.; Chen, J.; Qian, H.; Wang, H.; Ren, W.; Qu, W. Hydrogeochemical characteristics and processes of groundwater in an over 2260 year irrigation district: A comparison between irrigated and nonirrigated areas. J. Hydrol. 2022, 606, 127437. [Google Scholar] [CrossRef]
  4. Bhunia, G.S.; Shit, P.K.; Brahma, S. Chapter 19—Groundwater Conservation and Management: Recent Trends and Future Prospects; Shit, P., Bhunia, G., Adhikary, P., Eds.; Elsevier: Amsterdam, The Netherlands, 2023; pp. 371–385. ISBN 978-0-323-99963-2. [Google Scholar]
  5. Koundouri, P. Current Issues in the Economics of Groundwater Resource Management. J. Econ. Surv. 2004, 18, 703–740. [Google Scholar] [CrossRef]
  6. Kemper, K.E. Groundwater—From development to management. Hydrogeol. J. 2004, 12, 3–5. [Google Scholar] [CrossRef]
  7. Bradford, S.A.; Harvey, R.W. Future research needs involving pathogens in groundwater. Hydrogeol. J. 2017, 25, 931–938. [Google Scholar] [CrossRef]
  8. Xia, Q.; He, J.; Li, B.; He, B.; Huang, J.; Guo, M.; Luo, D. Hydrochemical evolution characteristics and genesis of groundwater under long-term infiltration (2007–2018) of reclaimed water in Chaobai River, Beijing. Water Res. 2022, 226, 119222. [Google Scholar] [CrossRef] [PubMed]
  9. Mogheir, Y.; Singh, V.P.; de Lima, J.L.M.P. Spatial assessment and redesign of a groundwater quality monitoring network using entropy theory, Gaza Strip, Palestine. Hydrogeol. J. 2006, 14, 700–712. [Google Scholar] [CrossRef]
  10. Farlin, J.; Gallé, T.; Pittois, D.; Bayerle, M.; Schaul, T. Groundwater quality monitoring network design and optimisation based on measured contaminant concentration and taking solute transit time into account. J. Hydrol. 2019, 573, 516–523. [Google Scholar] [CrossRef]
  11. Xiong, Y.; Luo, J.; Liu, X.; Liu, Y.; Xin, X.; Wang, S. Machine learning-based optimal design of groundwater pollution monitoring network. Environ. Res. 2022, 211, 113022. [Google Scholar] [CrossRef]
  12. Daughney, C.J.; Raiber, M.; Moreau-Fournier, M.; Morgenstern, U.; van der Raaij, R. Use of hierarchical cluster analysis to assess the representativeness of a baseline groundwater quality monitoring network: Comparison of New Zealand’s national and regional groundwater monitoring programs. Hydrogeol. J. 2012, 20, 185–200. [Google Scholar] [CrossRef]
  13. Flindt Jørgensen, L.; Villholth, K.G.; Refsgaard, J.C. Groundwater management and protection in Denmark: A review of pre-conditions, advances and challenges. Int. J. Water Resour. Dev. 2017, 33, 868–889. [Google Scholar] [CrossRef]
  14. Suk, H.; Lee, K.-K. Characterization of a Ground Water Hydrochemical System Through Multivariate Analysis: Clustering into Ground Water Zones. Groundwater 1999, 37, 358–366. [Google Scholar] [CrossRef]
  15. Chery, L.; Laurent, A.; Vincent, B.; Tracol, R. Echanges SISE-Eaux/ADES: Identification des Protocoles Compatibles Avec les Scénarios d’échange SANDRE; ONEMA, BRGM: Vincennes, France; Orléans, France, 2011. [Google Scholar]
  16. Gran-Aymeric, L. Un portail national sur la qualite des eaux destinees a la consommation humaine. Tech. Sci. Méthodes 2010, 12, 45–48. [Google Scholar] [CrossRef]
  17. Tiouiouine, A.; Yameogo, S.; Valles, V.; Barbiero, L.; Dassonville, F.; Moulin, M.; Bouramtane, T.; Bahaj, T.; Morarech, M.; Kacimi, I. Dimension reduction and analysis of a 10-year physicochemical and biological water database applied to water resources intended for human consumption in the provence-alpes-cote d’azur region, France. Water 2020, 12, 525. [Google Scholar] [CrossRef]
  18. Tiouiouine, A.; Jabrane, M.; Kacimi, I.; Morarech, M.; Bouramtane, T.; Bahaj, T.; Yameogo, S.; Rezende-Filho, A.; Dassonville, F.; Moulin, M.; et al. Determining the relevant scale to analyze the quality of regional groundwater resources while combining groundwater bodies, physicochemical and biological databases in southeastern france. Water 2020, 12, 3476. [Google Scholar] [CrossRef]
  19. Jabrane, M.; Touiouine, A.; Bouabdli, A.; Chakiri, S.; Mohsine, I.; Valles, V.; Barbiero, L. Data Conditioning Modes for the Study of Groundwater Resource Quality Using a Large Physico-Chemical and Bacteriological Database, Occitanie Region, France. Water 2023, 15, 84. [Google Scholar] [CrossRef]
  20. Mohsine, I.; Kacimi, I.; Abraham, S.; Valles, V.; Barbiero, L.; Dassonville, F.; Bahaj, T.; Kassou, N.; Touiouine, A.; Jabrane, M.; et al. Exploring Multiscale Variability in Groundwater Quality: A Comparative Analysis of Spatial and Temporal Patterns via Clustering. Water 2023, 15, 1603. [Google Scholar] [CrossRef]
  21. Barbel-Périneau, A.; Barbiero, L.; Danquigny, C.; Emblanch, C.; Mazzilli, N.; Babic, M.; Simler, R.; Valles, V. Karst flow processes explored through analysis of long-term unsaturated-zone discharge hydrochemistry: A 10-year study in Rustrel, France. Hydrogeol. J. 2019, 27, 1711–1723. [Google Scholar] [CrossRef]
  22. Jabrane, M.; Touiouine, A.; Valles, V.; Bouabdli, A.; Chakiri, S.; Mohsine, I.; El Jarjini, Y.; Morarech, M.; Duran, Y.; Barbiero, L. Search for a Relevant Scale to Optimize the Quality Monitoring of Groundwater Bodies in the Occitanie Region (France). Hydrology 2023, 10, 89. [Google Scholar] [CrossRef]
  23. Mohsine, I.; Kacimi, I.; Valles, V.; Leblanc, M.; El Mahrad, B.; Dassonville, F.; Kassou, N.; Bouramtane, T.; Abraham, S.; Touiouine, A.; et al. Differentiation of multi-parametric groups of groundwater bodies through Discriminant Analysis and Machine Learning. Hydrology 2023, 10, 230. [Google Scholar] [CrossRef]
  24. Lazar, H.; Ayach, M.; Barry, A.; Mohsine, I.; Touiouine, A.; Huneau, F.; Mori, C.; Garel, E.; Kacimi, I.; Valles, V.; et al. Groundwater bodies in Corsica: A critical approach to GWBs subdivision based on multivariate water quality criteria. Hydrology 2023, 10, 213. [Google Scholar] [CrossRef]
  25. Helena, B.; Pardo, R.; Vega, M.; Barrado, E.; Fernandez, J.M.; Fernandez, L. Temporal evolution of groundwater composition in an alluvial aquifer (Pisuerga River, Spain) by principal component analysis. Water Res. 2000, 34, 807–816. [Google Scholar] [CrossRef]
  26. Rezende Filho, A.; Furian, S.; Victoria, R.; Mascré, C.; Valles, V.; Barbiero, L. Hydrochemical variability at the upper paraguay basin and pantanal wetland. Hydrol. Earth Syst. Sci. 2012, 16, 2723–2737. [Google Scholar] [CrossRef]
  27. Day, W.H.E.; Edelsbrunner, H. Efficient algorithms for agglomerative hierarchical clustering methods. J. Classif. 1984, 1, 7–24. [Google Scholar] [CrossRef]
  28. Bouguettaya, A.; Yu, Q.; Liu, X.; Zhou, X.; Song, A. Efficient agglomerative hierarchical clustering. Expert Syst. Appl. 2015, 42, 2785–2797. [Google Scholar] [CrossRef]
  29. Cressie, N. The origins of kriging. Math. Geol. 1990, 22, 239–252. [Google Scholar] [CrossRef]
  30. Aiuppa, A.; Allard, P.; D’Alessandro, W.; Michel, A.; Parello, F.; Treuil, M.; Valenza, M. Mobility and fluxes of major, minor and trace metals during basalt weathering and groundwater transport at Mt. Etna volcano (Sicily). Geochim. Cosmochim. Acta 2000, 64, 1827–1841. [Google Scholar] [CrossRef]
  31. BRGM 544E—Calcaires et Marnes Crétacés et Jurassiques de la Vallée du Rhône, du Diois et des Baronnies. Available online: https://www.rhone-mediterranee.eaufrance.fr/sites/sierm/files/content/waterbody_hydrogeological_documents/Fiches/544E.pdf (accessed on 28 November 2023).
  32. Boithias, L.; Choisy, M.; Souliyaseng, N.; Jourdren, M.; Quet, F.; Buisson, Y.; Thammahacksa, C.; Silvera, N.; Latsachack, K.; Sengtaheuanghoung, O.; et al. Hydrological Regime and Water Shortage as Drivers of the Seasonal Incidence of Diarrheal Diseases in a Tropical Montane Environment. PLoS Neglected Trop. Dis. 2016, 10, e0005195. [Google Scholar] [CrossRef]
  33. Onifade, O.; Shamsuddin, N.; Teck Ching Lai, D.; Jamil, H.; Gödeke, S.H. Importance of baseline assessments: Monitoring of Brunei River’s water quality. H2Open J. 2023, 6, 518–534. [Google Scholar] [CrossRef]
  34. Pachepsky, Y.A.; Shelton, D.R. Escherichia coli and Fecal Coliforms in Freshwater and Estuarine Sediments. Crit. Rev. Environ. Sci. Technol. 2011, 41, 1067–1110. [Google Scholar] [CrossRef]
  35. Le, H.T.; Pommier, T.; Ribolzi, O.; Soulileuth, B.; Huon, S.; Silvera, N.; Rochelle-Newall, E. Overland flow during a storm event strongly affects stream water chemistry and bacterial community structure. Aquat. Sci. 2021, 84, 7. [Google Scholar] [CrossRef]
  36. Andrade, L.; Boudou, M.; Hynds, P.; Chique, C.; Weatherill, J.; O’Dwyer, J. Spatiotemporal dynamics of Escherichia coli presence and magnitude across a national groundwater monitoring network, Republic of Ireland, 2011–2020. Sci. Total Environ. 2022, 840, 156311. [Google Scholar] [CrossRef] [PubMed]
  37. Abbas, A.; Baek, S.; Silvera, N.; Soulileuth, B.; Pachepsky, Y.; Ribolzi, O.; Boithias, L.; Cho, K.H. In-stream Escherichia coli modeling using high-temporal-resolution data with deep learning and process-based models. Hydrol. Earth Syst. Sci. 2021, 25, 6185–6202. [Google Scholar] [CrossRef]
  38. John, D.E.; Rose, J.B. Review of Factors Affecting Microbial Survival in Groundwater. Environ. Sci. Technol. 2005, 39, 7345–7356. [Google Scholar] [CrossRef]
  39. Pandey, P.K.; Kass, P.H.; Soupir, M.L.; Biswas, S.; Singh, V.P. Contamination of water resources by pathogenic bacteria. AMB Express 2014, 4, 51. [Google Scholar] [CrossRef]
Figure 1. (a) Physical setting of the study area, (b) location of the 6336 sampling points.
Resources 12 00143 g001
Figure 2. Distribution maps for parameters (a) EC (proportional to the sum of major ions), (b) E. coli (representing faecal contamination), (c) Fe (trace metal element), and (d) NO3 (sensitive to agricultural pollution). All the maps were drawn using the variogram calculated on all the data (VarTot). Units are µS cm−1 for EC, mg l−1 for major ions, nitrates and traces, and number of cells per 100 mL for bacteria.
Resources 12 00143 g002
Figure 3. Map of chemical profiles for major ions, normalised by electrical conductivity, (a) Na/EC, (b) Cl/EC, (c) HCO3/EC, (d) Ca/EC, (e) Mg/EC and (f) SO4/EC.
Resources 12 00143 g003
Figure 4. Examples of the different types of variograms obtained for major ions (a,b), electrical conductivity (c), trace metals (d), bacteriological parameters (e), and nitrates (f). For all the graphs, the black lines and symbols represent the variogram calculated using all the data (VarTot), and the red lines and symbols represent the variogram calculated using the mean of the parameter at each measurement point (VarMean).
Resources 12 00143 g004
Figure 5. North-south and east-west directional variograms for calcium ion in groundwater.
Resources 12 00143 g005
Figure 6. PCA performed on the M1 matrix (8078 observations and 13 parameters). Distribution of parameters on score plots (a) PC1-PC2 and (b) PC3-PC4.
Resources 12 00143 g006
Figure 7. Distribution of the first four factorial axes in the Auvergne-Rhône-Alpes region, (a) PC1, (b) PC2, (c) PC3 and (d) PC4.
Resources 12 00143 g007
Figure 8. Clustering of parameters obtained by unsupervised AHC on the basis of the first 5 PCs (matrix M1).
Resources 12 00143 g008
Figure 9. Clustering of parameters obtained by unsupervised AHC from PCA performed on M2 matrix (150 observations and 20 parameters).
Resources 12 00143 g009
Table 1. Inertia of factorial axes (PCA performed on matrix M1).
PC1PC2PC3PC4PC5PC6PC7
Eigenvalue4.712.781.860.910.710.620.41
Variability (%)36.2321.4114.336.965.444.733.16
Cumulative %36.2357.6471.9778.9384.3789.192.26
Table 2. Contributions of the various bacteriological and physico-chemical parameters to the first six factorial axes (Major contributions are in bold).
PC1PC2PC3PC4PC5PC6
Ent.−0.3340.657−0.579−0.084−0.254−0.104
E. coli−0.3240.655−0.594−0.092−0.241−0.099
EC0.956−0.085−0.132−0.074−0.0230.060
H+−0.6020.0800.598−0.1660.049−0.023
K0.0600.6570.3340.479−0.0050.200
Na0.3140.6760.3900.1120.133−0.377
Ca0.929−0.181−0.189−0.109−0.0190.070
Mg0.6460.1680.0060.580−0.176−0.004
Cl0.5470.6140.315−0.2970.062−0.141
SO40.7840.184−0.090−0.2250.266−0.197
HCO30.878−0.215−0.2130.049−0.0590.044
Fe−0.0840.620−0.322−0.0490.5040.458
NO30.3790.3430.494−0.350−0.4480.364
Disclaimer/Publisher’s Note: The statements, opinions and data contained in all publications are solely those of the individual author(s) and contributor(s) and not of MDPI and/or the editor(s). MDPI and/or the editor(s) disclaim responsibility for any injury to people or property resulting from any ideas, methods, instructions or products referred to in the content.

